analysis of a novel stator construction employing steel...
TRANSCRIPT

Newcastle University ePrints - eprint.ncl.ac.uk
Stannard N, Martin R, Atkinson G.
Analysis of a novel stator construction employing steel wire in place of
laminations.
IEEE Transactions on Energy Conversion, 2017
DOI: http://doi.org/10.1109/TEC.2017.2680539
Copyright:
© 2017 IEEE. Personal use of this material is permitted. Permission from IEEE must be obtained for all
other uses, in any current or future media, including reprinting/republishing this material for advertising
or promotional purposes, creating new collective works, for resale or redistribution to servers or lists, or
reuse of any copyrighted component of this work in other works.
DOI link to article:
http://doi.org/10.1109/TEC.2017.2680539
Date deposited:
22/03/2017
1
Abstract— This paper examines a novel method of
constructing large diameter generators using many layers of steel
wire in place of laminations. The stator coreback is formed by
winding thin steel wire around the outside of the armature coils
and then encapsulating the structure in epoxy. This technique
simplifies the manufacturing process by removing the
requirement to build a large support structure to carry the
laminations. The electromagnetic behavior of a wire coreback is
very different from traditional laminations, however, and
produces abrupt changes in flux density across its thickness. The
material is difficult to model using conventional FEA techniques
due to the large number of elements required to mesh the small
diameter wire. This paper examines two alternative modelling
approaches. Method 1 uses 2D FEA to model the steel wire as a
lamination oriented in the ‘wrong’ direction. Method 2 uses a
quasi-analytic approach based on detailed 3D FE analysis of a
small section of the generator to capture the flux density profile
in the airgap. The two models are benchmarked against a
prototype generator tested in the laboratory, and it is shown that
the quasi-analytical technique gives the most accurate prediction
of performance.
Index Terms— PM generator, large diameter generator,
wound-iron composite, wound coreback, wire coreback, wire
stator, wire rotor, tidal stream generator,
I. NOMENCLATURE
A Coil area, m2 p Pole pairs
B Flux density, T t Thickness, m Br Remnant flux density, T w Magnet width, m
I Phase current, A α Steinmetz exponent
L Inductance, H β Steinmetz exponent M Mass of stator, kg σ Electrical angle, rad
N Turns per armature coil µr Relative permeability
P Power, W λ Flux linkage, Wb
R Radius, m ρ Density, kg/m3
Rph Phase resistance, Ω ω Electrical frequency, rad/s
V Voltage, V Subscripts Xph Phase reactance, Ω S stator
f Frequency, Hz R rotor
c Running clearance, m a air gap k Flux reduction factor c coil
ke Steinmetz coefficient cu copper loss
kh Steinmetz coefficient i inner l Axial length of machine, m iron iron loss
n Turns per unit length, m-1 o outer
np Coils in parallel m magnet ns Coils in series mech mechanical loss
This paper was fist submitted for review on 8th August, 2016 and was
accepted for publication on 1st March 2017.
Nick Stannard is with the School of Electrical and Electronic Engineering, Newcastle University, Merz Court, Newcastle-Upon-Tyne, NE1 7RU, UK
(Email: [email protected])
Richard Martin is with Nidec SR Drives Ltd., East Park House, Otley Road, Harrogate, HG3 1PR, UK
Glynn Atkinson is with the School of Electrical and Electronic Engineering,
Newcastle University, Merz Court, Newcastle-Upon-Tyne, NE1 7RU, UK (Email: [email protected])
II. INTRODUCTION
HERE are many applications that require electrical
machines with large air gap diameters. Examples include
certain designs of wind turbine generators [1]-[4], wave
energy converter [5]-[6], tidal stream turbines employing rim
generators [7]-[12], and marine propulsion motors [13]-[14].
These machines typically employ Permanent Magnets (PM)
with a high pole numbers and thin corebacks. Manufacturing
the corebacks from traditional laminations can be costly since
the stator and rotor both require large diameter support
structures to be constructed to carry the laminations.
This paper investigates an alternative approach for
manufacturing the corebacks of large diameter machines,
which has been called Wound-Iron Composite (WIC), and
represents a significantly simpler manufacturing route than
using traditional laminations. A WIC structure is formed by
winding thin wire – made from high grade electrical steel –
directly onto the machine over multiple layers to form the
corebacks in place of laminations. The wire is encapsulated in
epoxy during construction and backed with Glass Fiber
Reinforce Plastic (GFRP) to form a strong, load bearing
component, as shown schematically in Fig. 1 and as a
prototype in Fig. 15-Fig. 18. Stator and rotor teeth are not used
in this type of construction, and this increases the effective air
gap, leading to a higher magnet mass in the machine.
However, large diameter machines generally require a larger
air gap to accommodate manufacturing tolerances and the
flexibility of the structure, and so the marginal increase in
magnet mass is less significant than for smaller machines.
For large machines in the 100kWs-MWs range a detailed
structural analysis would be required to manage the strong
magnet forces in the machine. These forces produce an
‘ovalizing’ stress in the stator which can encroach on the air
gap if the structure in not sufficiently stiff. To prevent
ovalization, carbon fiber bracing members can be embedded
within the GFRP coreback to stiffen the structure in a similar
manner to the construction of wind turbine blades, which use a
combination GFRP and carbon fiber for stiffness and cost.
The electromagnetic behavior of a WIC structure is very
different from laminations, as it produces sharp discontinuities
in flux density across the coreback (this is described in more
detail in section A). This paper will examine two methods of
modelling this behavior with the aim of finding the most
accurate method of predicting machine performance.
Analysis of a novel stator construction
employing steel wire in place of laminations Nick Stannard, Richard Martin, Glynn Atkinson
T

2
Fig. 1. Schematic of prototype WIC generator construction
A. Electromagnetic behavior of WIC
Wire cores have been used in the past for electromagnetic
applications, most notably in the early development of
transformers in the Ganz factory, Hungary (c. 1886) before
they were overtaken by the development of laminations from
the 1890s [15]. Iron wire could be used for transformer
applications because the magnetic flux travels around a closed
magnetic circuit and does not jump between wire strands,
producing an even distribution of flux within the core. If wire
cores are used for rotating machines, however, flux must pass
between strands as it enters and exits the core from the radial
direction, and this produces abrupt changes of flux density
across the coreback.
This phenomenon is depicted in Fig. 2 and Fig. 3, which
show the flux density distribution across a single pole pitch of
a PM machine. The stator has been constructed from 800
strands of 0.45mm diameter 50JN350 electrical steel wire (the
armature coils are not shown). Fig. 2 has been created with
JMAG v14 finite element software and gives a pictorial
representation of the flux density contours.
Fig. 2. Flux density in a wire coreback
Magnetic flux in the stator coreback will follow the lowest
reluctance path, and this leads to the wire strands closest to the
air gap becoming saturated. Once this occurs flux moves to the
next closest non-saturated strand, which is located further out
in the radial direction. This strand now offers the lowest
reluctance path and so will attract excess flux until it too
becomes saturated. This process continues until all the magnet
flux is taken up by a relatively small number of highly
saturated wire strands located closest to the air gap. In reality
this process is not time dependent and the redistribution of
flux within the core occurs instantaneously, leading to the
strands closest to the air gap becoming highly saturated while
the peripheral strands carry zero flux. Unlike a traditional
lamination, increasing the thickness of the coreback will not
reduce the flux density in the material but will simply add
unnecessary mass.
The flux distribution is shown graphically in Fig. 3, which
compares the flux density profile across the center of the stator
coreback of Fig. 2 with a traditional 0.35mm laminated
coreback.
Fig. 3. Comparison of flux density in the stator coreback for wire and standard laminations
Fig. 3 shows there is an abrupt discontinuity in the flux
density profile of the WIC material at approximately 9mm
across the coreback. This feature is not present for a traditional
laminated machine and occurs because the flux tends to bunch
in the lowest reluctance strands located closest to the air gap.
Due to this saturation effect, a WIC machine may have
slightly higher iron losses than a traditional PM machine,
which tend to operate at or below the knee of the saturation
curve.
B. Selection of steel wire for WIC prototype
This section describes material tests that were performed on
five different types of steel wire in order to find a suitable
material for constructing a WIC prototype. Due to the nature
of WIC corebacks described in Section A, the maximum
saturation level of the steel wire and its loss characteristics are
particularly important for producing a functional machine.
Five steel wires of different grades and diameters were
tested for their peak saturation level and loss characteristics
using a set-up similar to an Epstein frame. In addition, an
electrical steel with known properties was also tested to
benchmark the procedure. Details of the materials tested are
given in Table I.
Each test wire was wound on to a plastic bobbin, shown in
0.0
0.5
1.0
1.5
2.0
2.5
0 2 4 6 8 10 12 14
Flu
x d
ensi
ty (
T)
Distance across stator coreback (mm)
0.45mm wire Standard lamination
TABLE I
MATERIALS TESTED
Size Notes
0.30mm diameter
0.45mm diameter
0.65mm diameter 0.95mm diameter
1.45mm diameter
0.35mm lamination
Galvanized wire rope (DiN EN 10264-2 )
Bright mild steel, 1006
Galvanized mild steel, Q195 Galvanized mild steel, Q235
Galvanized mild steel, 1006
CRGO-M4
Structural coreback (GFRP)
Stator coreback (WIC)
Coil
Rotor coreback (WIC)
Magnet
1.8T
0
WIC
coreback
Magnet
Rotor coreback Flux
profile
3
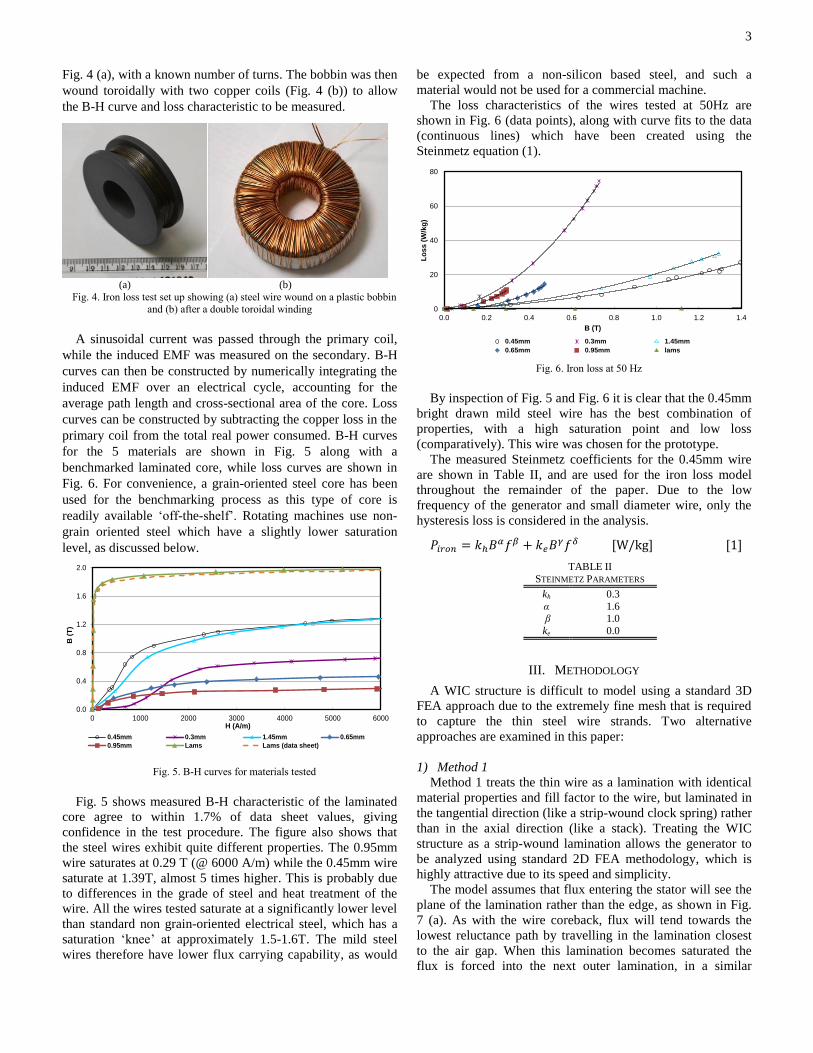
Fig. 4 (a), with a known number of turns. The bobbin was then
wound toroidally with two copper coils (Fig. 4 (b)) to allow
the B-H curve and loss characteristic to be measured.
(a) (b)
Fig. 4. Iron loss test set up showing (a) steel wire wound on a plastic bobbin and (b) after a double toroidal winding
A sinusoidal current was passed through the primary coil,
while the induced EMF was measured on the secondary. B-H
curves can then be constructed by numerically integrating the
induced EMF over an electrical cycle, accounting for the
average path length and cross-sectional area of the core. Loss
curves can be constructed by subtracting the copper loss in the
primary coil from the total real power consumed. B-H curves
for the 5 materials are shown in Fig. 5 along with a
benchmarked laminated core, while loss curves are shown in
Fig. 6. For convenience, a grain-oriented steel core has been
used for the benchmarking process as this type of core is
readily available ‘off-the-shelf’. Rotating machines use non-
grain oriented steel which have a slightly lower saturation
level, as discussed below.
Fig. 5. B-H curves for materials tested
Fig. 5 shows measured B-H characteristic of the laminated
core agree to within 1.7% of data sheet values, giving
confidence in the test procedure. The figure also shows that
the steel wires exhibit quite different properties. The 0.95mm
wire saturates at 0.29 T (@ 6000 A/m) while the 0.45mm wire
saturate at 1.39T, almost 5 times higher. This is probably due
to differences in the grade of steel and heat treatment of the
wire. All the wires tested saturate at a significantly lower level
than standard non grain-oriented electrical steel, which has a
saturation ‘knee’ at approximately 1.5-1.6T. The mild steel
wires therefore have lower flux carrying capability, as would
be expected from a non-silicon based steel, and such a
material would not be used for a commercial machine.
The loss characteristics of the wires tested at 50Hz are
shown in Fig. 6 (data points), along with curve fits to the data
(continuous lines) which have been created using the
Steinmetz equation (1).
Fig. 6. Iron loss at 50 Hz
By inspection of Fig. 5 and Fig. 6 it is clear that the 0.45mm
bright drawn mild steel wire has the best combination of
properties, with a high saturation point and low loss
(comparatively). This wire was chosen for the prototype.
The measured Steinmetz coefficients for the 0.45mm wire
are shown in Table II, and are used for the iron loss model
throughout the remainder of the paper. Due to the low
frequency of the generator and small diameter wire, only the
hysteresis loss is considered in the analysis.
𝑃𝑖𝑟𝑜𝑛 = 𝑘ℎ𝐵𝛼𝑓𝛽 + 𝑘𝑒𝐵
𝛾𝑓𝛿 [W/kg] [1]
III. METHODOLOGY
A WIC structure is difficult to model using a standard 3D
FEA approach due to the extremely fine mesh that is required
to capture the thin steel wire strands. Two alternative
approaches are examined in this paper:
1) Method 1
Method 1 treats the thin wire as a lamination with identical
material properties and fill factor to the wire, but laminated in
the tangential direction (like a strip-wound clock spring) rather
than in the axial direction (like a stack). Treating the WIC
structure as a strip-wound lamination allows the generator to
be analyzed using standard 2D FEA methodology, which is
highly attractive due to its speed and simplicity.
The model assumes that flux entering the stator will see the
plane of the lamination rather than the edge, as shown in Fig.
7 (a). As with the wire coreback, flux will tend towards the
lowest reluctance path by travelling in the lamination closest
to the air gap. When this lamination becomes saturated the
flux is forced into the next outer lamination, in a similar
0.0
0.4
0.8
1.2
1.6
2.0
0 1000 2000 3000 4000 5000 6000
B (
T)
H (A/m)
0.45mm 0.3mm 1.45mm 0.65mm
0.95mm Lams Lams (data sheet)
0
20
40
60
80
0.0 0.2 0.4 0.6 0.8 1.0 1.2 1.4
Lo
ss (
W/k
g)
B (T)
0.45mm 0.3mm 1.45mm
0.65mm 0.95mm lams
TABLE II
STEINMETZ PARAMETERS
kh 0.3
α β
ke
1.6 1.0
0.0
4
fashion to the wire coreback. This phenomenon also occurs
near the end-windings of large machines where stray flux can
penetrate a lamination stack from the axial direction, and can
therefore be modelled with most FEA packages.
Method 1 tends to underestimate the level of saturation in
the steel. Any magnetic flux entering a lamination from the
planar direction will set up an eddy current in lamination that
is not present in the wire, and which tends to shield the
lamination from high flux densities. In addition, the wire
strands can axially concentrate flux from the magnet (see Fig.
7 (b)) in a way that is not available to the strip-wound
lamination. These effects tend to increase the level of
saturation in the wire, as depicted in Fig. 8-9.
Eddy current
in laminationMagnet
flux
Rotor coreback
Magnet
Rotor coreback
Magnet
Steel wireFlux concentrated
from axial direction
Rotation axis
Radial direction
Laminations
(a) (b)
Fig. 7. (a) Method 1 model - flux enter the planar lamination, setting up an eddy current; (b) WIC structure showing axial collection of flux which tends
to increase the saturation of the wire
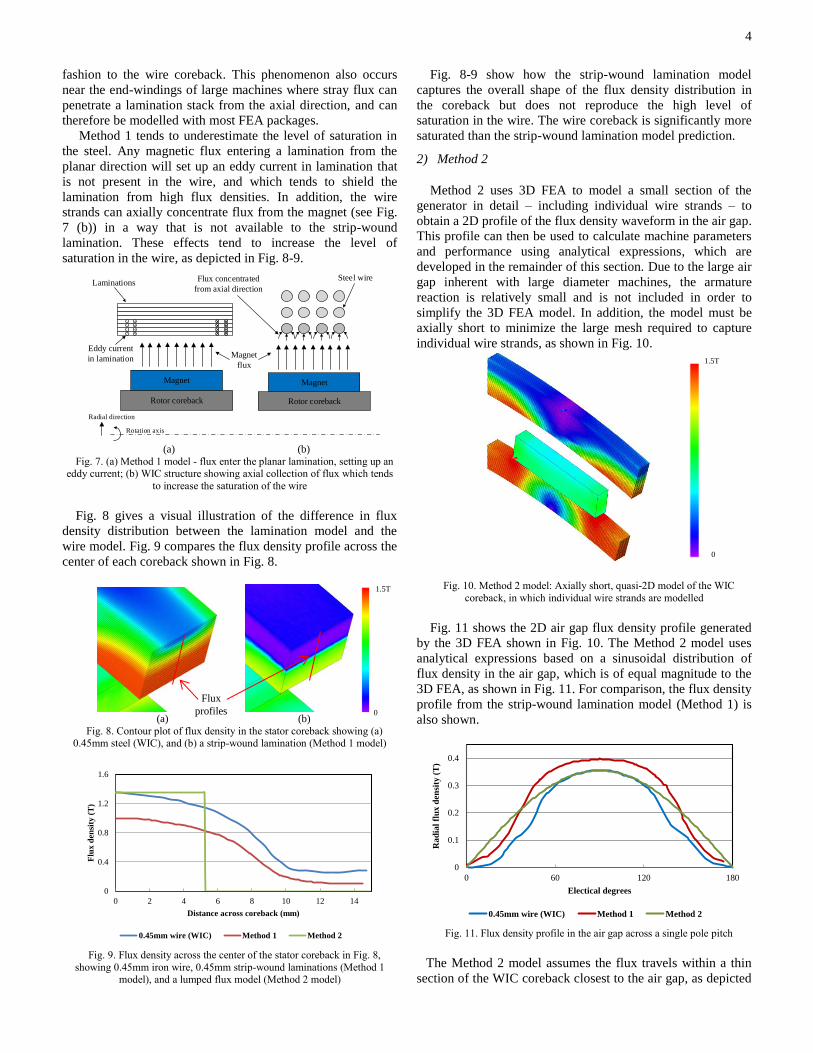
Fig. 8 gives a visual illustration of the difference in flux
density distribution between the lamination model and the
wire model. Fig. 9 compares the flux density profile across the
center of each coreback shown in Fig. 8.
(a) (b)
Fig. 8. Contour plot of flux density in the stator coreback showing (a) 0.45mm steel (WIC), and (b) a strip-wound lamination (Method 1 model)
Fig. 9. Flux density across the center of the stator coreback in Fig. 8,
showing 0.45mm iron wire, 0.45mm strip-wound laminations (Method 1 model), and a lumped flux model (Method 2 model)
Fig. 8-9 show how the strip-wound lamination model
captures the overall shape of the flux density distribution in
the coreback but does not reproduce the high level of
saturation in the wire. The wire coreback is significantly more
saturated than the strip-wound lamination model prediction.
2) Method 2
Method 2 uses 3D FEA to model a small section of the
generator in detail – including individual wire strands – to
obtain a 2D profile of the flux density waveform in the air gap.
This profile can then be used to calculate machine parameters
and performance using analytical expressions, which are
developed in the remainder of this section. Due to the large air
gap inherent with large diameter machines, the armature
reaction is relatively small and is not included in order to
simplify the 3D FEA model. In addition, the model must be
axially short to minimize the large mesh required to capture
individual wire strands, as shown in Fig. 10.
Fig. 10. Method 2 model: Axially short, quasi-2D model of the WIC
coreback, in which individual wire strands are modelled
Fig. 11 shows the 2D air gap flux density profile generated
by the 3D FEA shown in Fig. 10. The Method 2 model uses
analytical expressions based on a sinusoidal distribution of
flux density in the air gap, which is of equal magnitude to the
3D FEA, as shown in Fig. 11. For comparison, the flux density
profile from the strip-wound lamination model (Method 1) is
also shown.
Fig. 11. Flux density profile in the air gap across a single pole pitch
The Method 2 model assumes the flux travels within a thin
section of the WIC coreback closest to the air gap, as depicted
0
0.4
0.8
1.2
1.6
0 2 4 6 8 10 12 14
Flu
x d
ensi
ty (
T)
Distance across coreback (mm)
0.45mm wire (WIC) Method 1 Method 2
0
0.1
0.2
0.3
0.4
0 60 120 180
Ra
dia
l fl
ux d
ensi
ty (
T)
Electical degrees
0.45mm wire (WIC) Method 1 Method 2
1.5T
0
Flux
profiles
1.5T
0

5
in Fig 12. In these regions it is assumed that the wire is
uniformly saturated at the peak level calculated by the detailed
FEA model. This flux density distribution is depicted in Fig. 9.
tS
Rotor
Effective stator thickness
Coil
Magnet
tc
tm
c
tR
Stator
Flux carried in narrow
region near air gap
Fig. 12. Method 2 lumped flux model
It is clear that not all the flux emerging from the magnets
will find its way into the stator coreback, and a global flux
reduction factor, k, is used to account for the leakage. k is
computed by comparing the peak air gap flux density from the
detailed 3D FEA model with an idealized magnetic circuit that
assumes no leakage. The value of k can then be used to
calculate the iron loss in the generator (see Section II.2). For
an idealized magnetic circuit with no leakage, the peak air gap
flux density is given by:
�̂�𝑎 =
𝐵𝑟𝑡𝑚𝜇𝑟−𝑚𝑎𝑔
−1
2𝜎𝑚(
𝑅𝑜𝐵𝑠𝜇𝑟−𝑠𝑡𝑎𝑡
+𝑅𝑖𝐵𝑅𝜇𝑟−𝑟𝑜𝑡
)
𝑡𝑚𝜇𝑟−𝑚𝑎𝑔
+(𝑡𝑐+𝑐) [2]
where the flux density and permeability of the rotor and stator
corebacks are found from FEA.
The air gap flux density distribution around the machine is
then given by:
𝐵𝑎(𝜃) = 𝑘4�̂�𝑎
𝜋𝑠𝑖𝑛 (
𝜎𝑚
2) 𝑠𝑖𝑛(𝑝𝜃) [3]
The flux reduction factor, k, is calculated to ensure the peak
flux density in the air gap of the analytical model equals the
value obtained from the detailed 3D FEA model. For the
prototype machine, k was calculated to be 0.72.
3) Back EMF calculation
The flux density profile across an armature coil is shown in
Fig. 13. The turns distribution of the coil linking the magnet
flux is given by:
𝑁(𝜃) =𝑁(𝜃−
𝜎𝑜2)
𝜎𝑜2−𝜎𝑖2
[4]
The total flux linking the coil can then be found from:
�̂�𝑡𝑜𝑡𝑎𝑙 = (�̂�𝑏𝑜𝑟𝑒 + �̂�𝑐𝑜𝑖𝑙) [5]
where:
�̂�𝑏𝑜𝑟𝑒 =2𝑅𝑁𝑙�̂�𝐹𝐸𝐴
𝑝𝑠𝑖𝑛 (𝑝
𝜎𝑖
2) [6]
�̂�𝑐𝑜𝑖𝑙 =𝑅𝑁𝑙�̂�𝐹𝐸𝐴𝜎𝑜2−𝜎𝑖2
[1
𝑝(𝜎𝑖2−𝜎𝑜2) 𝑠𝑖𝑛 (𝑝
𝜎𝑖2) +
𝜎𝑖2
8𝑐𝑜𝑠 (𝑝
𝜎𝑖2) −
𝜎𝑜2
8𝑐𝑜𝑠 (𝑝
𝜎02)]
[7]
The back EMF can then be calculated from:
𝐸𝑀𝐹𝑝ℎ𝑎𝑠𝑒(𝑡) = 2𝜋𝑓𝑛𝑠�̂�𝑡𝑜𝑡𝑎𝑙𝑐𝑜𝑠(𝜔𝑡) [8]
B
σi/2
σo/2
θ
θ
NTurns distribution
Coil
Flux density
Fig 13. Flux density across coil
The predictions of back EMF from the two models are
compared to measurements taken on a laboratory prototype in
Fig. 19.
4) Iron loss models
The two modelling approaches treat the iron loss in the
machine in different ways. The strip-wound lamination model
(Method 1) calculates iron loss within the FEA package by
using the Steinmetz loss coefficients measured in Section II.B.
This is simple to implement and allows for an easy calculation
but does not capture the high saturation inside the steel wire.
The detailed 3D FEA model (Method 2) does capture the
high saturation inside the coreback. The modelling approach
assumes the flux travels in a small cross-sectional area of the
coreback close to the air gap, as shown schematically in Fig
12. The stator is therefore assumed to have a small effective
radial thickness, and this increases the flux density in the
material. In addition, the model assumes all the iron loss
occurs in the stator rather than the rotor and that, due to the
small wire size, there are no eddy currents present.
The radial thickness of the stator coreback is calculated by
assuming conservation of flux around the magnetic circuit and
applying the flux reduction factor obtained in Section II.1.
Since the flux from the magnet splits in two across coreback,
the effective stator thickness can be calculated by:
𝑡𝑠 =𝑘�̂�𝑎𝑤
2�̂�𝑠 [9]
where the peak value of flux density in the stator coreback, B̂s, is found from FEA. For the prototype machine, B̂s = 1.335T.
The total iron loss in the stator coreback can be calculated
using an amended form of the Steinmetz equation:
𝑃𝑖𝑟𝑜𝑛 = 𝑀𝑠𝑘ℎ𝑓�̂�𝑠𝛼 [10]
where the mass of saturated stator corback:
𝑀𝑠 = 2𝜋𝑅𝑠𝑡𝑠𝑙𝜌𝑠 [11]

6
The two loss models are compared to measurements taken
on the prototype machine in Fig. 22.
5) Inductance and Resistance
A reasonable estimation of phase inductance can be made
by considering the armature coil to be sitting between two
infinitely permeable iron boundaries, as shown in Fig. 14 (a).
The flux density generated at the coil center, Ba, is assumed to
be distributed in a linear fashion across the coil turns, as
shown in Fig. 14 (b). A flux correction factor can then be
included to account for leakage.
Stator
Rotor
g
Rcσi
Rcσo
(a)
Ө
σi/2
Ba
σo/2
B
(b)
Fig 14. Inductance model showing (a) schematic of the coil between two iron boundaries and (b) the flux distribution across the coil.
The air gap flux distribution is given by:
𝐵𝑎(𝜃) = �̂�𝑎 (𝜃−
𝜎02
𝜎𝑖2−𝜎02
) [12]
where the peak air gap flux is given by:
�̂�𝑎 =𝜇0𝑁𝑖
𝑔 [13]
Area across the coil distribution is given by:
𝐴(𝜃) = 𝑅𝑐𝜃𝑙 [14]
Turns distribution is given by:
𝑛 =𝑁
𝜎𝑜2−𝜎𝑖2
[15]
Flux linkage across the coil can be evaluated by:
𝜆𝑐𝑜𝑖𝑙 = ∫ 𝐵𝑎(𝜃)𝐴(𝜃)𝑛𝑑𝜃𝜎𝑜
2⁄𝜎𝑖
2⁄ [16]
𝐿𝑐𝑜𝑖𝑙 =𝜆
𝑖= 𝑘𝐿
𝜇0𝑁2𝑅𝑐𝑙
𝑔(𝜎𝑜2−𝜎𝑖2)2 (
𝜎03
48+
𝜎𝑖3
24−
𝜎𝑖2𝜎𝑜
16) [17]
where kL is the flux increase factor to account for leakage
effects and is assumed to be 1.2 [16]. The phase inductance
can be calculated from:
𝐿𝑝ℎ𝑎𝑠𝑒 = 𝐿𝑐𝑜𝑖𝑙𝑛𝑠
𝑛𝑝 [18]
The inductance calculation assumes there is no difference
between the d and q axis inductances, and in practice this is a
good approximation since the q-axis flux travels through the
same saturated wire strands as the d-axis flux. A comparison
between measured and calculated values from the two models
is shown in Table III. Phase resistance can be calculated by
considering the coil geometry and fill factor and is not
discussed in detail here.
6) Terminal voltage, power and efficiency
The Method 2 model assumes power is delivered to a
resistive load at unity power factor. Given this condition, the
terminal voltage, power and efficiency can be calculated by:
𝑉 = √(𝐸𝑀𝐹)2 − (𝐼𝑋𝑝ℎ)2− 𝐼𝑅𝑝ℎ [19]
𝑃 = 3𝑉𝐼 [20]
𝜂 =𝑃𝑜𝑢𝑡
𝑃𝑜𝑢𝑡+𝑃𝑐𝑢+𝑃𝑖𝑟𝑜𝑛+𝑃𝑚𝑒𝑐ℎ [21]
IV. PROTOTYPE GENERATOR
A list of parameters for the prototype generator is given in
Table IV; construction of the prototype WIC generator is
depicted in Fig. 16-Fig. 18. The armature coils were held in a
former (Fig. 16 (b)) and then wound with 0.45mm steel wire
around the outer side of the coils (Fig. 18). An epoxy resin
was painted onto the wire as it was laid down. Glass fiber
matting was then added to build up the bulk material around
the outside of the wire to form the full load-bearing composite
structure, which can be seen in Fig. 17. The generator is
shown on the test rig in Fig. 18.
TABLE III
COMPARISON OF PHASE RESISTANCE AND INDUCTANCE
METHOD 1 METHOD 2 MEASURED
Inductance, d-axis (mH) 32.7 13.5 15.5
Inductance, q-axis (mH)
Phase resistance (Ω)
33.6 5.1
13.5 5.1
15.9 5.6

7
(a) (b)
Fig. 15. Generator construction showing (a) magnets being place on the
rotor, and (b) stator coils on a former before winding
Fig 16. Coreback being formed by winding steel wire with epoxy
Fig. 17. Completed stator showing wire coreback
Fig. 18. Generator on test bed
V. RESULTS
The generator was tested in the laboratory, feeding a 3-
phase resistive load bank at unity power factor. Power output
and torque were measured using a PPA4500 3-phase power
analyzer and Magtrol 100Nm torque transducer. Voltage
waveforms were captured using 4 channel TDS 2024
oscilloscope.
A comparison between the measured back EMF and the
predictions from the two models is shown in Fig. 19.
Fig. 19. Phase back EMF at 75 rpm
The generator was tested at three nominal operating speeds:
84rpm, 133rpm and 214rpm. Predictions of power output and
voltage are compared to measured values in Fig. 20 and Fig.
21.
Fig. 20. Power output
-150
-100
-50
0
50
100
150
0 0.01 0.02 0.03 0.04 0.05 0.06
Vo
lta
ge(
V)
Time (s)
Measured Method 1 Method 2
0
500
1000
1500
2000
2500
3000
0.0 1.0 2.0 3.0 4.0
Ou
tpu
t p
ow
er (
W)
Phase current (A)
214 rpm, measured 133 rpm, measured 84 rpm, measured
214 rpm, Method 1 133 rpm, Method 1 84 rpm, Method 1
214 rpm, Method 2 133 rpm, Method 2 84 rpm, Method 2
TABLE IV
MACHINE PARAMETERS
Power (W)
Nominal speed (rpm) Pole number
2000
200 24
Coil number
Nominal frequency (Hz) Magnet grade
Magnet axial length (mm)
Magnet tangential width (mm) Magnet thickness (mm)
Magnet pitch/pole pitch ratio
Rotor OD (mm) Stator ID (mm)
Running clearance (mm)
Stator coreback thickness (mm) Stator coreback fill factor
Coil height (mm)
Coil width (mm) Copper wire diameter
Number of turns
Armature fill factor Machine OD (mm)
Machine axial length (mm)
Air gap diameter (mm)
18
50 NdFeB N35
100
40 10
0.62
514 520
3.0
15.0 0.70
8.0
25.0 0.75
230
0.68 635
154
517
Wound-iron
composite structure
Stator coreback
Steel wire on spool

8
Fig. 21. Terminal voltage
Fig. 22 compares predictions of no-load iron loss with
measurements taken across the speed range. A dummy rotor
was used to separate the bearing and windage loss from the
iron loss. Only the iron loss is present in Fig. 22.
Fig. 22. No load iron loss
A comparison between measured and predicted values of
efficiency across the power range is shown in Fig. 23. The
measured mechanical loss was added to the model predictions
of copper and iron loss in order to create a meaningful
comparison.
Fig. 23. Generator efficiency at 214rpm
VI. DISCUSSION
It is clear from Fig. 19 that modelling a WIC structure using
2D FEA – as a strip-wound lamination (Method 1) – is less
accurate than using an analytical approach based on a 3D FE
analysis of a small section of the generator (Method 2). The
difference in accuracy between the two models can be seen
clearly in the predictions of terminal voltage and output power
across the speed range, Fig. 20 and Fig. 21. At rated speed the
Method 1 model over estimates terminal voltage by 23% and
the power by 32% compared to an error of 3.5% and 3.6%
respectively for the Method 2 model.
These over-estimations arise because the strip-wound
lamination model (Method 1) assumes the stator coreback is
less saturated than it actually is. This leads to a prediction of
higher air gap flux density (as shown in Fig. 11) and a higher
resulting back EMF. Indeed, when the measured back EMF is
compared to prediction in Fig. 19, the Method 1 model
overestimates the peak back EMF by 11.4%, compared to an
error of only 2.6% for Method 2.
Fig. 22 shows the Method 2 model gives an accurate
prediction of iron loss in the wire coreback with an error of
1.1% at rated speed, while the Method 1 model underestimates
the loss by 9.0%. The flux density profiles across the stator
coreback for the two models are shown in Fig. 9. The Method
2 model assumes the coreback has a small effective radial
thickness which is highly saturated, while the simple 2D FEA
(Method 1) assumes the flux is more evenly distributed across
the full width of the coreback but at a lower saturation level.
Although both models give reasonably accurate predictions of
iron loss through the speed range, Method 2 is likely to be
more accurate if a high grade electrical steel is used in place of
mild steel. Fig. 5 shows that the B-H characteristic of
electrical steel has a much sharper ‘knee’ than mild steel and
this leads to a sharper discontinuity of flux density across the
coreback, as shown in Fig. 2 and Fig. 3. Method 2 assumes
that all the flux is carried in a narrow band of saturated wire
strands close to the air gap, and this is more likely to be
accurate if an electrical steel is used.
The efficiency of the generator is shown at rated speed in
Fig. 23. Since the Method 1 model underestimates the loss in
the generator, it also overestimates its efficiency. The
efficiency at the rated power point was measured at 82.0%,
compared to a predicted efficiency of 84.4% from the Method
1 model and 81.8% from the Method 2 model. Method 1 is
less accurate because it does not capture the highly saturated
nature of the stator coreback, as described above. Although the
measured efficiency of 82.0% is not particularly high for a PM
machine, the total iron loss expressed as a percentage of the
output power (at max power) is 6.4%. This value could be
reduced significantly if an electrical steel were used in place
of mild steel for the construction of the WIC coreback.
However, the measured iron loss is not excessively high given
the stator is constructed from mild steel, and this is testimony
to the careful testing procedure and wire selection outlined in
section II.B.
VII. CONCLUSION
This paper has examined two alternative approaches for
modelling wound-iron composite structures: a 2D FEA model
0
50
100
150
200
250
0.0 1.0 2.0 3.0 4.0
Ter
min
al
vo
lta
ge
(V)
Phase current (A)
214 rpm, measured 133 rpm, measured 84 rpm, measured
214 rpm, Method 1 133 rpm, Method 1 84 rpm, Method 1
214 rpm, Method 2 133 rpm, Method 2 84 rpm, Method 2
0
40
80
120
160
200
70 100 130 160 190 220
Iro
n l
oss
(W
)
Speed (rpm)
Measured Method 1 Method 2
0.60
0.65
0.70
0.75
0.80
0.85
0.90
400 800 1200 1600 2000
Eff
icic
ency
Power (W)
Measured Method 1 Method 2
9
which treats the wire as a strip-wound lamination (Method 1),
and a quasi-analytical model based on modelling a small
section of the generator in detail (Method 2). It is clear from
the test data that the Method 2 approach provides a much more
accurate prediction of performance. Although this model is
more accurate it is also significantly more time consuming,
since a small section of the wire coreback must be simulated
in detail using 3D FEA for each design.
An interesting further area of study would replace the mild
steel wire with an electrical steel wire. The two modelling
approaches could then be benchmarked against a prototype
that was much closer to a commercial machine.
REFERENCES
[1] Zhaoqiang Zhang et al -“Efficiency calculation and improvement of
a large-diameter ironless permanent magnet generator” - 15th International Conference on Electrical Machines and Systems
(ICEMS), 21-24 Oct. 2012.
[2] R. Scott Semken, Charles Nutakor, Aki Mikkola, Yulia Alexandrova - “Lightweight stator structure for a large diameter
direct-drive permanent magnet synchronous generator intended for
wind turbines” - IET Renew. Power Gener., 2015, Vol. 9, Iss. 7,
pp. 711–719 [3] Z. Zhang, A. Matveev, R. Nilssen, A. Nysveen - “Large-diameter
ironless permanent magnet generator for offshore wind power
application” - ICEM, 2-5 Sept. 2012, Marseille, France [4] E. Spooner, P. Gordon, J.R. Bumby, C.D. French “Lightweight
ironless-stator PM generators for direct-drive wind turbines” IEE
Proceedings - Electric Power Applications, Jan. 2005 Volume:152, Issue: 1
[5] David G. Dorrell, Sze SongNgu, and C. Cossar “Comparison of
High Pole Number Ultra-Low Speed Generator Designs Using Slotted and Air-Gap Windings” - IEEE TRANSACTIONS ON
MAGNETICS, VOL. 48, NO. 11, NOVEMBER 2012 [6] Sze Song Ngu, David G. Dorrell, C. Cossar - “Design and Operation
of Very Slow-Speed Generators for a Bristol Cylinder Sea Wave Generating Device” - 2012 IEEE Energy Conversion Congress and
Exposition, 15-20 Sept. 2012. p946 - 953
[7] Song Xu, Haifeng Wang, Guobiao Gu - “Analysis of temperature distribution for the electric generator in rim-driven marine current power
system”, International Conference on Electrical Machines and Systems
(ICEMS), 26-29 Oct. 2013, Busan [8] Sofiane Djebarri et al - “Rough design of a Double-Stator Axial Flux
Permanent Magnet generator for a rim-driven Marine Current Turbine” -
IEEE International Symposium on Industrial Electronics (ISIE), 28-31 May 2012, Hangzhou, China
[9] Sofiane Djebarri, et al - “Comparison of direct-drive PM generators for
tidal turbines” - International Power Electronics and Application Conference and Exposition, Shanghai, 5-8 Nov. 2014
[10] Zhibin Zhou et al - “An Up-to-Date Review of Large Marine Tidal
Current Turbine Technologies” - International Power Electronics and Application Conference and Exposition, Shanghai, China, 5-8 Nov.
2014
[11] OpenHydro Ltd. - http://www.openhydro.com (June, 2016) [12] SeaUrchin Turbine manufactured by Elemental Energy Technologies
Ltd (EET) - http://makoturbines.com/ (June, 2016)
[13] Shu Hau Lai, Suleiman Abu Sharkh - “Structurally Integrated
Slotless PM Brushless Motor with Spiral Wound Laminations for
Marine Thrusters” - Power Electronics, Machines and Drives Conference, Dublin, Ireland, 4-6 April 2006.
[14] Amir Hassannia Ahmad Darabi - “Design and Performance
Analysis of Superconducting Rim-Driven Synchronous Motors for Marine Propulsion”, IEEE Trans on Applied Superconductivity,
Vol: 24, Issue: 1, Feb. 2014
[15] F. J. Uppenborn - “History of the Transformer ” London - E. & F. N. Spon. pp. 35–41.
[16] J.R. Bumby and R. Martin, “Axial-flux permanent-magnet air-
cored generator for small-scale wind turbines”, IEE Proc.-Electr. Power Appl., Vol. 152, No. 5, September 2005
Dr. Nick Stannard received an M.Eng. degree in
general Engineering from Cambridge University, UK in 2000, followed by a Ph.D in electrical Engineering
from Durham University in 2008. He has been a Senior
Research Associate at Newcastle University since 2012.
Dr. Richard Martin received the M.Eng. degree in
general engineering and the Ph.D. degree in electrical
engineering from the University of Durham, Durham, U.K., in 2002 and 2007, respectively. He was a
Research Associate with Newcastle University,
Newcastle, U.K. from 2012 to 2016 and is now an Electromagnetic Design Engineer with Nidec SR
Drives Ltd., Harrogate, U.K.
Dr. Glynn J. Atkinson received the M.Eng. and Eng.D
degrees in electrical and electronic engineering from
Newcastle University, U.K in 2001 and 2007, respectively. He is now a Senior Lecturer within the
Electrical Power Research group, leading research into
3-D machine topologies using soft magnetic composites with applications in the automotive and
high volume manufacturing sectors.