analysis of anionic contribution to total dissolved solids … · analysis of anionic contribution...
TRANSCRIPT

Analysis of Anionic Contribution to Total Dissolved Solids in the Lower San Diego River
______________________
A Thesis
Presented to the
Faculty of
San Diego State University
_____________________
In Partial Fulfillment
of the Requirements for the Degree
Bachelor of Science
in
Geological Sciences
_____________________
by
Janae Fried
Advisor: Kathryn Thorbjarnarson
Fall 2015

2
Table of Contents
1 INTRODUCTION .................................................................................................................. 4
1.1 Setting............................................................................................................................... 4 1.2 Background ...................................................................................................................... 5 1.3 Current Research .............................................................................................................. 7
2 Methods................................................................................................................................... 9 2.1 Field Methods ................................................................................................................... 9
2.1.1 YSI Electronic Sonde ................................................................................................ 9 2.1.2 Sample Collection and Storage ................................................................................. 9 2.1.3 Nutrient Testing ........................................................................................................ 9
2.2 Laboratory Methods ....................................................................................................... 10
2.2.1 Buchner Vacuum Filtration Method ....................................................................... 10 2.2.2 Alkalinity Titrations – EPA Standard Methods 2320 ............................................. 10 2.2.3 Sulfate Turbidimetric Method – EPA Method 9038............................................... 10
2.2.4 Potentiometric Determination of Chloride – EPA Method 9212 ............................ 10 2.3 Data Analysis Methods .................................................................................................. 11
2.3.1 Alkalinity ................................................................................................................ 11 2.3.2 Sulfate ..................................................................................................................... 11 2.3.3 Chloride................................................................................................................... 12
3 Results and Discussion ......................................................................................................... 12 3.1 Specific Conductance and Total Dissolved Solids ......................................................... 12
3.2 pH and Alkalinity ........................................................................................................... 14 3.3 Chloride .......................................................................................................................... 15 3.4 Bicarbonate..................................................................................................................... 16
3.5 Sulfate............................................................................................................................. 17
3.6 Correlations .................................................................................................................... 18 3.7 Longitudinal Trends ....................................................................................................... 21
3.7.1 Specific Conductance.............................................................................................. 21
3.7.2 Sulfate ..................................................................................................................... 22 4 Conclusions ........................................................................................................................... 23
4.1 Research Findings .......................................................................................................... 23
4.2 Future Study ................................................................................................................... 23 5 Appendices ............................................................................................................................ 25
5.1 Appendix A – Table of All Laboratory Results, Sorted by Collection Date. ................ 25 5.2 Appendix B – Table of All Field Results, Sorted by Collection Date ........................... 33 5.3 Appendix C - Anion correlation With Specific Conductance (All Sites) ...................... 41
6 References ............................................................................................................................. 42
Tables and Figures
Figure 1. Year 2006 SanGIS map showing land usage in the San Diego River Watershed. ....... 4 Table 1. Water Quality Objectives for the Lower San Diego Hydrologic Unit from the Water
Quality Control Plan for the San Diego Basin ....................................................................... 5

3
Figure 2. Geologic map of the San Diego River Watershed with sites evaluated for specific
conductivity by TetraTech. ..................................................................................................... 6 Figure 3. Locations of sample sites. ............................................................................................. 8 Figure 4. Specific conductance in the Lower San Diego River .................................................... 13
Figure 5. Rainfall data from two localities in San Diego and the average of the two over the nine-
month study period. .............................................................................................................. 14 Figure 6. pH of sites in the Lower San Diego River that show a change of more than 0.40. ....... 15 Figure 7. Alkalinity (as mg/L CaCO3) concentrations in the Lower San Diego River. ............... 15 Figure 8. Chloride in the Lower San Diego River ........................................................................ 16
Figure 9. Bicarbonate in the Lower San Diego River. .................................................................. 17 Figure 10. Sulfate in the Lower San Diego River ......................................................................... 18 Figure 11. Anion correlation with specific conductance (main stem) .......................................... 19 Figure 12. Correlation of chloride with sulfate. ............................................................................ 20
Figure 13. Correlation between dissolved oxygen and sulfate. .................................................... 21 Figure 14. Specific conductance along the main stem of the Lower San Diego River. ............... 22
Figure 15. Sulfate concentrations along the main stem of the Lower San Diego River. .............. 22
ABSTRACT
The Lower San Diego River has been severely impacted by several anthropogenic
sources. Specific water quality objectives are set in the San Diego Basin Plan for this reach of
the river and many of these objectives are not being met. Research included in this report will
test 17 sites in the Lower San Diego River Watershed for sulfate, bicarbonate, carbonate, and
chloride ion concentrations and analyze their relationship to the observed specific conductivity
values over a nine-month period. It was found that chloride is the dominant ion in the region and
exceeds the water quality objectives set by the water quality control board at most sites over the
study period. This report provides details not previously known on the contribution of anions to
the high conductivity observed in the river. Spatial and temporal trends are identified.
Correlation equations are obtained to estimate chloride, sulfate, or bicarbonate from specific
conductance. The data in this report also lends insight into potentially natural occurring
background levels of ions and locations of possible concentrated inputs into the river.
4
1 INTRODUCTION
1.1 SETTING
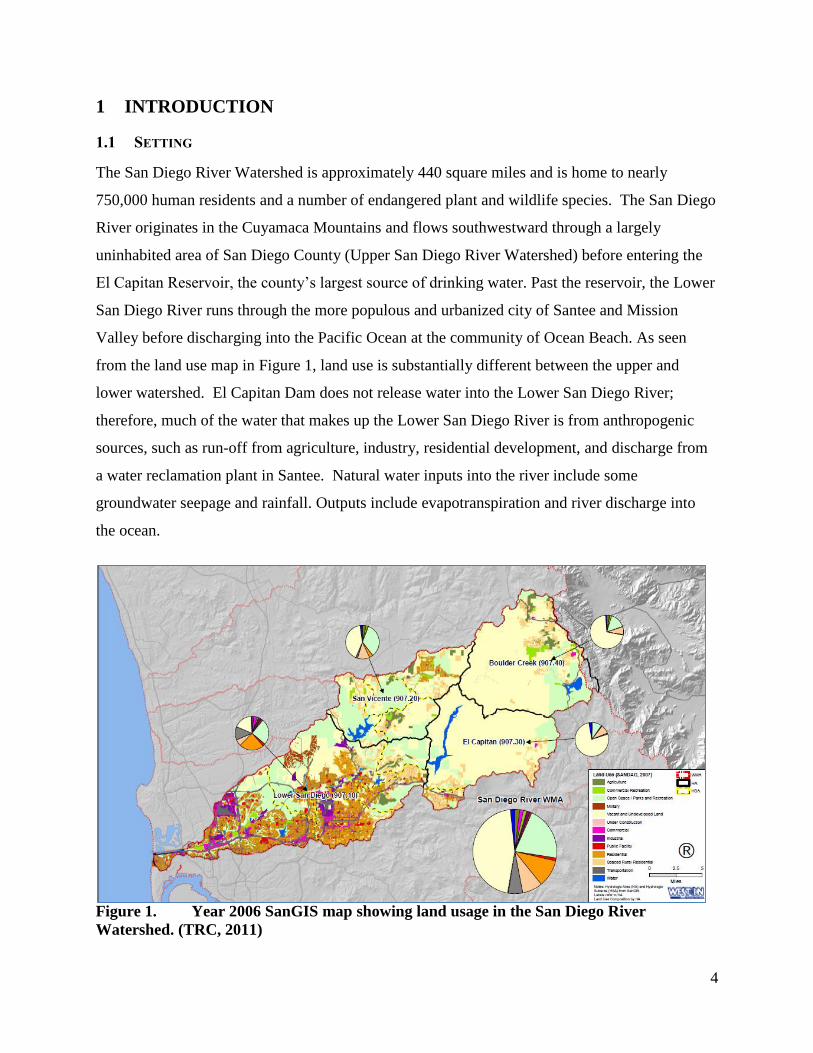
The San Diego River Watershed is approximately 440 square miles and is home to nearly
750,000 human residents and a number of endangered plant and wildlife species. The San Diego
River originates in the Cuyamaca Mountains and flows southwestward through a largely
uninhabited area of San Diego County (Upper San Diego River Watershed) before entering the
El Capitan Reservoir, the county’s largest source of drinking water. Past the reservoir, the Lower
San Diego River runs through the more populous and urbanized city of Santee and Mission
Valley before discharging into the Pacific Ocean at the community of Ocean Beach. As seen
from the land use map in Figure 1, land use is substantially different between the upper and
lower watershed. El Capitan Dam does not release water into the Lower San Diego River;
therefore, much of the water that makes up the Lower San Diego River is from anthropogenic
sources, such as run-off from agriculture, industry, residential development, and discharge from
a water reclamation plant in Santee. Natural water inputs into the river include some
groundwater seepage and rainfall. Outputs include evapotranspiration and river discharge into
the ocean.
Figure 1. Year 2006 SanGIS map showing land usage in the San Diego River
Watershed. (TRC, 2011)

5
1.2 BACKGROUND
The Lower San Diego River has been rated poorly in several water-quality investigations. In
2011, the San Diego Water Quality Control Board published the The Water Quality Control Plan
for the San Diego Basin (Basin Plan) which designates beneficial uses for water bodies in the
San Diego Region, including the Lower San Diego Hydrologic Area (HA), and establishes water
quality objectives (WQOs) and implementation plans to protect those uses. Table 1 highlights
WQOs concerning the current research area. In the Basin Plan, they use a conversion factor of
0.64 to convert the easily found value for specific conductance to the more difficult to analyze
value for total dissolved solids (TDS). It is important to note that these limits are to protect
aquatic life within the waters, not because the river is a drinking water source. Also in the basin
plan, it is stated that pH for inland surface waters should be between 6.5 and 8.5, and should not
vary more than 0.5. (California Regional Water Quality Control Board San Diego Region,
2011)
Table 1. Water Quality Objectives for the Lower San Diego Hydrologic Unit from the
Water Quality Control Plan for the San Diego Basin
Hydrologic Unit
Basin Number
TDS
(mg/l)
Sulfate
(mg/l)
Chloride
(mg/l)
Lower San Diego HA 907.10 1000 500 400
Mission San Diego HSA 907.11 1500 500 400
Santee HSA 907.12 1500 500 400
San Vicente HA 907.20 300 50 65
El Capitan HA 907.3 300 50 65
Boulder Creek HA 907.4 300 50 65
Secondary Drinking Water
Standard
Not applicable 500-1000 250-500 500
6
The Surface Water Ambient Monitoring Program (SWAMP) is tasked with assessing water
quality in all of California’s surface waters. The California Environmental Data Exchange
Network (CEDEN) shares information from many water-quality monitoring groups about
California’s water bodies, including streams, lakes, rivers, and the coastal ocean. Databases
from both SWAMP and CEDEN include a few spread-out locations within the San Diego River
watershed in which specific ion concentrations are provided. The few reported concentrations of
chloride, TDS, and sulfate in sites along the Lower San Diego River and its tributaries are all at
or above the WQO set by the Basin Plan.
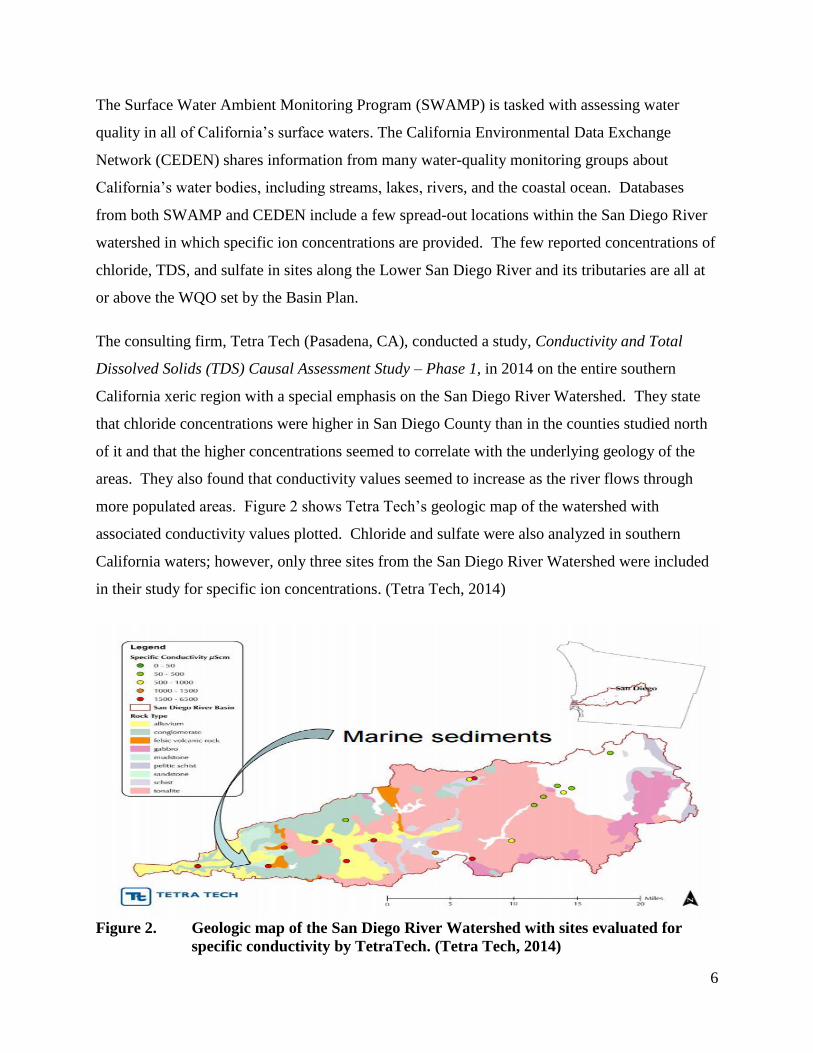
The consulting firm, Tetra Tech (Pasadena, CA), conducted a study, Conductivity and Total
Dissolved Solids (TDS) Causal Assessment Study – Phase 1, in 2014 on the entire southern
California xeric region with a special emphasis on the San Diego River Watershed. They state
that chloride concentrations were higher in San Diego County than in the counties studied north
of it and that the higher concentrations seemed to correlate with the underlying geology of the
areas. They also found that conductivity values seemed to increase as the river flows through
more populated areas. Figure 2 shows Tetra Tech’s geologic map of the watershed with
associated conductivity values plotted. Chloride and sulfate were also analyzed in southern
California waters; however, only three sites from the San Diego River Watershed were included
in their study for specific ion concentrations. (Tetra Tech, 2014)
Figure 2. Geologic map of the San Diego River Watershed with sites evaluated for
specific conductivity by TetraTech. (Tetra Tech, 2014)
7
The San Diego River Park Foundation (SDRPF) works to conserve the San Diego River’s
ecological, cultural and recreational resources through volunteer programs, land management,
monitoring and research. The SDRPF’s RiverWatch volunteer-based program convenes once a
month to monitor the water quality of multiple sites along the Lower San Diego River and its
tributaries. The Foundation compiles several reports every year on the state of the river based on
the data collected during RiverWatch. Last year’s State of the River Report gave the lower San
Diego River failing grades across the board. The conductivity of rivers in the US generally vary
from 50 to 1500 microsiemens per centimeter (µS/cm). The average value of specific
conductance for the 15 sites monitored by the SDRPF in 2014 range from 1700 µS/cm (for the
easternmost tributary) to 15620 µS/cm (for the estuary site), with most sites having averages
between 2000 µS/cm and 3000 µS/cm. The 10-year norms for these same sites are 1690 µS/cm
and 7320 µS/cm respectively. In fact, 13 out those 15 sites showed increases in conductivity
from the 10-year norm. Phosphate and nitrate concentrations (partial contributors to TDS or
Specific Conductance) are monitored monthly by SDRPF at five out of their 17 sites. (Kennedy,
2014)
1.3 CURRENT RESEARCH
Natural geological features of a watershed and anthropogenic inputs will influence the ionic
make-up of TDS. The major contributing anions to natural waters are bicarbonate (HCO3-),
carbonate (CO32-), sulfate (SO4
2-), and chloride (Cl-). These anions have not previously been
analyzed in full in this region but have been seen in high quantities at intermittent locations in
the SWAMP, CEDEN, and TetraTech data. The San Diego Region receives much of its water
from imported sources. The Metropolitan Water District of Southern California (MWD)
receives all of its waters from the Colorado River Aqueduct and the State Water Project (SWP).
In times of drought, up to 93% of San Diego’s water comes from the Colorado River, which has
a much higher Total Dissolved Solids (TDS) concentration than SWP. According to the Basin
Plan, TDS in the Colorado River is between 600 and 750 mg/L, whereas the TDS in SWP is
approximately 250 mg/L. The Colorado River water is used in most households in San Diego.
Therefore, the run-off in most areas will already have TDS of at least 600 mg/L, before
collecting between 300 and 1050 mg/L of TDS on the course to the river. (California Regional
8
Water Quality Control Board San Diego Region, 2011) These estimates still leave over half of
the TDS concentration found at most sites unaccounted for.
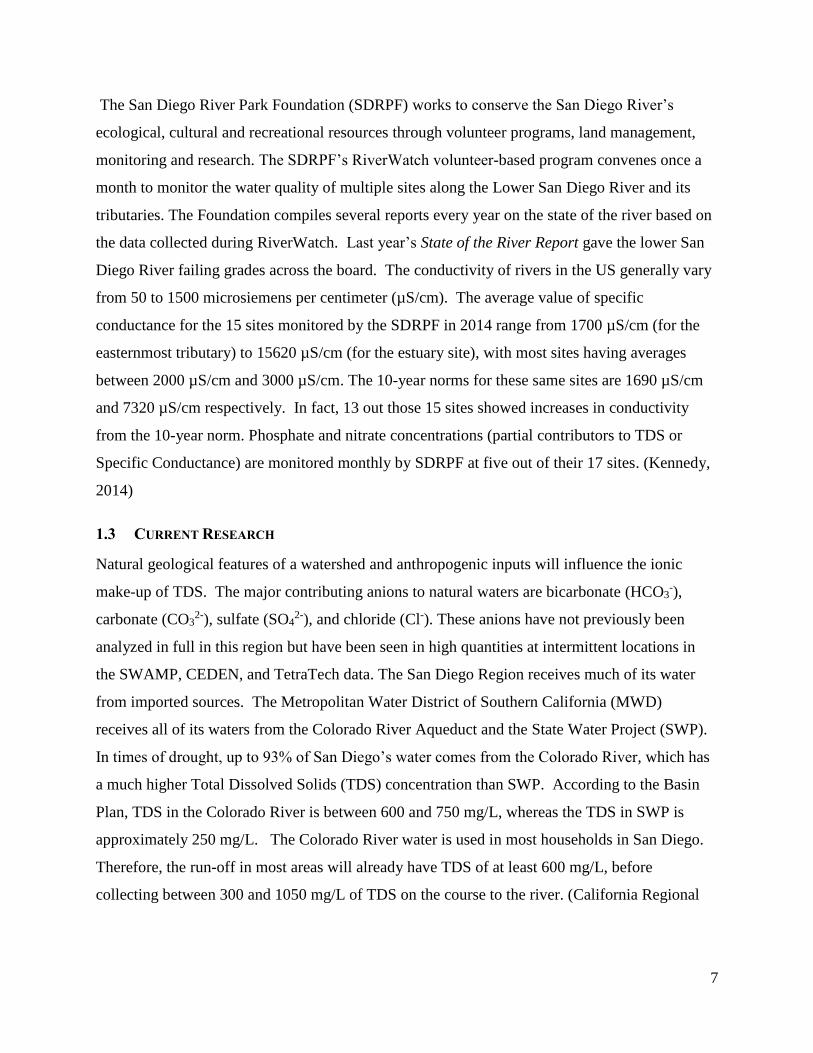
The research involved in this report presents monthly data on sulfate, chloride, carbonate, and
bicarbonate ion concentrations from all 15 sites that the SDRPF monitored in 2014 plus two
additional sites (one site the SDRPF added for their 2015 monitoring and one site of interest to
the researcher) over a 9-month period to access their contribution to elevated levels of TDS. The
researcher will join SDRPF’s RiverWatch team to the 15 sites shown in Figure 3 plus two sites
not shown, and collect water samples from each for further laboratory testing. United States
Geological Survey (USGS) has two flow gauging stations within the study area. Data from the
gauging stations and rain data from USGS online databases will be used in comparison with
anionic concentrations found. This report provides details not previously known on the
geochemical make-up of the Lower San Diego River while offering insight into potentially
natural occurring background levels of ions from geologic materials and will help future
researchers to locate sites of point source pollution.
Figure 3. Locations of sample sites. (San Diego River Park Foundation, 2014)

9
Tributaries shown in light blue. Site 16, Lower Forester Creek, (not shown above) is between site 15 and the river
on the light blue line. An additional site (Site 13b) at Mast Park (Site 13) is not included on the map above, but
is included in this research report. Reaches of the river are color coded: Estuary (orange), Lower Mission
Valley (purple), Upper Mission Valley (red), Mission Gorge (green), Lower Santee Basin (pink), Upper Santee
Basin (dark blue).
2 METHODS
2.1 FIELD METHODS
Seventeen field sites are monitored and sampled along the river and its tributaries (see Figure 3)
on a consistent monthly basis from February to October 2015. 75 viable collected samples from
this time were used for further testing. A sample was used if there was accurate, detailed
labeling, and at least 350 mL of aforementioned sample available.
2.1.1 YSI Electronic Sonde
The following parameters are recorded from the YSI Professional Plus Multiparameter Meter
(YSI, Yellow Springs, OH) at each site: temperature, dissolved oxygen, specific conductance,
pH, and barometric pressure. Care is taken to submerge the entire sonde into the water at the
same location each month.
2.1.2 Sample Collection and Storage
HDPE sample bottles are oriented to face upstream in the deepest and fastest flowing section of
each site, and the first water collected is dumped out before collecting the final sample as an
extra precaution against contamination. The location of sample collection is always noted into a
field notebook along with any other observations of the site. A label is placed on each bottle
indicating the location, date, and time of collection. Sample bottles are kept in a sealed ice chest
until taken to the San Diego State University’s Geochemistry laboratory where they are stored in
a dark fridge kept at 14°C until analyzed further.
2.1.3 Nutrient Testing
The San Diego River Park Foundation selected five of their 16 sites as interests for additional
testing. Field Test Kits (CHEMetrics®, Midland, VA) are used at the end of each field day to
measure nitrate and phosphate concentrations in the water samples from West Hills Parkway,
Upper and Lower Forester Creek, Cottonwood Ave, Admiral Baker Golf Course, and River
Garden E.

10
2.2 LABORATORY METHODS
2.2.1 Buchner Vacuum Filtration Method
Each sample is filtered before further testing for sulfate, alkalinity, and chloride. Type HA
Millipore .45 micron sterilized filters are used. Samples collected May-August were filtered in
early September, while all other samples are filtered within three days of sample collection to
prevent chemical or microbial changes.
2.2.2 Alkalinity Titrations
A 50-mL buret filled with .02 N sulfuric acid is used to titrate 100 mL of sample to a pH of 4.9,
4.6, 4.5, and 4.3. The milliliter value from the buret is recorded at each pH endpoint and is later
used to calculate alkalinity in mg/L calcium carbonate. An EcoSense® pH 10A meter (YSI
Incorporated, Yellow Springs, OH) is used to monitor pH during titration and is calibrated before
each day of usage using buffer solutions of pH 4, 7, and 10. Reported values will be rounded in
order to compensate for potential error.
2.2.3 Sulfate Turbidimetric Method – EPA Method 9038 (EPA, 1986)
Standards of 5, 10, 20, 30, and 40-ppm sulfate are prepared using deionized (DI) water and a
stock solution of 1000ppm Na2SO4. Standard calibration curves were plotted using the known
concentration of the standards vs. the absorbance readings from a spectrophotometer both before
and after analyzing the river water samples. If sample absorbencies did not fall into the range of
the standards, then further dilutions were executed. Consistency in timing, speed, and
measurements are essential. Conditioning Reagent, for Sulfate Analysis (Turbidimetric) from
Ricca Chemical Company® (Arlington, TX) was chosen for conditioning reagent.
2.2.4 Potentiometric Determination of Chloride – EPA Method 9212 (EPA, 1996)
Standards of 100, 200, 300, 400, 500, 600, 700, 800, 900, and 1000 ppm are prepared using DI
water and a stock solution of 1000-ppm chloride. A standard calibration curve is plotted using
the known concentration of the standards vs. the millivolt reading from the chloride probe both
before and after analyzing river water samples.

11
2.3 DATA ANALYSIS METHODS
2.3.1 Alkalinity
As pH neared the 4.9 endpoint, .02N sulfuric acid was added drop by drop, while recording pH
and buret reading after every drop. The mL buret reading at pH 4.6 was initially used in
calculation of CaCO3 as follows:
𝐴𝑙𝑘𝑎𝑙𝑖𝑛𝑖𝑡𝑦, 𝑖𝑛mg
L 𝐶𝑎𝐶𝑂3 =
𝐴 ∗ 𝑁 ∗ 50,000
𝑚𝐿 𝑜𝑓 𝑠𝑎𝑚𝑝𝑙𝑒 𝑢𝑠𝑒𝑑
Where: A= mL of standard acid used; N= normality standard acid
If the initial alkalinity using endpoint 4.6 was between 90mg/L and 165mg/L this was the
reported alkalinity in mg/L CaCO3. If initial alkalinity was below 90mg/L pH endpoint of 4.9
was used. If initial alkalinity was above 165mg/L, pH of 4.3 was used.
In order to calculate carbonate alkalinity and bicarbonate alkalinity the following equations were
used:
𝐻𝐶𝑂3− (
𝑚𝑔
𝐿) =
𝐴𝑙𝑘𝑎𝑙𝑖𝑛𝑖𝑡𝑦 (𝑚𝑔
𝐿 𝐶𝑎𝐶𝑂3)
(1 +2 ∗ 10−10.3
10−𝑝𝐻 ) ∗ 50∗ 61
𝐶𝑂32− (
𝑚𝑔
𝐿) =
𝐴𝑙𝑘𝑎𝑙𝑖𝑛𝑖𝑡𝑦 (𝑚𝑔
𝐿 𝐶𝑎𝐶𝑂3)
(2 +10−𝑝𝐻
10−10.3) ∗ 50∗ 60
2.3.2 Sulfate
The prepared, known concentration of the standards are plotted on an x-y graph against their
absorbance and a linear trend line equation and R-squared value is found. Only R2 values >.99
were considered valid. The linear equation is then used to find sulfate concentrations of samples
from their absorbance. Samples that appeared to show color were tested once again without any
additives to see if this caused a significant change in absorbance. Max absorbance attributed to
color of water = 4 mg/L Sulfate.

12
2.3.3 Chloride
The prepared, known concentration of the standards are plotted on an x-y graph against their
electric potential and an exponential trend line equation and R-squared value is found. Only R2
values >.99 were considered valid. The exponential equation is then used to find chloride
concentrations of samples from their millivolt potential readings.
3 RESULTS AND DISCUSSION
A table of all laboratory results can be found in Appendix A. All Field Results can be found in a
table in Appendix B. The following sections will address trends found and results of particular
interest.
3.1 SPECIFIC CONDUCTANCE AND TOTAL DISSOLVED SOLIDS
As seen in Figure 4, specific conductance values varied from 492 µS/cm up to 7220 µD/cm.
Three of the four sampled tributaries are found to have the highest specific conductance,
(Jackson Outfall, Upper Forester Creek, and Lower Forester Creek). Values stay relatively
constant throughout the study, except in May and August. In May, every site sample dropped in
specific conductance. In August, almost every site experienced a rise in specific conductance.
Using a conversion factor of 0.64, (California Regional Water Quality Control Board San Diego
Region, 2011), specific conductance was converted to TDS and the WQO for this HA was
plotted on graph. The TDS for the imported Colorado River water is plotted as well. Results
show that most samples are within the Basin Plan’s limit for TDS. Besides the tributaries
mentioned above, the only time TDS rises above the WQO is in the summer months of June,
July, and August.

13
Figure 4. Specific conductance in the Lower San Diego River
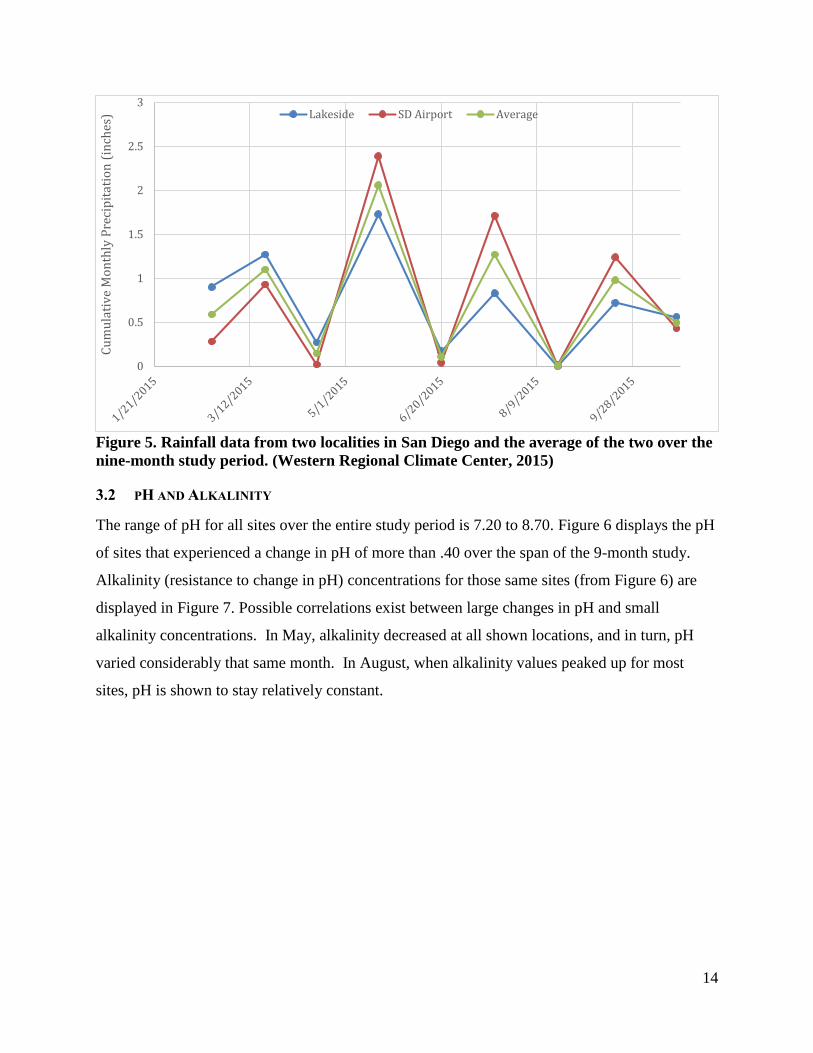
Using data from the Western Regional Climate Center, rain data was correlated with the
abnormally low specific conductance of May 2015 and the high specific conductance of August
2015. Seen below, in Figure 5, we can see that May experienced higher rainfall than any other
month in the study, possibly leading to a dilution effect, lowering the concentration of TDS that
month. While the month of August experience no rain, and is a summer month, meaning higher
temperatures that could potentially lead to higher evaporation rates and thus higher
concentrations of TDS.
Jackson Outfall
Upper Forrester
Creek
Lower Forrester
Creek
0
1000
2000
3000
4000
5000
6000
7000
8000
1/21/2015 3/12/2015 5/1/2015 6/20/2015 8/9/2015 9/28/2015
Spec
ific
Co
nd
uct
ance
(µ
S/cm
)
Month of Sample Collection
Estuary River Garden Fashion Valley MallFSDRIP Ward Rd Kaiser PondAdmiral Baker Golf Course Jackson Dr at MTRP Jackson OutfallOld Mission Dam West Hills Parkway Carlton Oaks
Basin Plan Upper Limit for TDS (1500 mg/L)
Colorado River TDS (600-750 mg/L)
14
Figure 5. Rainfall data from two localities in San Diego and the average of the two over the
nine-month study period. (Western Regional Climate Center, 2015)
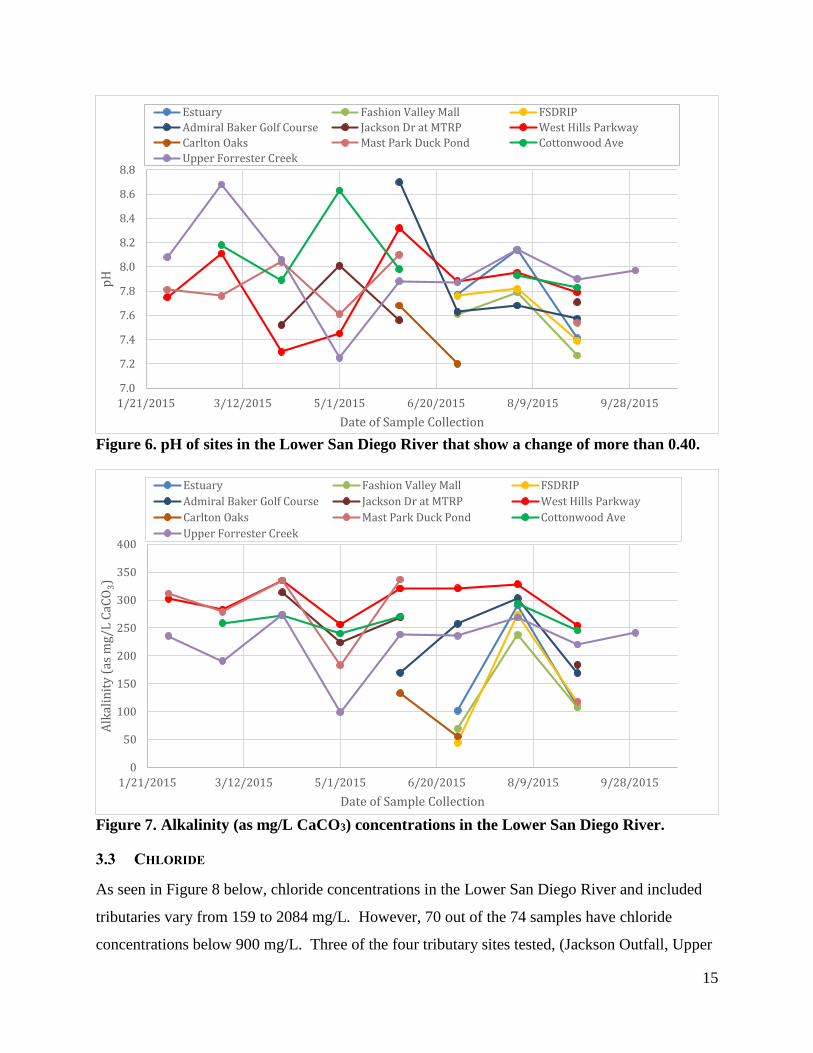
3.2 PH AND ALKALINITY
The range of pH for all sites over the entire study period is 7.20 to 8.70. Figure 6 displays the pH
of sites that experienced a change in pH of more than .40 over the span of the 9-month study.
Alkalinity (resistance to change in pH) concentrations for those same sites (from Figure 6) are
displayed in Figure 7. Possible correlations exist between large changes in pH and small
alkalinity concentrations. In May, alkalinity decreased at all shown locations, and in turn, pH
varied considerably that same month. In August, when alkalinity values peaked up for most
sites, pH is shown to stay relatively constant.
0
0.5
1
1.5
2
2.5
3C
um
ula
tiv
e M
on
thly
Pre
cip
itat
ion
(in
ches
) Lakeside SD Airport Average
15
Figure 6. pH of sites in the Lower San Diego River that show a change of more than 0.40.
Figure 7. Alkalinity (as mg/L CaCO3) concentrations in the Lower San Diego River.
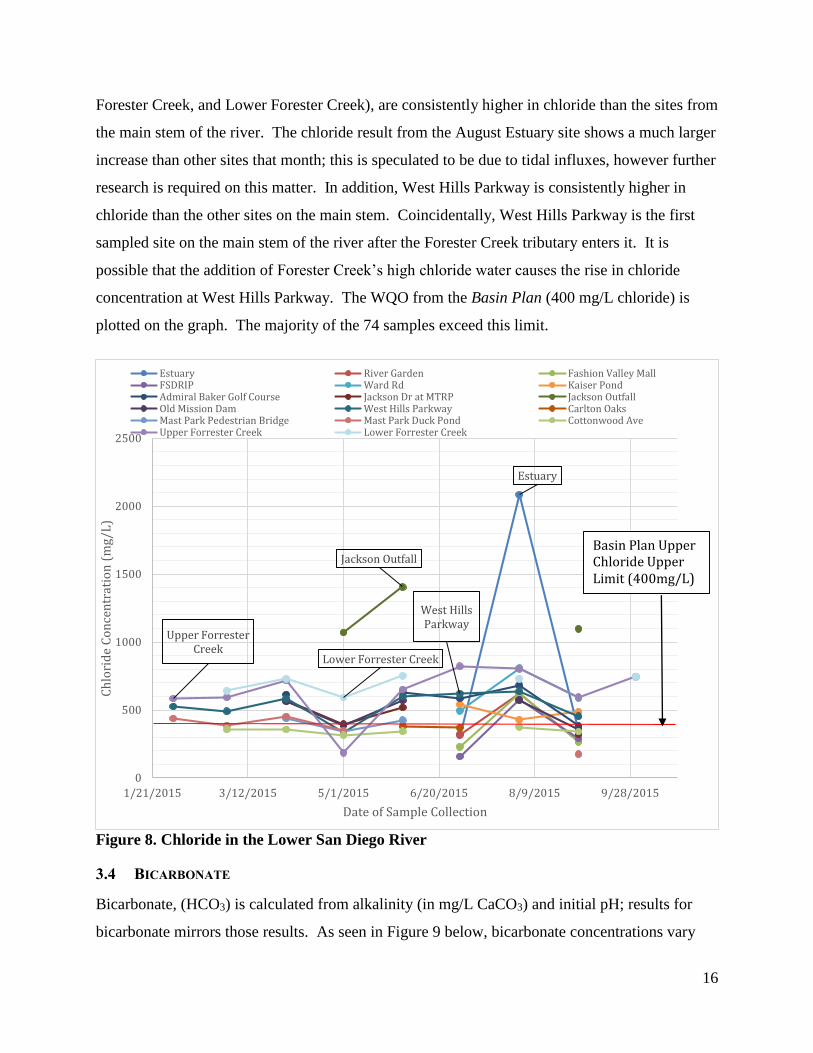
3.3 CHLORIDE
As seen in Figure 8 below, chloride concentrations in the Lower San Diego River and included
tributaries vary from 159 to 2084 mg/L. However, 70 out of the 74 samples have chloride
concentrations below 900 mg/L. Three of the four tributary sites tested, (Jackson Outfall, Upper
7.0
7.2
7.4
7.6
7.8
8.0
8.2
8.4
8.6
8.8
1/21/2015 3/12/2015 5/1/2015 6/20/2015 8/9/2015 9/28/2015
pH
Date of Sample Collection
Estuary Fashion Valley Mall FSDRIP
Admiral Baker Golf Course Jackson Dr at MTRP West Hills Parkway
Carlton Oaks Mast Park Duck Pond Cottonwood Ave
Upper Forrester Creek
0
50
100
150
200
250
300
350
400
1/21/2015 3/12/2015 5/1/2015 6/20/2015 8/9/2015 9/28/2015
Alk
alin
ity
(as
mg/
L C
aCO
3)
Date of Sample Collection
Estuary Fashion Valley Mall FSDRIP
Admiral Baker Golf Course Jackson Dr at MTRP West Hills Parkway
Carlton Oaks Mast Park Duck Pond Cottonwood Ave
Upper Forrester Creek
16
Forester Creek, and Lower Forester Creek), are consistently higher in chloride than the sites from
the main stem of the river. The chloride result from the August Estuary site shows a much larger
increase than other sites that month; this is speculated to be due to tidal influxes, however further
research is required on this matter. In addition, West Hills Parkway is consistently higher in
chloride than the other sites on the main stem. Coincidentally, West Hills Parkway is the first
sampled site on the main stem of the river after the Forester Creek tributary enters it. It is
possible that the addition of Forester Creek’s high chloride water causes the rise in chloride
concentration at West Hills Parkway. The WQO from the Basin Plan (400 mg/L chloride) is
plotted on the graph. The majority of the 74 samples exceed this limit.
Figure 8. Chloride in the Lower San Diego River
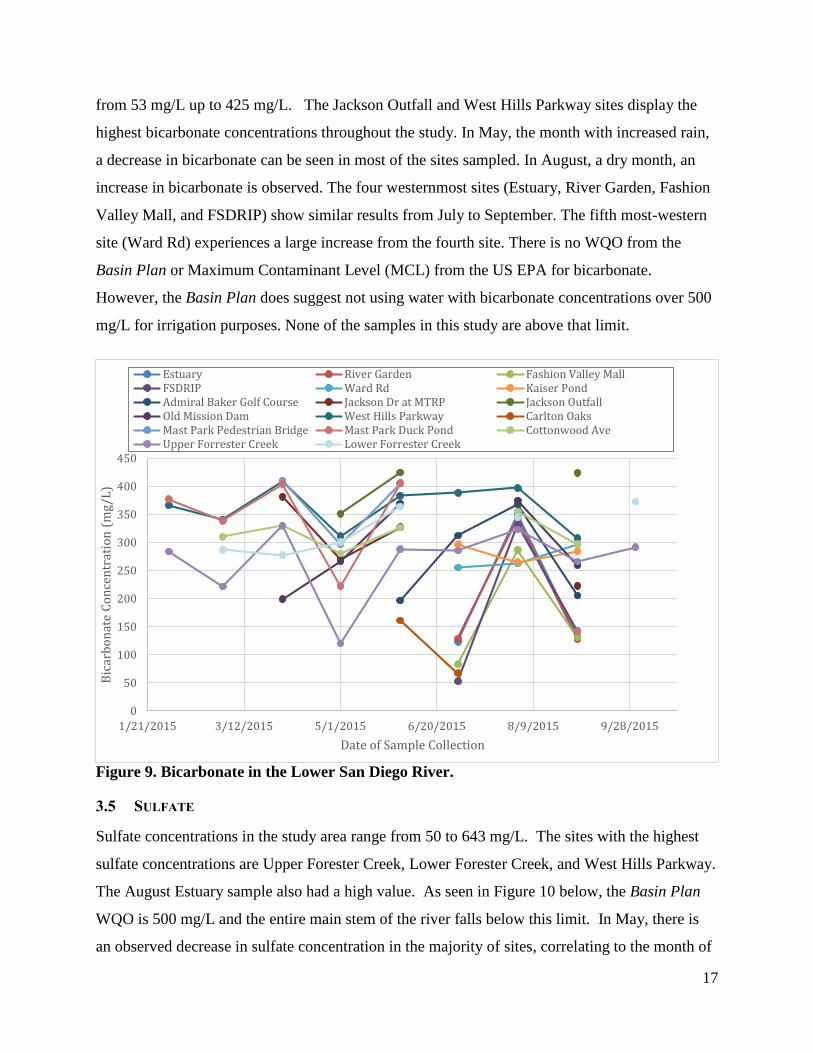
3.4 BICARBONATE
Bicarbonate, (HCO3) is calculated from alkalinity (in mg/L CaCO3) and initial pH; results for
bicarbonate mirrors those results. As seen in Figure 9 below, bicarbonate concentrations vary
Estuary
Jackson Outfall
West Hills Parkway
Upper Forrester Creek
Lower Forrester Creek
0
500
1000
1500
2000
2500
1/21/2015 3/12/2015 5/1/2015 6/20/2015 8/9/2015 9/28/2015
Ch
lori
de
Co
nce
ntr
atio
n (
mg/
L)
Date of Sample Collection
Estuary River Garden Fashion Valley MallFSDRIP Ward Rd Kaiser PondAdmiral Baker Golf Course Jackson Dr at MTRP Jackson OutfallOld Mission Dam West Hills Parkway Carlton OaksMast Park Pedestrian Bridge Mast Park Duck Pond Cottonwood AveUpper Forrester Creek Lower Forrester Creek
Basin Plan Upper Chloride Upper Limit (400mg/L)
17
from 53 mg/L up to 425 mg/L. The Jackson Outfall and West Hills Parkway sites display the
highest bicarbonate concentrations throughout the study. In May, the month with increased rain,
a decrease in bicarbonate can be seen in most of the sites sampled. In August, a dry month, an
increase in bicarbonate is observed. The four westernmost sites (Estuary, River Garden, Fashion
Valley Mall, and FSDRIP) show similar results from July to September. The fifth most-western
site (Ward Rd) experiences a large increase from the fourth site. There is no WQO from the
Basin Plan or Maximum Contaminant Level (MCL) from the US EPA for bicarbonate.
However, the Basin Plan does suggest not using water with bicarbonate concentrations over 500
mg/L for irrigation purposes. None of the samples in this study are above that limit.
Figure 9. Bicarbonate in the Lower San Diego River.
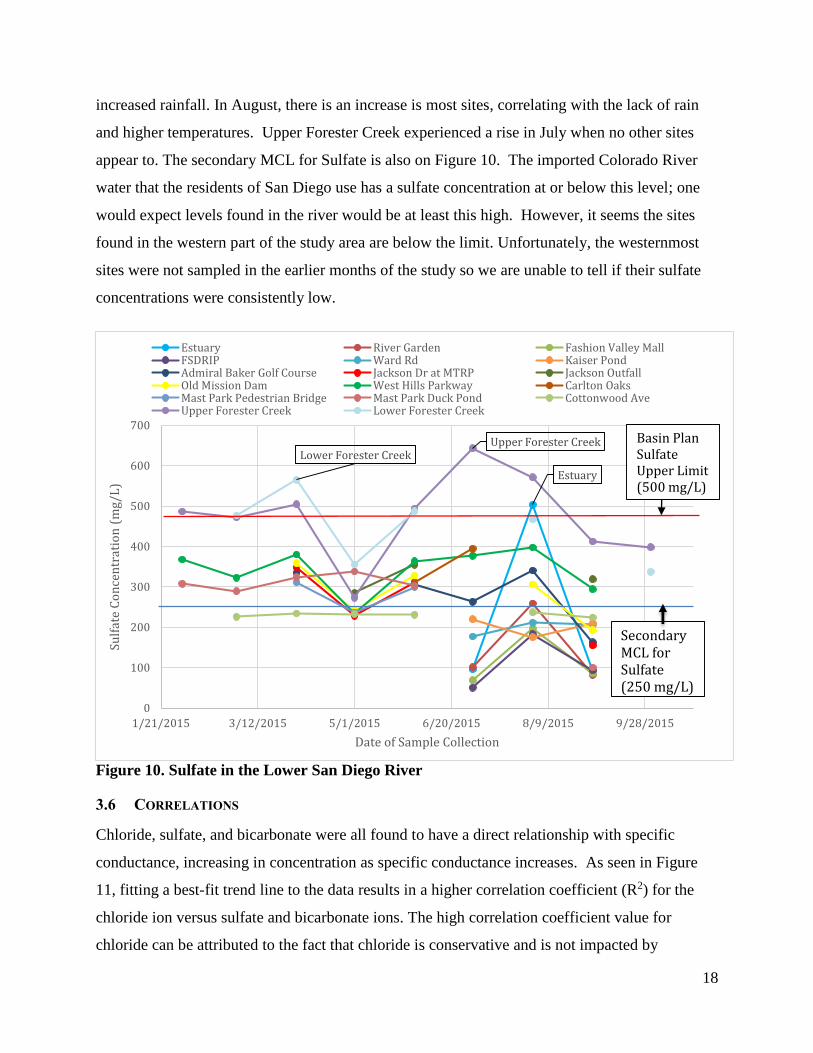
3.5 SULFATE
Sulfate concentrations in the study area range from 50 to 643 mg/L. The sites with the highest
sulfate concentrations are Upper Forester Creek, Lower Forester Creek, and West Hills Parkway.
The August Estuary sample also had a high value. As seen in Figure 10 below, the Basin Plan
WQO is 500 mg/L and the entire main stem of the river falls below this limit. In May, there is
an observed decrease in sulfate concentration in the majority of sites, correlating to the month of
0
50
100
150
200
250
300
350
400
450
1/21/2015 3/12/2015 5/1/2015 6/20/2015 8/9/2015 9/28/2015
Bic
arb
on
ate
Co
nce
ntr
atio
n (
mg/
L)
Date of Sample Collection
Estuary River Garden Fashion Valley MallFSDRIP Ward Rd Kaiser PondAdmiral Baker Golf Course Jackson Dr at MTRP Jackson OutfallOld Mission Dam West Hills Parkway Carlton OaksMast Park Pedestrian Bridge Mast Park Duck Pond Cottonwood AveUpper Forrester Creek Lower Forrester Creek
18
increased rainfall. In August, there is an increase is most sites, correlating with the lack of rain
and higher temperatures. Upper Forester Creek experienced a rise in July when no other sites
appear to. The secondary MCL for Sulfate is also on Figure 10. The imported Colorado River
water that the residents of San Diego use has a sulfate concentration at or below this level; one
would expect levels found in the river would be at least this high. However, it seems the sites
found in the western part of the study area are below the limit. Unfortunately, the westernmost
sites were not sampled in the earlier months of the study so we are unable to tell if their sulfate
concentrations were consistently low.
Figure 10. Sulfate in the Lower San Diego River
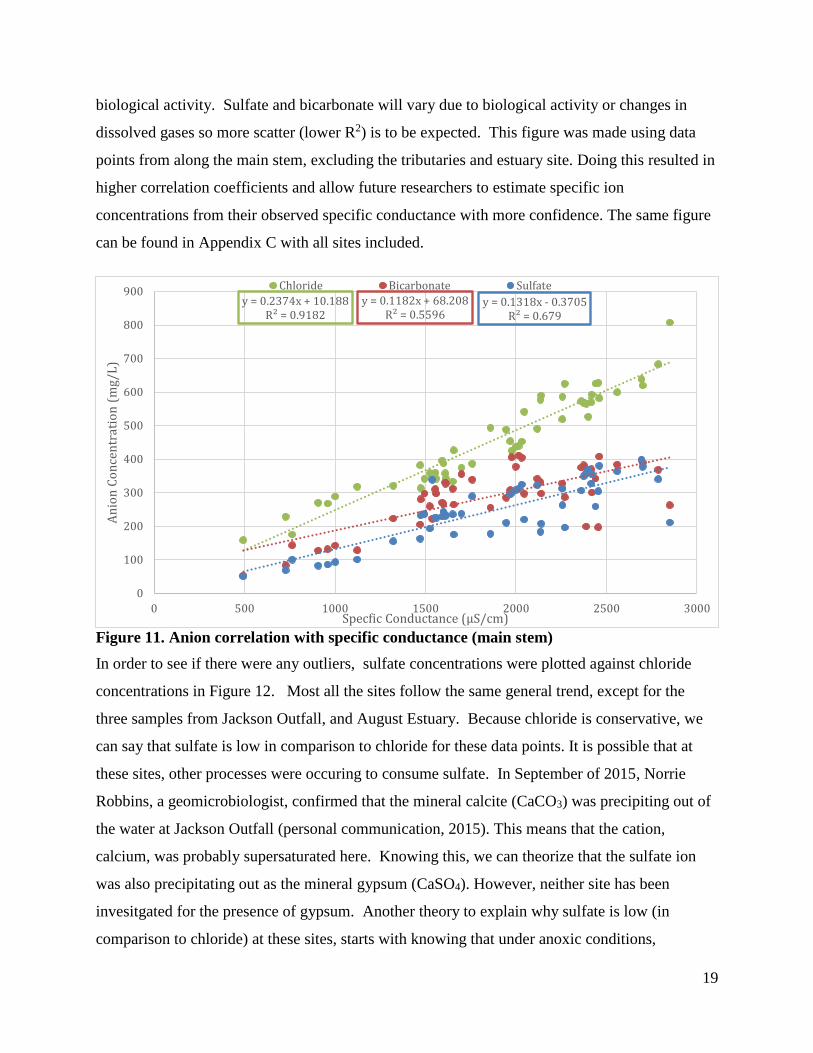
3.6 CORRELATIONS
Chloride, sulfate, and bicarbonate were all found to have a direct relationship with specific
conductance, increasing in concentration as specific conductance increases. As seen in Figure
11, fitting a best-fit trend line to the data results in a higher correlation coefficient (R2) for the
chloride ion versus sulfate and bicarbonate ions. The high correlation coefficient value for
chloride can be attributed to the fact that chloride is conservative and is not impacted by
Estuary
Upper Forester CreekLower Forester Creek
0
100
200
300
400
500
600
700
1/21/2015 3/12/2015 5/1/2015 6/20/2015 8/9/2015 9/28/2015
Sulf
ate
Co
nce
ntr
atio
n (
mg/
L)
Date of Sample Collection
Estuary River Garden Fashion Valley MallFSDRIP Ward Rd Kaiser PondAdmiral Baker Golf Course Jackson Dr at MTRP Jackson OutfallOld Mission Dam West Hills Parkway Carlton OaksMast Park Pedestrian Bridge Mast Park Duck Pond Cottonwood AveUpper Forester Creek Lower Forester Creek
Basin Plan Sulfate Upper Limit (500 mg/L)
Secondary MCL for Sulfate (250 mg/L)
19
biological activity. Sulfate and bicarbonate will vary due to biological activity or changes in
dissolved gases so more scatter (lower R2) is to be expected. This figure was made using data
points from along the main stem, excluding the tributaries and estuary site. Doing this resulted in
higher correlation coefficients and allow future researchers to estimate specific ion
concentrations from their observed specific conductance with more confidence. The same figure
can be found in Appendix C with all sites included.
Figure 11. Anion correlation with specific conductance (main stem)
In order to see if there were any outliers, sulfate concentrations were plotted against chloride
concentrations in Figure 12. Most all the sites follow the same general trend, except for the
three samples from Jackson Outfall, and August Estuary. Because chloride is conservative, we
can say that sulfate is low in comparison to chloride for these data points. It is possible that at
these sites, other processes were occuring to consume sulfate. In September of 2015, Norrie
Robbins, a geomicrobiologist, confirmed that the mineral calcite (CaCO3) was precipiting out of
the water at Jackson Outfall (personal communication, 2015). This means that the cation,
calcium, was probably supersaturated here. Knowing this, we can theorize that the sulfate ion
was also precipitating out as the mineral gypsum (CaSO4). However, neither site has been
invesitgated for the presence of gypsum. Another theory to explain why sulfate is low (in
comparison to chloride) at these sites, starts with knowing that under anoxic conditions,
y = 0.2374x + 10.188R² = 0.9182
y = 0.1182x + 68.208R² = 0.5596
y = 0.1318x - 0.3705R² = 0.679
0
100
200
300
400
500
600
700
800
900
0 500 1000 1500 2000 2500 3000
An
ion
Co
nce
ntr
atio
n (
mg/
L)
Specfic Conductance (µS/cm)
Chloride Bicarbonate Sulfate

20
microbes can reduce sulfate to hydrogen sulfide gas (H2S), which would also lower the sulfate
concentrations observed.
Figure 12. Correlation of chloride with sulfate.
In order to see if anoxic conditions may have been the cause for the lowered sulfate in the
outliers mentioned above, dissolved oxygen (mg/L) from field monitoring was plotted against
sulfate levels in Figure 13; the locations of the data points in question are highlighted. Dissolved
oxygen and sulfate also appear to share a direct relationship with eachother. Dissolved oxygen
for the sites in question are not low enough to draw any conclusions on their microbial
conditions. However, there is a substantial amount of samples below 2mg/L dissolved oxygen,
and they also all have low sulfate values. Data points from Mission Valley sites, (Estuary, River
Garden, FSDRIP, Fashion Valley Mall, Ward Rd. and Kaiser Ponds) are highlighted in red.
Interestingly there has been good amount of complaints from Mission Valley residents about a
rotten egg smell, or Hydrogen Sulfide. (personal communication, 2015) And almost all of these
low oxygen sites are found in Mission Valley, as highlighted in red in figure 13..
y = 0.9508x + 215.83R² = 0.5778
0
500
1000
1500
2000
2500
0 100 200 300 400 500 600 700
Ch
lori
de
(mg/
L)
Sulfate (mg/L)
Jackson Outfall
Estuary

21
Figure 13. Correlation between dissolved oxygen and sulfate.
3.7 LONGITUDINAL TRENDS
Spatial or longitudinal trends within the river were further assessed by plotting the main stem
sites (by site number) on the x-axis against the various analytes tested on the y-axis; Arrows
were drawn to indicate where the tributaries enter the river’s main stem. No significant trends
were observed among the main stem of the river for bicarbonate and chloride ions.
3.7.1 Specific Conductance
Average trends of conductivity over a 6-year period from 2004 to 2010 (San Diego River Park
Foundation, 2011) show an increase in conductance as the river flows west through more
populated areas. However, no such trend is observed in this study’s data, (See Figure 14.) In
July and September, a decrease is actually observed as we head west. It is difficult to evaluate
the causes behind this due to the complexity of the system (e.g. rain events, tributaries, ground
water). Perhaps more data points would paint a better picture.

22
Figure 14. Specific conductance along the main stem of the Lower San Diego River.
3.7.2 Sulfate
Sulfate concentrations along the main stem of the river are plotted in Figure 15. It appears that
the eastern sites exhibit higher sulfate concentrations than that of the east. Once again, this may
have something to do with the presence of hydrogen sulfide in the Mission Valley area. It is also
possible that the tributaries in the East are contribute to high sulfate in that reach of the river.
Figure 15. Sulfate concentrations along the main stem of the Lower San Diego River.
0
100
200
300
400
500
600
0 2 4 6 8 10 12 14 16
Sulf
ate
Co
nce
ntr
atio
n (
mg/
L)
Site Number
April May June July August September
Forester
Creek Sycam
ore
Creek
Jackson
Ou
tfall
Alvarad
oC
reek
West East
Secondary MCL (250 mg/L)

23
4 CONCLUSIONS
4.1 RESEARCH FINDINGS
This study found that the Lower San Diego River is exceeding the San Diego Basin Plan’s WQO
of 400 mg/L. Forester Creek, Jackson Outfall, and West Hills Parkway exceed WQO’s for TDS
using a conversion factor of 0.64 to relate specific conductance to TDS. Forester Creek exceeds
the WQO of 500 mg/L for Sulfate. Sites along the river in Mission Valley are experiences anoxic
conditions and this is leading to the reduction of sulfate to hydrogen sulfide gas, causing
residents to complain of a “rotten egg smell”. Jackson Outfall is most likely supersaturated with
calcium and is precipitated out minerals of calcite and possibly gypsum. The following
correlation equations were found:
Cl-=.2374(SC)+10.188 R2=.9182
HCO3-=.1182(SC)+68.208 R2=.5596
SO4-=.1318(SC)-.3705 R2=.679
These equations can be used on past and future values, with varying confidence, to estimate
anion concentrations from the easily measured specific conductance.
4.2 FUTURE STUDY
Future research is needed in the Lower San Diego River Watershed. WQOs are always being
analyzed and updated due to new data. Once the cause of the high chloride in the study area is
determined and remediated, WQOs may be changed to lower levels. It appears by looking at
USGS geologic maps of the area, that the river runs through all alluvium and colluvium deposits.
However, Old Mission Dam is located on young alluvial flood plain deposits that sharply cut
through mid-Cretaceous Granodiorite and tonalite deposits. Jackson Dr. and Jackson Outfall sites
are also located on the same young alluvial flood plain deposits and cut through Mesozoic
metamorphosed and unmetamorphosed volcanic and sedimentary rocks. (Department of
Conservation, 2008). It is recommended that all of the above-mentioned deposits be studied for
minerals high in calcium, sulfate, and chloride in order to fully understand the natural sources of
high ionic inputs to the river through rock-water interactions. Halite and gypsum are of particular
interest as these are highly soluble minerals. The biological activity, especially at Jackson

24
Outfall, should be studied further to better understand the microbial environment and its
contributions to ion concentrations. Other tributaries could be leading factors in inputs to the
river and should be sought out and analyzed further.

5 APPENDICES
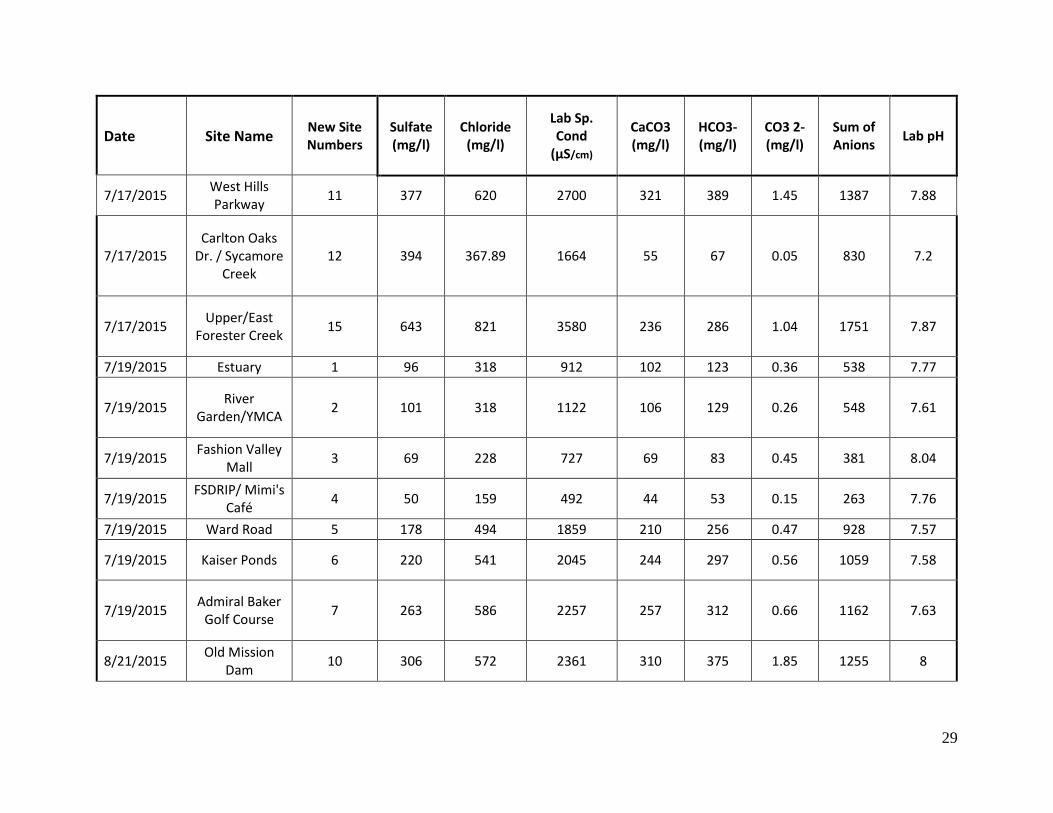
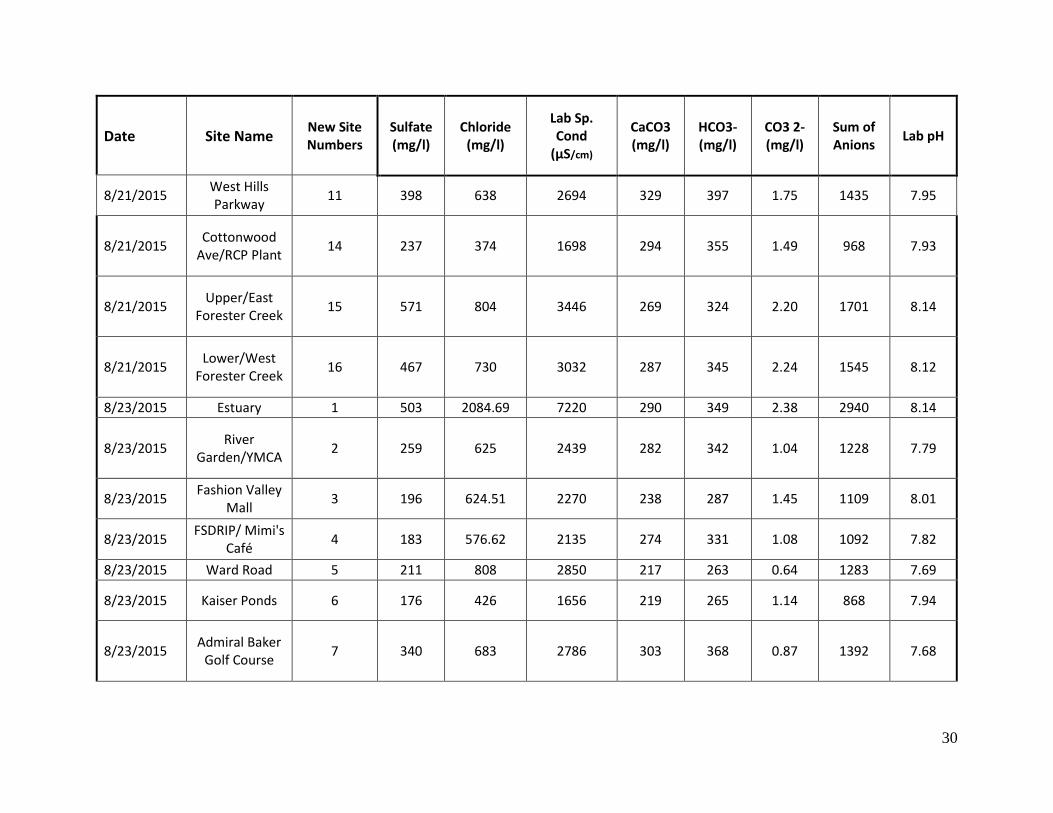
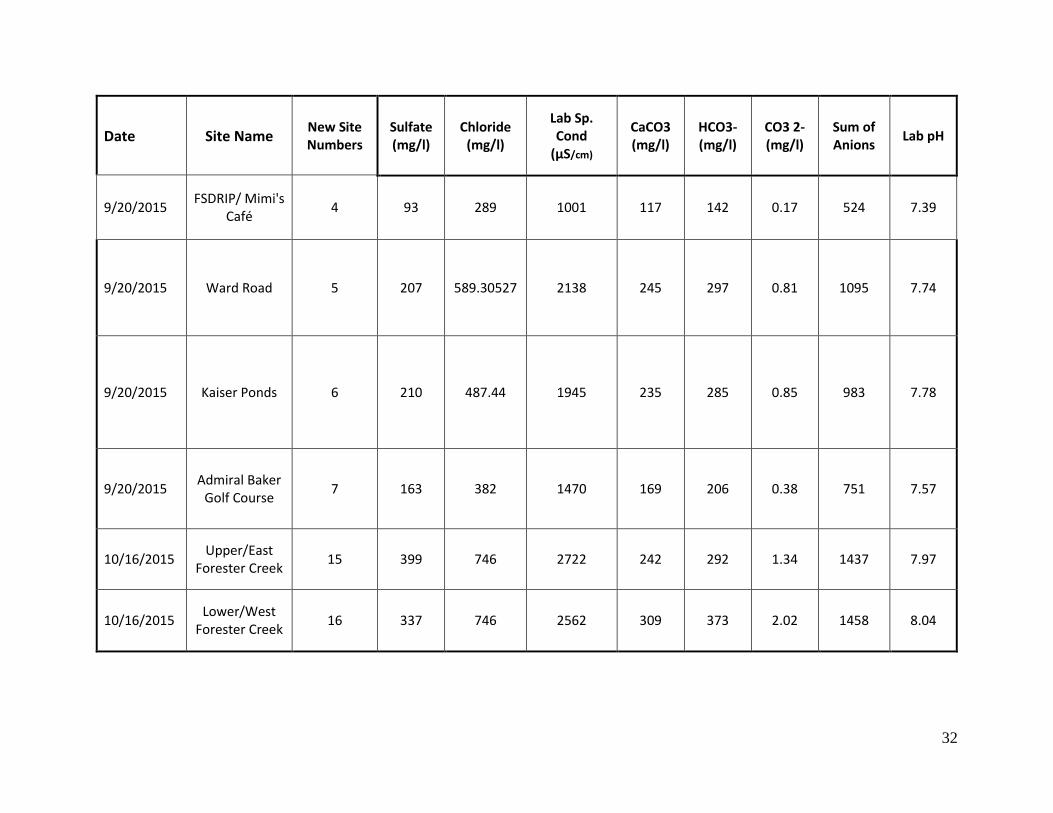
5.1 APPENDIX A – TABLE OF ALL LABORATORY RESULTS, SORTED BY COLLECTION DATE.
Date Site Name New Site Numbers
Sulfate (mg/l)
Chloride (mg/l)
Lab Sp. Cond
(µS/cm)
CaCO3 (mg/l)
HCO3- (mg/l)
CO3 2- (mg/l)
Sum of Anions
Lab pH
2/20/2015 West Hills Parkway
11 368 526 2399 302 367 1.02 1262 7.75
2/20/2015 Upper/East
Forester Creek 15 486 584 2504 236 284 1.68 1356 8.08
2/20/2015 Mast Park Duck Pond
13a 308 437 2000 311 377 1.20 1124 7.81
3/20/2015 West Hills Parkway
11 323 490 2117 283 341 2.17 1156 8.11
3/20/2015 Cottonwood
Ave/RCP Plant 14 226 359 1554 258 311 2.32 898 8.18
3/20/2015 Upper/East
Forester Creek 15 472 594 2527 191 222 5.24 1294 8.68
3/20/2015 Lower/West
Forester Creek 16 477 641 2701 240 287 2.63 1407 8.27

26
Date Site Name New Site Numbers
Sulfate (mg/l)
Chloride (mg/l)
Lab Sp. Cond
(µS/cm)
CaCO3 (mg/l)
HCO3- (mg/l)
CO3 2- (mg/l)
Sum of Anions
Lab pH
3/20/2015 Mast Park Duck Pond
13a 289 386 1757 279 338 0.96 1014 7.76
4/17/2015 Jackson Dr. at
MTRP 8 349 567 2376 314 382 0.62 1299 7.52
4/17/2015 Old Mission
Dam 10 359 565 2387 165 199 0.78 1124 7.9
4/17/2015 West Hills Parkway
11 380 582 2460 335 408 0.40 1371 7.3
4/17/2015 Mast Park Pedestrian
Bridge 13 311 439 2015 339 410 1.61 1163 7.9
4/17/2015 Cottonwood
Ave/RCP Plant 14 234 358 1609 273 330 1.26 924 7.89
4/17/2015 Upper/East
Forester Creek 15 505
721 2941
273 330 1.87
1557
8.06
715 2968 1551
4/17/2015 Lower/West
Forester Creek 16 565 730 3116 231 277 2.17 1575 8.2
4/17/2015 Mast Park Duck Pond
13a 324 452 2033 335 404 2.18 1183 8.04
4/19/2015 Admiral Baker
Golf Course 7 335 615 2464 - - - - -

27
Date Site Name New Site Numbers
Sulfate (mg/l)
Chloride (mg/l)
Lab Sp. Cond
(µS/cm)
CaCO3 (mg/l)
HCO3- (mg/l)
CO3 2- (mg/l)
Sum of Anions
Lab pH
5/22/2015 Jackson Dr. at
MTRP 8 229 395 1592 224 270 1.36 896 8.01
5/22/2015 Jackson Outfall 9 285 1070 3718 293 352 2.81 1709 8.21
5/22/2015 Old Mission
Dam 10 243 387 1599 222 266 2.13 899 8.21
5/22/2015 West Hills Parkway
11 235 333 1651 256 312 0.43 880 7.45
5/22/2015 Mast Park Pedestrian
Bridge 13 236 341 1495 248 297 2.38 877 8.21
5/22/2015 Cottonwood
Ave/RCP Plant 14 233 314 1474 240 281 5.90 833 8.63
5/22/2015 Upper/East
Forester Creek 15 273 185 816 99 121 0.11 578 7.25
5/22/2015 Lower/West
Forester Creek 16 355 592 2420 250 301 2.14 1250 8.16
5/22/2015 Mast Park Duck Pond
13a 338 347 1537 183 222 0.45 908 7.61
6/19/2015 Jackson Dr. at
MTRP 8 312 520 2256 269 327 0.59 1159 7.56
6/19/2015 Jackson Outfall 9 355 1406 4873 351 425 1.70 2187 7.91

28
Date Site Name New Site Numbers
Sulfate (mg/l)
Chloride (mg/l)
Lab Sp. Cond
(µS/cm)
CaCO3 (mg/l)
HCO3- (mg/l)
CO3 2- (mg/l)
Sum of Anions
Lab pH
6/19/2015 Old Mission
Dam 10 328 570 2415 307 370 2.57 1270 8.15
6/19/2015 West Hills Parkway
11 364 599 2559 321 383 3.95 1350 8.32
6/19/2015 Carlton Oaks
Dr. / Sycamore Creek
12 310 381 1678 133 162 0.38 853 7.68
6/19/2015 Mast Park Pedestrian
Bridge 13 300 425 1977 336 406 2.30 1133 8.06
6/19/2015 Cottonwood
Ave/RCP Plant 14 231 343 1612 271 327 1.54 902 7.98
6/19/2015 Upper/East
Forester Creek 15 493
644 2727
238 288 1.08
1427
7.88
657 2745 1440
6/19/2015 Lower/West
Forester Creek 16 487 752 3044 302 364 2.16 1605 8.08
6/19/2015 Mast Park Duck Pond
13a 302 - - 337 406 2.52 - 8.1
6/21/2015 Admiral Baker
Golf Course 7 305 628 2454 170 197 4.87 1134 8.7
29
Date Site Name New Site Numbers
Sulfate (mg/l)
Chloride (mg/l)
Lab Sp. Cond
(µS/cm)
CaCO3 (mg/l)
HCO3- (mg/l)
CO3 2- (mg/l)
Sum of Anions
Lab pH
7/17/2015 West Hills Parkway
11 377 620 2700 321 389 1.45 1387 7.88
7/17/2015 Carlton Oaks
Dr. / Sycamore Creek
12 394 367.89 1664 55 67 0.05 830 7.2
7/17/2015 Upper/East
Forester Creek 15 643 821 3580 236 286 1.04 1751 7.87
7/19/2015 Estuary 1 96 318 912 102 123 0.36 538 7.77
7/19/2015 River
Garden/YMCA 2 101 318 1122 106 129 0.26 548 7.61
7/19/2015 Fashion Valley
Mall 3 69 228 727 69 83 0.45 381 8.04
7/19/2015 FSDRIP/ Mimi's
Café 4 50 159 492 44 53 0.15 263 7.76
7/19/2015 Ward Road 5 178 494 1859 210 256 0.47 928 7.57
7/19/2015 Kaiser Ponds 6 220 541 2045 244 297 0.56 1059 7.58
7/19/2015 Admiral Baker
Golf Course 7 263 586 2257 257 312 0.66 1162 7.63
8/21/2015 Old Mission
Dam 10 306 572 2361 310 375 1.85 1255 8
30
Date Site Name New Site Numbers
Sulfate (mg/l)
Chloride (mg/l)
Lab Sp. Cond
(µS/cm)
CaCO3 (mg/l)
HCO3- (mg/l)
CO3 2- (mg/l)
Sum of Anions
Lab pH
8/21/2015 West Hills Parkway
11 398 638 2694 329 397 1.75 1435 7.95
8/21/2015 Cottonwood
Ave/RCP Plant 14 237 374 1698 294 355 1.49 968 7.93
8/21/2015 Upper/East
Forester Creek 15 571 804 3446 269 324 2.20 1701 8.14
8/21/2015 Lower/West
Forester Creek 16 467 730 3032 287 345 2.24 1545 8.12
8/23/2015 Estuary 1 503 2084.69 7220 290 349 2.38 2940 8.14
8/23/2015 River
Garden/YMCA 2 259 625 2439 282 342 1.04 1228 7.79
8/23/2015 Fashion Valley
Mall 3 196 624.51 2270 238 287 1.45 1109 8.01
8/23/2015 FSDRIP/ Mimi's
Café 4 183 576.62 2135 274 331 1.08 1092 7.82
8/23/2015 Ward Road 5 211 808 2850 217 263 0.64 1283 7.69
8/23/2015 Kaiser Ponds 6 176 426 1656 219 265 1.14 868 7.94
8/23/2015 Admiral Baker
Golf Course 7 340 683 2786 303 368 0.87 1392 7.68

31
Date Site Name New Site Numbers
Sulfate (mg/l)
Chloride (mg/l)
Lab Sp. Cond
(µS/cm)
CaCO3 (mg/l)
HCO3- (mg/l)
CO3 2- (mg/l)
Sum of Anions
Lab pH
9/18/2015 Jackson Dr. at
MTRP 8 155 320.27 1322 184 223 0.56 699 7.71
9/18/2015 Jackson Outfall 9 319 1096.39 3868 354 424 3.89 1844 8.27
9/18/2015 Old Mission
Dam 10 193 358.73 1525 214 260 0.87 812 7.83
9/18/2015 West Hills Parkway
11 295 453.85 1967 254 308 0.94 1057 7.79
9/18/2015 Cottonwood
Ave/RCP Plant 14 224 341 1558 245 297 0.99 864 7.83
9/18/2015 Upper/East
Forester Creek 15 412 593.82 2500 220 266 1.04 1274 7.9
9/18/2015 Mast Park Duck Pond
13a 100 174.93 763 118 143 0.24 418 7.54
9/20/2015 Estuary 1 93 350 1166 109 132 0.17 575 7.41
9/20/2015 River
Garden/YMCA 2 82 270 906 105 128 0.12 480 7.27
9/20/2015 Fashion Valley
Mall 3 86 267.35 959 108 131 0.31 485 7.68
32
Date Site Name New Site Numbers
Sulfate (mg/l)
Chloride (mg/l)
Lab Sp. Cond
(µS/cm)
CaCO3 (mg/l)
HCO3- (mg/l)
CO3 2- (mg/l)
Sum of Anions
Lab pH
9/20/2015 FSDRIP/ Mimi's
Café 4 93 289 1001 117 142 0.17 524 7.39
9/20/2015 Ward Road 5 207 589.30527 2138 245 297 0.81 1095 7.74
9/20/2015 Kaiser Ponds 6 210 487.44 1945 235 285 0.85 983 7.78
9/20/2015 Admiral Baker
Golf Course 7 163 382 1470 169 206 0.38 751 7.57
10/16/2015 Upper/East
Forester Creek 15 399 746 2722 242 292 1.34 1437 7.97
10/16/2015 Lower/West
Forester Creek 16 337 746 2562 309 373 2.02 1458 8.04

33
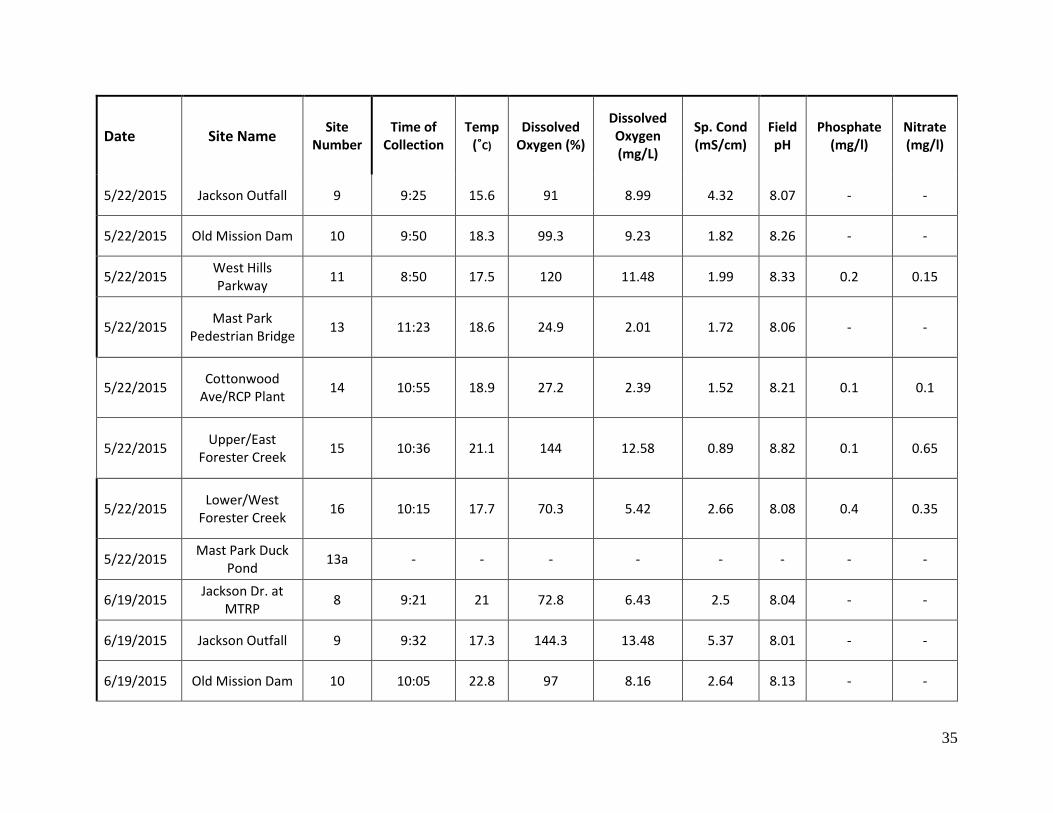
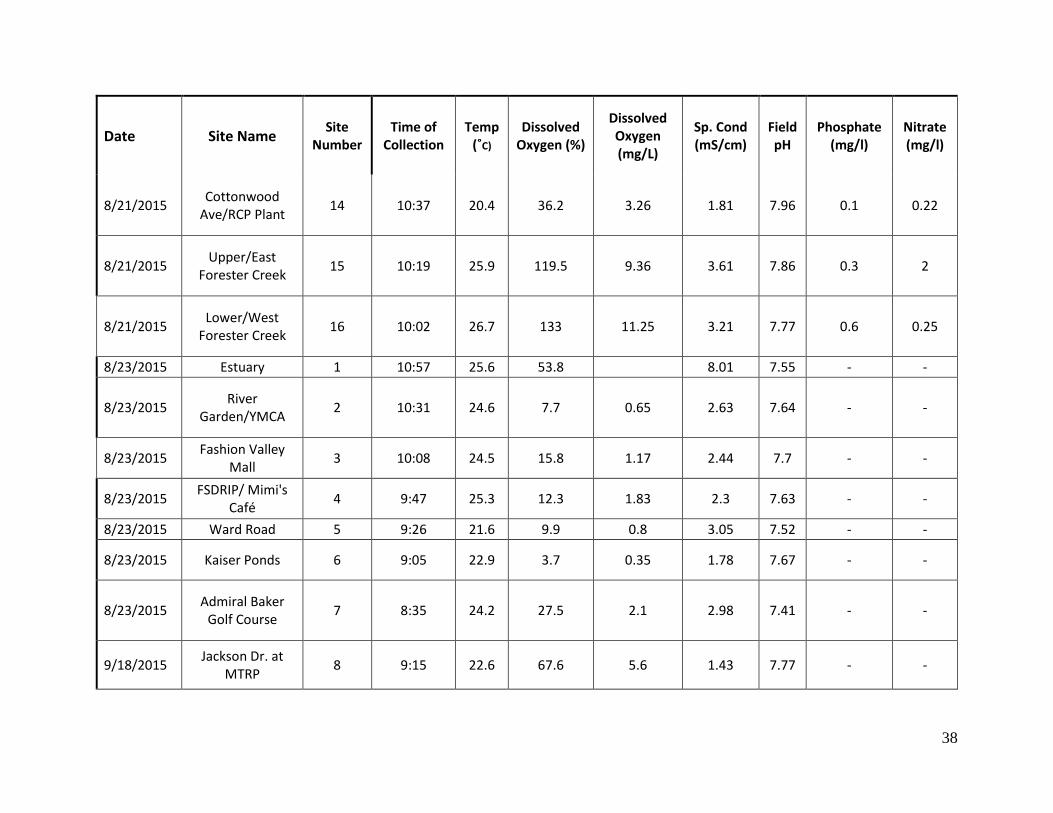
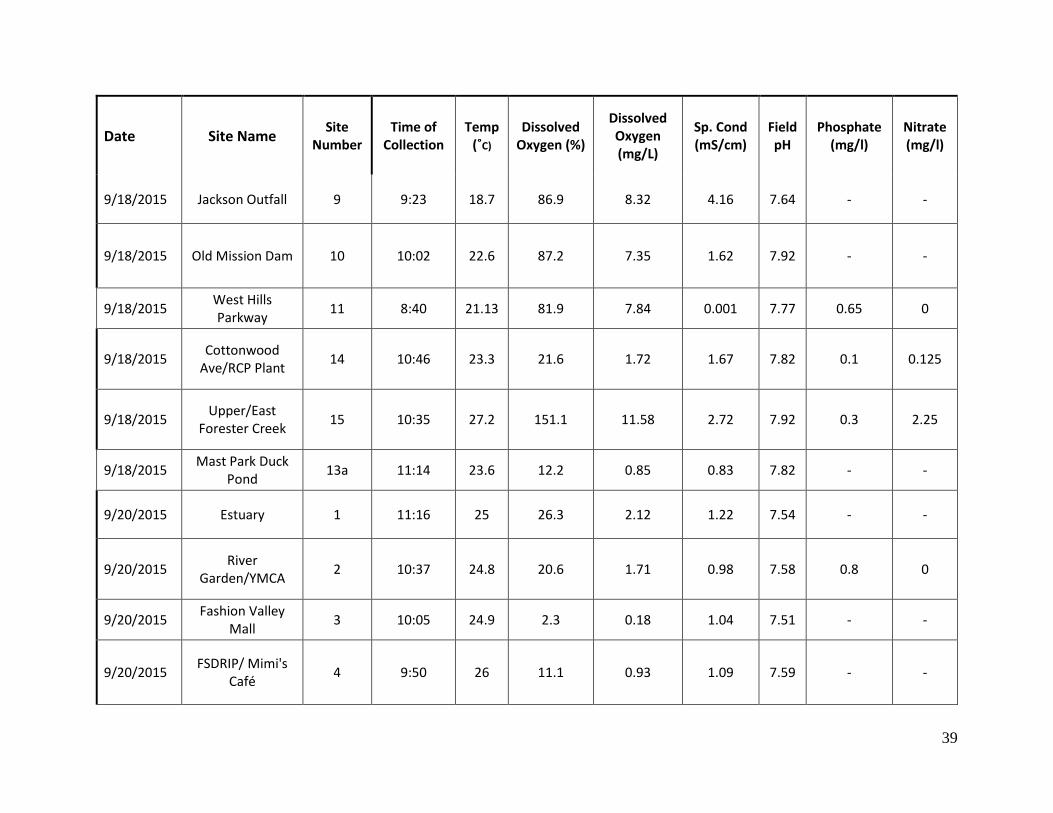
5.2 APPENDIX B – TABLE OF ALL FIELD RESULTS, SORTED BY COLLECTION DATE
Date Site Name Site
Number Time of
Collection Temp (˚C)
Dissolved Oxygen (%)
Dissolved Oxygen (mg/L)
Sp. Cond (mS/cm)
Field pH
Phosphate (mg/l)
Nitrate (mg/l)
2/20/2015 West Hills Parkway
11 8:45 16.2 62 5.94 2.54 7.81 0.45 0.1
2/20/2015 Upper/East
Forester Creek 15 10:10 18 124.6 11.52 2.7 8.28 0.05 2.5
2/20/2015 Mast Park Duck
Pond 13a - - - - - - - -
3/20/2015 West Hills Parkway
11 8:50 16.8 57.1 5.47 2.28 7.52 0.35 0.15
3/20/2015 Cottonwood
Ave/RCP Plant 14 11:17 17.6 21.4 2.04 1.68 8.03 0.3 0.25
3/20/2015 Upper/East
Forester Creek 15 10:59 22.9 176.3 14.83 2.82 8.55 0.1 3
3/20/2015 Lower/West
Forester Creek 16 10:33 18.8 102.3 9.59 2.89 7.99 0.4 0.5
3/20/2015 Mast Park Duck
Pond 13a 11:48 19.2 20.6 2.6 1.92 7.68

34
Date Site Name Site
Number Time of
Collection Temp (˚C)
Dissolved Oxygen (%)
Dissolved Oxygen (mg/L)
Sp. Cond (mS/cm)
Field pH
Phosphate (mg/l)
Nitrate (mg/l)
4/17/2015 Jackson Dr. at
MTRP 8 9:25 16.6 72.4 7.02 1.38 7.78 - -
4/17/2015 Old Mission Dam 10 10:10 17.6 89.6 8.45 2.65 7.93 - -
4/17/2015 West Hills Parkway
11 0:00 15.6 59 5.78 2.71 7.65 0.8 0.25
4/17/2015 Mast Park
Pedestrian Bridge 13 11:50 17.7 30.7 2.73 2.23 7.91 - -
4/17/2015 Cottonwood
Ave/RCP Plant 14 11:20 14.6 32 3.19 1.76 8.11 0.2 0-.05
4/17/2015 Upper/East
Forester Creek 15 11:00 22.9 150 14.99 3.41 8.29 0.1 2.5
4/17/2015 Lower/West
Forester Creek 16 10:35 19.5 132.5 11.73 3.27 8.09 0.4 0.125
4/17/2015 Mast Park Duck
Pond 13a 11:57 18.5 37.1 3.37 2.24 7.63 - -
4/19/2015 Admiral Baker
Golf Course 7 8:35 18.2 40.1 3.71 2.65 7.9 0.05 0.15
5/22/2015 Jackson Dr. at
MTRP 8 9:15 18 115.3 11.74 1.73 8.31 - -
35
Date Site Name Site
Number Time of
Collection Temp (˚C)
Dissolved Oxygen (%)
Dissolved Oxygen (mg/L)
Sp. Cond (mS/cm)
Field pH
Phosphate (mg/l)
Nitrate (mg/l)
5/22/2015 Jackson Outfall 9 9:25 15.6 91 8.99 4.32 8.07 - -
5/22/2015 Old Mission Dam 10 9:50 18.3 99.3 9.23 1.82 8.26 - -
5/22/2015 West Hills Parkway
11 8:50 17.5 120 11.48 1.99 8.33 0.2 0.15
5/22/2015 Mast Park
Pedestrian Bridge 13 11:23 18.6 24.9 2.01 1.72 8.06 - -
5/22/2015 Cottonwood
Ave/RCP Plant 14 10:55 18.9 27.2 2.39 1.52 8.21 0.1 0.1
5/22/2015 Upper/East
Forester Creek 15 10:36 21.1 144 12.58 0.89 8.82 0.1 0.65
5/22/2015 Lower/West
Forester Creek 16 10:15 17.7 70.3 5.42 2.66 8.08 0.4 0.35
5/22/2015 Mast Park Duck
Pond 13a - - - - - - - -
6/19/2015 Jackson Dr. at
MTRP 8 9:21 21 72.8 6.43 2.5 8.04 - -
6/19/2015 Jackson Outfall 9 9:32 17.3 144.3 13.48 5.37 8.01 - -
6/19/2015 Old Mission Dam 10 10:05 22.8 97 8.16 2.64 8.13 - -

36
Date Site Name Site
Number Time of
Collection Temp (˚C)
Dissolved Oxygen (%)
Dissolved Oxygen (mg/L)
Sp. Cond (mS/cm)
Field pH
Phosphate (mg/l)
Nitrate (mg/l)
6/19/2015 West Hills Parkway
11 8:51 19.6 83.7 7.54 2.84 8.37 0.5 0.15
6/19/2015 Carlton Oaks Dr. / Sycamore Creek
12 12:19 - - - - - - -
6/19/2015 Mast Park
Pedestrian Bridge 13 11:39 22.4 39 3.16 2.18 8.1 - -
6/19/2015 Cottonwood
Ave/RCP Plant 14 11:06 19 27.4 2.49 1.76 8.34 0.3 0
6/19/2015 Upper/East
Forester Creek 15 10:46 20.2 225.2 17.4 3.02 8.48 0.3 0.6
6/19/2015 Lower/West
Forester Creek 16 10:30 23.1 112.5 9.39 3.33 8.19 0.5 0.5
6/19/2015 Mast Park Duck
Pond 13a - - - - - - - -
6/21/2015 Admiral Baker
Golf Course 7 8:35 23 88.8 7.45 2.69 8.23 - -
7/17/2015 West Hills Parkway
11 8:45 20.3 37.4 3.3 2.94 7.33 0 0.1

37
Date Site Name Site
Number Time of
Collection Temp (˚C)
Dissolved Oxygen (%)
Dissolved Oxygen (mg/L)
Sp. Cond (mS/cm)
Field pH
Phosphate (mg/l)
Nitrate (mg/l)
7/17/2015 Carlton Oaks Dr. / Sycamore Creek
12 11:03 27.7 84.4 6.52 1.82 8.3 - -
7/17/2015 Upper/East
Forester Creek 15 10:08 26.3 114 8.35 3.88 8.01 0 1.5
7/19/2015 Estuary 1 11:06 22.5 21.6 1.86 1.18 7.87 - -
7/19/2015 River
Garden/YMCA 2 10:33 22.1 20.1 1.76 1.09 7.56 0.5 0.35
7/19/2015 Fashion Valley
Mall 3 10:12 21.9 18.9 1.65 0.78 7.86 - -
7/19/2015 FSDRIP/ Mimi's
Café 4 9:51 21.6 15.6 1.38 0.528 8.21 - -
7/19/2015 Ward Road 5 9:21 22.2 18.6 1.61 2 7.75 - -
7/19/2015 Kaiser Ponds 6 8:41 23.8 10 0.08 2.23 7.59 - -
7/19/2015 Admiral Baker
Golf Course 7 8:27 24.5 49.9 4.13 2.47 7.64 0.4 0.1
8/21/2015 Old Mission Dam 10 9:36 24.4 61 5.14 2.62 7.76 - -
8/21/2015 West Hills Parkway
11 8:23 21.4 39.2 3.44 2.88 7.29 0.8 0.1
38
Date Site Name Site
Number Time of
Collection Temp (˚C)
Dissolved Oxygen (%)
Dissolved Oxygen (mg/L)
Sp. Cond (mS/cm)
Field pH
Phosphate (mg/l)
Nitrate (mg/l)
8/21/2015 Cottonwood
Ave/RCP Plant 14 10:37 20.4 36.2 3.26 1.81 7.96 0.1 0.22
8/21/2015 Upper/East
Forester Creek 15 10:19 25.9 119.5 9.36 3.61 7.86 0.3 2
8/21/2015 Lower/West
Forester Creek 16 10:02 26.7 133 11.25 3.21 7.77 0.6 0.25
8/23/2015 Estuary 1 10:57 25.6 53.8 8.01 7.55 - -
8/23/2015 River
Garden/YMCA 2 10:31 24.6 7.7 0.65 2.63 7.64 - -
8/23/2015 Fashion Valley
Mall 3 10:08 24.5 15.8 1.17 2.44 7.7 - -
8/23/2015 FSDRIP/ Mimi's
Café 4 9:47 25.3 12.3 1.83 2.3 7.63 - -
8/23/2015 Ward Road 5 9:26 21.6 9.9 0.8 3.05 7.52 - -
8/23/2015 Kaiser Ponds 6 9:05 22.9 3.7 0.35 1.78 7.67 - -
8/23/2015 Admiral Baker
Golf Course 7 8:35 24.2 27.5 2.1 2.98 7.41 - -
9/18/2015 Jackson Dr. at
MTRP 8 9:15 22.6 67.6 5.6 1.43 7.77 - -
39
Date Site Name Site
Number Time of
Collection Temp (˚C)
Dissolved Oxygen (%)
Dissolved Oxygen (mg/L)
Sp. Cond (mS/cm)
Field pH
Phosphate (mg/l)
Nitrate (mg/l)
9/18/2015 Jackson Outfall 9 9:23 18.7 86.9 8.32 4.16 7.64 - -
9/18/2015 Old Mission Dam 10 10:02 22.6 87.2 7.35 1.62 7.92 - -
9/18/2015 West Hills Parkway
11 8:40 21.13 81.9 7.84 0.001 7.77 0.65 0
9/18/2015 Cottonwood
Ave/RCP Plant 14 10:46 23.3 21.6 1.72 1.67 7.82 0.1 0.125
9/18/2015 Upper/East
Forester Creek 15 10:35 27.2 151.1 11.58 2.72 7.92 0.3 2.25
9/18/2015 Mast Park Duck
Pond 13a 11:14 23.6 12.2 0.85 0.83 7.82 - -
9/20/2015 Estuary 1 11:16 25 26.3 2.12 1.22 7.54 - -
9/20/2015 River
Garden/YMCA 2 10:37 24.8 20.6 1.71 0.98 7.58 0.8 0
9/20/2015 Fashion Valley
Mall 3 10:05 24.9 2.3 0.18 1.04 7.51 - -
9/20/2015 FSDRIP/ Mimi's
Café 4 9:50 26 11.1 0.93 1.09 7.59 - -

40
Date Site Name Site
Number Time of
Collection Temp (˚C)
Dissolved Oxygen (%)
Dissolved Oxygen (mg/L)
Sp. Cond (mS/cm)
Field pH
Phosphate (mg/l)
Nitrate (mg/l)
9/20/2015 Ward Road 5 9:23 23.8 5.3 0.44 2.2 7.52 - -
9/20/2015 Kaiser Ponds 6 9:00 24.6 3 0.25 2.1 7.3 - -
9/20/2015 Admiral Baker
Golf Course 7 8:37 24.5 14.4 1.26 1.58 7.37 0.35 0
10/16/2015 Upper/East
Forester Creek 15 11:45 24.9 75 5.91 2.83 8.01 1 3
10/16/2015 Lower/West
Forester Creek 16 11:21 22.7 72.1 6.17 2.71 8.03 <.1 0.15
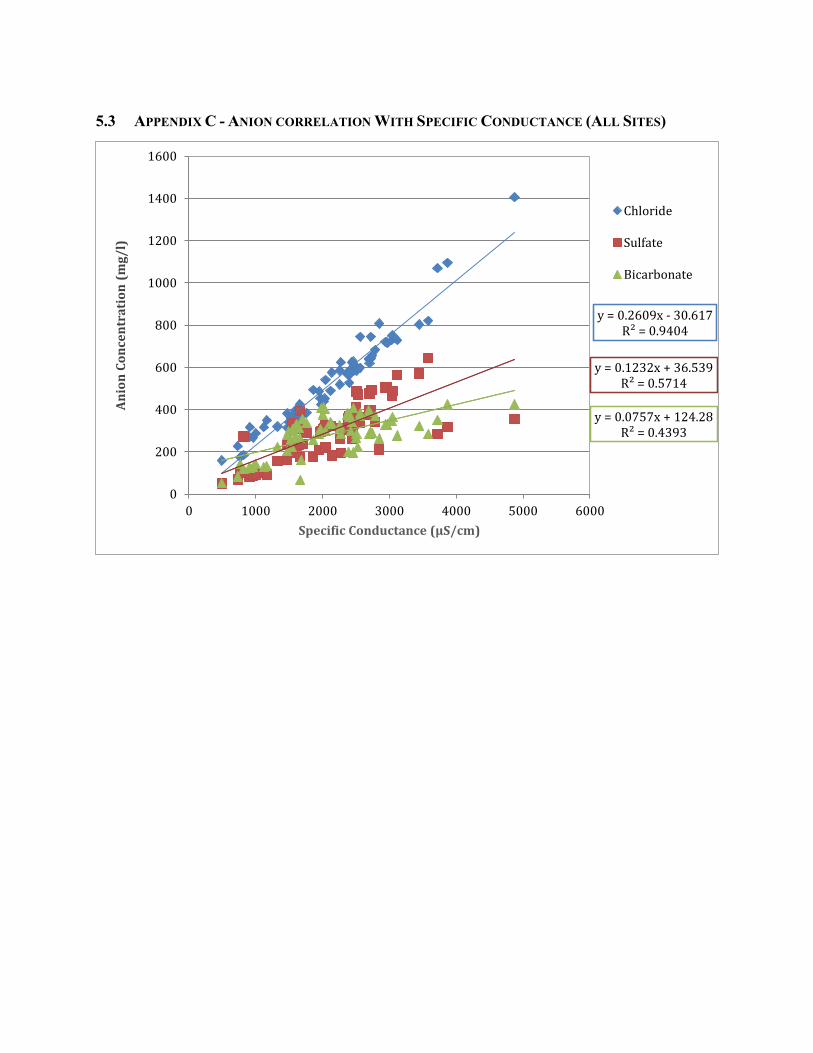
5.3 APPENDIX C - ANION CORRELATION WITH SPECIFIC CONDUCTANCE (ALL SITES)
y = 0.2609x - 30.617R² = 0.9404
y = 0.1232x + 36.539R² = 0.5714
y = 0.0757x + 124.28R² = 0.4393
0
200
400
600
800
1000
1200
1400
1600
0 1000 2000 3000 4000 5000 6000
An
ion
Co
nce
ntr
ati
on
(m
g/
l)
Specific Conductance (µS/cm)
Chloride
Sulfate
Bicarbonate

Anionic Contribution to TDS in LSDR Janae Fried
RWS508W-01 Fall 2015 42 of 42
6 REFERENCES
California Regional Water Quality Control Board San Diego Region, 2011, Water Quality
Control Plan for The San Diego Basin, Retrieved from
http://www.waterboards.ca.gov/sandiego/water_issues/programs/basin_plan/
Department of Conservation, 2008, Geologic Map of the San Diego Quadrangle. Retrieved from:
http://www.quake.ca.gov/gmaps/RGM/sandiego/sandiego.html
EPA, 1986, Test Methods for Evaluating Solid Waste, Physical/Chemical Methods, METHOD
9038 SULFATE (TURBIDIMETRIC), Retrieved from:
http://www3.epa.gov/epawaste/hazard/testmethods/sw846/pdfs/9038.pdf
EPA, 1996, Test Methods for Evaluating Solid Waste, Physical/Chemical Methods, METHOD
9212 POTENTIOMETRIC DETERMINATION OF CHLORIDE IN AQUEOUS SAMPLES
WITH ION-SELECTIVE ELECTRODE, Retrieved from:
http://www3.epa.gov/epawaste/hazard/testmethods/sw846/pdfs/9212.pdf
Kennedy, J.C., 2014 Lower San Diego River Water Quality 2014 - Wy14 Water Quality
Monitoring Report, San Diego River Park Foundation
Kennedy, J.C, 2010, Lower San Diego River Water Quality Characteristics - Cyclic Patterns,
Averages, Variances and Trends in Water Quality Data, San Diego River Park Foundation
Tetra Tech, Inc., 2014, Conductivity and Total Dissolved Solids (TDS) Causal Assessment Study
– Phase I, Draft. Submitted to: City of San Diego Transportation & Strom Water Department
TRC, 2011, San Diego River Watershed Urban Runoff Management Program Annual Report,
Retrieved from http://www.projectcleanwater.org/html/wurmp_san_diego_river.html
Western Regional Climate Center, 2015, Monthly Sum of Precipitation (Inches) - LAKESIDE 2
E, CA. Retrieved from: http://www.wrcc.dri.edu/cgi-bin/cliMAIN.pl?ca4710
Western Regional Climate Center, 2015, Monthly Sum of Precipitation (Inches) - SAN DIEGO
LINDBERGH FLD, CA. Retrieved from: http://www.wrcc.dri.edu/cgi-bin/cliMAIN.pl?ca7740