analysis of asymmetry and morphometric variation in
TRANSCRIPT
ANALYSIS O F ASYMMETRY AND MORPHOMETRIC VARIATION IN NATURAL POPULATIONS O F
CHROMOSOME-DAMAGED MICE
ROBERT D. OWEN A N D KAREN MCBEE Department of Biology, University of Missouri-Kansas City,
Kansas City, Missouri 641 10, and Department of Zoology, Oklahoma State University,
Stillwater, Oklahoma 74078
A ~ s ~ ~ ~ c - r . - I n c r e a s e d fluctuating asymmetry (FA) has been postulated to result from increased heterozygosity, inbreeding, hybridization, increased selection, and environmental stress, among other things. The general suggestion is that the genome, if critically disrupted, is unable to buffer adequately against ontogenetic accidents. Environmental stress, in contrast to the other factors listed above, might act either directly (physiologic disruption during ontogeny) or indirectly (through disruption of the genome) to increase FA. We examined FA and overail morphometric variation in two species of sigmodontine rodents from a hazardous waste dump site and from nearby waste-free control areas. The mice from the waste site previously had been shown to have significantly higher levels of chromosome damage than those in the control areas. Differences in FA were found to be nonsignificant between waste and waste-free sites. In contrast, analysis of overall morphometric variation showed both species to differ significantly between sites, although the nature of this response contrasted sharply between the species. The finding of no differences in fluctuating asymmetry associated with the site differences is judged to be real, and we conclude that if genomic characteristics d o function to buffer the organism against asymmetry, this capability may not be affected by disruption at the gross chromosomal level. Key words: fluctuating asymmetry; developmental stability; morphometrics; mutagens; environmental stress; Peromyscus; Sigmodon.
Asymmetry is the difference in right-side and left-side expression of a characteristic in a bilateral organism. Mathematically, there are three expressions of asymmetry. Directional asymmetry pertains when the populational mean of the right-minus-left values is not zero. Antisymmetry, which includes skewness and kurtosis, occurs when the distribution of right-minus-left values is non-normal. Fluctuating asymmetry (FA) is the remaining right-left difference, and is expressed within a population as a normal distribution with a mean of zero. An evaluation of populational FA will measure, therefore, the amplitude (variance) of this normal distribution, generally with respect to that of another (reference) population.
The study of fluctuating asymmetry per se began with the work of a small group of researchers including Thoday (1953, 1956, 1958), Van Valen (1962), and Soulk (1966, 1967). Interest in the phenomenon then waned, but has revived within the last decade, perhaps due to a better general understanding of the genetics and evolutionary processes that might be involved. Early perceptions of the importance of FA were summarized by Jackson (1973), who pointed out that "the level of
320 THE TEXAS JOURNAL OF SCIENCE-VOL. 42, NO. 4,1990
fluctuating asymmetry has been considered a measure of buffering capacity in development, since any differences between paired structures that are nonconsistent are thought to result from developmental accidents (Thoday, 1958)," and further (following Souli, 1967) that "in particular, any factors that destroy coadapted gene complexes were hypothesized to increase asymmetry." Gene complexes presumably will become coadapted in stable populations in stable environments. Instability of either the population or the environment could presumably disrupt the genomic buffering capacity or render it ineffective in a novel or variable environment (Graham and Felley, 1985). Conditions under which this might occur, and which have been suggested as potentially resulting in increased FA, are hybrid zones, increased inbreeding, directional selection, and systemic or environmental stress (Palmer and Strobeck, 1986).
The relationship of systemic stress to fluctuating asymmetry is of particular interest, because there are two potential pathways for induction of FA by stress. It could be accomplished indirectly, by disruption of the genome (the mechanism presumably common to the conditions listed above); or it could occur by a more direct means in which the stress does not disrupt the genome, but exceeds some threshold beyond which it cannot buffer against ontogenetic accidents.
Previous evaluations of FA and environmental stress have not shown a clear pattern of results. Several studies have shown increased FA with increased stress, including various stress factors on several kinds of mammals and a fish species (Palmer and Strobeck, 1986). For instance, Bailit et al. (1970) found positive correlations between FA and general environmental stress in human populations; Siegel and Smookler (1973) and Siegel and Doyle (1975a) found an association with noise stress in Rattus; and Scuilli et al. (1979) found positive associations between FA and heat, cold, noise, and nutritional stresses in Rattus.
A number of studies concerning systemic stress effects on FA have had ambiguous results. Thoday (1956) and Bradley (1980) found results to differ among lab populations of Drosophila in studies of temperature effects on FA. Siegel and Doyle (1975b) similarly found no clear trend in studies of noise, cold, and behavioral stress on Mus and Peromyscus populations. Ames et al. (1979) found in studies of centrarchid fishes that heat did not affect FA levels, although mercury levels did. Jagoe and Haines (1985) were unable to determine with certainty whether FA levels in natural fish populations were affected by water pH levels. Few studies have shown no change in FA with increased stress-Palmer and Strobeck (1986) listed only one, in which Angus and Schultz (1983) evaluated FA levels in fishes subject to elevated temperatures.
It is extremely important also to ascertain more definitively the relationship between fluctuating asymmetry (and other complex forms of
FLUCTUATING ASYMMETRY AND MUTAGENS 32 1
morphometric variation), and any conditions involving genetic reorganization within and among populations. Several workers have examined the relationship between FA and enzyme heterozygosity levels. Most generally, these studies have found an inverse relationship between asymmetry and heterozygosity levels both among and within populations (for example, Soul&, 1979; Kat, 1982; Vrijenhoek and Lerman, 1982; Bidmont, 1983; Leary et al., 1983, 1984, 1985a, 19856; and Wayne et al., 1986). However, see Leary et al. (1984) for conflicting results, and Willig and Owen (1987a) for an opposing point of view on the Wayne et al. paper. Also, Patterson and Patton (1990) reported nonsignificant correlations between FA and heterozygosity among populations of pocket gophers. To our knowledge, no investigator has evaluated the relationship between fluctuating asymmetry and genetic variation at the gross chromosomal level, or with respect to variation in DNA content.
In the context of this background, we undertook to evaluate asymmetry and other morphometric variation in natural populations of two species of cricetid rodents occurring on a heavily polluted site in Brazos County, Texas, in comparison with appropriate control populations. Our sample specimens of both species of mice from the polluted site had been shown to have approximately four-fold increases in chromosomal lesions per cell, and similar increases in number of cells (per individual) in which chromosomal lesions were found (McBee et al., 1987). Also, one, species (Peromyscus) was examined using flow cytometry and was shown to have a significantly higher coefficient of variation of intraindividual cellular DNA content on the polluted site (McBee and Bickham, 1988). Thus, with the animals clearly registering genetic responses to the environmental contaminants, these populations should be exemplary models with which to evaluate fluctuating asymmetry and other morphometric phenomena potentially associated with systemic stress and genetic disruption.
Rodents were collected from natural populations occurring on a petrochemical waste disposal site and on two nearby control sites. Site conditions, trapping localities, and protocol were described in detail by McBee et ai. (1987). Of the several species occurring on the sites, the white-footed mouse, Peromyscus leucopus, and the hispid cotton rat, Sigmodon hispidus, were trapped in sufficient numbers for the statistical analyses described here (Table I). All animals used in this study were adults (see McBee et al., 1987, for age criteria). Preliminary tests indicated that individuals from the two control sites could be combined into a single sample. This was done to increase within-cell sample sizes in all statistical tests. In tests for directional asymmetry and antisymmetry, comparisons could be made between sexes and between experimental and control-site groups, with two groups in each of the two classification variables. In tests for fluctuating asymmetry, sexes also were combined to achieve adequate samples for each species.
Ten bilaterally symmetric osseous characters were measured on each side from the dental, cranial, and postcranial regions of each specimen. These characters and their acronyms are:
322 T H E TEXAS JOURNAL O F SCIENCE-VOL. 42, NO. 4,1990
TOOTH-length of maxillary molariform toothrow; ORB-greatest anterior-posterior diameter of orbit as circumscribed by zygomatic arch; INCF-length of incisive foramen; M.4XZY-minimum anterior-posterior breadth of maxillary portion of zygomatic arch; MTOOT-length of mandibular molariform toothrow; LATPR-height from base of mandible to tip of posterio-lateral process (approximately opposite mandibular foramen); POSTM-length from tip of angular process to anterior face of molar shelf; ATLAS- distance on atlas from tip of spinous process to inferior tip of occipital fossa rim; METAC-length of third metacarpal; and METAT-length of third metatarsal.
Each asymmetry value was made scale-free by dividing the character's right-minus-left difference by the mean of the right and left value for that individual. Scale-freeness of each character was confirmed for each species separately by evaluating the product-moment correlations across all specimens between each individual's asymmetry value, and a size variable defined as the right-left mean for that individual.
Directional asymmetry (DA) was evaluated for each character within each group (defined as a particular species-sex-site combination). In each case, a t-test was used to evaluate the null hypothesis that the mean was not different from zero. DA was corrected for within each of these groups separately by subtracting the group mean asymmetry value from each specimen's value for that character. For each species, antisymmetry (skewness and kurtosis) was tested for in each sex-site group, and again in each site combination. These tests were done on the values that had been corrected for directional asymmetry. For tests of fluctuating asymmetry, directional asymmetry was corrected for within each species-site combination only, so that the mean of each of these four groups would be zero for each character. The Shapiro-Wilk statistic (SAS Institute, Inc., 1985) was used to evaluate antisymmetry of each character for each species-sex-site group, and for each species-site group.
Given normal (or normalized) distributions with zero means, tests for differences in fluctuating asymmetry are simply tests for heterogeneity of variances. We did this using two methods. We first used a multivariate generalization of the Scheffh-Box test (Sokal and Rohlf, 1981) for heterogeneity of variances among groups. Because this test greatly reduces the cell sample sizes (to approximately the square root of the number of individuals for each cell), error degrees of freedom were sufficient only to test for differences between species and sites (but not sexes-a two-way test). Secondly, each variable also was tested individually for between-site differences in FA by means of Levene's test (Brown and Forsythe, 1974) for heterogeneity of variances, which is very robust to non-normal sample distributions. Also, for the experimental-site populations alone, a multiple regression analysis was performed to assess the effects of three measures of genetic disruption in Peromyscus (two in Sigmodon) on each asymmetry variable across all individuals.
General morphometric difference between control and experimental sites, between species, and due to interactive effects also were assessed with a two-way MANOVA, and with a two- way ANOVA of each character separately, of the same characters used in the asymmetry analyses, but not transformed to asymmetry values. Regression analysis of the 10 morphometric characters on the three measures of genetic disruption was used to evaluate which genetic measure(s) might best predict the observed site-related differences in each species.
All but one asymmetry variable was found to be scale-free; metatarsal length in Sigmodon had a correlation value with its size variable of -0.37, P < 0.044. Of the remaining variables, maxillary zygomatic breadth in Sigmodon was most significantly correlated with its size variable (r = -0.166, P > 0.26); in Peromyscus, maxillary toothrow
FLUCTUATING ASYMMETRY A N D MUTAGENS 323
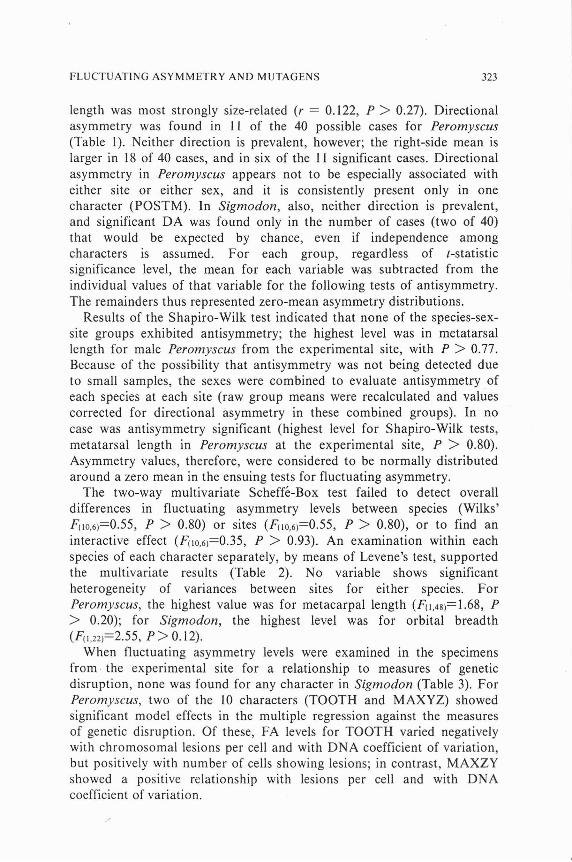
length was most strongly size-related (r = 0.122, P > 0.27). Directional asymmetry was found in 11 of the 40 possible cases for Peromyscus (Table 1). Neither direction is prevalent, however; the right-side mean is larger in 18 of 40 cases, and in six of the 11 significant cases. Directional asymmetry in Peromyscus appears not to be especially associated with either site or either sex, and it is consistently present only in one character (POSTM). In Sigmodon, also, neither direction is prevalent, and significant DA was found only in the number of cases (two of 40) that would be expected by chance, even if independence among characters is assumed. For each group, regardless of t-statistic significance level, the mean for each variable was subtracted from the individual values of that variable for the following tests of antisymmetry. The remainders thus represented zero-mean asymmetry distributions.
Results of the Shapiro-Wilk test indicated that none of the species-sex- site groups exhibited antisymmetry; the highest level was in metatarsal length for male Peromyscus from the experimental site, with P > 0.77. Because of the possibility that antisymmetry was not being detected due to small samples, the sexes were combined to evaluate antisymmetry of each species at each site (raw group means were recalculated and values corrected for directional asymmetry in these combined groups). In no case was antisymmetry significant (highest level for Shapiro-Wilk tests, metatarsal length in Peromyscus at the experimental site, P > 0.80). Asymmetry values, therefore, were considered to be normally distributed around a zero mean in the ensuing tests for fluctuating asymmetry.
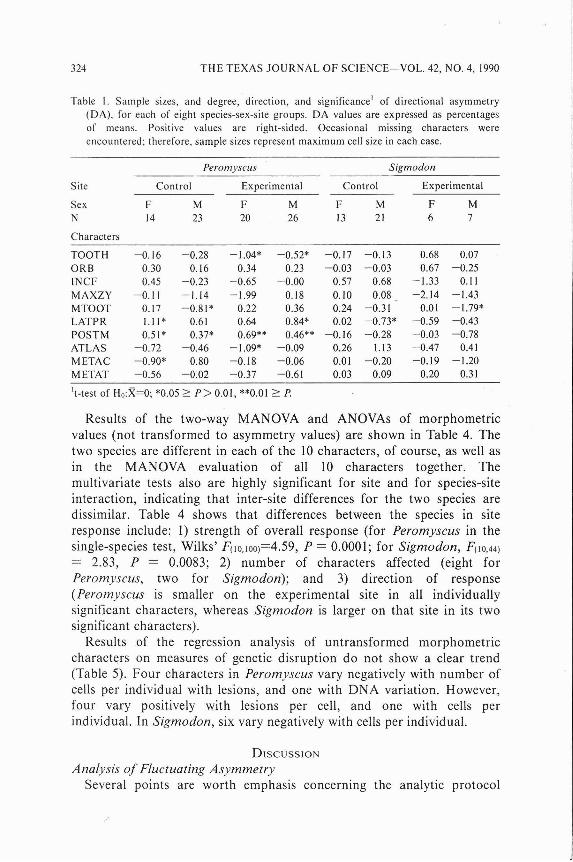
The two-way multivariate Scheffk-Box test failed to detect overall differences in fluctuating asymmetry levels between species (Wilks' F(10,6)=0.55, P > 0.80) or sites (&lo,sj=O.55, P > 0.80), or to find an interactive effect (F(10,6)=0.35, P > 0.93). An examination within each species of each character separately, by means of Levene's test, supported the multivariate results (Table 2). No variable shows significant heterogeneity of variances between sites for either species. For Peromyscus, the highest value was for metacarpal length (F(1,48)=1.68, P > 0.20); for Sigmodon, the highest level was for orbital breadth (F[1,zzj=2.55, P > 0.12).
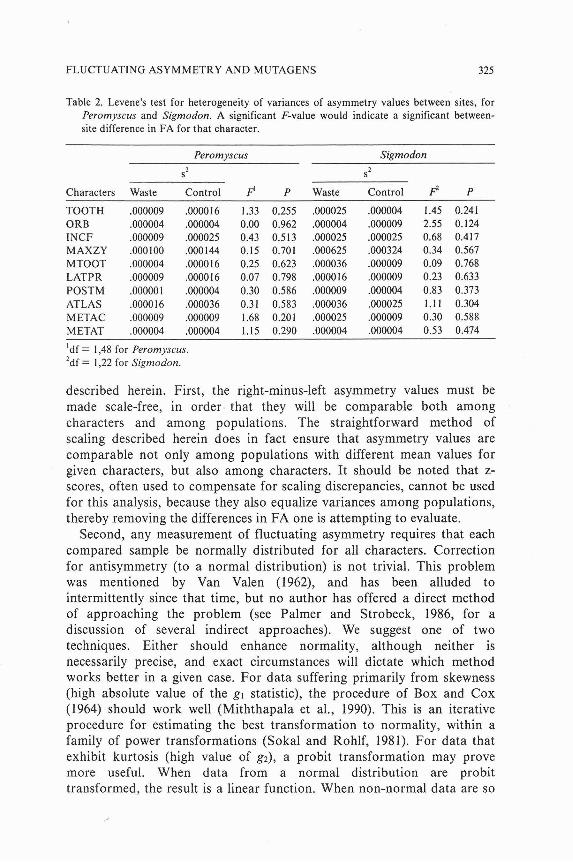
When fluctuating asymmetry levels were examined in the specimens from the experimental site for a relationship to measures of genetic disruption, none was found for any character in Sigmodon (Table 3). For Peromyscus, two of the 10 characters (TOOTH and MAXYZ) showed significant model effects in the multiple regression against the measures of genetic disruption. Of these, FA levels for TOOTH varied negatively with chromosomal lesions per cell and with DNA coefficient of variation, but positively with number of cells showing lesions; in contrast, MAXZY showed a positive relationship with lesions per cell and with DNA coefficient of variation.
324 T H E TEXAS JOURNAL O F SCIENCE-VOL. 42, NO. 4,1990
Table I. Sample sizes, and degree, direction, and significancet of directional asymmetry (DA), for each of eight species-sex-site groups. DA values are expressed as percentages of means. Positive values are right-sided. Occasional missing characters were encountered; therefore, sample sizes represent maximum cell size in each case.
Peromyscus Sigmodon
Site Control Experimental Control Experimental
Sex F M F M F M F M N 14 23 20 26 13 21 6 7
Characters
TOOTH ORB INCF MAXZY MTOOT LATPR POSTM ATLAS METAC M ETAT
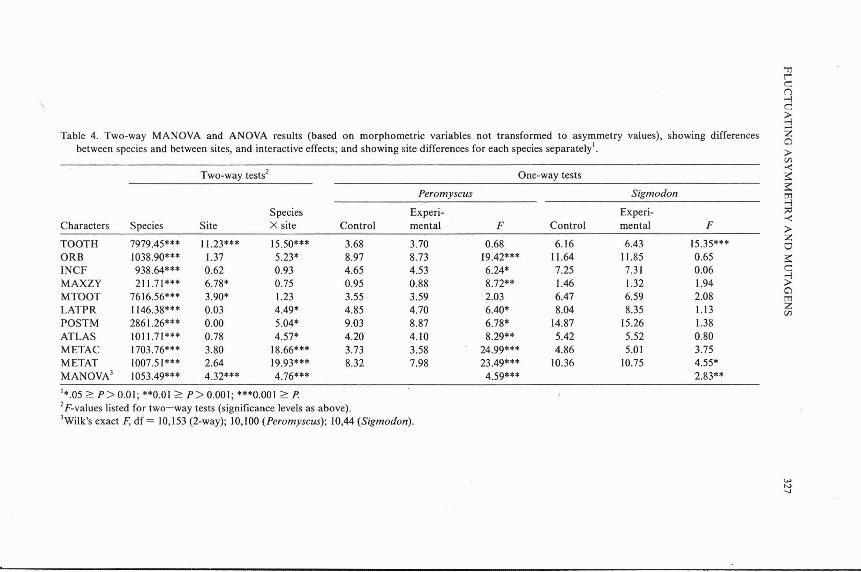
Results of the two-way MANOVA and ANOVAs of morphometric values (not transformed to asymmetry values) are shown in Table 4. The two species are different in each of the 10 characters, of course, as well as in the MANOVA evaluation of all 10 characters together. The multivariate tests also are highly significant for site and for species-site interaction, indicating that inter-site differences for the two species are dissimilar. Table 4 shows that differences between the species in site response include: 1) strength of overall response (for Peromyscus in the single-species test, Wilks' F ' ( I o , I o o , = ~ . ~ ~ , P = 0.0001; for Sigmodon, F(10,44)
= 2.83, P = 0.0083; 2) number of characters affected (eight for Peromyscus, two for Sigmodon); and 3) direction of response (Peromyscus is smaller on the experimental site in all individually significant characters, whereas Sigmodon is larger on that site in its two significant characters).
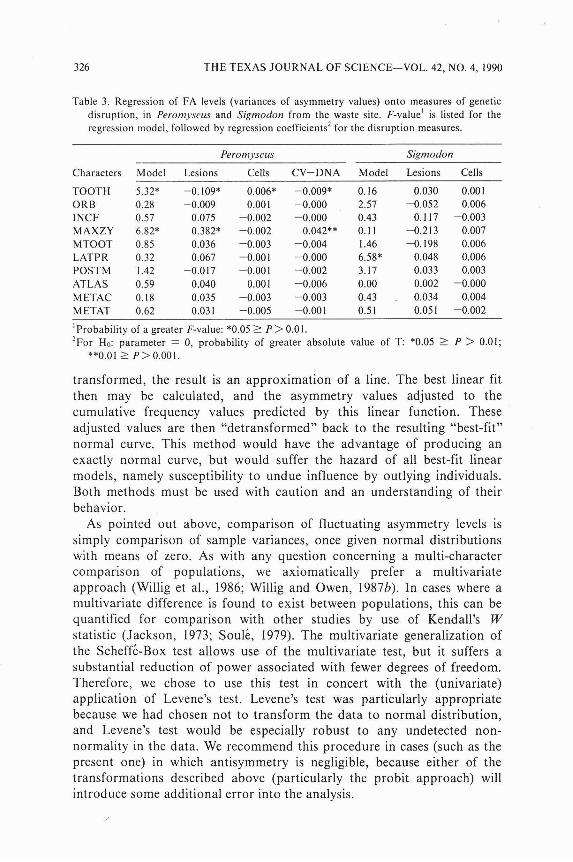
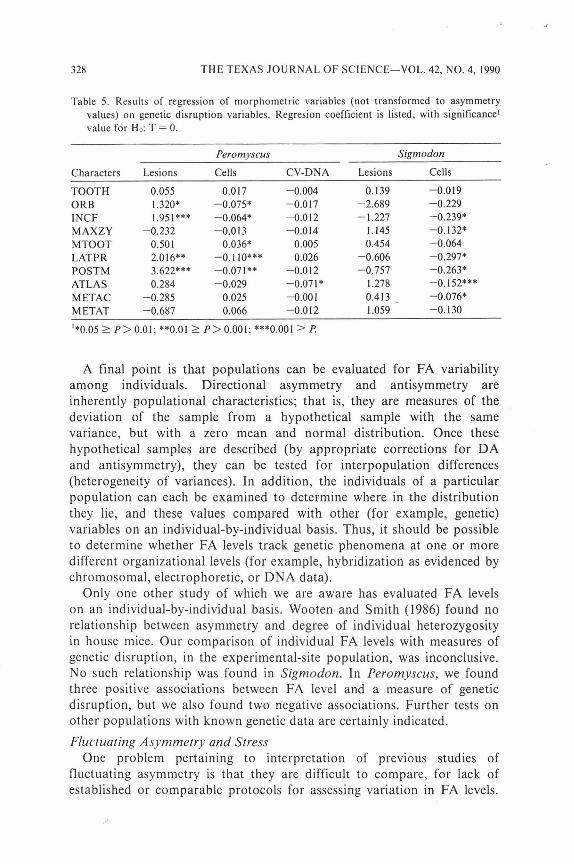
Results of the regression analysis of untransformed morphometric characters on measures of genetic disruption do not show a clear trend (Table 5). Four characters in Peromyscus vary negatively with number of cells per individual with lesions, and one with DNA variation. However, four vary positively with lesions per cell, and one with cells per individual. In Sigmodon, six vary negatively with cells per individual.
DISCUSSION Analysis of Fluctuating Asymmetry
Several points are worth emphasis concerning the analytic protocol
FLUCTUATING ASYMMETRY AND MUTAGENS 325
Table 2. Levene's test for heterogeneity of variances of asymmetry values between sites, for Peromyscus and Sigmodon. A significant F-value would indicate a significant between- site difference in FA for that character.
Peromyscus Sigmodon
s2 sZ
Characters Waste Control F' P Waste Control P
TOOTH .000009 .000016 1.33 0.255 .000025 .000004 1.45 0.241 ORB .000004 .000004 0.00 0.962 .000004 .000009 2.55 0.124 INCF .000009 .000025 0.43 0.513 .000025 .000025 0.68 0.417 MAXZY .000100 .000144 0.15 0.701 ,000625 ,000324 0.34 0.567 MTOOT .000004 .000016 0.25 0.623 .000036 .000009 0.09 0.768 LATPR .000009 .000016 0.07 0.798 ,000016 .000009 0.23 0.633 POSTM .000001 .000004 0.30 0.586 .000009 .000004 0.83 0.373 ATLAS .000016 .000036 0.31 0.583 .000036 .000025 1.1 1 0.304 METAC .000009 .000009 1.68 0.201 .000025 .000009 0.30 0.588 METAT .000004 .000004 1.15 0.290 .000004 .000004 0.53 0.474
'df = 1,48 for Peromyscus. 2df = 1,22 for Sigmodon.
described herein. First, the right-minus-left asymmetry values must be made scale-free, in order that they will be comparable both among characters and among populations. The straightforward method of scaling described herein does in fact ensure that asymmetry values are comparable not only among populations with different mean values for given characters, but also among characters. It should be noted that z- scores, often used to compensate for scaling discrepancies, cannot be used for this analysis, because they also equalize variances among populations, thereby removing the differences in FA one is attempting to evaluate.
Second, any measurement of fluctuating asymmetry requires that each compared sample be normally distributed for all characters. Correction for antisymmetry (to a normal distribution) is not trivial. This problem was mentioned by Van Valen (1962), and has been alluded to intermittently since that time, but no author has offered a direct method of approaching the problem (see Palmer and Strobeck, 1986, for a discussion of several indirect approaches). We suggest one of two techniques. Either should enhance normality, although neither is necessarily precise, and exact circumstances will dictate which method works better in a given case. For data suffering primarily from skewness (high absolute value of the gl statistic), the procedure of Box and Cox (1964) should work well (Miththapala et al., 1990). This is an iterative procedure for estimating the best transformation to normality, within a family of power transformations (Sokal and Rohlf, 1981). For data that exhibit kurtosis (high value of g2), a probit transformation may prove more useful. When data from a normal distribution are probit transformed, the result is a linear function. When non-normal data are so
326 T H E TEXAS JOURNAL O F SCIENCE-VOL. 42, NO. 4,1990
Table 3. Regression of FA levels (variances of asymmetry values) onto measures of genetic disruption, in Peromyscus and Sigmodon from the waste site. F-value' is listed for the regression model, followed by regression coefficients2 for the disruption measures.
Peromyscus Sigmodon
Characters Model Lesions Cells CV-DNA Model Lesions Cells
TOOTH ORB INCF M AXZY MTOOT LATPR POSTM ATLAS M ETAC M ETAT
'Probability of a greater F-value: *0.05 2 P > 0.01. or Ho: parameter = 0, probability of greater absolute value of T: *0.05 5 P > 0.01;
**0.01 1 P > 0.001.
transformed, the result is an approximation of a line. The best linear fit then may be calculated, and the asymmetry values adjusted to the cumulative frequency values predicted by this linear function. These adjusted values are then "detransformed" back to the resulting "best-fit" normal curve. This method would have the advantage of producing an exactly normal curve, but would suffer the hazard of all best-fit linear models, namely susceptibility to undue influence by outlying individuals. Both methods must be used with caution and an understanding of their behavior.
As pointed out above, comparison of fluctuating asymmetry levels is simply comparison of sample variances, once given normal distributions with means of zero. As with any question concerning a multi-character comparison of populations, we axiomatically prefer a multivariate approach (Willig et al., 1986; Willig and Owen, 19876). In cases where a multivariate difference is found to exist between populations, this can be quantified for comparison with other studies by use of Kendall's W statistic (Jackson, 1973; Soul;, 1979). The multivariate generalization of the Scheffk-Box test allows use of the multivariate test, but it suffers a substantial reduction of power associated with fewer degrees of freedom. Therefore, we chose to use this test in concert with the (univariate) application of Levene's test. Levene's test was particularly appropriate because we had chosen not to transform the data to normal distribution, and Levene's test would be especially robust to any undetected non- normality in the data. We recommend this procedure in cases (such as the present one) in which antisymmetry is negligible, because either of the transformations described above (particularly the probit approach) will introduce some additional error into the analysis.
a i- C
7 C
3 Table 4. Two-way MANOVA and ANOVA results (based on morphometric variables not transformed to asymmetry values), showing differences
between species and between sites, and interactive effects; and showing site differences for each species separatelyt. > cn
Two-way testsZ One-way tests 2 Peromyscus Sigmodon 5
4 Species Experi- Experi- ;a
F F -e
Characters Species Site X site Control mental Control mental > TOOTH 7979.45*** 11.23*** 15.50*** 3.68 3.70 0.68 6.16 6.43 15.35***
z u
ORB 1038.90*** 1.37 5.23* 8.97 8.73 19.42*** 11.64 11.85 0.65 3 INCF 938.64*** 0.62 0.93 4.65 4.53 6.24* 7.25 7.31 0.06 C MAXZY 21 1.71*** 6.78* 0.75 0.95 0.88 8.72** 1.46 1.32 1.94 2 MTOOT 7616.56*** 3.90* 1.23 3.55 3.59 2.03 6.47 6.59 2.08
n m
LATPR 1146.38*** 0.03 4.49* 4.85 4.70 6.40* 8.04 8.35 1.13 5 POSTM 2861.26*** 0.00 5.04* 9.03 8.87 6.78" 14.87 15.26 1.38 ATLAS 101 1.71*** 0.78 4.57* 4.20 4.10 8.29** 5.42 5.52 0.80 METAC 1703.76*** 3.80 18.66*** 3.73 3.58 24.99*** 4.86 5.01 3.75 M ETAT 1007.51*** 2.64 19.93*** 8.32 7.98 23.49*** 10.36 10.75 4.55* MANOVA' 1053.49*** 4.32*** 4.76*** 4.59*** 2.83**
'*.05 1 P > 0.01; **O.OI 1 P > 0.001; ***0.001 1 P. 2~-values listed for two-way tests (significance levels as above). ilk's exact F, df = 10,153 (2-way); 10,100 (Peromyscus); 10,44 (Sigmodon).
328 THE TEXAS JOURNAL O F SCIENCE-VOL. 42, NO. 4,1990
Table 5. Results of regression of morphometric variables (not transformed to asymmetry values) on genetic disruption variables. Regresion coefficient is listed, with significance' value for Ho: T = 0.
Peromyscus Sigmodon
Characters Lesions Cells CV-DNA Lesions Cells
TOOTH 0.055 0.017 -0.004 0.139 -0.019 ORB 1.320* -0.075* -0.017 -2.689 -0.229 INCF 1.951*** -0.064* -0.0 12 - 1.227 -0.239; MAXZY -0.232 -0.0 I3 -0.014 1.145 -0.132* MTOOT 0.501 0.036* 0.005 0.454 -0.064 L ATPR 2.016** -0.1 lo*** 0.026 -0.606 -0.297* POSTM 3.622*** -0.071** -0.012 -0.757 -0.263* ATLAS 0.284 -0.029 -0.071* 1.278 -0.152*** METAC -0.285 0.025 -0.001 0.413 - -0.076* M ETAT -0.687 0.066 -0.012 1.059 -0.130
'*0.05 1 P > 0.01; **0.01 1 P > 0.001; ***0.001 2 f!
A final point is that populations can be evaluated for FA variability among individuals. Directional asymmetry and antisymmetry are inherently populational characteristics; that is, 'they are measures of the deviation of the sample from a hypothetical sample with the same variance, but with a zero mean and normal distribution. Once these hypothetical samples are described (by appropriate corrections for D A and antisymmetry), they can be tested for interpopulation differences (heterogeneity of variances). In addition, the individuals of a particular population can each be examined to determine where in the distribution they lie, and these values compared with other (for example, genetic) variables on an individual-by-individual basis. Thus, it should be possible to determine whether FA levels track genetic phenomena at one or more different organizational levels (for example, hybridization as evidenced by chromosomal, electrophoretic, or DNA data).
Only one other study of which we are aware has evaluated FA levels on an individual-by-individual basis. Wooten and Smith (1986) found no relationship between asymmetry and degree of individual heterozygosity in house mice. Our comparison of individual FA levels with measures of genetic disruption, in the experimental-site population, was inconclusive. No such relationship was found in Sigmodon. In Peromyscus, we found three positive associations between FA level and a measure of genetic disruption, but we also found two negative associations. Further tests on other populations with known genetic data are certainly indicated.
Fluctuating Asymmetry and Stress One problem pertaining to interpretation of previous studies of
fluctuating asymmetry is that they are difficult to compare, for lack of established or comparable protocols for assessing variation in FA levels.
FLUCTUATING ASYMMETRY A N D MUTAGENS 329
It is quite probable, in fact, that some of these papers have not accurately evaluated FA at all (see Willig et al., 1987a, and Modi et al., 1987, for a discussion of this issue). A second problem in interpreting a series of published papers, such as those listed earlier in which increased heterozygosity was generally associated with decreased FA levels, is that the failure to demonstrate a populational difference does not demonstrate that the null hypothesis is true (that the samples have in fact been taken from one statistical population), and thus there often is no clear conclusion from such tests; investigators generally are reluctant to report, or are editorially discouraged from reporting, statistically nonsignificant results. It is, indeed, hard to obtain convincing negative results, and for all of these reasons it will be less likely over the long run to see a large list of papers in which the null hypothesis (in this case, no relation between FA and heterozygosity) is not rejected.
In the present study, no differences, either multivariate or univariate, were found in fluctuating asymmetry levels between sites or between species. However, it is important to note that this data set is sufficient to demonstrate overall morphometric differences between sites in each species, and to detail the complex differences in site response between species. We suggest, therefore, that our finding of no differences in FA is real, and believe that these are unambiguous results showing that a demonstrably mutagenic environment had no detectable effect on FA in two species of cricetid rodents. If genomic characteristics do function to buffer these organisms against asymmetry, such capabilities may not be affected by disruption at the gross chromosomal level.
General Morphometrics and Stress The results of the morphometric analysis are especially interesting in
the context of the asymmetry results. In the two-way tests using both species (Table 4), significant differences between sites are found in three characters, and the multivariate result shows the two sites to be quite different. Also, the majority of characters show a significant interactive effect, and the multivariate interactive effect is highly significant. This means that the two species differ considerably in the nature of their response to site differences.
Patterns of differentiation were shown to be fairly complex when site differences were examined separately in each species. There is an apparent difference in overall strength of response, though that may be due to the smaller sample of cotton rats from the waste site. There are differences in: 1) number of characters involved, 2) which characters are involved, and 3) direction of response. In all significant characters, Peromyscus is smaller on the waste site, but in both significant characters and most of the others, Sigmodon is larger on that site.
It is unclear why these differences in response might occur between
330 T H E TEXAS JOURNAL O F SCIENCE-VOL. 42, NO. 4,1990
species. Certainly several possibilities exist, which we are unable to evaluate. Ages may be distributed unequally between sites and species. Even among adults, some cricetids (especially Sigmodon) are known to vary in size among age classes. If such a discrepancy occurs in our specimens, it could be a result of sampling error, or differing life history responses to the contaminants.
It is conceivable also that the observed differences are "real"; that is, all other relevant variables are in fact equal between groups, and we are observing species-differential phenotypic responses to genetic disruption. If this is the case, however, the response differences must again be fairly complex in nature. From the regression analysis of untransformed variables on measures of genetic disruption (Table S) , it appears in general that an increase in the number of affected cells per individual is associated with smaller size in both species (not just Peromyscus). Also, in Peromyscus an increase in chromosomal lesions per cell is associated with an increase in size in at least some characters. Thus, no measure of genetic disruption appears to explain observed inter-site differences in either species, much less to explain the inter-species differences in site response.
We conclude with two caveats. First, in any study of correspondence between morphologic and genetic or chromosomal characteristics, one cannot simply evaluate a single common species as a model system. In the present case, two relatively closely-related species responded quite differently in morphology although their chromosomal responses were quite comparable. Second, although the hypothesis of environmental stress leading to disruption of genomic buffering is intuitively pleasing, the mechanisms have not been demonstrated. The literature is quite unclear on the nature of this pathway, and in fact on whether such a mechanism exists. Our results suggest that if this mechanism does exist, genomic buffering capabilities do not suffer from genetic disruptions at the gross chromosomal level.
We thank Richard A. Pimentel, Michael R. Willig, and Bruce D. Patterson for taking the time to provide thoughtful criticisms of this paper. In addition, Fred W. Allendorf and Robert C. Vrijenhoek provided critical comments. In fairness to these people, we should state that not all suggestions were incorporated into the paper. Sue Knauff provided word processing through the later and final drafts of the paper. This study was completed with the support of NSF grant BSR-882250, and a grant from the Weldon Springs Endowment Fund.
Ames, L., J. Felley and M. H. Smith. 1979. Amounts of asymmetry in centrarchid fish inhabiting heated and nonheated reservoirs. Trans. Amer. Fish. Soc., 108: 489-495.
FLUCTUATING ASYMMETRY AND MUTAGENS 33 1
Angus, R. A., and R. H. Schultz. 1983. Meristic variation in homozygous and heterozygous fish. Copeia, 1983: 287-299.
Bailit, H. L., P. L. Workmen, J . D. Niswander, and C. J . MacLean. 1970. Dental asymmetry as an indicator of genetic and environmental conditions in human populations. Human Biol., 42: 626-638.
Biimont, C. 1983. Homeostasis, enzymatic heterozygosity and inbreeding depression in natural populations of Drosophila melanogaster. Genetica, 61:179-189.
Box, G. E. P., and D. R. Cox. 1964. An analysis of transformations. J. Royal Stat. Soc., ser. B, 26:2 1 1-243.
Bradley, B. P. 1980. Developmental stability of Drosophila melanogaster under artificial and natural selection in constant and fluctuating environments. Genetics, 95:1033-1042.
Brown, M. B., and A. B. Forsythe. 1974. Robust tests of equality of variances. J. Amer. Stat. Assoc., 69:364-367.
Graham, J . H., and J. D. Felley. 1985. Genomic coadaptation and developmental stability within introgressed populations of Enneacanthus gloriosus and E. obesus (Pisces, Centrarchidae). Evolution, 39: 104-1 14.
Jackson, J. F. 1973. A search for the population asymmetry parameter. Syst. Zool., 22:166- 170.
Jagoe, C. H., and T. A. Haines. 1985. Fluctuating asymmetry in fishes inhabiting acidified and unacidified lakes. Canadian J . Zool., 63:130-138.
Kat, P. W. 1982. The relationship between heterozygosity for enzyme loci and developmental homeostasis in peripheral populations of aquatic bivalves (Unionidae). Amer. Nat., 119:824-832.
Leary, R. F., F. W. Allendorf, and R. L. Knudson. 1983. Developmental stability .and enzyme heterozygosity in rainbow trout. Nature, 301:71-72.
-. 1984. Superior developmental stability of heterozygotes of enzyme loci in salmonid fishes. Amer. Nat., 124540-55 1.
----. 1985a. Inheritance of meristic variation and the evolution of developmental stability in rainbow trout. Evolution, 39:308-314.
-. 19856. Developmental instability and high meristic counts in interspecific hybrids of salmonid fishes. Evolution, 39: 13 18-1326.
McBee, K., and J . W. Bickham. 1988. Petrochemical related DNA damage in wild rodents detected by flow cytometry. Bull. Environmental Contaminants and Toxicology, 40: 343- 349.
McBee, K., J . W. Bickham, K. W. Brown, and K. C. Donnelly. 1987. Chromosomal aberrations in native small mammals (Peromyscus leucopus and Sigmodon hispidus) at a petrochemical waste disposal site: I. Standard karyology. Arch. Environmental Contaminants and Toxicology, 16: 681-688.
Miththapala, S., J . Seidensticker, J. A. Smallwood, L. G. Phillips, and S. B. U. Fernando. 1990. Fluctuating asymmetry in Sri Lankan leopards. Submitted to Zoo Biology.
Modi, W. S., R. K. Wayne, and S. J. O'Brien. 1987. Analysis of fluctuating asymmetry in cheetahs. Evolution, 41: 227-228.
Palmer, A. R., and C. Strobeck. 1986. Fluctuating asymmetry: measurement, analysis, patterns. Ann. Rev. Ecol. Syst., 17: 391-421.
Patterson, B. D., and J . L. Patton. 1990. Fluctuating asymmetry and allozymic heterozygosity among natural populations of pocket gophers (Thomomys bottae). Biol. J. Linnean Soc., in press.
SAS Institute Inc. 1985. User's guide: Basics, version 5 edition. SAS Institute, Inc., Cary, North Carolina, 1290 pp.
Scuilli, P. W., W. J . Doyle, C. Kelley, P. Siegel, and M. I. Siegel. 1979. The interaction of stressors in the induction of increased levels of fluctuating asymmetry in the laboratory rat. J . Phys. Anthro., 50:279-284.
332 THE TEXAS JOURNAL O F SCIENCE-VOL. 42, NO. 4,1990
Siegel, M. I., and W. J. Doyle. 19750. Differential effects of prenatal and postnatal audiogenic stress on fluctuating dental asymmetry. J . Exp. Zool., 191:211-214.
-- . 19756. Stress and fluctuating asymmetry in various species of rodents. Growth, 39:363-369.
Siegel, M. I., and H. H. Smookler. 1973. Fluctuating dental asymmetry and audiogenic stress. Growth, 37: 35-39.
Sokal, R. R., and F. J. Rohlf. 1981. Biometry. W. H. Freeman and Co., New York, 2nd ed, xviii + 859 pp.
Soul;, M. 1966. Trends in the insular radiation of a lizard. Amer. Nat., 100:47-64. -. 1967. Phenetics of natural populations. 11. Asymmetry and evolution in a lizard.
Arner. Nat., 101: 141-160. -. 1979. Heterozygosity and developmental stability: another look. Evolution, 33:396-
401. Thoday, J. M. 1953. Components of fitness. Symp. Soc. Exp. Biol., 7:96-113. -. 1956. Balance, heterozygosity and developmental stability. Cold Spring Harbor
Symp. Quant. Biol., 21:318-326. -. 1958. Homeostasis in a selection experiment. Heredity, 12:401-415. Van Valen, L. 1962. A study of fluctuating asymmetry. Evolution, 16: 125-142. Vrijenhoek, R. C., and S. Lerrnan. 1982. Heterozygosity and developmental stability under
sexual and asexual breeding systems. Evolution, 36:768-776. Wayne, R. K., W. S. Modi, and S. J . O'Brien. 1986. Morphological variability and
asymmetry in the cheetah (Acinonyx jubatus), a genetically uniform species. Evolution, 40:78-85.
Willig, M. R. and R. D. Owen. 1987a. Fluctuating asymmetry in the cheetah: methodological and interpretive concerns. Evolution, 41:225-227.
-. 19876. Univariate analyses of morphometric variation do not emulate the results of multivariate analyses. Syst. Zool., 36:398-400.
Willig, M. R., R. D. Owen, and R. L. Colbert. 1986. Assessment of morphometric variation in natural populations: the inadequacy of the univariate approach. Syst. Zool., 35:195- 203.
Wooten, M. C., and M. H. Smith. 1986. Fluctuating asymmetry and genetic variability in a natural population of Mus musculus. J. Mamm., 67: 725-732.