“analysis of banking v/s non banking financial...
TRANSCRIPT

“Analysis of Banking V/S Non banking Financial Companies" Management Research Project -II
Submitted In the partial fulfillment of the Degree of Master of Business Administration
Semester-IV
By
1. Desai Mittal B. - 12044311019
2. Patel Hiren M. - 12044311088 3. Patel Kinjal P. - 12044311101 4. Patel Kinjal V. - 12044311102 5. Patel Krushnkant B. - 12044311104
Under the Guidance of
Prof. (Dr.) Mahendra Sharma Prof. & Head
V. M. Patel Institute of Management. &
Jayesh D. Patel Assistant Professor
V. M. Patel Institute of Management
Submitted To
V. M. Patel Institute of Management
(April 2014)

CERTIFICATE BY THE GUIDE
This is to certify that the contents of this report entitled “Analysis of Banking V/S
Non banking Financial Companies" submitted to V. M. Patel Institute of
Management for the Award of Master of Business Administration (MBA Sem-IV)
is original research work carried out by him/her/them under my supervision. This
report has not been submitted either partly or fully to any other University or
Institute for award of any degree or diploma.
Name Exam number
1. Desai Mittal B. - 12044311019
2. Patel Hiren M. - 12044311088 3. Patel Kinjal P. - 12044311101 4. Patel Kinjal V. - 12044311102 5. Patel Krushnkant B. - 12044311104
Professor & Head,
V. M. Patel Institute of Management,
Ganpat University.
Kherva.
Date:
Place: Kherva

CANDIDATE’S STATEMENT
We hereby declare that the work incorporated in this report entitled “Analysis of
Banking V/S Non banking Financial Companies" in partial fulfillment of the
requirements for the award of Master of Business Administration (Sem.-IV) is the
outcome of original study undertaken by us and it has not been submitted earlier to
any other University or Institution for the award of any Degree or Diploma.
Name Exam number Sign
1. Desai Mittal B. - 12044311019
2. Patel Hiren M. - 12044311088 3. Patel Kinjal P. - 12044311101 4. Patel Kinjal V. - 12044311102 5. Patel Krushnkant B. - 12044311104
Date:
Place: kherva

PREFACE
As a part of the MBA curriculum and in order to gain practical knowledge in the field of
management, we are required to make a report on any management research related topic.
One can deny for the importance of the practical exposure of the problem for its better
understanding and better grip of coming out with an industrially acceptable solution.
The basic objective behind doing this report is to gain the knowledge about the Banks and nbfc.
Now a day, management is an art, which we should learn by heart, and we believe that art by
studying it practically rather than reading the books. Management is must for every company,
every organization, not only this but also it is must for every person.
The Master of Business Administration is a professional course, which develops a new level of
knowledge & skills and sets & prepares those seeking challenging carriers in the new era of
Liberalization, and Globalization. MBA Programme imparts the knowledge of concept &
application skills of management.
In MBA Semester-IV, we are required to prepare a report on to fulfill this requirement of the
syllabus; we have prepared a report on “Analysis of Banking V/S Non banking
Financial Companies"

ACKNOWLEDGEMENT
Knowledge is itself a continuous process. But at this moment of our substantial enhancement we
find no words to express my gratitude to those who had helped me directly or indirectly in
making this report a success. We are indebted and thankful for the assistance received from
various individuals.
It is indeed of great moment to pleasure to express our sense of per found gratitude and ineptness
to all the people who have been instrumental in making our learning a rich experience. We got
the opportunity to do a challenging project in Management Research Project-II. The project is
the important part of our study and gives us a practical exposure to management research its
implementation and it is almost impossible to do the same without the guidance of people in and
around us.
We hereby take the pleasure of thanking all who have contributed to the making of this report.
Firstly we would like to thank Prof. (Dr.) Mahendra Sharma, Prof. Jayesh Patel, Prof.
Abhishek parikh, Who have provided us full liberty, co–operation during our Report and
sharing knowledge of his field with us always with a smile.
We are greatly thankful to my parent, seniors, friends and colleagues for their kind and constant
inspiration and loving support through many days when they wondered where the priorities lay.
Name Exam number
1. Desai Mittal B. - 12044311019
2. Patel Hiren M. - 12044311088 3. Patel Kinjal P. - 12044311101 4. Patel Kinjal V. - 12044311102 5. Patel Krushnkant B. - 12044311104

EXECUTIVE SUMMARY
The study presents a comparative study of NBFC’s in India. There are almost 13000 registered
NBFC’s in India. The study is aimed to provide an holistic view of the NBFC Industry. NBFC
fulfills the financial gap by providing loan at a lower rate of interest. The major players of each
field
1) Housing Finance Industry: LIC Housing Finance.
2) Infrastructure Finance Industry: IDFC
3) Asset Financing: Shriram Transport Finance
4) Composite: Reliance Capital
The study also compared the Indian Banks v/s NBFC. It was found that at even at the time of the
economic slowdown NBFC was more profitable. The industry is not tightly regulated as there
are many regulatory bodies. Hence, there was an important need to study the NBFC as the
industry plays an important role in the financial Services market of INDIA.
In our project, we can say that investors are more protecting investing in bank sectors comparing
non banking financial sectors.

CONTENTS
Certificate by the Guide I
Candidate’s Statement II
Preface III
Acknowledgments IV
Executive summary V
CH.No PARTICULAR PAGE NO.. 1.0 INTRODUCTION OF NON BANK FINANCIAL
COMPANIES 1
1.1 Background 2 1.2 NBFCs: Banking on new areas? 4 1.3 Regulation 5 1.4 Classification 5 1.5 NBFCs' strengths 6 1.6 Difference Between NBFC and Bank 8 1.7 Significance of NBFCs in India 9
2.0 REVIEW OF RELATED LITERATURE 11 2.1 Literature review 12
3.0 RESPONSIBILITIES OF NBFC 15 3.1 Guidelines for new deposits 16 3.2 NBFCs are typically into funding of 17 3.3 List of major products offered by NBFCs in India 18 3.4 Responsibilities 18
4.0 RESEARCH METHODOLOGY 19 4.1 Introduction 20 4.2 Motivation of the study 21 4.3 Statement of the problem & Objectives of the Study 22 4.4 Scope of the study 22 4.5 Significance of the study 23 4.6 Hypotheses of the study 24 4.7 Research Methodology 25 4.7.1 Sample Frame and Sample Size 25 4.7.2 Data Analysis 26 4.8 Limitation of the study 29

5.0 DATA ANALYSIS & INTERPRETATION 30 5.1 Analysis of banking vs. non banking financial companies 31
6.0 FINDINGS 44
7.0 CONCLUSION 47 APPENDICES 49 1. Bibliography 49 2. References 50

LIST OF TABLE
Table no. Name of Table Page No: 5.1 Descriptive Statistics For Stock Returns. 31 5.2 Levine’s Test For Equality Of Variances 31 5.3 Descriptive Statistics For Earning Per Share (EPS) 32 5.4 Levene's Test For Equality Of Variances 33 5.5 Group Statistics Return On Equity 34 5.6 Levene's Test For Equality Of Variances Returns On Equity 34 5.7 Group Statistics Earning Per Share (EPS) 35 5.8 Levene's Test For Equality Of Variances 35 5.9 Group Statistics Return On Equity 36 5.10 Levene's Test For Equality Of Variances Returns On Equity 37 5.11 Group Statistics Return On Stock 38 5.12 Levene's Test For Equality Of Variances Returns On Stock 38 5.13 Descriptive Of Small, Medium ,Large NBFC EPS 39 5.14 Test Of Homogeneity Of Variances 39 5.15 Anova 39 5.16 Robust Tests Of Equality Of Means 40 5.17 Descriptive Of Small, Medium, Large NBFC Return On Equity 41 5.18 Test Of Homogeneity Of Variances 41 5.19 Anova 41 5.20 Descriptive Of Small, Medium ,Large NBFC Return On Stock 43 5.21 Test Of Homogeneity Of Variances 43 5.22 Anova 43

1
CHAPTER 1
INTRODUCTION
OF
NON-BANK FINANCIAL
COMPANIES (NBFCs)

2
1.1 Background: Banking in India in the modern sense originated in the last decades of the 18th century. The
first banks were Bank of Hindustan (1770-1829) and The General Bank of India, established
1786 and since defunct.
The largest bank, and the oldest still in existence, is the State Bank of India, which originated in
the Bank of Calcutta in June 1806, which almost immediately became the Bank of Bengal. This
was one of the three presidency banks, the other two being the Bank of Bombay and the Bank of
Madras, all three of which were established under charters from the British East India Company.
The three banks merged in 1921 to form the Imperial Bank of India, which, upon India's
independence, became the State Bank of India in 1955. For many years the presidency banks
acted as quasi-central banks, as did their successors, until the Reserve Bank of India was
established in 1935.
Non Banking Finance Institutions is a constituent of the institutional structure of the
organized financial system in India the term ―Finance is often understood as being equivalent to
―money.
However, finance exactly is not money; it is the source of providing funds for a particular
activity. Providing or securing finance by itself is a distinct activity or function, which results in
Financial Management, Financial Services and Financial Institutions. Finance therefore
represents the resources by way funds are needed for a particular activity. We thus speak of
'finance' only in relation to a proposed activity. Finance goes with commerce, business, banking
etc.
Finance is also referred to as "Funds" or "Capital", when referring to the financial needs of a
corporate body. The Financial System of any country consists of financial markets, financial
intermediation and financial instruments or financial products. All these items facilitate transfer
of funds and are not always mutually exclusive. Inter -relationships between these are a part of
the system e.g. Financial Institutions operate in financial markets and are, therefore, a part of
such markets.

3
The Financial Intermediaries in the Financial System can broadly be said to comprise of:
Banks; and
NBFCs
NBFIs are different types of financial institutions that provide the following types of services:
1) Payments
2) Liquidity / credit
3) Divisibility: break up large denomination and aggregate small denomination
4) Store of value
5) Information: processing and assessing risks
6) Risk pooling: lower the risks of investors
Non-bank financial companies (NBFCs) are financial institutions that provide banking
services without meeting the legal definition of a bank, i.e. one that does not hold a banking
license. These institutions typically are restricted from taking deposits from the public depending
on the jurisdiction. Nonetheless, operations of these institutions are often still covered under
countries banking regulations.
The specific banking products that can be offered by NBFCs depends on the jurisdiction, and
may include services such as loans and credit facilities, savings products, investments and money
transfer services. In some jurisdictions, such as New Zealand, any company can engage in
banking business, except they are not allowed to use the word bank in their name. A company
can only call itself a bank if is a registered as such with the nation's central bank.
Non-Banking Financial Company (NBFC) in India began in a small way in the 1960s to serve
the need of the saver and investor whose financial need were not adequate covered by the
existing banking system in India. The NBFCs began to invite fixed deposit from investor and
work out leasing deal for larger industrial firms. In the early decade their operation were on a
limited scale and could not make a significant impact of financial system. However between
1980s and 1990s the NBFCs were well entered and began to attract a large number of investors
owing to them customer friendly reputation.
4
The scope of NBFCs is fast growing with multiplication of financial services. Some of NBFCs
are also engaged in underwriting through subsidiary unit and by offering allied financial services
including stock broking, investment banking, assets management and portfolio management.
Non-Banking Financial Companies are those companies, which are not banking companies under
the banking regulation Act, but carry out financial activities of providing finance. These
companies may or may not accepting deposit from the public. These provide lease finance,
housing finance, trade in share, general loan and advance for share trading, hire purchase
specially against automobile.
In recent times non- baking financial companies (NBFCs) have emerged substantial contributors
to the Indian economics growth by supplementing the effort of banks and other financial
institutions. They pay key role in the direction of saving and investment .in wave of rapid
industrial development &liberalization of the financial sector, key financial institution and
professional have promoted financial institution to create have promoted financial institution to
create a diversified and competitive financial system.
NBFCs intermediate between saver and investor. These companies also know as finance
companies, lease companies, loan companies etc.
1.2 NBFCs: Banking on new areas?
The last couple of years have seen significant developments in the financial sector that have
raised competition across-the-board. Non-banking finance companies (NBFCs) have perhaps felt
the pressure most. Consequently, top-rung NBFCs are changing tack, and initiating moves to
become financial supermarkets. They are seeking to provide as many services as possible, and
their fate will be decided by how successful they are Supermarkets in the making Leading
NBFCs have gradually extended their product portfolio to include asset management companies
(AMCs), housing finance firms and are now readying to enter insurance.
But the NBFCs' latest moves to increase the lines of business may be of a more permanent nature
despite the growing competition from the resource-rich banks and financial institutions in core
and emerging areas. The last few years saw the traditional boundaries between different
5
categories of financial intermediaries disappear. Thus, the NBFCs had to contend with heavy
competition even in areas that were their preserve.
Working capital loans were traditionally the preserve of banks, and term lending that of the
financial institutions. Now these sets of institutions move in and out each other's areas freely.
And both have also moved into retail financing, the traditional preserve of the NBFCs.
1.3 Regulation:
For European NCs the Payment Services Directive (PSD) is a regulatory initiative from the
European Commission to regulate payment services and payment service providers throughout
the European Union (EU) and Eurofff Economic Area (EEA). The PSD describes which type of
organizations can provide payment services in Europe (credit institutions (i.e. banks) and certain
authorities (e.g. Central Banks, government bodies), Electronic Money Institutions (EMI), and
also creates the new category of Payment Institutions). Organizations that are not credit
institutions or EMI, can apply for an authorization as Payment Institution in any EU country of
their URL choice (where they are established) and then passport their payment services into
other Member States across the EU.
1.4. Classification:
Based on their Liability Structure, NBFCs have been divided into two categories. 1. Category
‘A’ companies (NBFCs accepting public deposits or NBFCs-D), and 2. Category ‘B’ companies
(NBFCs not raising public deposits or NBFCs-ND).
NBFCs-D are subject to requirements of Capital adequacy, Liquid assets maintenance, Exposure
norms (including restrictions on exposure to investments in land, building and unquoted shares),
ALM discipline and reporting requirements; In contrast, until 2006 NBFCs-ND were subject to
minimal regulation. Since April 1, 2007, non-deposit taking NBFCs with assets of `1 billion and
above are being classified as Systemically Important Non-Deposit taking NBFCs (NBFCs-ND-
SI), and prudential regulations, such as capital adequacy requirements and exposure norms along
with reporting requirements, have been made applicable to them. The asset liability management
(ALM) reporting and disclosure norms have also been made applicable to them at different
points of time.

6
Depending upon their nature of activities, non- banking finance companies can be classified into
the following categories:
1) Development finance institutions
2) Leasing companies
3) Investment companies
4) Modaraba companies
5) House finance companies
6) Venture capital companies
1) Discount & guarantee houses
2) Corporate development companies
1.5 NBFCs' strengths: NBFCs that succeed are likely to do so by making the most of their ability to contain risk, adapt
to changes and tap demand in markets that are likely to be avoided by the bigger players.
Risk containment is critical in the financial sector. For a category supposed to cater to the
relatively riskier areas, top-rung NBFCs have proved the most adept at containing risks. The
industrial slowdown of the late 1990s saw the NPAs increasing sharply in the portfolio of banks
and financial institutions. Top-rung NBFCs which contained risk better were helped by two
factors: Lower proportion of loans to corporate and a more effective recovery mechanism.
The large size of a corporate loan means that a single default has a bigger impact. NBFCs that
lent mainly to the commercial vehicle segment were perhaps aided by the low proportion of loan
to each customer vis-a-vis the total disbursement. A default would, therefore, have limited
impact.

7
The small size of the loans coupled with a better collection mechanism resulted in effective risk
containment by the NBFCs. This was further aided by the greater flexibility of the NBFC
structure. The flexibility also enables the NBFCs to act with dispatch when they sense an
opportunity.
The other area where the NBFCs have an edge is the long experience in accessing fixed deposits
which gives them access to a database. Lack of reliable data has often tripped big names in the
corporate world.
The top-rung NBFCs have equipped themselves for the fast-changing environment where all
intermediaries are competing for retail finance. An outcome of the increased competition is that
profit margins of the NBFCs will decline. Moreover, with a huge resources committed to such
areas as insurance, which may take years to attain profitability, profit levels are unlikely to be as
high as they were.
Last year, the share price of quite a few NBFCs rose sharply only to fall rapidly. Share prices are
unlikely to witness any significant, sustained rise this year in the light of the low premium the
stock market attaches to financial services, in general, and especially with the prospect of a
decline in returns on investment in the near term.
Investors with exposures in such top-rung NBFCs as Sundaram Finance, Tata Finance or Kotak
Mahindra may stay invested as there are possibilities of moderate gains in the medium term.
However, fresh exposures may be avoided.
8
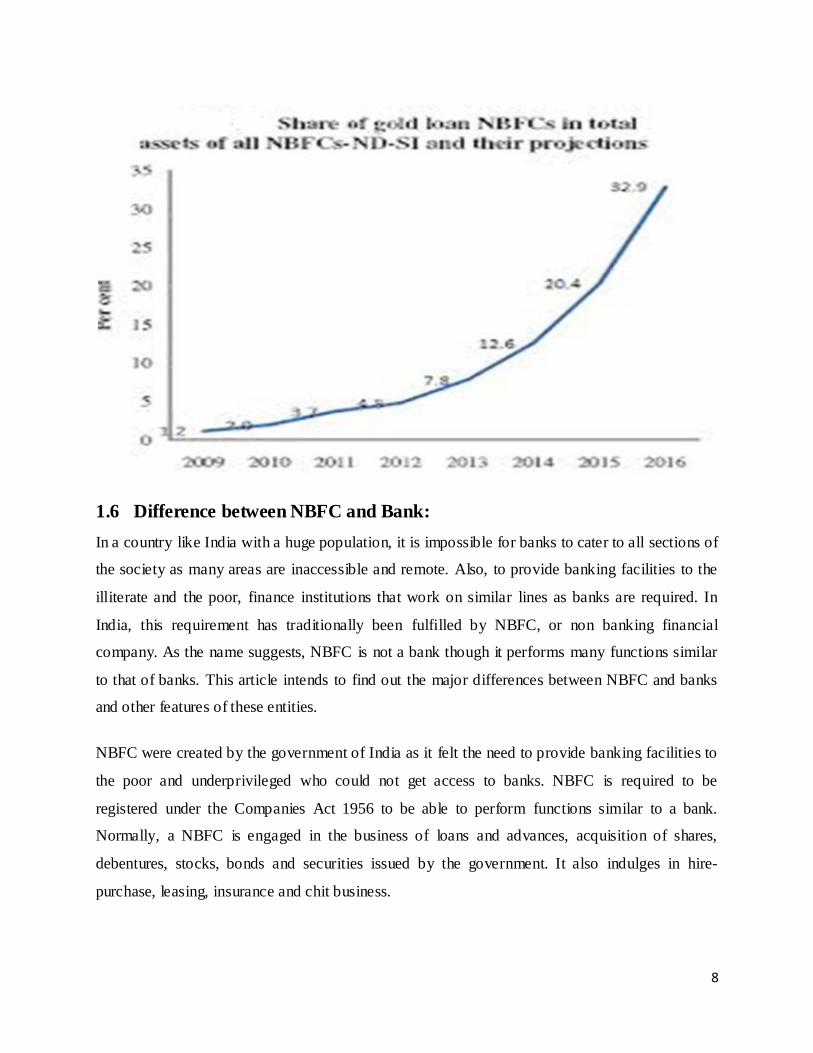
1.6 Difference between NBFC and Bank: In a country like India with a huge population, it is impossible for banks to cater to all sections of
the society as many areas are inaccessible and remote. Also, to provide banking facilities to the
illiterate and the poor, finance institutions that work on similar lines as banks are required. In
India, this requirement has traditionally been fulfilled by NBFC, or non banking financial
company. As the name suggests, NBFC is not a bank though it performs many functions similar
to that of banks. This article intends to find out the major differences between NBFC and banks
and other features of these entities.
NBFC were created by the government of India as it felt the need to provide banking facilities to
the poor and underprivileged who could not get access to banks. NBFC is required to be
registered under the Companies Act 1956 to be able to perform functions similar to a bank.
Normally, a NBFC is engaged in the business of loans and advances, acquisition of shares,
debentures, stocks, bonds and securities issued by the government. It also indulges in hire-
purchase, leasing, insurance and chit business.

9
However, there are several notable differences between NBFC and a bank.
1) NBFC cannot collect deposits in the manner of a bank
2) NBFC cannot issue checks drawn on itself
3) NBFC cannot issue Demand Drafts like banks
4) NBFC cannot indulge primarily in agricultural or industrial activity
5) NBFC cannot engage in construction of immovable property
6) NBFC cannot accept demand deposits
7) While banks are incorporated under banking companies act, NBFC is incorporated under company act 1956.
1.7 Significance of NBFCs in India: According to the Economic Survey 2010-11, it has been reported that NBFCs as a whole account
for 11.2 per cent of assets of the total financial system. With the growing importance assigned to
financial inclusion, NBFCs have come to be regarded as important financial intermediaries
particularly for the small-scale and retail sectors. In the multi-tier financial system of India,
importance of NBFCs in the Indian financial system is much discussed by various committees
appointed by RBI in the past and RBI has been modifying its regulatory and supervising policies
from time to time to keep with the changes in the system. NBFCs have turned out to be engines
of growth and are integral part of the Indian financial system, enhancing competition and
diversification in the financial spreading risks specifically at times of financial distress and have
been increasingly recognized as complementary of banking system at competitive prices. The
Banking sector has always been highly regulated, however simplified sanction procedures,
flexibility and timeliness in meeting the credit needs and low cost operations result the NBFCs
getting an edge over banks in providing funding.
Since the 90s crisis the market has seen explosive growth, as per a Fitch Report1 the
compounded annual growth rate of NBFCs was 40% in comparison to the CA banks being 22%
only.

10
NBFCs have been pioneering at retail asset backed lending, lending against securities
microfinance etc and have been extending credit to retail customers in under-served are and to
unbanked customers.
(AFP) study has examined and compared the profitability of banks with NBFCs during the
financial year 2012-13. Simple average and profitability ratio of the other segments have been
studied.

11
CHAPTER 2 REVIEW
OF
LITERATURE

12
2.1 LITERATURE REVIEW:
The concept of chit funds according to Simcox (1894) is originated more than 1000 years ago.
And it is mentioned, Dravidian kuri is used for raising money for some special purposes.
Subbarama aiyar (1925) has described the working of ‘changati kuri’, where lot decides the
person every month to which the amount is to be paid. The chit fund offers money at a flexible
interest rate and the interest rate depends on the demand of the money.
The Travancore Banking Enquiry Commission and Travancore Companies Act (1938)
recommended that the banks in the state were prohibited from conducting kuri business. But
after Independence following the extension of the Indian Companies Act (1913) to Travancore
State, the position changed and banks restarted the kuri business with effect from 1st April 1951.
Banking Companies Act (1949) regarded kuries as an agency business which banks could take
up and therefore, chit fund business re-emerged as an essential segment of the operations of
several banks in South India.
William Logan (1951) mentioned the presence of a flourishing Kuri or lottery system existing in
the society. He also described the operation of kuri system among friends known as ‘Changaathi
Kuri’.
According to S.K.Basu (1961) A Non-Banking Financial Company (NBFC) is a company
incorporated under the companies Act, 1956, and conducting the financial business as its
principal business. In India, the Non-Banking Financial sector comprises a multiplicity of
institutions, which are defined under section 45 I (a) of the Reserve Bank of India Act, 1934.
According to R.G. Saraiya (1974) the annual savings mobilization through chit funds is in
multiples of 100 crore. Though these savings are less comparing with commercial banks, the
number of people benefited by chit funds is quite large. He has bring forth the recommendations
of the Banking Commission, which has recommended that the State Governments may consider

13
Starting Chit Funds at strategic places as model foremen with the object of offering effective
competition to private chit funds and thus acting as a disciplining factor.
Nayar (1986) pointed out that Chit Funds have come to stay as a unique non-banking financial
intermediary in India especially in South India. He also pointed out that the rationale of an
auction Chitty or Business Chitty is that the borrowers and lenders meet to fix the rate of interest
and since there is more than one borrower competing for the same amount, a competitive rate of
interest is offered. Only the members enjoy the benefits of the scheme. The study highlighted the
fact that for the subscribers, the return on subscriptions was not the only consideration. The
possibility of getting a lump-sum on easy terms at short notice was a great inducement. Hence, it
is advisable to retain these within the frame work of non-banking financial institutions controlled
under chit funds act 1982, by the state government.
The RBI reports in Trend and Progress of Banking in India (2008) indicates that even after the
four decades of banks’ nationalization, country’s 41 per cent adult population remained outside
the banking system but is surmised to be covered by the NBFCs wise Chit Funds’.
Dr.Jafor Ali Akhan (2009) stated that the Non-Banking Financial Companies (NBFCs) have
been playing a very significant role in the present day rigorous money-market conditions. They
are serving the nation by supporting the economic reconstruction and giving a booster to
industrial production. They are engaged into the business of providing loans and advances of
small amounts for a short-period to small borrowers. The Non-Banking Financial Companies
(NBFCs) play an important role in channelizing these savings into investment. They have
supplemented the role played by the banks.
According to Y.Bala Bharathi and Sanjoy De (2009) NBFCs are financial entities that provide
banking services without meeting the legal definition of a bank. They are typically not allowed to
take deposits from general public and hence have to seek other means of funding. These NBFCs
have matured a lot and even withstood the recent deadly crisis with a lot of resilience. NBFCs
can reach the unorganized segments of society with their ability to provide innovative financial
services. These entities play a critical role in disbursing credit to the rural sector, thus preventing

14
the concentration of credit risk in banks. In urban areas too, NBFCs focus on non-salaried
individuals, traders, transporters and stock brokers who are neglected by banks.
Dr.Amrit Patel and Dr.Gopal Kalkoti(2010) mentioned that according to RBI, the major
reason for increase in overall household debt and increase in the share of rural household
indebtedness to non- institutional sources was a significant increase in the current farm
expenditure and household expenditure for which households found it difficult to obtain loans
from banks. In addition to that the cumbersome procedure of submitting various documents with
loan applications and documentation process led to an average of 33 weeks taken by commercial
banks to approve loans. And this scenario is the niche forchit fund like entities under the banner
of NBFCs.
Dr.Jatinder Kaur(2010) reveals that, despite the phenomenal growth of banking sector, the
extent of rural indebtedness in India has been on a continuous rise. About one-third of the rural
credit requirements are still met by non-institutional sources, like moneylenders. The favoring
factor of moneylenders is that banks will not sanction loans for consumption purposes and
default of repayment of previous loan makes it ineligible for further assistance from banks.
Usha Thorat (2010) states that non-banking entities can be either non-banking non financial
entities or non-banking financial entities. In case of non-banking financial entities, there mare
deposit taking and non-deposit taking financial companies is there. Considering the difficulties in
ensuring the effective supervision of large number of small deposit-taking entities, fresh
approvals to NBFCs for accepting deposits are not considered.

15
CHAPTER 3
RESPONSIBILITIES
Of
NBFC

16
3.1 Guidelines for new deposits :
Customer identification: 'Know The Customer' (KYC) should be the key guiding principle for
identification of an individual / corporate customer (depositor or borrower).
Accordingly, the KYC framework should have two- fold objective, (I) to ensure customer
identification and verifying his identity and residential address; and (ii) to monitor transactions
of a suspicious nature.
NBFCs should ensure that the identity of the customer, including beneficial owner is done based
on disclosures by customers themselves.
Typically easy means of establishing identity would be documents such as Permanent Account
Number (PAN), ration card, driving licence, Election Commission's identity card, passport, et
cetera in case of individuals and registration certificate, partnership deed/agreement, et cetera
and other reliable documents in respect of companies, firms and other bodies.
Verification through such documents should be in addition to the introduction by a person known
to the NBFC.
Procedures for existing customers :
In respect of existing customers, NBFCs should ensure that gaps and missing
information in compliance of KYC guidelines on customer identification procedure is
filled up and completed before June 30, 2004.
Ceiling and monitoring of cash transactions :
NBFCs would normally not have large cash withdrawals and deposits. However,
wherever transactions of Rs 10 lakh (Rs 1 million) and above are undertaken, they should
keep record of these transactions in a separate register maintained at branch, as well as at
Registered Office. Such information should be made available to regulatory and
investigating authorities, when demanded.

17
Guidelines and monitoring procedures :
The board of directors of NBFCs should formulate policies and procedures to
operationalise the guidelines and put in place an effective monitoring system to ensure
compliance by their branches. Early computerization of branch/office reporting will
facilitate prompt generation of such reports and monitoring.
Internal audit/inspection :
Internal auditors must specifically scrutinize and comment on the effectiveness of the
measures taken by branches / offices of NBFC in adoption of KYC norms and steps
towards prevention of money laundering. Specific cases of violation should be
immediately brought to the notice of head / controlling / registered office.
Record keeping :
NBFCs should prepare and maintain proper documentation on their customer
relationships and cash transactions of Rs 10 lakh and above. The records of all such
transactions should be retained for at least ten years after the transaction has taken place
and should be available for perusal and scrutiny by audit functionaries as well as
regulators and law enforcement authorities; as and when required, at the branch as well as
at registered office.
Training of staff and management :
It is important that all the operating and management staff is made fully aware of the
implications and understand the need for strict adherence to KYC norms. NBFCs may
take suitable steps to impart training to their operational staff on anti-money laundering
measures.
3.2 NBFCs are typically into funding of: Construction equipment
Commercial vehicles and cars
Gold loans
Microfinance

18
Consumer durables and two wheelers
Loan against shares, etc.
3.3 List of major products offered by NBFCs in India: Funding of commercial vehicles
Funding of infrastructure assets
Retail financing
Loan against shares
Funding of plant and machinery
3.4 Responsibilities : The NBFCs accepting public deposits should furnish to RBI Audited balance sheet of each
financial year and an audited profit and loss account in respect of that year as passed in the
annual general meeting together with a copy of the report of the Board of Directors and a copy of
the report and the notes on accounts furnished by its Auditors;
Statutory Annual Return on deposits - NBS 1;
Certificate from the Auditors that the company is in a position to repay the deposits as
and when the claims arise;
Quarterly Return on liquid assets; Half-yearly Return on prudential norms;
Half-yearly ALM Returns by companies having public deposits of Rs. 20 crore and
above or with assets of Rs. 100 crore and above irrespective of the size of deposits ;
Monthly return on exposure to capital market by companies having public deposits of
Rs. 50 crore and above; and
A copy of the Credit Rating obtained once a year along with one of the Half-yearly
Returns on prudential norms as at (v) above.

19
CHAPTER 4
RESEARCH
METHODOLOGY

20
4.1. Introduction:
This is an introduction to research and research methods and will outline some, but not all, key
areas of research and research methods:
A. Definitions
B. Research approaches
C. Stages of the research process
D. Background reading & information gathering
E. Data collection
F. Ethical issues in research
This covers a number of important areas of the Research process, particularly,
• Data analysis
THE PURPOSE OF RESEARCH IS TO.
1. Review or synthesize existing knowledge
2. Investigate existing situations or problems
3. Provide solutions to problems
4. Explore and analyze more general issues
5. Construct or create new procedures or systems
6. Explain new phenomenon
7. Generate new knowledge
Research Design:
A research design is a pattern or an outline of a research project’s workings. It is a statement of
only the essential elements of a study, those that provide the basic guidelines for the details of
the project.

21
If there were no research design, the research would have only foggy notion about what is to be
done. There are numerous specific designs, which can be classified into three broad categories.
• Descriptive Design
• Quasi Experimental Design
• Experimental Design
• Descriptive Design:
These designs have its name because they describe a phenomenon without establishing
association between the factors. Hence these designs are utilized when a need is to
produce accurate description of variables.
• Quasi Experimental Design:
These designs as the name implies lacks the vigorous qualities of real experiments
particularly valid demonstration of variable association. Still they are not descriptive
ones.
• Experimental Design:
These designs are intended to demonstrate cause and effect relationship such designs can
measure communicate variation i.e. degree of change in one variable ‘y’ when another
variable ‘x’ is changed.
In context of our project study research design would be descriptive design.
4.2. Motivation of the study
Motivation is the process of arousing the action sustaining the activity in process and regulation
the pattern of activity. In this project we are analysis Nbfcs companies because Nbfcs is the most
important in india.so we are motivated for this factor.

22
4.3. Statement of the problem:
Research being a logical process definitely follows predetermined or steps in order to obtain
the desired results or outcomes. Though the entire process of research is quite complex and
requires a considerable degree of knowledge and skill, the step of problem formulation is most
challenging and critical one for the researcher as well as the research. Indian Government is
hesitant to introduce banking system and non banking financial corporations for Indian financial
system in the Indian Economy. It is rightly said that a problem, well defined is half solved.
The Research topic undertaken by me is “analysis of banking v/s non banking financial
companies.
Research Objectives of the Study:
Our goal is to investigate the banking and nonbank finance corporations (NBFCs) in India to
understand.
• Comparison of banking vs. none banks financial companies.
• Comparison of private banks vs. public banks.
• Comparison of small, medium, large NBFCs.
The main objective of my research is to “ Analysis of Banking V/S Non Banking Financial
Companies”.
4.4. Scope of the Study:
To study covered in banking v/s NBFCs. 20012-13 was a difficult year, especially for the
financial segment across the globe. However, India’s strong macro-economic fundamentals and
financial policies have shielded it from the turmoil. As the fiscal year 2008-09 comes to an end,
ASSOCHAM Research Bureau has analyzed corporate results of the Indian Banks and Non-
Banking Financial Companies (NBFCs). The study considered those banks that have announced
their results between 15th April -20th May 2008- 09 posted on the website of Bombay Stock
Exchange.
23
The ASSOCHAM Research Bureau (ARB) have analyzed in total banks (both public & private
sector) and all NBFCs those are listed.
The Assocham Financial Pulse (AFP) study has examined and compared the profitability of
banks with NBFCs during the financial year 2012-13. Simple average and profitability ratio of
the other segments have been studied.
4.5. Significance of the study:
According to the Economic Survey 2010-11, it has been reported that NBFCs as a whole account
for 11.2 per cent of assets of the total financial system. With the growing importance assigned to
financial inclusion, NBFCs have come to be regarded as important financial intermediaries
particularly for the small-scale and retail sectors.
In the multi- tier financial system of India, importance of NBFCs in the Indian financial system is
much discussed by various committees appointed by RBI in the past and RBI has been
modifying its regulatory and supervising policies from time to time to keep pace with the
changes in the system.
NBFCs have turned out to be engines of growth and are integral part of the Indian financial
system, enhancing competition and diversification in the financial sector, spreading risks
specifically at times of financial distress and have been increasingly recognized as
complementary of banking system at competitive prices. The Banking sector has always been
highly regulated, however simplified sanction procedures, flexibility and timeliness in meeting
the credit needs and low cost operations resulted in the NBFCs getting an edge over banks in
providing funding.

24
4.6. Hypotheses of the study: 1. Hypothesis:-
H0: There is no significance difference between stock return of Banks and stock returns of
NBFCs.
H1: There is significance difference between stock return of Banks and stock returns of NBFCs
2. Hypothesis:-
H0: There is no significance difference between EPS of Banks and EPS of NBFCs.
H1: There is significance difference between EPS of Banks and EPS of NBFCs.
3. Hypothesis:-
H0: There is no significance difference between ROE of Banks and ROE of NBFCs.
H1: There is significance difference between ROE of Banks and ROE of NBFCs.
ANOVA FOR ROE :
H0:- there is no significant difference between return of equity small, medium, large NBFCs.
H1:- there is significant difference between return of equity small, medium, large NBFCs.
ANOVA FOR EPS :
H0:- there is no significant difference between earning per share of small, medium, large
NBFCs.
H1:- there is significant difference between earning per share of small, medium, large NBFC
ANOVA FOR ROS :
H0:- there is no significant difference between stock return of small, medium, large NBFCs.
H1:- there is significant difference between stock return of small, medium, large NBFCs.

25
4.7 RESEARCH METHODOLOGY
Here we have done analysis of Indian banks and NBFC s ( Non Banking Financial Companies)
history based on total available Private bank in India are 148 and Public bank are 33. NBFCs
Small is 1081, NBFCs medium are 54 and NBFCs large are 8.
Here we have done a research on secondary based so available EPS of Private Bank are 36,
Public Bank are 35, and NBFCs small are 527, NBFCs medium 26, NBFCs large 7.Data are
available so we have select total number of bank are 71 and total number of NBFCs 560 are
taken in our research report.
Here we have done a research on secondary based so available ROE of Private Bank are 156,
Public Bank are 31, and NBFCs small are 54, NBFCs medium 54, NBFCs large 9. Data are
available so we have select total number of bank are 187 and total number of NBFCs 117 are
taken in our research report.
Here we have done a research on secondary based so available Stock Return of Private Bank are
18, Public Bank are 25, and NBFCs small are 110, NBFCs medium 6, NBFCs large 6. Data are
available so we have select total number of bank are 43 and total number of NBFCs 122 are
taken in our research report.
4.7.1. Sample frame and sample size.
EPS of fin. Large:7 companies
EPS of fin. Medium:26 companies
EPS of fin. Small:527 companies
EPS of private bank: 36 companies
EPS of public bank: 35 companies
ROE of NBFC FIN. Large : 9 companies
ROE of NBFC FIN. Small: 54 companies
26
ROE of NBFC FIN. medium:54 companies
ROE Of Private bank: 156 companies
ROE Of Public bank: 31 companies
Stock Return Of Public Bank:25 companies
Stock Return Of Private Bank:18 companies
Stock Return Of NBFC FIN. Small Bank:110 companies
Stock Return Of NBFC FIN. Medium Bank:6 companies
Stock Return Of NBFC FIN. Large Bank:6 companies
Data source:
The sources of collection of secondary data are:
• Capitaline
Plan of data analysis:
The data is analyzed on the basis of spss software by using mathematical techniques. The
technique that we will use and also secondary data is use.
Tools for Data Analysis
Spss software has been used for testing the favorable or unfavorable situation of bank
V/s NBFC

27
4.7.2. Data analysis:
4.7.2.1. ANOVA Test
Analysis of variance (ANOVA) is a collection of statistical models used to analyze the
differences between group means and their associated procedures (such as "variation" among and
between groups), developed by R.A. Fisher. In the ANOVA setting, the observed variance in a
particular variable is partitioned into components attributable to different sources of variation. In
its simplest form, ANOVA provides a statistical test of whether or not the means of several
groups are equal, and therefore generalizes the t-test to more than two groups. Doing multiple
two-sample t-tests would result in an increased chance of committing a type I error. For this
reason, ANOVAs are useful in comparing (testing) three or more means (groups or variables) for
statistical significance.
Assumptions of ANOVA
The normal-model based ANOVA analysis assumes the independence, normality and
homogeneity of the variances of the residuals. The randomization-based analysis assumes only
the homogeneity of the variances of the residuals (as a consequence of unit-treatment additively)
and uses the randomization procedure of the experiment. Both these analyses require
homoscedasticity, as an assumption for the normal-model analysis and as a consequence of
randomization and additively for the randomization-based analysis.
Problems which do not satisfy the assumptions of ANOVA can often be transformed to satisfy
the assumptions. The property of unit-treatment additively is not invariant under a "change of
scale", so statisticians often use transformations to achieve unit-treatment additively. If the
response variable is expected to follow a parametric family of probability distributions, then the
statistician may specify (in the protocol for the experiment or observational study) that the
responses be transformed to stabilize the variance.[25] Also, a statistician may specify that
logarithmic transforms be applied to the responses, which are believed to follow a multiplicative
model.[16][26] According to Cauchy's functional equation theorem, the logarithm is the only
continuous transformation that transforms real multiplication to addition.

28
Characteristics of ANOVA
ANOVA is used in the analysis of comparative experiments, those in which only the difference
in outcomes is of interest. The statistical significance of the experiment is determined by a ratio
of two variances. This ratio is independent of several possible alterations to the experimental
observations: Adding a constant to all observations does not alter significance. Multiplying all
observations by a constant does not alter significance. So ANOVA statistical significance results
are independent of constant bias and scaling errors as well as the units used in expressing
observations. In the era of mechanical calculation it was common to subtract a constant from all
observations (when equivalent to dropping leading digits) to simplify data entry. This is an
example of data coding.
Why use the ANOVA over a t-test?
The t-test compares the means between 2 samples and is simple to conduct, but if there is more
than 2 conditions in an experiment an ANOVA is required. The fact the ANOVA can test more
than one treatment is a major advantage over other statistical analysis such as the t-test, it opens
up many testing capabilities but it certainly doesn’t help with mathematical headaches. It is
important to know that when looking at the analysis of variance an IV is called a factor, the
treatment conditions or groups in an experiment are called the levels of the factor. ANOVA’s use
an F-ratio as its significance statistic which is variance because it is impossible to calculate the
sample means difference with more than two samples.
ANOVA test assumes three things:
• The population sample must be normal
• The observations must be independent in each sample
• The population the samples are selected from have equal variance a.k.a. homogeneity of
variance.
4.7.2.2. Independent Sample Two Test:
Independent samples, the two samples of scores are from different unrelated groups. In
other words, scores in the two groups are not matched or paired. We say that these

29
samples are statistically independent. This is a common situation in social science
research. For example, when comparing experimental (receives treatment) and control
(does not receive treatment) groups that have been randomly assigned, we have two
independent samples. When we, as researchers, compare two groups.
Purpose of the t-test:
The general purpose of the indepent measures t test is to determine whether the sample mean
difference obtained is a real difference between the two populations or simply the result of
sampling error.
The assumption of the independent sample two tests are :
• The observation within each sample must be independent
• Population variance are equal
• Population distribution are normal in shape.
4.8. Limitation of the study:
The limitations of the study are those characteristics of design or methodology that impacted or
influenced the application or interpretation of the results of your study. They are the constraints
on generalizability and utility of findings that are the result of the ways in which you chose to
design the study and/or the method used to establish internal and external validity.
• Sample size – Our sample size is too long, it will be difficult to find significant
relationships from the data
• Measure used to collect the data : The limitation for the study is to collect long data. So
it is difficult for the project.

30
CHAPTER 5
DATA ANALYSIS
&
INTERPRETATION
31
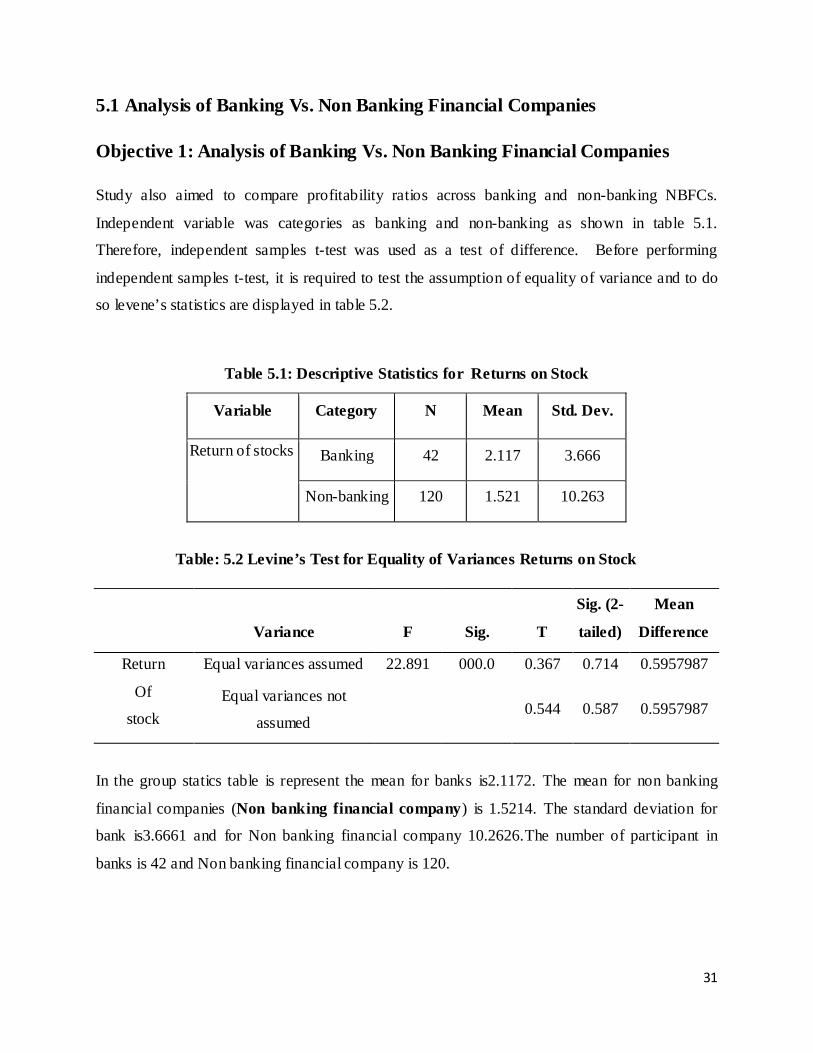
5.1 Analysis of Banking Vs. Non Banking Financial Companies
Objective 1: Analysis of Banking Vs. Non Banking Financial Companies
Study also aimed to compare profitability ratios across banking and non-banking NBFCs.
Independent variable was categories as banking and non-banking as shown in table 5.1.
Therefore, independent samples t-test was used as a test of difference. Before performing
independent samples t-test, it is required to test the assumption of equality of variance and to do
so levene’s statistics are displayed in table 5.2.
Table 5.1: Descriptive Statistics for Returns on Stock
Variable Category N Mean Std. Dev.
Return of stocks Banking 42 2.117 3.666
Non-banking 120 1.521 10.263
Table: 5.2 Levine’s Test for Equality of Variances Returns on Stock
In the group statics table is represent the mean for banks is2.1172. The mean for non banking
financial companies (Non banking financial company) is 1.5214. The standard deviation for
bank is3.6661 and for Non banking financial company 10.2626.The number of participant in
banks is 42 and Non banking financial company is 120.
F Sig. T
Sig. (2-
tailed)
Mean
Difference Variance
Return
Of
stock
Equal variances assumed 22.891 000.0 0.367 0.714 0.5957987
Equal variances not
assumed
0.544 0.587 0.5957987

32
The significant (2-tailed) in our table is 0.000. This value is less than 0.05, because of this we
can conclude that there is a statistically significant difference between the mean number of bank
and Non banking financial company .since our group statics box revealed that the mean for the
banks was greater than the mean for Non banking financial company, we can conclude that
return on stock is Non banking financial company is different than banks stock return.
2. Hypothesis:-
Study also aimed to compare profitability ratios across banking and non-banking NBFCs.
Independent variable was categories as banking and non-banking as shown in table 5.. Therefore,
independent samples t-test was used as a test of difference. Before performing independent
samples t-test, it is required to test the assumption of equality of variance and to do so levene’s
statistics are displayed in table of 5.4.
H0: There is no significance difference between EPS of Banks and EPS of NON BANKING
FINANCIAL COMPANYs.
H1: There is significance difference between EPS of Banks and EPS of NON BANKING
FINANCIAL COMPANYs.
Table 5.3: Descriptive Statistics for Earning per Share (EPS)
Variable Category N Mean Std. Deviation
EPS Bank 69 3.0596E2 1502.17672
NBFC 579 1.3589E2 3234.96060
33
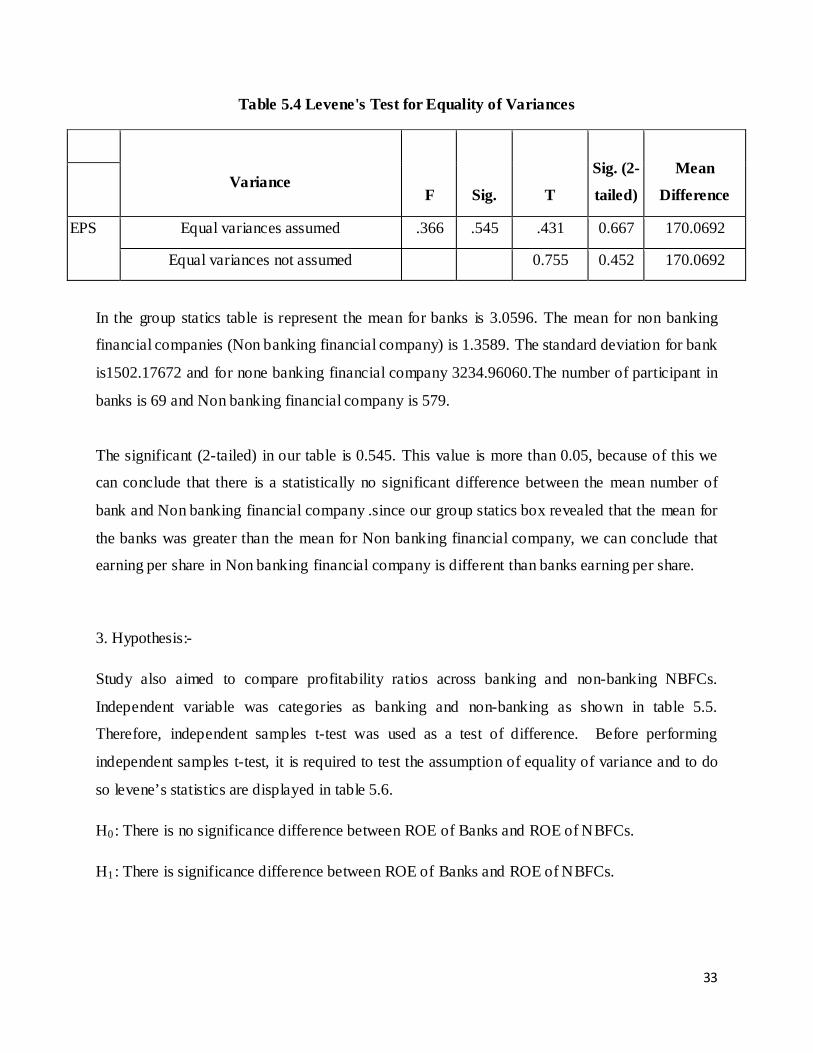
Table 5.4 Levene's Test for Equality of Variances
Variance F Sig. T
Sig. (2-
tailed)
Mean
Difference
EPS Equal variances assumed .366 .545 .431 0.667 170.0692
Equal variances not assumed 0.755 0.452 170.0692
In the group statics table is represent the mean for banks is 3.0596. The mean for non banking
financial companies (Non banking financial company) is 1.3589. The standard deviation for bank
is1502.17672 and for none banking financial company 3234.96060.The number of participant in
banks is 69 and Non banking financial company is 579.
The significant (2-tailed) in our table is 0.545. This value is more than 0.05, because of this we
can conclude that there is a statistically no significant difference between the mean number of
bank and Non banking financial company .since our group statics box revealed that the mean for
the banks was greater than the mean for Non banking financial company, we can conclude that
earning per share in Non banking financial company is different than banks earning per share.
3. Hypothesis:-
Study also aimed to compare profitability ratios across banking and non-banking NBFCs.
Independent variable was categories as banking and non-banking as shown in table 5.5.
Therefore, independent samples t-test was used as a test of difference. Before performing
independent samples t-test, it is required to test the assumption of equality of variance and to do
so levene’s statistics are displayed in table 5.6.
H0: There is no significance difference between ROE of Banks and ROE of NBFCs.
H1: There is significance difference between ROE of Banks and ROE of NBFCs.

34
Table: 5.5 Group Statistics Return on Equity
Variable category N Mean Std. Deviation
Return
on equity
bank 185 8.03 12.049
NBFCs 114 6.92 9.639
Table: 5.6 Levene's Test for Equality of Variances Returns on Equity
variances T Df Sig. (2-tailed)
Mean
Difference
Return on equity Equal variances assumed 0.835 297 0.405 1.112
Equal variances not
assumed 0.880 277.415 0.380 1.112
In the group statics table is represent the mean for banks 8.03. The mean for non banking
financial companies (Non banking financial company) is 6.92. The standard deviation for bank is
12.049 and for Non banking financial company 9.639. The number of participant in banks is 185
and Non banking financial company is 114.
The significant (2-tailed) in our table is 0.265. This value is more than 0.05, because of this we
can conclude that there is a statistically no significant difference between the mean number of
bank and Non banking financial company .since our group statics box revealed that the mean for
the banks was greater than the mean for Non banking financial company, we can conclude that
return on equity of Non banking financial company is different than banks stock equity.

35
Objectives 2:- comparison of public sector banks v/s. private sector banks companies.
1. Hypothesis:-
Study also aimed to compare profitability ratios across banking and non-banking NBFCs.
Independent variable was categories as banking and non-banking as shown in table 5.7.
Therefore, independent samples t-test was used as a test of difference. Before performing
independent samples t-test, it is required to test the assumption of equality of variance
and to do so levene’s statistics are displayed in table 5.8.
H0: There is no significance difference between EPS of public sector banks and EPS of private
sector banks.
H1: There is significance difference between EPS of public sector banks and EPS of private
sector banks.
Table:5.7 Group Statistics Earning per Share (EPS)
category N Mean Std. Deviation Std. Error Mean
EPS Private 35 3.43065E2 1858.358656 314.119945
Public 34 2.67764E2 1043.416424 178.944440
Table:5.8 Levene's Test for Equality of Variances

36
Variances F Sig. T Sig. (2-
tailed)
Mean
Difference
EPS Equal variances assumed 0.37 0.55 0.21 0.837 75.301017
Equal variances not assumed 0.21 0.836 75.301017
In the group statics table is represent the mean for private banks is 3.43065. The mean for public
bank is 2.67764. The standard deviation for private bank is 1858.358656 and for public bank1043.416424
.The number of participant in private banks is 35 and public bank is 34.
The significant (2-tailed) in our table is 0.546. This value is more than 0.05, because of this we
can conclude that there is a statistically no significant difference between the mean number of
private bank and public bank .since our group statics box revealed that the mean for the private
banks was greater than the mean for public bank, we can conclude that esp. of private bank is
different than public bank earnings per share.
2. Hypothesis:-
Study also aimed to compare profitability ratios across banking and non-banking NBFCs.
Independent variable was categories as banking and non-banking as shown in table 5.9.
Therefore, independent samples t-test was used as a test of difference. Before performing
independent samples t-test, it is required to test the assumption of equality of variance
and to do so levene’s statistics are displayed in table5.10.
H0: There is no significance difference between ROE of public sector banks and ROE of private
sector banks.
H1: There is significance difference between ROE of public sector banks and ROE of private
sector banks.
Table:5.9 Group Statistics Return on Equity
Variable categories N Mean Std. Deviation
return on equity private 155 7.071 12.812401
public 30 12.987 4.365155

37

38
Table:5.10 Levene's Test for Equality of Variances Returns on Equity
t-test for Equality of Means
Variance F Sig. T Df Sig. (2-
tailed)
Mean
Difference
Return on
equity Equal variances assumed 2.071 0.152 -2.497 183 0.013 -5.916419
Equal variances not assumed -4.545 135.43 0 -5.916419
In the group statics table is represent the mean for private banks is 7.07058. The mean for public
bank is1.29870. The standard deviation for private bank is 12.812401 and for public bank 4.365155.
The number of participant in private banks is 155 and public bank is 30.
The significant (2-tailed) in our table is 0.152. This value is more than 0.05, because of this we
can conclude that there is a statistically no significant difference between the mean number of
private bank and public bank .since our group statics box revealed that the mean for the private
banks was greater than the mean for public bank, we can conclude that return on equity of
private bank is different than public bank return.
3. Hypothesis:-
Study also aimed to compare profitability ratios across banking and non-banking NBFCs.
Independent variable was categories as banking and non-banking as shown in table 5.11.
Therefore, independent samples t-test was used as a test of difference. Before performing
independent samples t-test, it is required to test the assumption of equality of variance and to
do so levene’s statistics are displayed in table 5.12.
H0: There is no significance difference between ROS of public sector banks and ROS of private
sector banks.
H1: There is significance difference between ROS of public sector banks and ROS of private
sector banks.

39
Table:5.11 Group Statistics Return on Stock
Variable Categories N Mean Std. Deviation
Return on stock Private 17 3.101 4.9523098
Public 24 1.425 2.3837577
Table:5.12 Levene's Test for Equality of Variances Returns on Stock
t-test for Equality of Means
Variable F Sig. T
Sig. (2-
tailed)
Mean
Difference
Return on
stock
Equal variances assumed 11.536 0.002 1.444 0.157 1.676144
Equal variances not assumed 1.293 0.21 1.676144
In the group statics table is represent the mean for private banks is 3.101424. The mean for public
bank is 1.425279. The standard deviation for private bank is4.9523098 and for public bank is
2.3837577.The number of participant in private banks is 17 and public bank is 24.
The significant (2-tailed) in our table is 0.002. This value is less than 0.05, because of this we
can conclude that there is a statistically significant difference between the mean number of
private bank and public bank .since our group statics box revealed that the mean for the private
banks was greater than the mean for public bank, we can conclude that return on stock of private
bank is different than public bank.
Objectives 3:- Comparison of small, medium, large NBFCs.
ANOVA FOR EPS
Study aimed to investigate the impact of size on profitability. In this study, profitability was
measured with EPS, ROE and ROS. The size was categorized as large size, medium size and
small size. The profitability was compared across different size of NBFCs. Therefore, analysis of
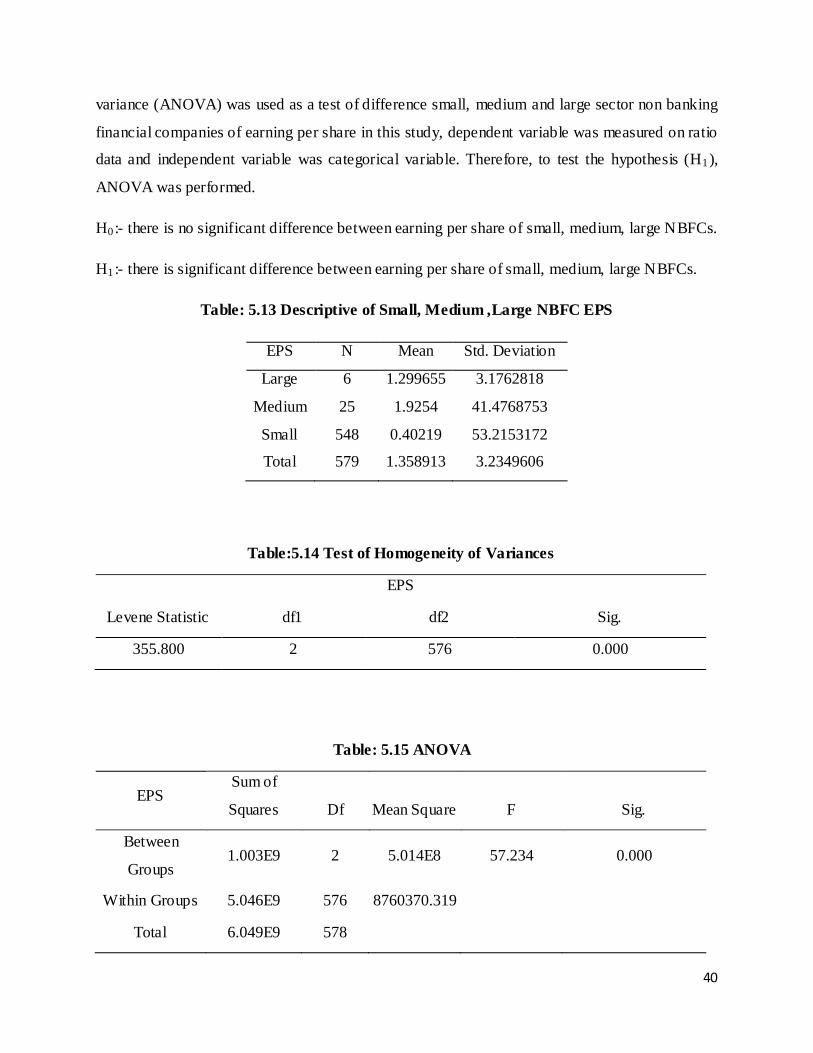
40
variance (ANOVA) was used as a test of difference small, medium and large sector non banking
financial companies of earning per share in this study, dependent variable was measured on ratio
data and independent variable was categorical variable. Therefore, to test the hypothesis (H1),
ANOVA was performed.
H0:- there is no significant difference between earning per share of small, medium, large NBFCs.
H1:- there is significant difference between earning per share of small, medium, large NBFCs.
Table: 5.13 Descriptive of Small, Medium ,Large NBFC EPS
EPS N Mean Std. Deviation
Large 6 1.299655 3.1762818
Medium 25 1.9254 41.4768753
Small 548 0.40219 53.2153172
Total 579 1.358913 3.2349606
Table:5.14 Test of Homogeneity of Variances
EPS
Levene Statistic df1 df2 Sig.
355.800 2 576 0.000
Table: 5.15 ANOVA
EPS Sum of
Squares Df Mean Square F Sig.
Between
Groups 1.003E9 2 5.014E8 57.234 0.000
Within Groups 5.046E9 576 8760370.319
Total 6.049E9 578

41
Table:5.16 Robust Tests of Equality of Means
EPS
Statistica df1 df2 Sig.
Welch 2.742 2 11.297 0.107
a. Asymptotically F distributed.
From the above analysis we can conclude that as the earning per share increases risk also
increase. In case of small NBFCs earning per share is 0.402190 and risk is 53.2153172. Same for
medium NBFCs return is 1.925400, risk is 41.4768753. And for large NBFCs return 1.299655, risk
is3.1762818. So there is no need of further analysis. This is descriptive analysis and we are not
taking whole population, its sample based so there is no need of further analysis.
From above homogeneity of variance is 0.000 which less than 0.05 so there is significance
difference between the earning per share variance of small, medium, large NBFCs. Thus, one can
compare means of earning per share through ANOVA. But From the above ANOVA table we
have found that significance value is 0.000 which is less than 0.05.
Robust Tests of Equality of Means is 0.107 which is more than 0.05. So the null hypothesis is
accepted. Therefore we can conclude that there is no significance difference between earning per
share of small, medium and large NBFCs.
ANOVA FOR ROE
Study aimed to investigate the impact of size on profitability. In this study, profitability was
measured with EPS, ROE and ROS. The size was categorized as large size, medium size and
small size. The profitability was compared across different size of NBFCs. Therefore, analysis of
variance (ANOVA) was used as a test of difference small, medium and large sector non banking
financial companies of return on equity. In this study, dependent variable was measured on ratio

42
data and independent variable was categorical variable. Therefore, to test the hypothesis (H1),
ANOVA was performed.
H0:- there is no significant difference between return of equity small, medium, large NBFCs.
H1:- there is significant difference between return of equity small, medium, large NBFCs.
Table: 5.17 Descriptive of Small, Medium, Large NBFC Return on Equity
ROE N Mean Std. Deviation Std. Error
Large 8 1.103250 9.8585043 3.4855076
Medium 53 6.606981 9.6443243 1.3247498
Small 53 6.606981 9.6443243 1.3247498
Total 114 6.917544 9.6392305 .9027966
Table:5.18
Test of Homogeneity of Variances
ROE
Levene Statistic df1 df2 Sig.
.177 2 111 0.838
Table: 5.19
ANOVA
ROE Sum of
Squares Df
Mean
Square F Sig.
Between Groups 145.687 2 72.843 0.781 0.460
Within Groups 10353.682 111 93.276
Total 10499.368 113

43
From the above analysis we can conclude that as the return increases risk also increases. In case
of small NBFCs return on equity is 6.606981 and risk is9.6443243.same for medium NBFCs
return is 6.606981, risk is 9.6443243. And for large NBFCs return is1.103250, risk is 9.6443243.
So there is no need of further analysis. This is descriptive analysis and we are not taking whole
population, its sample based so there is no need of further analysis.
From above homogeneity of variance is 0.838 which more than 0.05 so there is no significance
difference between the equity variance of small, medium, large NBFCs. Thus, one can compare
means of equity returns through ANOVA.
From the above ANOVA table we have found that significance value is 0.460 which is more
than 0.05 so the null hypothesis is accepted. Therefore we can conclude that there is no
significance difference between stock returns of small, medium and large NBFCs.
ANOVA FOR ROS
Study aimed to investigate the impact of size on profitability. In this study, profitability was
measured with EPS, ROE and ROS. The size was categorized as large size, medium size and
small size. The profitability was compared across different size of NBFCs. Therefore, analysis of
variance (ANOVA) was used as a test of difference small, medium and large sector non banking
financial companies of stock on return. In this study, dependent variable was measured on ratio
data and independent variable was categorical variable. Therefore, to test the hypothesis (H1),
ANOVA was performed.
H0:- there is no significant difference between stock return of small, medium, large NBFCs.
H1:- there is significant difference between stock return of small, medium, large NBFCs.

44
Table: 5.20 Descriptive of Small, Medium ,Large NBFC Return on Stock
ROS N Mean Std. Deviation
Large 5 1.47642 3.6294720
Medium 5 0.660840 4.8718062
Small 109 1.67366 10.6762216
Total 119 1.62282 10.2769574
Table: 5.21 Test of Homogeneity of Variances
ROS
Levene Statistic df1 df2 Sig.
2.617 2 116 0.077
Table: 5.22
ANOVA
ROS Sum of Squares Df Mean Square F Sig.
Between Groups 5.016 2 2.508 0.023 0.977
Within Groups 12457.655 116 107.394
Total 12462.671 118
From the above analysis we can conclude that as the return increases risk also increases. In case
of small NBFCs stock on return is1.67366 and risk is 10.6762216. For medium NBFCs return on
stock is 0.660840 and risk is 4.8718062, and for large NBFCs return on stock is1.47642 and risk

45
are 3.6294720. So there is no need of further analysis. This is descriptive analysis and we are not
taking whole population, its sample based so there is no need of further analysis.
From above homogeneity of variance is 0.077 which more than 0.05 so there is no significance
difference between the stock variance of small, medium, large NBFCs. Thus, one can compare
means of stock returns through ANOVA.
From the above ANOVA table we have found that significance value is 0.977 which is more
than 0.05 so the null hypothesis is accepted. Therefore we can conclude that there is no
significance difference between stock returns of small, medium and large NBFCs.

46
CHAPTER 6
FINDINGS

47
The significant (2-tailed) in our table is 0.000. This value is less than 0.05; because of
this we can conclude that return on stock is Non banking financial company is different
than banks stock return.
The significant (2-tailed) in our table is 0.545. This value is more than 0.05, because of
this we can conclude that earning per share in Non banking financial company is different
than banks earning per share.
The significant (2-tailed) in our table is 0.265. This value is more than 0.05, because of
this we can conclude that return on equity of Non banking financial company is different
than banks stock equity.
The significant (2-tailed) in our table is 0.546. This value is more than 0.05, because of
this we can conclude that esp. of private bank is different than public bank earnings per
share.
The significant (2-tailed) in our table is 0.152. This value is more than 0.05; because of
this we can conclude that return on equity of private bank is different than public bank
return.
The significant (2-tailed) in our table is 0.002. This value is less than 0.05; because of
this we can conclude that return on stock of private bank is different than public bank.
From the homogeneity of variance is 0.000 which less than 0.05 so there is significance
difference between the earning per share variance of small, medium, large NBFCs.
Robust Tests of Equality of Means is 0.107 which is more than 0.05. So Therefore we
can conclude that there is no significance difference between earning per share of small,
medium and large NBFCs.
From the ANOVA table we have found that significance value is 0.460 which is more
than 0.05 so therefore we can conclude that there is no significance difference between
stock returns of small, medium and large NBFCs.

48
From the ANOVA table we have found that significance value is 0.977 which is more
than 0.05 so therefore we can conclude that there is no significance difference between
stock returns of small, medium and large NBFCs.

49
CHAPTER 7
CONCLUSIONS

50
The research study title is “Banking v/s nonbanking financial companies analysis “On the
basis of the study, analysis of the financial data it can be concluded the comparison of banks and
NBFCs segment. The return of stock is bank is more comparing Non banking financial company,
so investor’s point of view is investment on bank companies more become they give more return.
The earnings per share bank are same as Non banking financial company. And the return on
equity is bank and Non banking financial company are also same as so bank is most of the
financial performance is same Non banking financial company but return on stock is different.
It can conclude the comparison of private bank and public bank segment. The return of stock is
private bank are more than the public bank. So investors point of view is investment private bank
more than public bank become they give more return. The earnings per share private are same as
public bank. And the return on equity is private bank and public bank are also same, so private
bank is most of the financial performance is same public bank but return on stock is different.
We can say that investors are more protecting investing in bank sectors comparing non banking
financial sectors.

51
APPENDICES
1. BIBLIOGRAPHY BOOKS:
1. Philip Kotler, “Marketing Management” 12 Edition Person Education.
2. I M PANDEY, “Financial Management” 10 Edition.
WEBLINK:
http://www.rbi.org.in/scripts/PublicationReportDetails.aspx?ID=456
http://www.rbi.org.in/scripts/FAQView.aspx?Id=58 http://habibahmadazmi.blogspot.in/
52
REFERENCES:
• Simcox, “Primitive Civilization or Outlines of the History of Ownership in Archaic
Communities, Vol. I, Swan Sonnensichein and Co., London (1894)
• Subarea aiyar, “Economic Life in a Malabar Village. The Bangalore Printing and
Publishing Co. Ltd., Bangalore, (1925). P.66
• Logan, William.The Malabar Manual, 1887, reprinted as Malabar by the Government of
Madras, Vol.1, (1951), p.173.
• V.Krishnan, “Indigenous Banking in South India, The Bombay State Co-operative Union,
Bombay, (1959)
• S.K. Basu, Non- Banking Financial Intermediaries and Monetary Policy, the Banker
(New Delhi), February 1961, pp. 755-761.
• C.D.Campbell and C.S. Ahn, “Kyes and Mujin-Financial Intermediaries in South Korea,”
Economic Development and Cultural Change 11 (1962): pp.55-68.
• Ardener,“ The Evolution of an Informal Financial Institution: The Rotating Savings and
Credit Associations in Cameroon” (1964)
• M.S. Joshi, “Financial Intermediaries in India”, University of Bombay, Series in
Monetary and International Economics, No. 8, 1965.
• Srinivas and Higuchi, “A Continuum of Informality of Credit: What Can Informal
Lenders Teach Us?” Savings and Development, No. 2 XX, Fin Africa, (1966).
• Sreedharan Menon, K.A.Schemes for starting Chitties under State Auspecies,
• Government of Kerala, (1967), p.16.