analysis of benzene and other vocs in consumer beverages ... · analysis of benzene and other vocs...
TRANSCRIPT
A Presentation by OI Analytical
Analysis of Benzene and Other VOCs in Consumer Beverages and Table-Ready Food
by Purge-and-Trap
A World of Solutions

Overview
• This presentation discusses the recent reports of benzene in some consumer beverages and includes the following information:– Introduction– Project definition– Analytical method and instrumentation– Sample preparation– Results from beverages and table-ready foods– Results from non-food consumer products– Conclusion and contact information

Introduction
• In November 2005, the FDA received reports that benzene, a human carcinogen, was present at low concentrations in some soft drinks containing benzoate salts and ascorbic acid.
• A resulting FDA survey of 100 products found that most of the beverages sampled contained either no detectable (ND) benzene or levels well below the USEPA water quality standard of 5 ppb.– There is no quality standard for benzene in consumer
beverages.– WHO water standard for benzene is 10 ppb.
• Four of the beverages tested in this survey contained benzene at levels above 5 ppb.
Source: http://www.fda.gov

Introduction (cont.)
• FDA’s Total Diet Study (TDS) results from 1995 to 2001 indicated that the levels of benzene may be higher.– Studies are underway to determine why the two sets of
test results were different.• Benzene has also been found in consumer beverages
internationally in the UK, Australia, and New Zealand.• The 2005 survey test results indicate that benzene
levels can be highly variable from lot to lot and may depend on factors such as time at elevated temperatures and exposure to light.
• Manufacturers are currently reformulating products that have been identified as containing greater than 5 ppb benzene.
Source: http://www.fda.gov

Project Definition
• An analytical method is demonstrated for the determination of benzene and other volatile organic compounds (VOCs) in consumer beverages and selected table-ready food products.
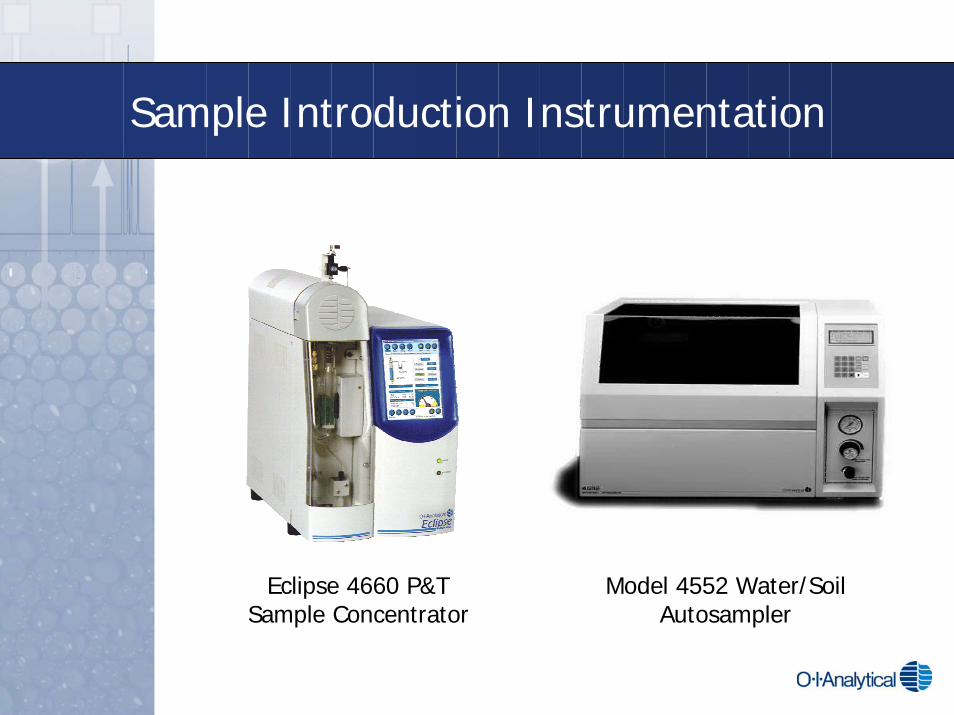
• Instrumentation included:– Eclipse 4660 P&T Sample Concentrator– Model 4552 Water/Soil Autosampler
• Naturally occurring VOCs, as well as contaminant residues from various sources (processing and packaging, flavor additives, breakdown products, etc.), can be determined by this method.

Overview of the Analytical Method
• VOC extraction, concentration, and introduction was performed by closed system purge-and-trap (P&T).– More sensitive than headspace methods– Lower detection limits– Cryogenic focusing is not necessary
• Compound speciation by gas chromatography• Detection and identification by mass spectrometry
– Scan or SIM mode• Quantitation using Internal Standard (IS)
Sample Introduction Instrumentation
Eclipse 4660 P&TSample Concentrator
Model 4552 Water/Soil Autosampler
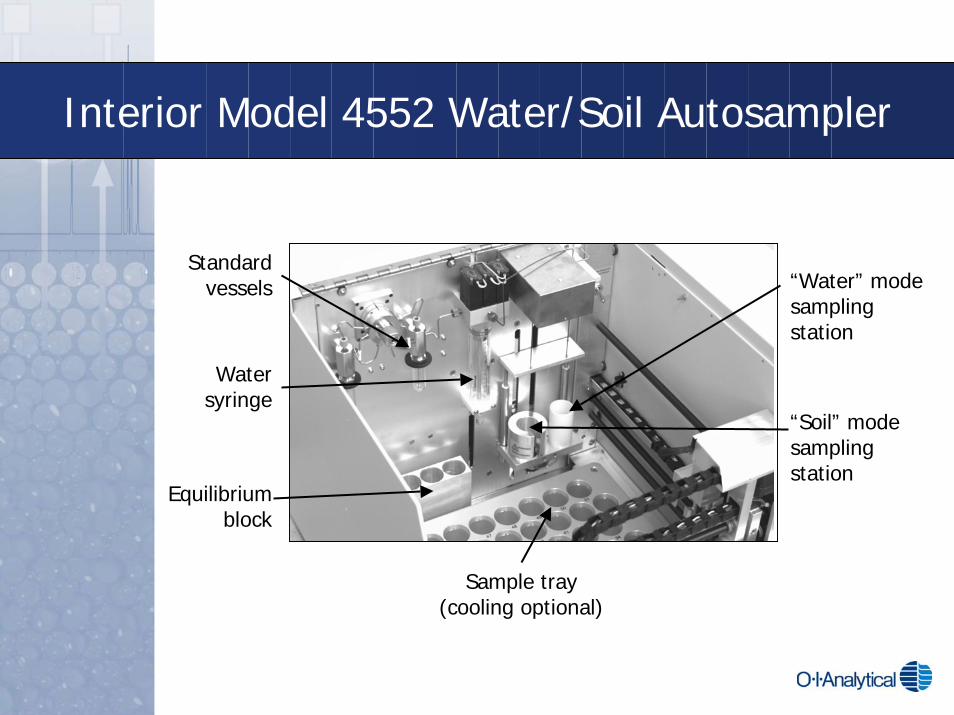
Interior Model 4552 Water/Soil Autosampler
Standardvessels
Equilibriumblock
Watersyringe
Sample tray(cooling optional)
“Water” modesamplingstation
“Soil” modesamplingstation

“Water” Mode vs. “Soil” Mode
Beverage in the “Soil” sampling
station did not foam
• For this project, all samples were purged using the “Soil” mode on the Model 4552 Autosampler.
• This technique minimized loss of VOCs in the solid food products and
• Minimized foaming of the beverage samples.– Beverages foamed
excessively when purged in the “Water“ mode
Sample Purging in “Soil” Mode
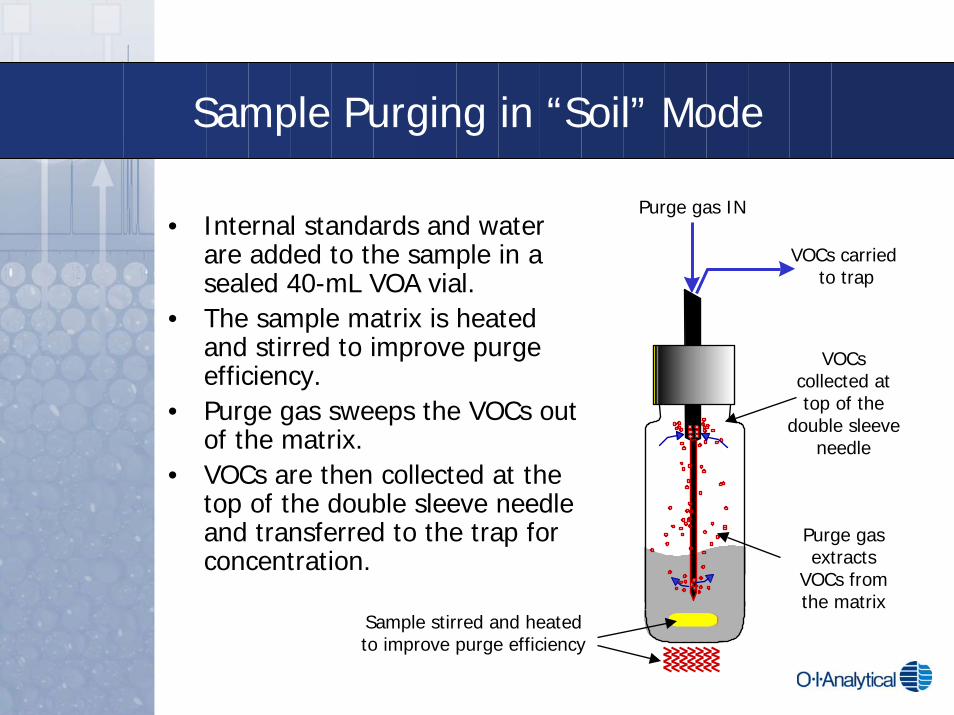
• Internal standards and water are added to the sample in a sealed 40-mL VOA vial.
• The sample matrix is heated and stirred to improve purge efficiency.
• Purge gas sweeps the VOCs out of the matrix.
• VOCs are then collected at the top of the double sleeve needle and transferred to the trap for concentration.
VOCs carriedto trap
Purge gas IN
Sample stirred and heated to improve purge efficiency
Purge gas extracts
VOCs from the matrix
VOCs collected at top of the
double sleeve needle

Beverage Sample Preparation
• Samples were cooled to 4°C prior to sampling.• A syringe was used to transfer 5 mL from the original
container to the 40-mL VOA vial.– Magnetic stir bar added to VOA vial
• The syringe was flushed with sample first.• Care was taken to minimize foaming during transfer.• Internal standards were added to vial with 5-mL DI
water at the autosampler.
Syringe used for sample transfer

Beverage Sample Preparation (cont.)
ColorlessCarbonated
Drink
PinkLemonade
OrangeSoda
DietCola
PineappleDrink
Cola

Instrument Conditions - Beverages
GC Agilent 6890N
Inlet 220°C, split 35:1
Column* Rtx-624, 30 m x 0.25 mm ID x 1.4 µm film, 0.8 mL/min column flow (He)
Oven 45°C (hold 4.3 min)12°C/min to 100°C (no hold)25°C/min to 250°C (hold 5.3 min)
MS Agilent 5975
Mode Scan, 35 to 260 amuSIM; m/z 78, 77, and 51
*Any standard VOC column can be used

VOCs in Consumer Beverages (cont.)
Diet ColaBenzene (7.2 min)
0.1 ppb
ColaBenzene (7.2 min)
0.1 ppb
Orange SodaBenzene (7.2 min)
0.1 ppb
Pineapple SodaBenzene (7.2 min)
0.2 ppb
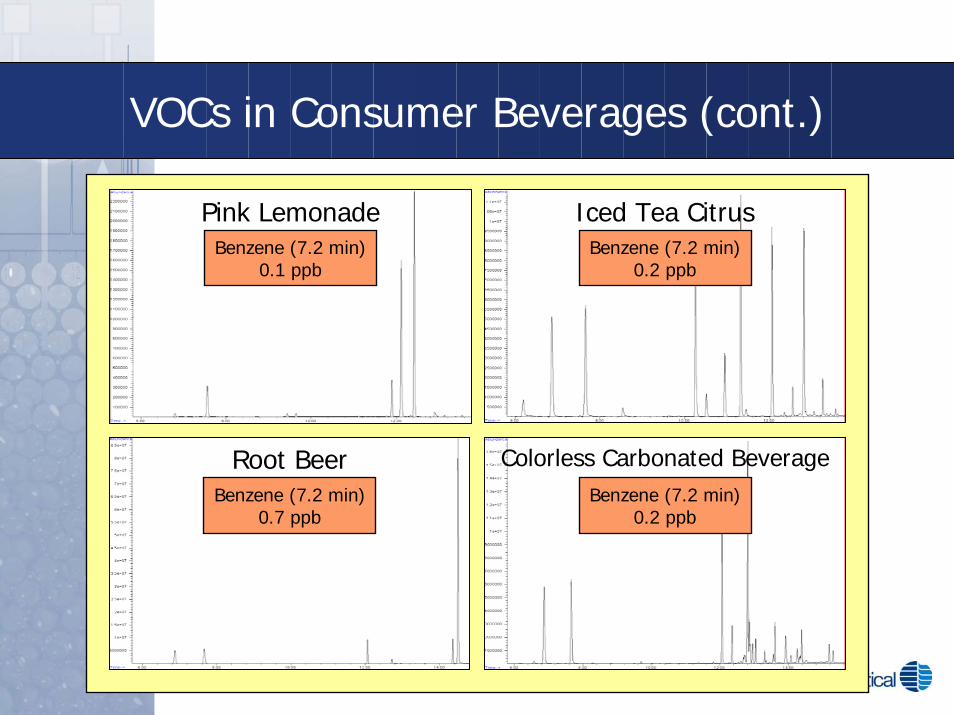
VOCs in Consumer Beverages (cont.)
Iced Tea CitrusBenzene (7.2 min)
0.2 ppb
Pink LemonadeBenzene (7.2 min)
0.1 ppb
Root BeerBenzene (7.2 min)
0.7 ppb
Colorless Carbonated BeverageBenzene (7.2 min)
0.2 ppb

Details: Benzene in Root Beer
Results of NISTLibrary Search on
peak at RT 7.26 min
TIC
BenzeneRT = 7.26 min
• Benzene was detected in the root beer sample at a concentration of 0.7 ppb.
• The benzene was quantified using Fluorobenzene as the IS; the benzene quantitation ion was m/z 78.
• Compound identity was confirmed by comparison to a reference spectrum in the NIST Library.
EICP
0.7 ppb Benzene(m/z 78,77,and 51)
Fluorobenzene(IS)

Beverage Ingredients
Sodium Benzoate Citric Acid
Ascorbic Acid
Phosphate Benzoate
Potassium Benzoate
Phosphoric Acid
Pineapple Soda X X
Iced Tea Citrus X X X
Pink Lemonade X X
Orange Soda #1 X X X
Orange Soda #2 X X X
Colorless Carbonated Beverage #1 X X
Colorless Carbonated Beverage #2 X X
Cola #1 X
Cola #2 X
Diet Cola X X
Root Beer X X X
Summary: Benzene in Beverages
• Benzene was found in most of the consumer beverages at concentrations well below the USEPA 5-ppb limit for benzene in drinking water.
• MS Scan and SIM modes produced equivalent results.
• The model 4552 Water/Soil Autosampler was operated in the “Soil” mode to minimize foaming of the carbonated beverages.
• All beverage samples were analyzed using the Eclipse 4660 P&T Sample Concentrator.

Solid Sample Preparation
• Samples were frozen and either chopped or blended.
• Approximately 5 grams were weighed into 40-mL VOA vial with stir bar.
• The Model 4552 Water/Soil Autosampler was used to add Internal Standards with 5 mL water prior to purging.

Food Samples in VOA Vials
HotDogs
PotatoChips
Fast FoodBurger
PizzaCereal

Instrument Conditions – Table-Ready Food
GC Agilent 6890N
Inlet 200°C, split 10:1
Column* DB-VRX, 60 m x 0.25 mm ID x 1.4 µm film, 1 mL/min column flow (He)
Oven 35°C (hold 6 min)6°C/min to 175°C (no hold)10°C/min to 220°C (hold 2 min)
MS Agilent 5973
Mode Scan, 35 to 260 amu
*Any standard VOC column can be used, including 30- and 20-m columns

VOCs in Table-Ready Foods
Benzene (15.0 min)1.7 ppb
Breakfast CerealBenzene (15.0 min)
0.8 ppb
Hot Dogs
Benzene (15.0 min)1.6 ppb
Potato ChipsBenzene (15.0 min)
1.7 ppb
Fast-Food Hamburger

VOCs in Table-Ready Foods (cont.)
Benzene (15.0 min)1.5 ppb
Pepperoni PizzaBenzene (15.0 min)
Not Detected
Butter
Benzene (15.0 min)1.6 ppb
Cheddar CheeseBenzene (15.0 min)
2.4 ppb
Ground Beef

VOCs in Table-Ready Foods (cont.)
Benzene (15.0 min)1.2 ppb
Peanut ButterBenzene (15.0 min)
2.8 ppb
Strawberries
Benzene (15.0 min)0.5 ppb
Diet Cola

Summary: Benzene in Table-Ready Food
• Benzene was found in most of the table-ready foods at concentrations ranging from ND in the Butter to 2.8 ppb in the Strawberries.– Slightly higher than in the beverages– There are no specified EPA or FDA standards for
benzene in table-ready foods• The model 4552 Water/Soil Autosampler was
operated in the “Soil” mode.• All of the samples were analyzed using the
Eclipse 4660 P&T Sample Concentrator.

Non-Food Consumer Products
• The same technique can be used to determine VOC content in non-food consumer products.
• Analytes of interest include flavor and fragrance compounds.
• Matrices that can be analyzed using this approach include toothpaste, shampoo, etc.
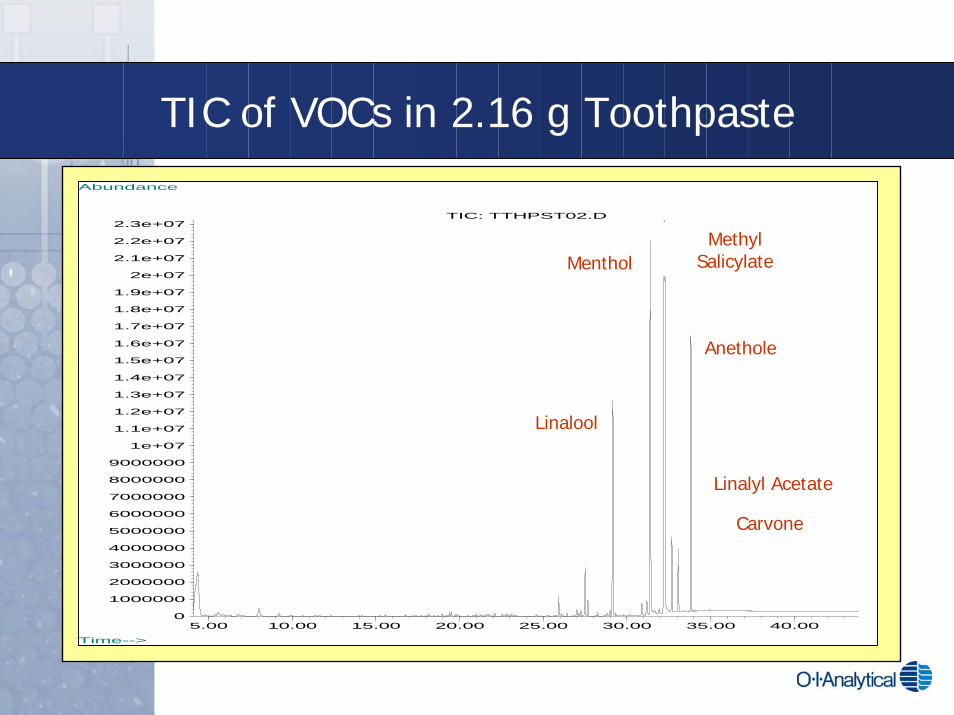
TIC of VOCs in 2.16 g Toothpaste
5.00 10.00 15.00 20.00 25.00 30.00 35.00 40.000
1000000
2000000
3000000
4000000
5000000
6000000
7000000
8000000
9000000
1e+07
1.1e+07
1.2e+07
1.3e+07
1.4e+07
1.5e+07
1.6e+07
1.7e+07
1.8e+07
1.9e+07
2e+07
2.1e+07
2.2e+07
2.3e+07
Time-->
Abundance
TIC: TTHPST02.D
Linalool
MentholMethyl
Salicylate
Anethole
Linalyl Acetate
Carvone

Selected Spectra From Toothpaste
20 30 40 50 60 70 80 90 1001101201301401501601701801902002100
1000
2000
3000
4000
5000
6000
7000
8000
9000
m/z-->
Abundance
Scan 4773 (29.168 min): SHMP001.D71 93
43 55
80121
136107
154 207
20 30 40 50 60 70 80 90 1001101201301401501601701801902002100
1000
2000
3000
4000
5000
6000
7000
8000
9000
m/z-->
Abundance
#114489: 1,6-Octadien-3-ol, 3,7-dimethyl-71
41
93
55
80
28121
105 136154
Linalool
40 60 80 100 120 140 160 180 200 220 240 2600
1000
2000
3000
4000
5000
6000
7000
8000
9000
m/z-->
Abundance
Average of 31.367 to 31.409 min.: TTHPST02.D9581
71
123
41 55138
109
207155 191170 253181
40 60 80 100 120 140 160 180 200 220 240 2600
1000
2000
3000
4000
5000
6000
7000
8000
9000
m/z-->
Abundance
#114614: Cyclohexanol, 5-methyl-2-(1-methylethyl)-, [1S-(1.a71
8141
9555
123138109
Menthol
20 40 60 80 100 120 140 160 180 200 220 240 2600
1000
2000
3000
4000
5000
6000
7000
8000
9000
m/z-->
Abundance
Average of 32.176 to 32.260 min.: TTHPST02.D120
92
152
65
3953
81 137109 207191177 253163 219 239
20 40 60 80 100 120 140 160 180 200 220 240 2600
1000
2000
3000
4000
5000
6000
7000
8000
9000
m/z-->
Abundance
#120911: Methyl Salicylate120
92
15239
65
532976 137
Methyl Salicylate

TIC of VOCs in 0.51 g Shampoo
5.00 10.00 15.00 20.00 25.00 30.00 35.00 40.000
1000000
2000000
3000000
4000000
5000000
6000000
7000000
8000000
9000000
1e+07
1.1e+07
1.2e+07
1.3e+07
1.4e+07
1.5e+07
1.6e+07
1.7e+07
1.8e+07
1.9e+07
2e+07
2.1e+07
2.2e+07
2.3e+07
2.4e+07
Time-->
Abundance
TIC: SHMP001.D
Ethyl-2-methyl Butyrate
LinaloolBenzyl Acetate

Selected Spectra From Shampoo
Ethyl-2-Methyl Butyrate
10 20 30 40 50 60 70 80 90 100 110 120 1300
1000
2000
3000
4000
5000
6000
7000
8000
9000
m/z-->
Abundance
Average of 19.380 to 19.475 min.: 10MLWTR.D71
43
88
60
10111637 53 80 127
10 20 30 40 50 60 70 80 90 100 110 120 1300
1000
2000
3000
4000
5000
6000
7000
8000
9000
m/z-->
Abundance
#24311: Butanoic acid, ethyl ester7143
29 88
60
10115 11637
Linalool
20 30 40 50 60 70 80 90 1001101201301401501601701801902002100
1000
2000
3000
4000
5000
6000
7000
8000
9000
m/z-->
Abundance
Scan 4773 (29.168 min): SHMP001.D71 93
43 55
80121
136107
154 207
20 30 40 50 60 70 80 90 1001101201301401501601701801902002100
1000
2000
3000
4000
5000
6000
7000
8000
9000
m/z-->
Abundance
#114489: 1,6-Octadien-3-ol, 3,7-dimethyl-71
41
93
55
80
28121
105 136154
Benzyl Acetate
20 40 60 80 100 120 140 160 180 200 220 2400
1000
2000
3000
4000
5000
6000
7000
8000
9000
m/z-->
Abundance
Scan 5118 (30.980 min): SHMP001.D108
91
150
7943
65
20754 135121 167 191 253180
20 40 60 80 100 120 140 160 180 200 220 2400
1000
2000
3000
4000
5000
6000
7000
8000
9000
m/z-->
Abundance
#119765: Acetic acid, phenylmethyl ester108
9143
15079
65
15 27 54 135121

TIC of VOCs in 10 mL Flavored Water
6.00 8.0010.0012.0014.0016.0018.0020.0022.0024.0026.0028.0030.0032.000
1000000
2000000
3000000
4000000
5000000
6000000
7000000
8000000
9000000
1e+07
1.1e+07
1.2e+07
1.3e+07
1.4e+07
1.5e+07
1.6e+07
1.7e+07
1.8e+07
Time-->
Abundance
TIC: 10MLWTR.D
Ethyl Butyrate
cis-3-Hexenol
Citral (Z)
Citral

Selected Spectra From Flavored Water
Ethyl butyrate
10 20 30 40 50 60 70 80 90 100 110 120 1300
1000
2000
3000
4000
5000
6000
7000
8000
9000
m/z-->
Abundance
Average of 19.380 to 19.475 min.: 10MLWTR.D71
43
88
60
10111637 53 80 127
10 20 30 40 50 60 70 80 90 100 110 120 1300
1000
2000
3000
4000
5000
6000
7000
8000
9000
m/z-->
Abundance
#24311: Butanoic acid, ethyl ester7143
29 88
60
10115 11637
cis-3-Hexenol
20 30 40 50 60 70 80 90 1001101201301401501601701801902002100
1000
2000
3000
4000
5000
6000
7000
8000
9000
m/z-->
Abundance
Average of 21.292 to 21.334 min.: 10MLWTR.D67
41
82
55
100 115 141 207
20 30 40 50 60 70 80 90 1001101201301401501601701801902002100
1000
2000
3000
4000
5000
6000
7000
8000
9000
m/z-->
Abundance
#108738: 3-Hexen-1-ol, (Z)-41
67
5582
31
100
Citral
40 60 80 100 120 140 160 180 200 220 240 2600
1000
2000
3000
4000
5000
6000
7000
8000
9000
m/z-->
Abundance
Average of 33.360 to 33.381 min.: 10MLWTR.D69
41
84
94109 13753 123
152207191177 253163
40 60 80 100 120 140 160 180 200 220 240 2600
1000
2000
3000
4000
5000
6000
7000
8000
9000
m/z-->
Abundance
#114142: 2,6-Octadienal, 3,7-dimethyl-69
41
84
9453 137109 123
152

Summary: VOCs in Non-Food Products
• The VOCs detected in the non-food consumer products were primarily flavor and fragrance compounds.– Identification by comparison to NIST Library spectra
• The model 4552 Water/Soil Autosampler was operated in the “Soil” mode.
• All of the samples were analyzed using the Eclipse 4660 P&T Sample Concentrator.

Conclusion
• The Model 4660 Eclipse P&T Sample Concentrator and Model 4552 Water/Soil Autosampler can be used to test for low levels of benzene and other VOCs in beverages, table-ready foods, and non-food consumer products.
• All of the beverage and food samples tested for this project were either ND for benzene or contained benzene at concentrations below the USEPA water quality level of 5 ppb.
• For information on the Eclipse P&T Sample Concentrator and the 4552 Water/Soil Autosampler, contact your OI Account Representative or call 979-690-1711.
Publication Number 2658