analysis of blue mesa inflow forecast errors tom pagano, 503 414 3010 aka: “wha’ happa’???”
DESCRIPTION
NRCS daily forecasts Official coordinated forecasts Daily forecast skill ObservedTRANSCRIPT

Analysis of Blue Mesa Inflow Forecast ErrorsTom Pagano,
[email protected] 503 414 3010
aka: “Wha’ happa’???”

Performance of 2008 forecasts

NRCS daily forecasts
Official coordinated
forecasts
Daily forecast skill
Observed
http://www.wcc.nrcs.usda.gov/wsf/daily_forecasts.html

2008
OfficialhistoricalpublishedoutlooksissuedApril 1

Blue Mesa + Taylor Park Reservoir Storage
Kac
ft
FullAug 1
Jan 1
Forecasts and storage have come up short since 2000

2008 obs
Historical NRCS “End of season”
daily forecast skill
This takes into account
all available dataincluding
spring/summer precipitation.
Even then, this yearstill falls out as a big anomaly
(major over-forecast)

April-July 2008 Blue Mesa Inflow Forecast Comparison
Forecast issue date
official1971-00 norm
Apr
il-Ju
ly in
flow
kac
-ft
NRCS dailyforecastsbased on:
Precip/Snow
obs

April-July 2008 Blue Mesa Inflow Forecast Comparison
Forecast issue date
official1971-00 norm
Apr
il-Ju
ly in
flow
kac
-ft
NRCS dailyforecastsbased on:Snow only
Precip/Snow
Precip onlyobs

April-July 2008 Blue Mesa Inflow Forecast Comparison
Forecast issue date
official
NWS ESP
1971-00 norm
Apr
il-Ju
ly in
flow
kac
-ft
NRCS dailyforecastsbased on:Snow only
Precip/Snow
Precip onlyobs

NRCS Daily Forecasts for Apr-Jul Blue Mesa Inflowusing snow information available by April 11
Forecast too high
Forecast too low
2008 snowpack composite well beyond
recent historical variability
Daily forecast input is a composite of 7 snotel sites:North lost trail, butte, park cone, brumley, independence pass, porphyry creek, slumgullion

2008
Historical range1981-2007

Park Cone Historical April 1 Snow DataSn
ow w
ater
equ
ival
ent (
in)
2008…2nd biggest
in last 42 years
6th biggestin last 72 years
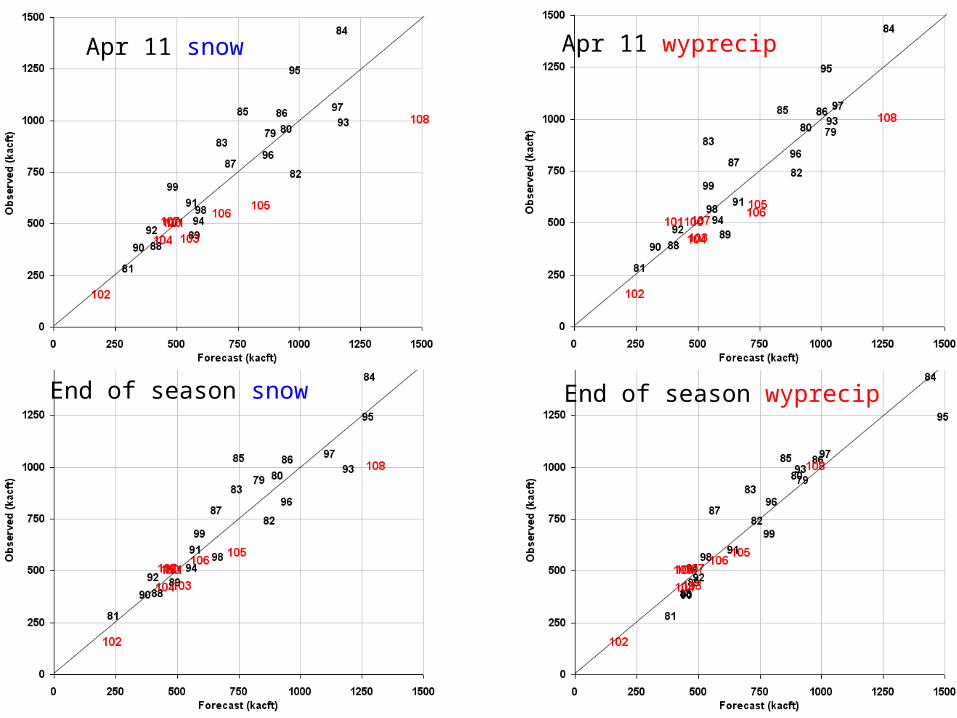
End of season wyprecipEnd of season snow
Apr 11 snow Apr 11 wyprecip

Sources of predictability 1950-99 VIC model skill(University of Washington)Explained variance in predicting Apr-July runoff
Blue – SnowpackGreen – Soil MoistureRed – El Nino
Darker colors- more important
(courtesy of M Dettinger, Scripps)
What basin processes are important?How have they been behaving recently?
(using actual and model data)
How is runoff driven by:
snow and precipitationsoil moisture
evaporation/temperature
Note: Model is not necessarily reality

snow and precipitation

Snow and precipitation are easily the dominant factor
R2
(% var expl)
1.0 = perfect
better
worse
Blue Mesa April-July Inflow Forecast Skill 1979-2007
Model swe + precip versus Model runoff
Univ Washingtonmodel Snow + Precip
NRCS Daily Forecasts
Real world SNOTEL vs Real world runoff
Issue date of forecast
Snow/precipitation explain upwards of 90% of
the year to year variability in runoff

Gunnison BasinApril-June Precipitation
1920-2008
Per
cent
of 1
971-
2000
ave
rage
Data from WESTMAP: http://www.cefa.dri.edu/Westmap/
200872%
200230%
1995206%
2000-08 avg:75% norm
Precipitation after April 1 is important
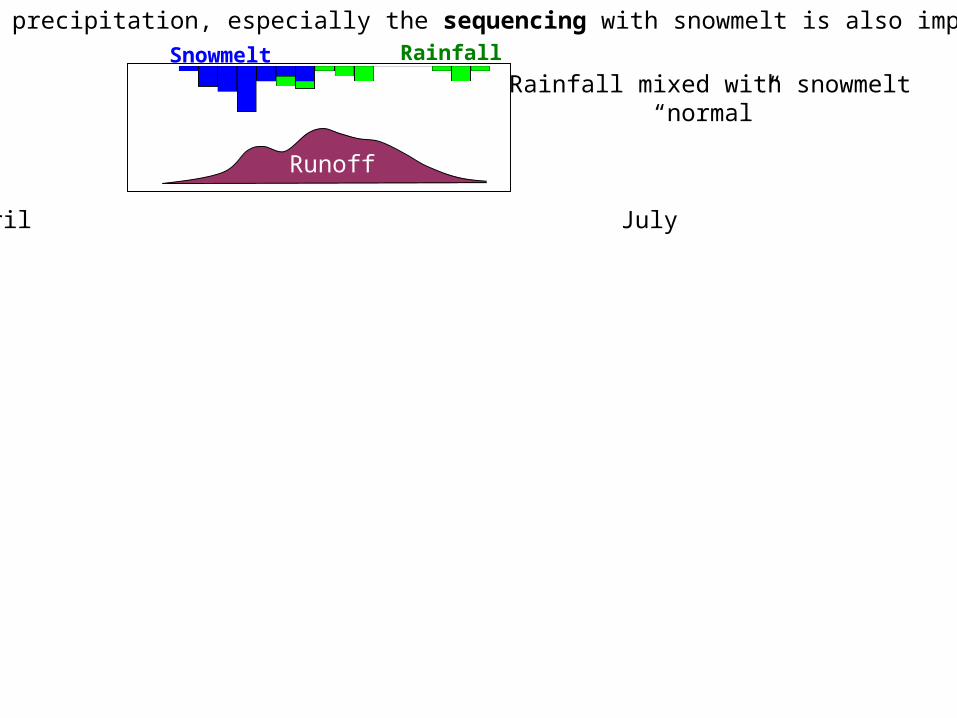
Spring precipitation, especially the sequencing with snowmelt is also important
Runoff
Snowmelt RainfallRainfall mixed with snowmelt
“normal”
April July

Spring precipitation, especially the sequencing with snowmelt is also important
Runoff
Snowmelt RainfallRainfall mixed with snowmelt
“normal”
Rainfall boosting snowmeltLarger volumes
Snowmelt and rainfall separateNot enough “momentum” to produce big volumes
All these complex interactions are tough to “cartoonize”;Simulation models can handle this… but still it’s tough to predict beyond 1-2 weeks.
April July

Spring precipitation, especially the sequencing with snowmelt is also important
April July
Runoff
Snowmelt RainfallRainfall mixed with snowmelt
“normal”
Rainfall boosting snowmeltLarger volumes
Snowmelt and rainfall separateNot enough “momentum” to produce big volumes
Even then, however,high heat and no rain
can lead to “pouring sunshine”
All these complex interactions are tough to “cartoonize”;Simulation models can handle this… but still it’s tough to predict beyond 1-2 weeks.

2008Runoff
Blu
e M
esa
natu
ral i
nflo
wka
c-ft/
day
Total:Independ PassSnowmeltRainfall
SchofieldSnowmeltRainfall
(inches)
Many fits and starts to snowmelt…Almost no spring rainfall

2008Runoff
Blu
e M
esa
natu
ral i
nflo
wka
c-ft/
day
Total:Independ PassSnowmeltRainfall
SchofieldSnowmeltRainfall
(inches)
1999
Good mix of rainand snowmelt
1993

2008Runoff
Blu
e M
esa
natu
ral i
nflo
wka
c-ft/
day
Total:Independ PassSnowmeltRainfall
SchofieldSnowmeltRainfall
(inches)
1999
Snowpack poor, but “perfect storm”
for runoff efficiency

Soil moisture/GroundwaterAre we still feeling the effects of 2002?

Blue Mesa Basin Soil Moisture 2001-2008(According to the Univ Washington Model- top 2 layers)

Blue Mesa Basin Soil Moisture 2001-2008(According to the Univ Washington Model- top 2 layers)
(According to Park Cone Snotel- ~0-30” depth)
Snotel does poorly in frozen soils, so that has been censored
Model resembles snotel, but also remember we’re comparing basin average with point measurement

Blue Mesa Basin Soil Moisture 2001-2008(According to the Univ Washington Model- top 2 layers)
(According to Park Cone Snotel- ~0-30” depth)
Snotel does poorly in frozen soils, so that has been censored
Univ Washington Model “deep” soil moisture layer

Colorado Active Well Level Network
Only one Colorado USGS groundwater station
in realtime (Pueblo)
Gunnison:Period of record 2003-2008 + 1996
Measured 1x/year
Crested Butte
8/1996
Taken inMid-may

What influence humans?Does it matter?
Blue Mesa
For each site, all measurements Jan-Jun, Jul-Dec are averaged by year. Station half-year data then converted into standardized anomaly (o-avg(o))/std(o) vs
period of record for the half year. Multiple stations are then averaged.

Univ Washington model Blue Mesa inflow basin total soil moisture (mm)
January 1 1920-2008
Start of
2008

Evapotranspiration/sublimation

Butte SNOTEL sublimation (as modeled by NOHRSC)
Wat
er y
ear t
o da
te
cum
ulat
ive
subl
imat
ion
(inch
es)
Oct-Jul SublYear Precip Prcp2004 19.3” 30%2003 19.6” 29%
2005 24.5” 15%2006 22.7” 16%2007 18.1” 18%2008 29.3” 10%
Long-term averageevaporation + transpiration + sublimation = 73% of annual precipitation

Gunnison BasinMarch-May Average Temperature
1920-2008D
epar
ture
from
197
1-20
00
Data from WESTMAP: http://www.cefa.dri.edu/Westmap/
Warm spring temps recently
exceptlastyear

How good are forecasts in general?
“Perfect forecasts are all alike;
Every bad forecast is bad in its own way.”

“Published Official”-Subjective (based on objective guidance)-Humans actively involved-Coordinated by NRCS+NWS

“NRCS Daily”-Objective-Statistical model-based-Highly automated-Only uses SNOTEL snow+wytd precip
http://www.wcc.nrcs.usda.gov/wsf/daily_forecasts.html

http://www.hydro.washington.edu/forecast/westwide/sflow/index.shtml
University of Washington-Objective-Simulation model-based-Highly automated-Research grade

NWS ESP-Objective-Simulation model-based-Human controlled/vetted (in realtime)

Sources
Natural flow: (1968-2008)http://www.usbr.gov/uc/crsp/GetSiteInfoBlue Mesa outflow – Taylor Park change in storage
Published official: (1971-2008)ftp://ftp.wcc.nrcs.usda.gov/data/water/forecast/With gaps filled in from other sources
NWS ESP: (1981-2002)http://www.nwrfc.noaa.gov/westernwater/database/index.php?id=BMDC2#forecasts
University of Washington: (1971-2008)http://www.hydro.washington.edu/forecast/hepex/esp_cmpr/NRCS Daily: (1979-2008)
http://www.wcc.nrcs.usda.gov/wsf/daily_forecasts.htmlAll reforecasts available internally, some available online

Blue Mesa April-July Inflow Forecast Skill 1981-2002
RMSE as % 1971-2000
Normal
0 = perfect
worse
better Published officialNRCS Daily
Issue Month of Forecast(e.g. January 1)
RMSE = sqrt(avg(f-o)2)
Period common to all datasets

Blue Mesa April-July Inflow Forecast Skill 1981-2002
RMSE as % 1971-2000
Normal
0 = perfect
worse
better Published officialNRCS Daily
NRCS Daily (residual)
Issue Month of Forecast(e.g. January 1)
RMSE = sqrt(avg(f-o)2)
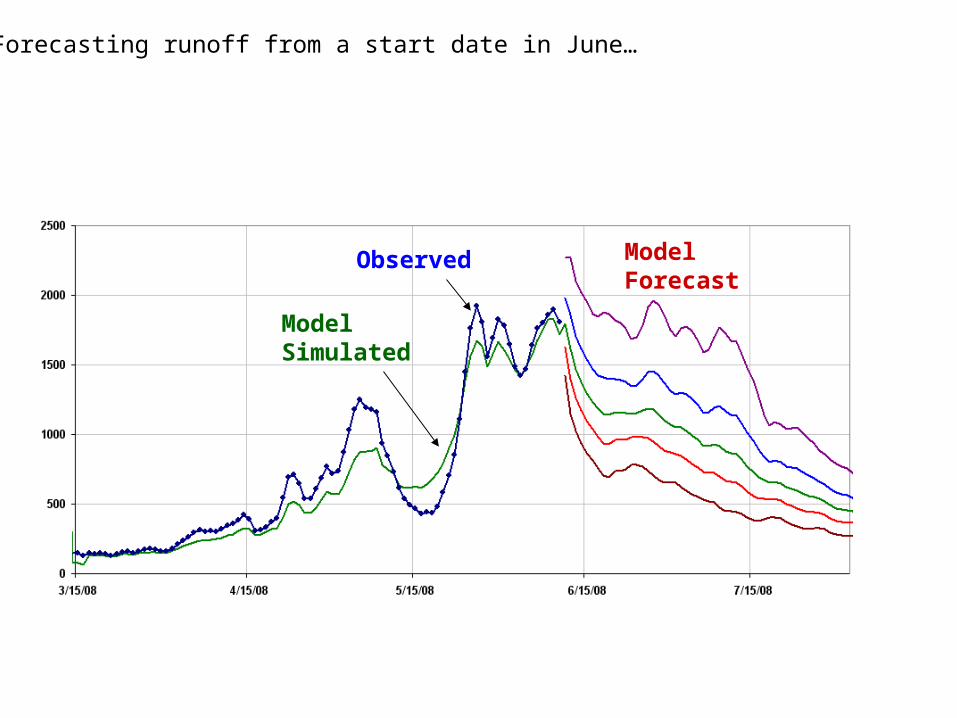
ModelForecast
Observed
Model Simulated
Forecasting runoff from a start date in June…

ModelForecast
Observed
Model Simulated
Forecasting runoff from a start date in June…
Is your April-July “forecast” your 1. observed + future only forecast or is it2. simulated + future only forecast?
Forecasting “residuals” (1.) is more accurate but is an “open book” exam

Blue Mesa April-July Inflow Forecast Skill 1981-2002
RMSE as % 1971-2000
Normal
0 = perfect
worse
better Published officialNRCS Daily
NRCS Daily (residual)
Issue Month of Forecast(e.g. January 1)
RMSE = sqrt(avg(f-o)2)

Blue Mesa April-July Inflow Forecast Skill 1981-2002
RMSE as % 1971-2000
Normal
0 = perfect
worse
better Published officialNRCS Daily
NRCS Daily (residual)
University of Washington
Issue Month of Forecast(e.g. January 1)
RMSE = sqrt(avg(f-o)2)

Blue Mesa April-July Inflow Forecast Skill 1981-2002
RMSE as % 1971-2000
Normal
0 = perfect
worse
better Published officialNRCS Daily
NRCS Daily (residual)
University of Washington
NWS ESP
Issue Month of Forecast(e.g. January 1)
RMSE = sqrt(avg(f-o)2)

Blue Mesa April-July Inflow Forecast Skill 1981-2002
R2
(% var expl)
100 = perfect
better
worse
Published officialNRCS DailyNRCS Daily (residual)
University of Washington
NWS ESP
Issue Month of Forecast(e.g. January 1)
What’s different: This does not
penalize for bias

Blue Mesa April-July Inflow Forecast Bias 1981-2002
ForecastBias as %1971-2000
Normal
Forecasts too high
Forecaststoo low
Issue Month of Forecast(e.g. January 1)
Published officialNRCS DailyUniversity of Washington
NWS ESP
Bias = avg(f) – avg(o)

Blue Mesa April-July Inflow Forecast Bias 2000-2007
ForecastBias as %1971-2000
Normal
Forecasts too high
Forecaststoo low
Issue Month of Forecast(e.g. January 1)
Published officialNRCS Daily
University of Washington
NWS ESP(not available)
Bias = avg(f) – avg(o)
Note:2000-2007 were dry years.
Comparatively, the 71-00 normal had a “bias” of +36% (!)

Conclusions
From a snow perspective, 2008 was an epic bust.Water year precipitation matched runoff however.
Lack of spring precip and sequencing of snowmelt important
All existing models have comparable skill.30% normal error is typical Jan 1, 20-25% error on April 1
Snow, rainfall, evap, soil moisture important to runoff. Some easier to quantify than others.
Recommendations
Have local/anecdotal observationsfeed quantitative historical analyses
to build appropriate models.
Collect the right data to support creation of objective operational guidance, tempered by reason.
Recognize the unknowable versus the unknown.
Remember too that higher accuracy is not the only way to improve forecasts

Snow sublimation (inches/day)
Snow sublimation (inches/day)
Daily average wind speed (mph)
Daily average relative humidity (%)
Butte SNOTEL Site
Data fromNOHRSC model
Nov 2002-Aug 2008www.nohrsc.nws.gov
Note that winds don’t vary from year to year in most hydrologic models
(e.g. NWS and UWashington)

Blue Mesa Basin Evaporation Losses by Month(according to the Univ Washington Model)
Monthly average temperatures (deg F)
Eva
po-tr
ansp
iratio
n (k
af/m
onth
) April-June: temperatures and ET
related
July-September: ET moisture driven
November-March: ET constant, small
jan feb
mar
apr
may
jun jul
aug
sep
oct
novdec

Blue Mesa Basin Water Year Water Balance(according to the Univ Washington Model)
Kac
-ft/y
ear
Long-term average Evapotransporation (ET)/Precipitation = 73%
ET doesn’t vary much from year to year. Even then, 65% of its variability depends annual precipitation
(at least in the model’s reality…)
PrecipitationRunoff
Evapotranspiration