analysis of central clearing interdependencies · interdependencies between ccps and liquidity and...
TRANSCRIPT

Analysis of Central Clearing Interdependencies
5 July 2017

ii
iii
Table of contents
Page
Introduction ................................................................................................................................ 1
1. Key findings ................................................................................................................. 2
2. Data overview .............................................................................................................. 3
3. Interdependencies between CCPs and their clearing members ................................... 6
4. Interdependencies between CCPs and custodian and settlement banks..................... 12
5. Interdependencies between CCPs and liquidity and credit providers ........................ 14
6. Interdependencies between CCPs and investment service providers ........................ 16
7. Conclusion ................................................................................................................. 19
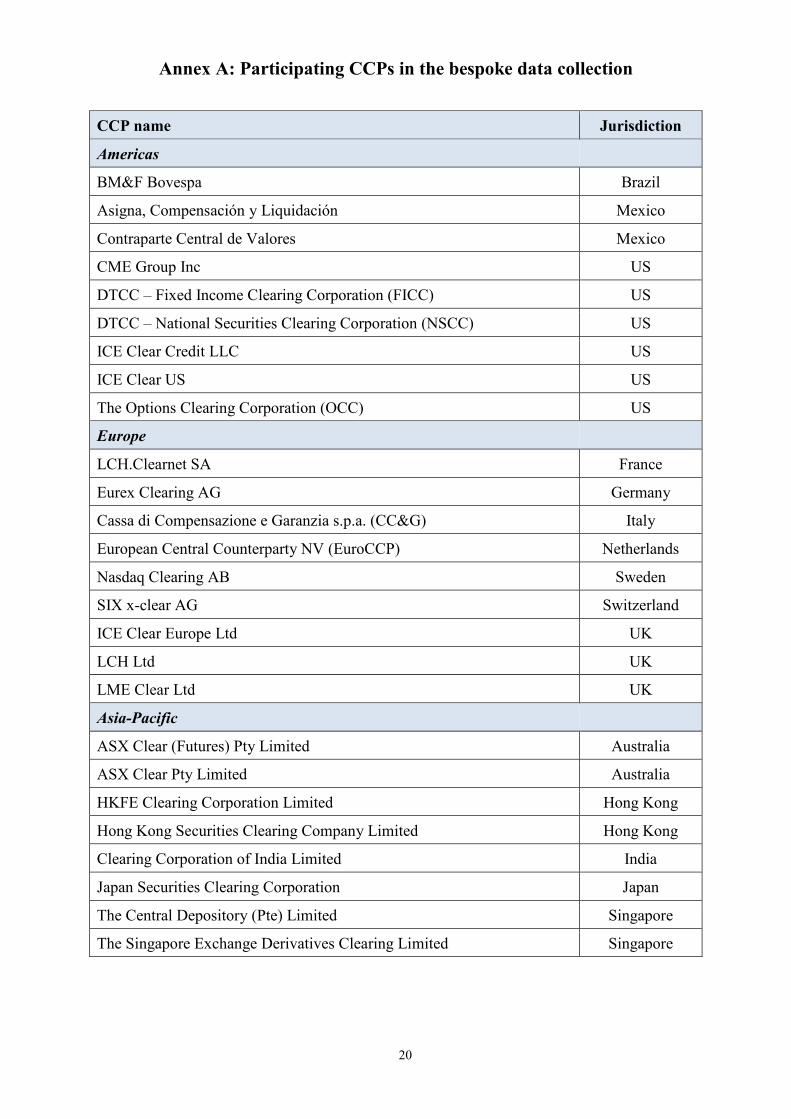
Annex A: Participating CCPs in the bespoke data collection .................................................. 20
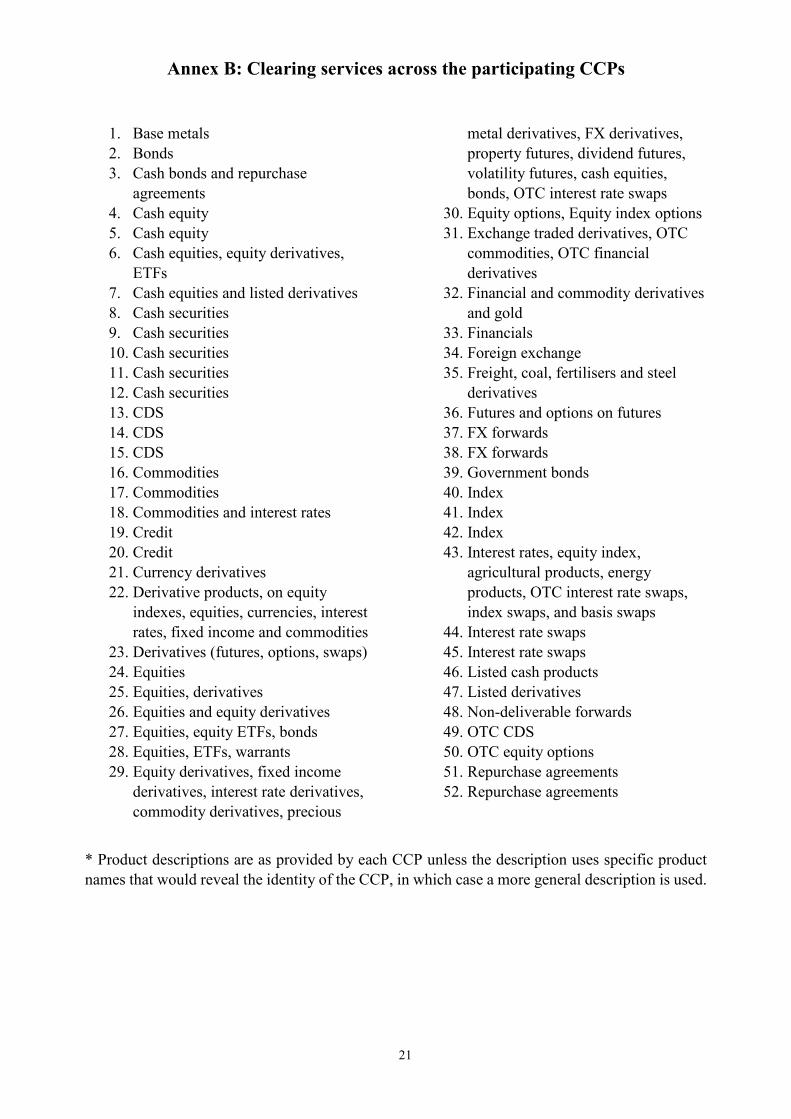
Annex B: Clearing services across the participating CCPs ...................................................... 21
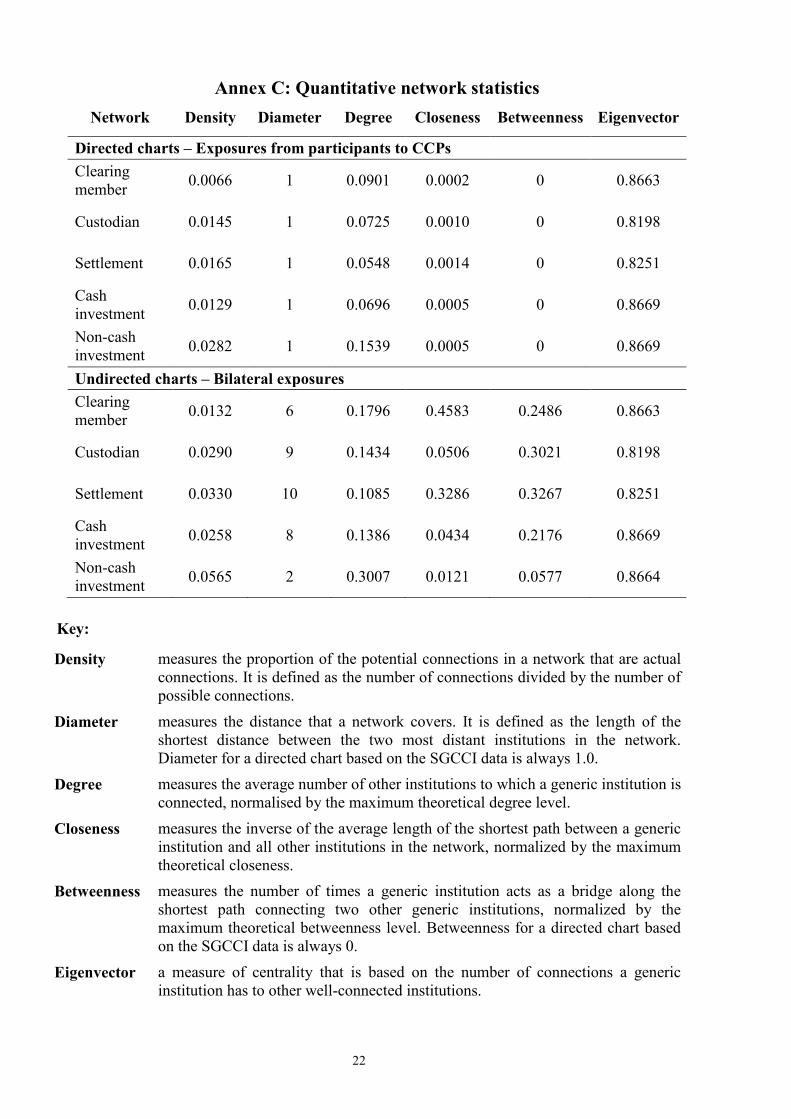
Annex C: Quantitative network statistics ................................................................................. 22
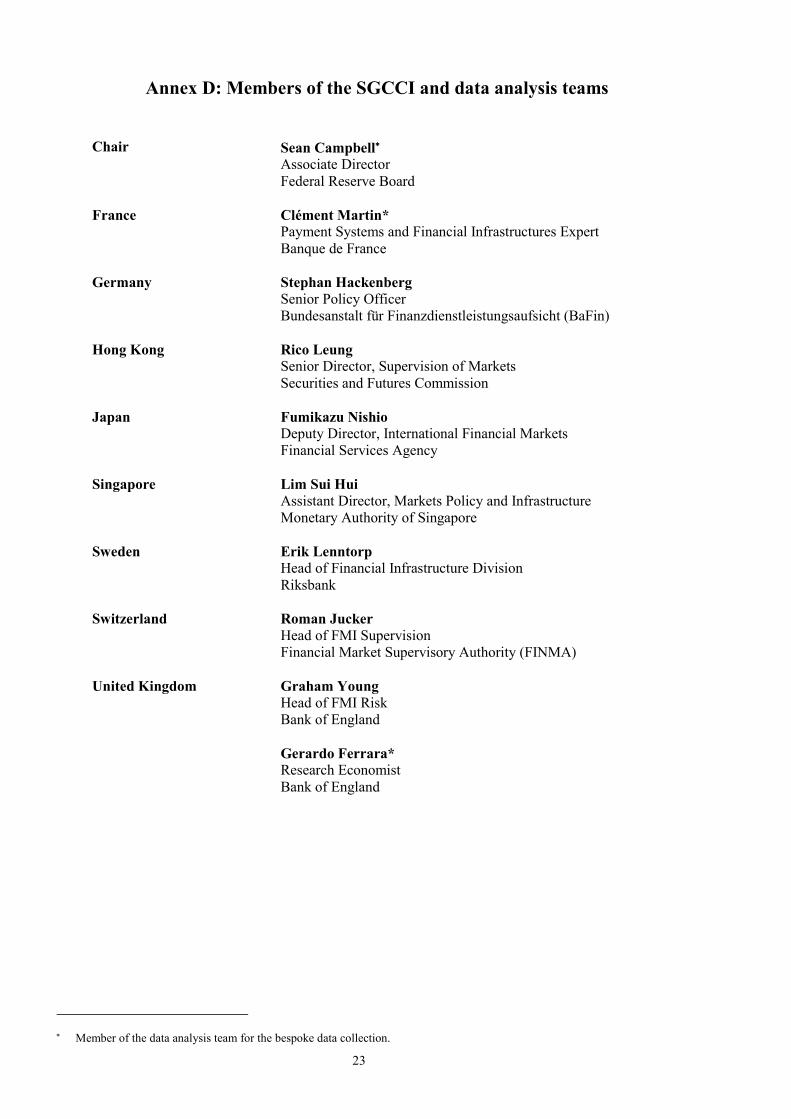
Annex D: Members of the SGCCI and data analysis teams .................................................... 23

iv
1
Analysis of Central Clearing Interdependencies
Introduction
In 2015 the Chairs of the FSB Standing Committee on Supervisory and Regulatory Cooperation (FSB SRC), the FSB Resolution Steering Group (FSB ReSG), the Committee on Payments and Market Infrastructure (CPMI), the International Organization of Securities Commissioners (IOSCO), and the Basel Committee on Banking Supervision (BCBS) constituted a study group to identify, quantify and analyse interdependencies between central counterparties (CCPs) and major clearing members and financial service providers, and the resulting systemic implications. Central clearing helps to mitigate systemic risk and (compared to the non-centrally cleared market) provides transparency by replacing the complex and opaque web of ties between market participants (in particular banks) with simpler links between CCPs and their clearing members. Given the rise and pace of central clearing, the Chairs identified the need to better understand the interdependencies in central clearing and to inform the other international streams of work on enhancing CCP resilience, recovery planning and resolution.1
In many cases, CCP membership is drawn from a common group of large banks, which in addition to contributing to pre-funded financial resources, are also important providers of financial services to CCPs (such as liquidity provision, lines of credit, custodianship, settlement, and cash management). These interdependencies are very often cross-border. To further understand the interconnections in central clearing, the Study Group on Central Clearing Interdependencies (SGCCI)2 launched work to globally map interconnections between CCPs, clearing members, and other financial entities that provide financial services that are critical to the operations and viability of CCPs. This effort was aimed at providing a comprehensive overview of the connections between different aspects of the central clearing system while also focusing, where possible, on the types of connections that could lead to potential contagion.
The SGCCI engaged with a wide array of industry stakeholders – CCPs, clearing members, custodian and settlement banks, asset managers, and outside academics – to better understand other perspectives on the most relevant types of relationships and connections that are important for mapping the central clearing system. The SGCCI also engaged with these stakeholders to better understand what specific types of data and metrics would be most helpful in measuring the relevant interdependencies. The SGCCI then developed a bespoke data collection that was informed by its interaction with industry stakeholders. This data collection was designed to be a global data collection that would directly survey a large number of CCPs from a variety of jurisdictions and covering a number of products. The survey aimed to capture a broad array of information to inform the analysis of interconnections ranging from data on CCP members, to information on the relationship between CCPs and their custodian and settlement banks, their credit and liquidity providers, their investment counterparties as well as other important service providers such as those entities providing default management services.
This report provides the main findings drawn from the analysis of the bespoke CCP data collection, which are largely descriptive. The analysis excludes counterparties that are government institutions to focus on the landscape of interdependencies in the private sector. 1 See FSB, 2015 CCP Work Plan, September 2015 at http://www.fsb.org/2015/09/2015-ccp-workplan/. 2 See Annex D for a list of SGCCI members.
2
The analysis in this report is static: the analysis was performed using data collected at one specific point in time (as of 30 September 2016) and may be affected by time-specific events. Second-round effects and endogenous feedback mechanisms that could amplify (or dampen) initial stress are not considered.
While the results presented in this report are useful for comparing different aspects of the central clearing system, such as the CCP-clearing member network and the CCP-custodian network, they are not suited to drawing conclusions regarding the overall risk profile of the clearing system including the adequacy of financial resources. Nor are the results in this report appropriate for the purpose of examining the impact of counterparty default on the broader financial system or the real economy, and the transmission of risks through CCPs. This report does not include any policy recommendations, but informs work on CCP resilience, recovery planning and resolution.
1. Key findings
This is the first comprehensive data collection of its type, from 26 CCPs across 15 jurisdictions in North America, South America, Europe and Asia-Pacific. The data permit a global analysis of interdependencies in central clearing across a broad range of products. The analysis addresses CCPs, their members and other financial institutions that are linked to CCPs such as custodians, settlement banks, credit and liquidity providers and investment counterparties. These data provide a unique view of the central clearing landscape that is not available elsewhere. The results from the SGCCI’s analysis are varied and depend on the specific aspects of the central clearing system that are being analysed but some broad themes from the study can be made. In this study, analysis of clearing members and service providers was carried out at a group level rather than individual legal entity level, unless otherwise stated.
1. Financial resources (initial margin and default fund) are concentrated at a small number of CCPs. The ten or so largest CCPs3 account for approximately 88 per cent of total financial resources provided to all CCPs. The remaining CCPs in this study are considerably smaller.
2. Exposures to CCPs are concentrated among a small number of institutions. The largest 20 out of 307 clearing members included in this analysis account for approximately 75 per cent of total financial resources (initial margin and default fund) provided to CCPs by those members. The analysis indicates that the default of a CCP’s top two clearing members could result in defaults of the same entity or affiliates in up to 23 other CCPs included in this analysis. However, the analysis also suggests that this pattern is not common across all types of relationships. For example, even the default of a CCP’s top five credit and liquidity providers would not generally have a significant impact on the provision of credit and liquidity to other CCPs.
3. The relationships mapped in this report are all characterised, albeit to varying degrees, by a core of highly connected CCPs and financial institutions and a periphery of less highly connected CCPs and financial institutions. At the same time, even these less highly connected CCPs often maintain connections to at least one highly connected
3 As measured by prefunded financial resources, which equals the sum of initial margin and default fund.
3
financial institution that ultimately connects the CCP to the central (more interconnected) part of the network structure. This suggests that for each network analysed, even members or CCPs that appear somewhat peripheral may be influenced by what happens to entities within the central part of the network.
4. Clearing members and clearing member affiliates are also important providers of other critical services required by CCPs and can maintain a significant number of relationships with several CCPs. There is generally no strong relationship between the size of an institution’s activity as a clearing member and size of its activity as a service provider. For example, the largest clearing members are generally not also the largest custodians or investment counterparties. However, there are some large clearing members in aggregate that are also large providers of other services in the aggregate, such as credit and liquidity and settlement provision.
5. Among each of the different types of relationships between CCPs and other entities, a small number of entities tend to dominate each resulting network. These concentrations suggest that shocks to one central element of each CCP network would likely have significant consequences for the rest of the network. An exception to this finding is that CCPs’ use of cash investment counterparties is reasonably well-diversified, as the top five cash investment counterparties account for just over one-third of all cash investments.
2. Data overview
The data for this study were collected as of 30 September 2016 from 26 CCPs from jurisdictions in North America, South America, Europe and Asia-Pacific (see Annex A), and thus represent a snapshot in time. The 26 CCPs included in the data collection vary significantly in terms of the products that they clear as well as their overall size and level of activity but nevertheless represent most if not all of what would be considered the most significant CCPs that should be included in a study of this type. Throughout the report, reference to the ‘central clearing system’ refers to the 26 CCPs surveyed.
Generally, the size of each CCP in each network is represented by the total level of resources or service provision provided to the CCP in that network. Similarly, the size of each service provider in each network is represented by the total level of resources or services it provides to CCPs in that network. These measures often represent rough proxies for size. For example, the amount of financial resources that are held by the CCP to manage counterparty exposures roughly approximates a CCP’s estimate of the market risk posed to it by its clearing members and reflects factors including the products cleared and the CCP’s own risk management procedures. Also, the ranking of clearing members by the sum of their initial margins and default fund contributions reflects the ranking of clearing members’ exposures. Hence, total prefunded financial resources are used to proxy for the size of CCPs in the central clearing network and to rank clearing members’ exposures to CCPs. The aggregate prefunded financial resources contributed by each clearing member to the central clearing network represents that clearing member’s size, and the prefunded financial resources a clearing member contributes to a given CCP represents that clearing member’s size within that CCP’s membership.
4
Each CCP was asked to provide a variety of quantitative and qualitative data on several important characteristics relating to the CCP’s:
• Clearing members – Clearing members were identified at the “clearing service” level. A clearing service is defined as a set of products cleared by the CCP that share resources from the same default fund. Some CCPs maintain a single default fund in which case there is no distinction between a CCP and a clearing service but other CCPs included in the data collection maintain several default funds and hence clearing services. The default of a clearing member exposes a CCP to credit and liquidity risks, because the CCP guarantees the fulfilment of obligations to surviving clearing members.
• Custodians – Firms that hold cash and securities collateral on behalf of CCPs and their members. Disruptions at a custodian exposes a CCP to operational and liquidity risks, as the CCP may experience a delay in accessing its collateral. In case of cash collateral, the CCP may also face credit risks.
• Settlement banks – Banks that process payments, settlements and collateral transfers between CCPs and their members. Disruptions at a settlement bank exposes a CCP to operational risk as it experiences delays in fulfilling payment and settlement obligations or transfers of collateral.
• Intraday liquidity and settlement lines – Providers of intraday liquidity and settlement lines to CCPs. Disruptions at an intraday liquidity provider exposes a CCP to operational and liquidity risks as payments and settlements may be delayed.
• Credit and liquidity facilities – Providers of overnight and term credit and liquidity facilities. Disruptions at a provider of credit and liquidity facilities exposes a CCP to liquidity risks.
• Cash investments – Counterparties to investments such as repurchase agreements and deposits that are used by CCPs to invest cash resources. Disruptions at providers of cash investment services may expose a CCP to credit, operational and liquidity risks.
• Non-cash investments – Counterparties to investments for non-cash resources, typically securities lending services whereby CCPs lend out available non-cash collateral. Disruptions at these services providers exposes a CCP to operational and liquidity risks.
• Total investment portfolio and non-cash collateral portfolio – CCPs hold certain non-cash investment assets (e.g. government bonds) and investments facilitated by third-party asset managers. Failure of providers of investment services may expose a CCP to credit, operational and liquidity risks.
CCPs submitted anonymised information to the SGCCI data analysis team. To reduce the potential to reverse engineer the identity of a CCP, CCPs were asked to provide exposures to their top 25 clearing members only for each clearing service4 (though the largest 25 clearing
4 CCPs were also asked to provide their exposures to their top 25 custodians, investment managers, intraday liquidity
providers, credit and liquidity facilities, non-cash investment managers, and default management services; their top 15 exposures to settlement banks, and their top 11 exposures to investment fund managers.
5
members typically represent the majority of the prefunded resources to the CCPs included in the survey).
The bespoke data collection yielded information for 52 clearing services and 307 clearing members. Annex B presents a listing of the specific products cleared by each clearing service. The CCPs and clearing services included in the data collection cover a wide variety of products and demonstrates that the underlying sample of CCPs and clearing services represents a broad cross section of the clearing landscape that is not concentrated in any specific product or asset class.
It should be noted that CCPs were asked to report their exposures to counterparties at the parent level. For example, a clearing member that appears at two CCPs may refer to the same legal entity or to two legal entities belonging to the same corporate group. As a consequence, to conclude that a clearing member default at one CCP impacts a second CCP it is necessary to assume that the clearing member’s default is associated with the default of other legal entities belonging to the same corporate group. Throughout this report, the term ‘entities’ conservatively refers to members of the same group or parent. The data do not include information about risk management within CCPs or on any entity other than CCPs with whom financial entities have relationships with. As a result, one must be cautious in seeking to draw any conclusions related to the impact of counterparty default on the broader financial system or the real economy or analyse the transmission of risks through CCPs.5
2.1 Interconnections across clearing members and financial service providers
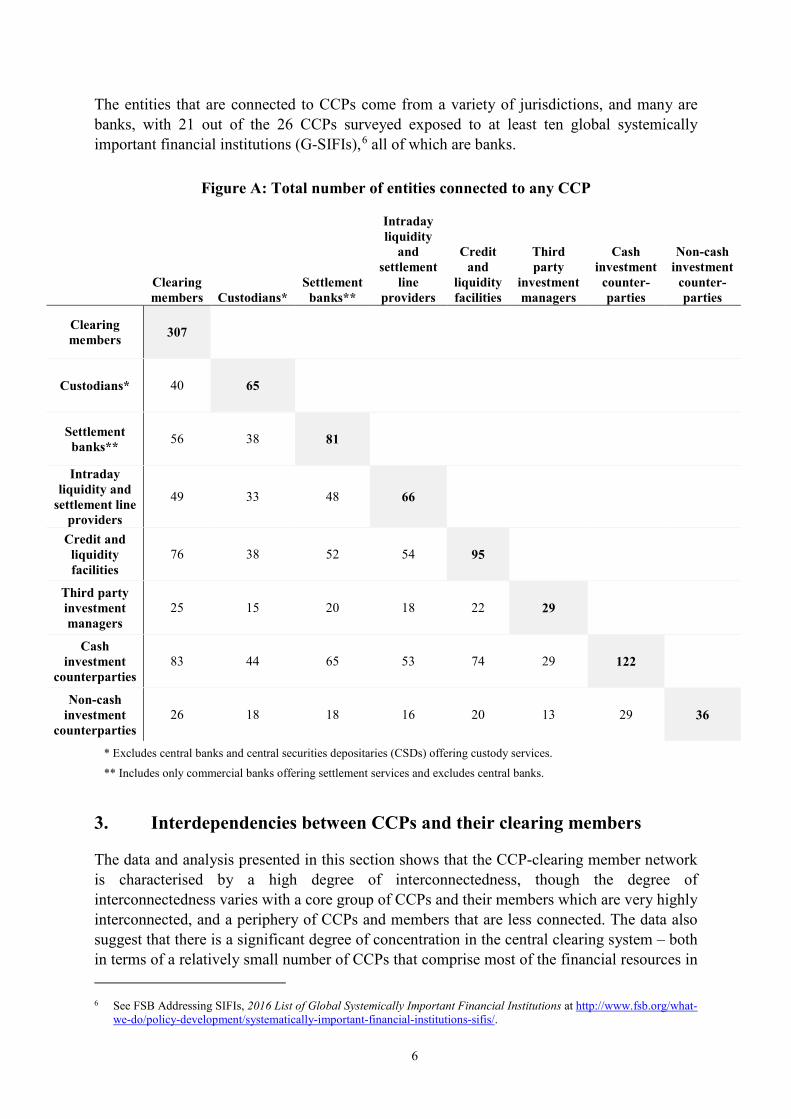
CCPs maintain various relationships with other financial institutions. Entities may have relationships with CCPs as clearing members, custodians, settlement banks, credit and liquidity providers and investment counterparties. Moreover, a single entity often maintains different types of relationships with different CCPs. As an example, a financial institution might be a member of one CCP, a custodian for a second CCP, while providing a credit line to a third CCP. Figure A below provides an overview of the ways in which these roles are fulfilled by the entities covered in this data collection. Diagonal elements of the table report the number of entities fulfilling any particular role. As an example, among the 307 clearing members, 40 are custodians for at least one CCP, 56 provide settlement services to at least one CCP, 49 provide intraday liquidity and settlement lines to at least one CCP, 76 provide credit and liquidity facilities to at least one CCP, 25 provide third-party investment services to at least one CCP, 83 are cash investment counterparties to at least one CCP, and 26 are non-cash investment counterparties to at least one CCP.
Figure A suggests a high degree of overlap in the different roles provided by entities that are connected to CCPs. Accordingly, the default of a clearing member or critical service provider could, in many cases, have an impact not only on the same service provided at other CCPs but also for the provision of other services and functions at other CCPs.
5 The CCP’s home authority and the SGCCI data analysis team made efforts to validate data contributed by CCPs, and
beyond that, the SGCCI has worked under the assumption that the reported data did not contain any errors or omissions which may bias the results of data analysis.
6
The entities that are connected to CCPs come from a variety of jurisdictions, and many are banks, with 21 out of the 26 CCPs surveyed exposed to at least ten global systemically important financial institutions (G-SIFIs),6 all of which are banks.
Figure A: Total number of entities connected to any CCP
Clearing members Custodians*
Settlement banks**
Intraday liquidity
and settlement
line providers
Credit and
liquidity facilities
Third party
investment managers
Cash investment
counter-parties
Non-cash investment
counter-parties
Clearing members 307
Custodians* 40 65
Settlement banks** 56 38 81
Intraday liquidity and
settlement line providers
49 33 48 66
Credit and liquidity facilities
76 38 52 54 95
Third party investment managers
25 15 20 18 22 29
Cash investment
counterparties 83 44 65 53 74 29 122
Non-cash investment
counterparties 26 18 18 16 20 13 29 36
* Excludes central banks and central securities depositaries (CSDs) offering custody services.
** Includes only commercial banks offering settlement services and excludes central banks.
3. Interdependencies between CCPs and their clearing members
The data and analysis presented in this section shows that the CCP-clearing member network is characterised by a high degree of interconnectedness, though the degree of interconnectedness varies with a core group of CCPs and their members which are very highly interconnected, and a periphery of CCPs and members that are less connected. The data also suggest that there is a significant degree of concentration in the central clearing system – both in terms of a relatively small number of CCPs that comprise most of the financial resources in 6 See FSB Addressing SIFIs, 2016 List of Global Systemically Important Financial Institutions at http://www.fsb.org/what-
we-do/policy-development/systematically-important-financial-institutions-sifis/.
7
the study and a small number of highly interconnected clearing members whose default or financial distress could affect a large portion of the central clearing network.
3.1 The CCP-clearing member network
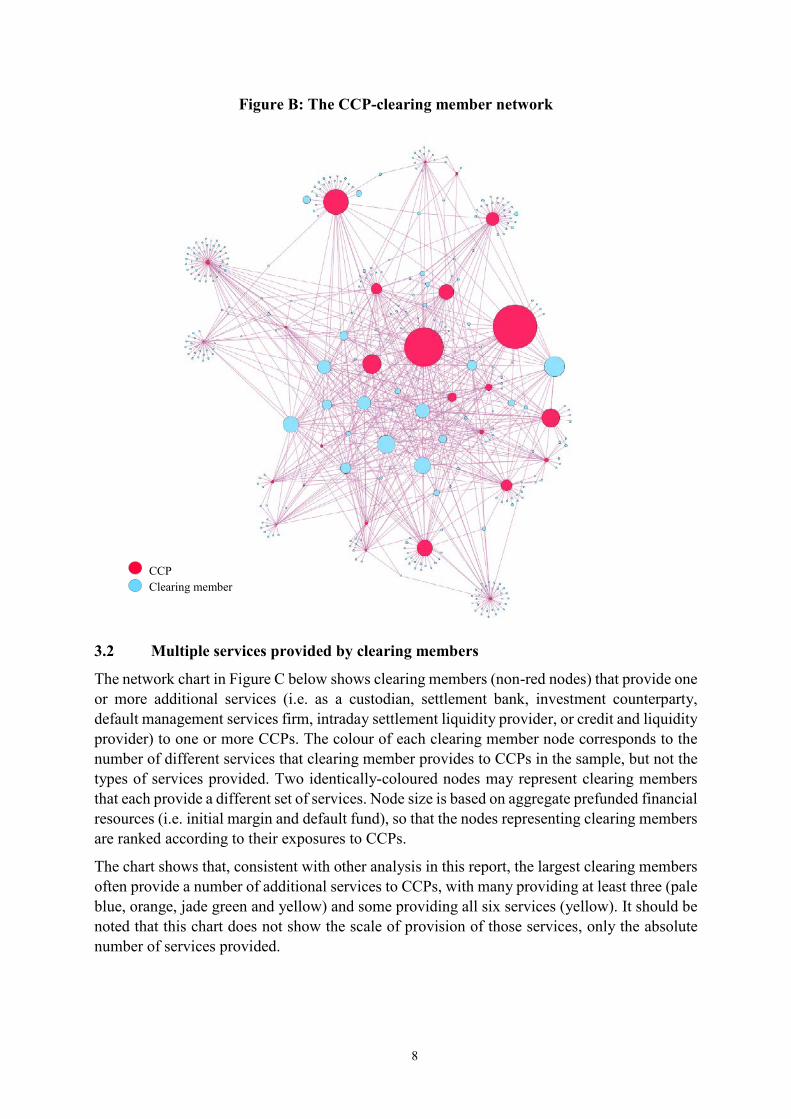
Clearing members maintain a network of relationships with a variety of CCPs. Figure B below represents a global and relatively comprehensive view of the CCP-clearing member network across several jurisdictions and asset classes, and provides a unique perspective on the interconnections between CCPs and clearing members that has not been available previously. The chart depicts the CCP network for the top 25 clearing members of each CCP.7 Each CCP is shown in red and each clearing member in blue.8 The area of each circle represents the total amount of prefunded financial resources that have been collected by a CCP or posted by a clearing member to all CCPs of which it is a member. The lines connecting CCPs and members depict the CCP-clearing member relationships in the network. No CCP in the figure is connected to another CCP and no clearing member is connected to another clearing member because those connections were not explored in the data analysis.
The chart shows a central set of CCPs and members as well as a periphery of CCPs with a large number of less connected members. CCPs and members that are more central (visible in the centre of the chart) tend to be larger than those on the periphery (depicted on the boundary of the chart). The CCPs on the periphery tend to have a significant number of members that are a member of only a single CCP. At the same time, CCPs on the periphery of the chart also tend to have connections to highly interconnected members in the central portion of the chart. This suggests that even members or CCPs that appear somewhat peripheral may be influenced by what happens to entities within the central part of the network.
7 Although the network chart does not depict every CCP-clearing member relationship, the largest 25 clearing members
typically represent the majority of the CCP’s total financial resources. 8 Throughout this report CCPs are denoted with the colour red.
Network Charts In all the network charts, the size of the node is a linear function of the financial input; for example, in Figure B the input is total financial resources and in Figure G, the input is the total value of assets under custody and total value of settlement flows, respectively. The weights (sizes) of nodes are calculated amongst the population of the same type. The population of CCPs is 26 and the population of clearing members is 307.
To visualise the network, the size of the largest and smallest nodes is set arbitrarily. The area of some very small clearing members may have been increased to make them visible in the network chart. The largest and the smallest nodes have respectively a thinning and a magnifying effect and due to the large size differences between the largest and smallest nodes in the data, this makes directly-proportional network visualisation impossible across all nodes. In the network figures that follow, CCP nodes can be compared with each other, and clearing members can be compared with each other; however, CCP nodes cannot be compared with clearing member nodes.
In all network charts in this report, the distances between the core and the periphery of the network are automatically assigned by the software that generated the network chart, and has no specific meaning.
8
Figure B: The CCP-clearing member network
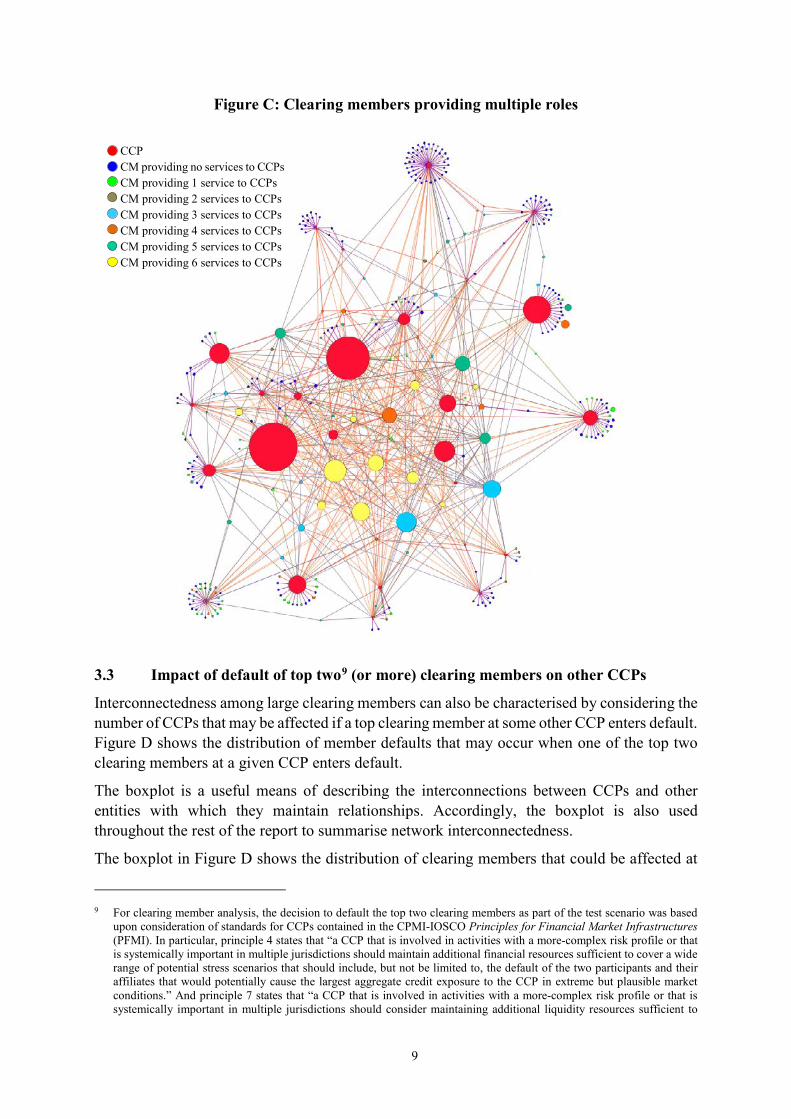
3.2 Multiple services provided by clearing members
The network chart in Figure C below shows clearing members (non-red nodes) that provide one or more additional services (i.e. as a custodian, settlement bank, investment counterparty, default management services firm, intraday settlement liquidity provider, or credit and liquidity provider) to one or more CCPs. The colour of each clearing member node corresponds to the number of different services that clearing member provides to CCPs in the sample, but not the types of services provided. Two identically-coloured nodes may represent clearing members that each provide a different set of services. Node size is based on aggregate prefunded financial resources (i.e. initial margin and default fund), so that the nodes representing clearing members are ranked according to their exposures to CCPs.
The chart shows that, consistent with other analysis in this report, the largest clearing members often provide a number of additional services to CCPs, with many providing at least three (pale blue, orange, jade green and yellow) and some providing all six services (yellow). It should be noted that this chart does not show the scale of provision of those services, only the absolute number of services provided.
CCP Clearing member
9
Figure C: Clearing members providing multiple roles
3.3 Impact of default of top two9 (or more) clearing members on other CCPs
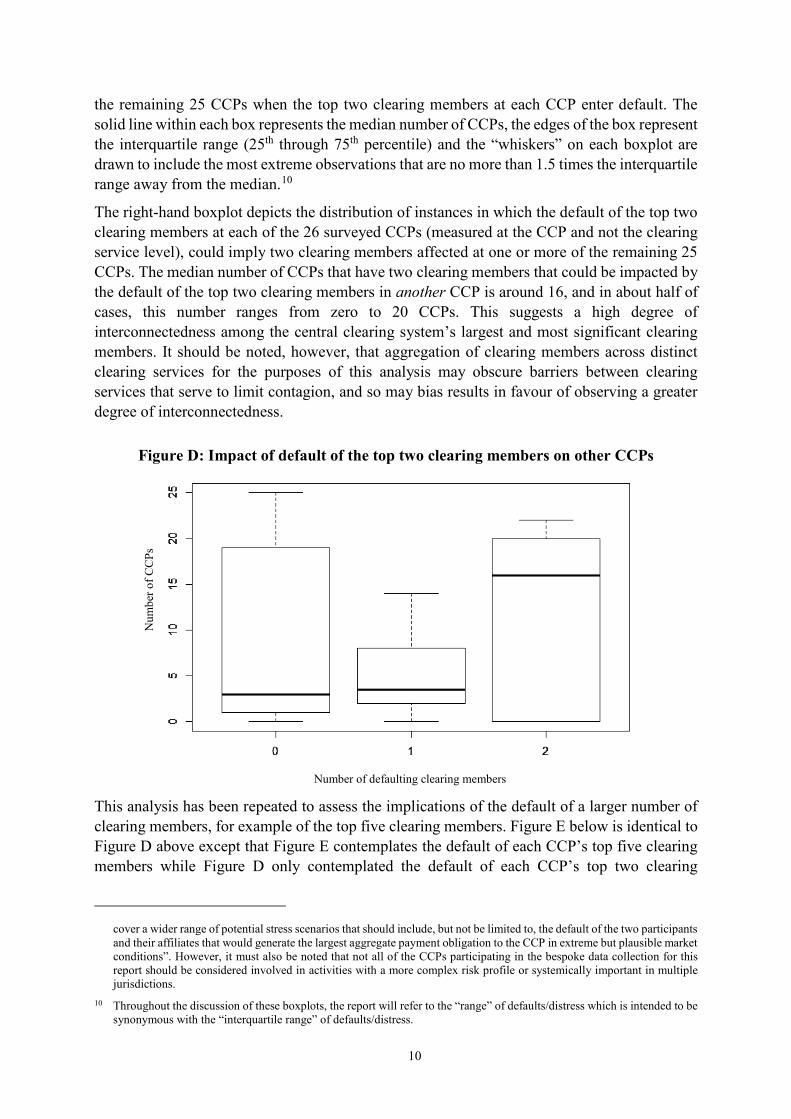
Interconnectedness among large clearing members can also be characterised by considering the number of CCPs that may be affected if a top clearing member at some other CCP enters default. Figure D shows the distribution of member defaults that may occur when one of the top two clearing members at a given CCP enters default.
The boxplot is a useful means of describing the interconnections between CCPs and other entities with which they maintain relationships. Accordingly, the boxplot is also used throughout the rest of the report to summarise network interconnectedness.
The boxplot in Figure D shows the distribution of clearing members that could be affected at
9 For clearing member analysis, the decision to default the top two clearing members as part of the test scenario was based
upon consideration of standards for CCPs contained in the CPMI-IOSCO Principles for Financial Market Infrastructures (PFMI). In particular, principle 4 states that “a CCP that is involved in activities with a more-complex risk profile or that is systemically important in multiple jurisdictions should maintain additional financial resources sufficient to cover a wide range of potential stress scenarios that should include, but not be limited to, the default of the two participants and their affiliates that would potentially cause the largest aggregate credit exposure to the CCP in extreme but plausible market conditions.” And principle 7 states that “a CCP that is involved in activities with a more-complex risk profile or that is systemically important in multiple jurisdictions should consider maintaining additional liquidity resources sufficient to
CCP CM providing no services to CCPs CM providing 1 service to CCPs CM providing 2 services to CCPs CM providing 3 services to CCPs CM providing 4 services to CCPs CM providing 5 services to CCPs CM providing 6 services to CCPs
10
the remaining 25 CCPs when the top two clearing members at each CCP enter default. The solid line within each box represents the median number of CCPs, the edges of the box represent the interquartile range (25th through 75th percentile) and the “whiskers” on each boxplot are drawn to include the most extreme observations that are no more than 1.5 times the interquartile range away from the median.10
The right-hand boxplot depicts the distribution of instances in which the default of the top two clearing members at each of the 26 surveyed CCPs (measured at the CCP and not the clearing service level), could imply two clearing members affected at one or more of the remaining 25 CCPs. The median number of CCPs that have two clearing members that could be impacted by the default of the top two clearing members in another CCP is around 16, and in about half of cases, this number ranges from zero to 20 CCPs. This suggests a high degree of interconnectedness among the central clearing system’s largest and most significant clearing members. It should be noted, however, that aggregation of clearing members across distinct clearing services for the purposes of this analysis may obscure barriers between clearing services that serve to limit contagion, and so may bias results in favour of observing a greater degree of interconnectedness.
Figure D: Impact of default of the top two clearing members on other CCPs
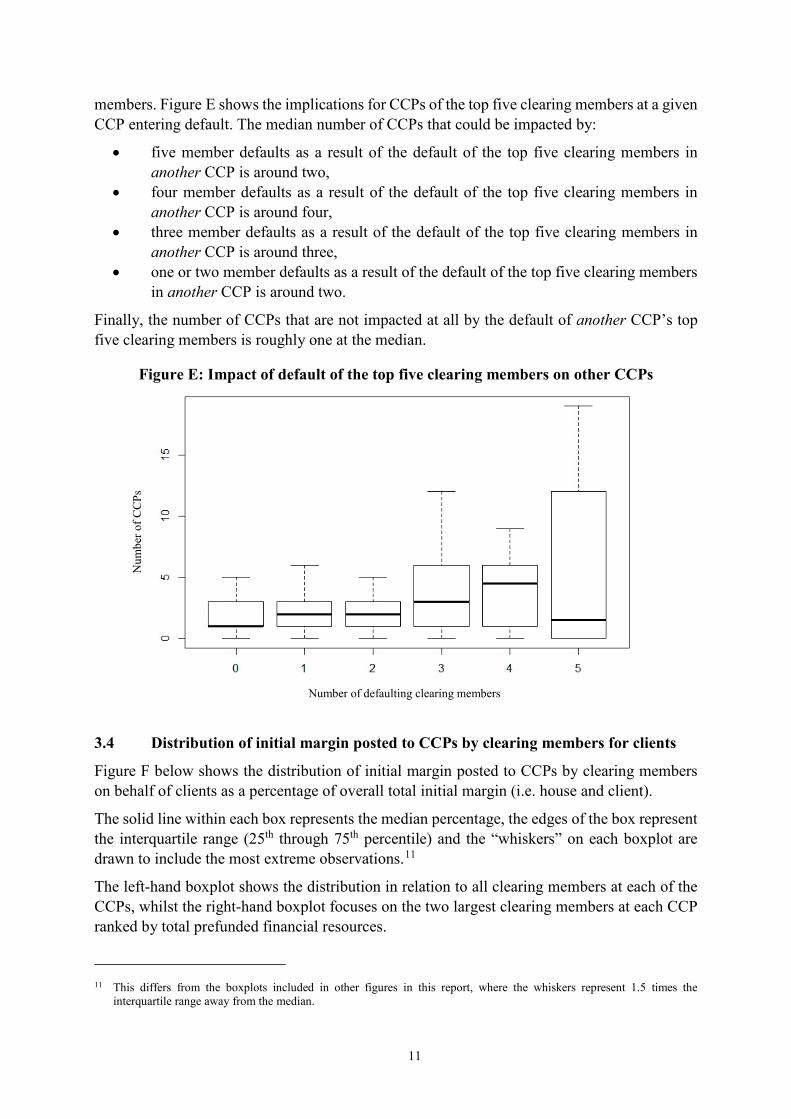
This analysis has been repeated to assess the implications of the default of a larger number of clearing members, for example of the top five clearing members. Figure E below is identical to Figure D above except that Figure E contemplates the default of each CCP’s top five clearing members while Figure D only contemplated the default of each CCP’s top two clearing
cover a wider range of potential stress scenarios that should include, but not be limited to, the default of the two participants and their affiliates that would generate the largest aggregate payment obligation to the CCP in extreme but plausible market conditions”. However, it must also be noted that not all of the CCPs participating in the bespoke data collection for this report should be considered involved in activities with a more complex risk profile or systemically important in multiple jurisdictions.
10 Throughout the discussion of these boxplots, the report will refer to the “range” of defaults/distress which is intended to be synonymous with the “interquartile range” of defaults/distress.
Number of defaulting clearing members
Num
ber o
f CC
Ps
Number of defaulting clearing members
11
members. Figure E shows the implications for CCPs of the top five clearing members at a given CCP entering default. The median number of CCPs that could be impacted by:
• five member defaults as a result of the default of the top five clearing members in another CCP is around two,
• four member defaults as a result of the default of the top five clearing members in another CCP is around four,
• three member defaults as a result of the default of the top five clearing members in another CCP is around three,
• one or two member defaults as a result of the default of the top five clearing members in another CCP is around two.
Finally, the number of CCPs that are not impacted at all by the default of another CCP’s top five clearing members is roughly one at the median.
Figure E: Impact of default of the top five clearing members on other CCPs
3.4 Distribution of initial margin posted to CCPs by clearing members for clients
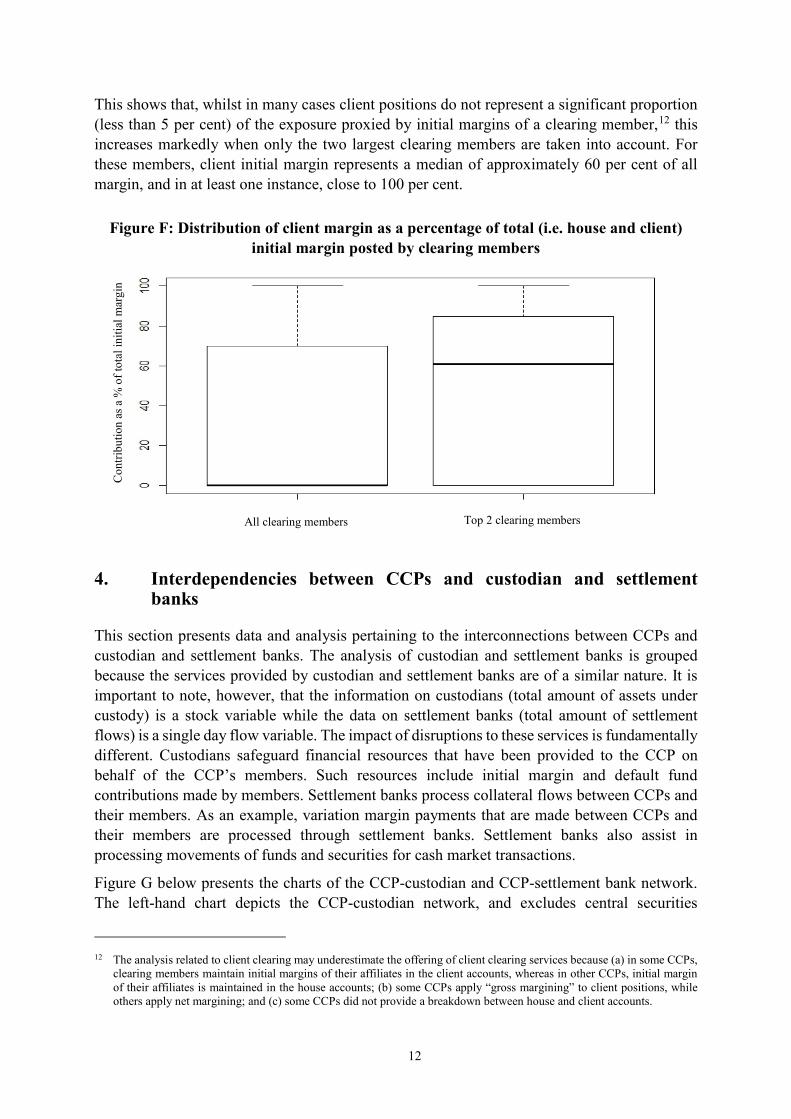
Figure F below shows the distribution of initial margin posted to CCPs by clearing members on behalf of clients as a percentage of overall total initial margin (i.e. house and client).
The solid line within each box represents the median percentage, the edges of the box represent the interquartile range (25th through 75th percentile) and the “whiskers” on each boxplot are drawn to include the most extreme observations.11
The left-hand boxplot shows the distribution in relation to all clearing members at each of the CCPs, whilst the right-hand boxplot focuses on the two largest clearing members at each CCP ranked by total prefunded financial resources.
11 This differs from the boxplots included in other figures in this report, where the whiskers represent 1.5 times the
interquartile range away from the median.
Num
ber o
f CC
Ps
Number of defaulting clearing members
12
This shows that, whilst in many cases client positions do not represent a significant proportion (less than 5 per cent) of the exposure proxied by initial margins of a clearing member,12 this increases markedly when only the two largest clearing members are taken into account. For these members, client initial margin represents a median of approximately 60 per cent of all margin, and in at least one instance, close to 100 per cent.
Figure F: Distribution of client margin as a percentage of total (i.e. house and client) initial margin posted by clearing members
4. Interdependencies between CCPs and custodian and settlement banks
This section presents data and analysis pertaining to the interconnections between CCPs and custodian and settlement banks. The analysis of custodian and settlement banks is grouped because the services provided by custodian and settlement banks are of a similar nature. It is important to note, however, that the information on custodians (total amount of assets under custody) is a stock variable while the data on settlement banks (total amount of settlement flows) is a single day flow variable. The impact of disruptions to these services is fundamentally different. Custodians safeguard financial resources that have been provided to the CCP on behalf of the CCP’s members. Such resources include initial margin and default fund contributions made by members. Settlement banks process collateral flows between CCPs and their members. As an example, variation margin payments that are made between CCPs and their members are processed through settlement banks. Settlement banks also assist in processing movements of funds and securities for cash market transactions.
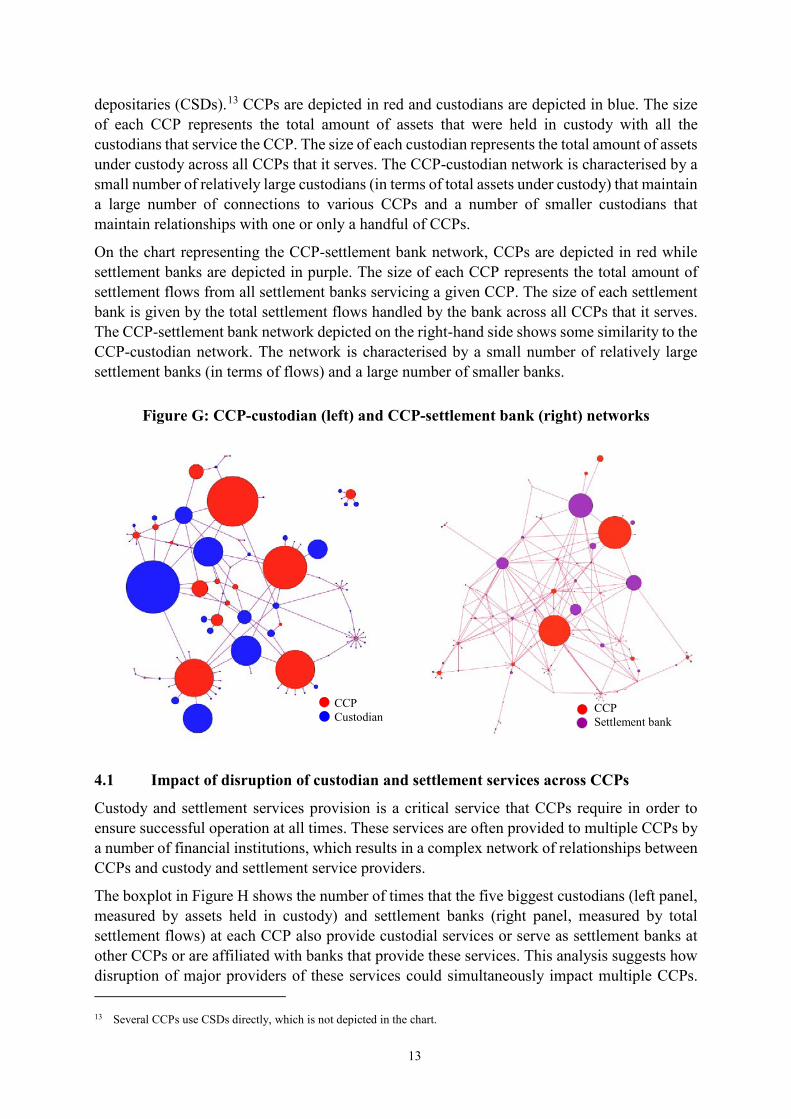
Figure G below presents the charts of the CCP-custodian and CCP-settlement bank network. The left-hand chart depicts the CCP-custodian network, and excludes central securities
12 The analysis related to client clearing may underestimate the offering of client clearing services because (a) in some CCPs,
clearing members maintain initial margins of their affiliates in the client accounts, whereas in other CCPs, initial margin of their affiliates is maintained in the house accounts; (b) some CCPs apply “gross margining” to client positions, while others apply net margining; and (c) some CCPs did not provide a breakdown between house and client accounts.
Con
tribu
tion
as a
% o
f tot
al in
itial
mar
gin
All clearing members Top 2 clearing members
13
depositaries (CSDs).13 CCPs are depicted in red and custodians are depicted in blue. The size of each CCP represents the total amount of assets that were held in custody with all the custodians that service the CCP. The size of each custodian represents the total amount of assets under custody across all CCPs that it serves. The CCP-custodian network is characterised by a small number of relatively large custodians (in terms of total assets under custody) that maintain a large number of connections to various CCPs and a number of smaller custodians that maintain relationships with one or only a handful of CCPs.
On the chart representing the CCP-settlement bank network, CCPs are depicted in red while settlement banks are depicted in purple. The size of each CCP represents the total amount of settlement flows from all settlement banks servicing a given CCP. The size of each settlement bank is given by the total settlement flows handled by the bank across all CCPs that it serves. The CCP-settlement bank network depicted on the right-hand side shows some similarity to the CCP-custodian network. The network is characterised by a small number of relatively large settlement banks (in terms of flows) and a large number of smaller banks.
Figure G: CCP-custodian (left) and CCP-settlement bank (right) networks
4.1 Impact of disruption of custodian and settlement services across CCPs
Custody and settlement services provision is a critical service that CCPs require in order to ensure successful operation at all times. These services are often provided to multiple CCPs by a number of financial institutions, which results in a complex network of relationships between CCPs and custody and settlement service providers.
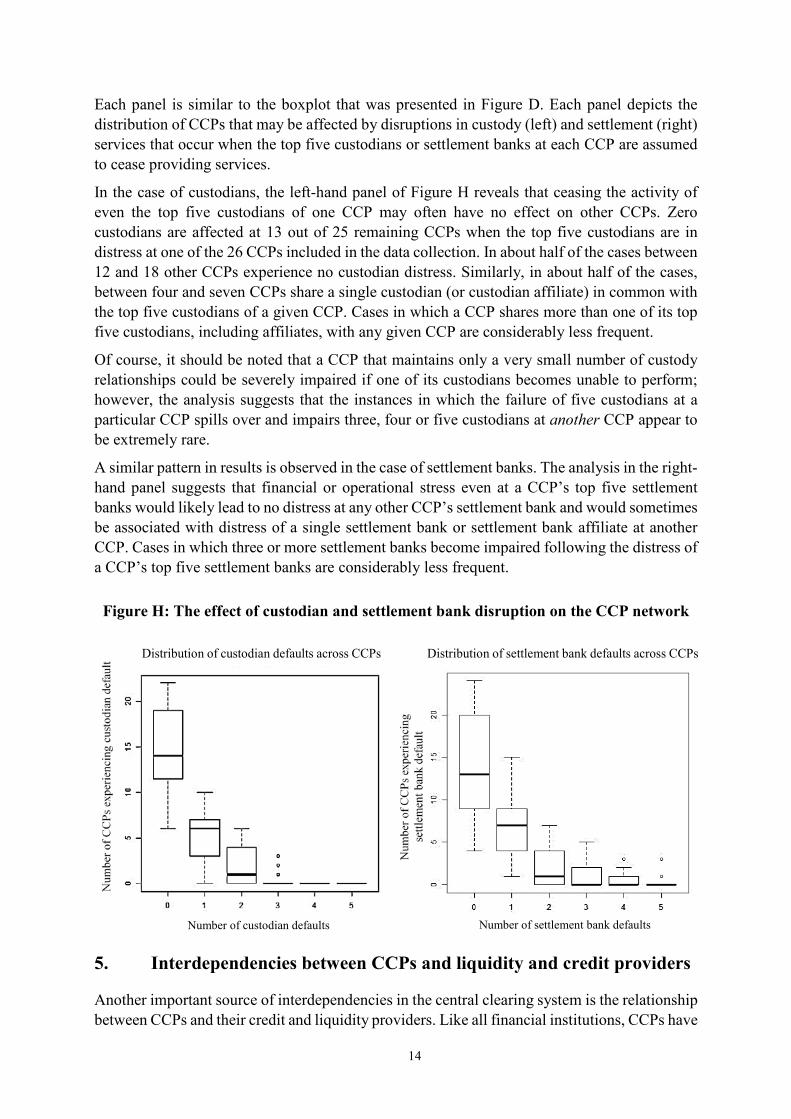
The boxplot in Figure H shows the number of times that the five biggest custodians (left panel, measured by assets held in custody) and settlement banks (right panel, measured by total settlement flows) at each CCP also provide custodial services or serve as settlement banks at other CCPs or are affiliated with banks that provide these services. This analysis suggests how disruption of major providers of these services could simultaneously impact multiple CCPs. 13 Several CCPs use CSDs directly, which is not depicted in the chart.
CCP Custodian CCP
Settlement bank
14
Each panel is similar to the boxplot that was presented in Figure D. Each panel depicts the distribution of CCPs that may be affected by disruptions in custody (left) and settlement (right) services that occur when the top five custodians or settlement banks at each CCP are assumed to cease providing services.
In the case of custodians, the left-hand panel of Figure H reveals that ceasing the activity of even the top five custodians of one CCP may often have no effect on other CCPs. Zero custodians are affected at 13 out of 25 remaining CCPs when the top five custodians are in distress at one of the 26 CCPs included in the data collection. In about half of the cases between 12 and 18 other CCPs experience no custodian distress. Similarly, in about half of the cases, between four and seven CCPs share a single custodian (or custodian affiliate) in common with the top five custodians of a given CCP. Cases in which a CCP shares more than one of its top five custodians, including affiliates, with any given CCP are considerably less frequent.
Of course, it should be noted that a CCP that maintains only a very small number of custody relationships could be severely impaired if one of its custodians becomes unable to perform; however, the analysis suggests that the instances in which the failure of five custodians at a particular CCP spills over and impairs three, four or five custodians at another CCP appear to be extremely rare.
A similar pattern in results is observed in the case of settlement banks. The analysis in the right-hand panel suggests that financial or operational stress even at a CCP’s top five settlement banks would likely lead to no distress at any other CCP’s settlement bank and would sometimes be associated with distress of a single settlement bank or settlement bank affiliate at another CCP. Cases in which three or more settlement banks become impaired following the distress of a CCP’s top five settlement banks are considerably less frequent.
Figure H: The effect of custodian and settlement bank disruption on the CCP network
5. Interdependencies between CCPs and liquidity and credit providers
Another important source of interdependencies in the central clearing system is the relationship between CCPs and their credit and liquidity providers. Like all financial institutions, CCPs have
Distribution of custodian defaults across CCPs Distribution of settlement bank defaults across CCPs
Number of custodian defaults Number of settlement bank defaults Number of custodian defaults Number of settlement bank defaults
15
a need for credit and liquidity services. In particular, CCPs make use of both intraday liquidity and settlement lines as well as longer term credit and liquidity lines. These services are critical to the operation of a CCP, especially in situations where a CCP might need to draw on liquidity or credit facilities to deal with the default or financial distress of a clearing member. Credit and liquidity service providers often provide these services to more than one CCP. In this section, the relationships and resulting interconnections between CCPs, intraday liquidity and settlement line providers (‘intraday liquidity providers’) and providers of longer term credit and liquidity facilities (‘credit providers’) are mapped and analysed.
The data on approved credit and liquidity facilities provided by affiliates of clearing members or clearing members themselves indicate that both on average and at the median, the aggregate size of credit facilities provided to CCPs by clearing members’ affiliates are significantly larger than those facilities provided by entities unaffiliated with clearing members. This relationship also holds when looking at median values. It is worth noting that outstanding facilities are relatively small on average and the median amount of outstanding credit resources is zero.
The data on intraday settlement and liquidity lines also indicate heterogeneity with respect to the number of intraday providers used by each CCP. The network is characterised by a few large providers and a larger number of significantly smaller participants. There appears to be some heterogeneity in the number of relationships that CCPs maintain with intraday providers. Moreover, there is no apparent relationship between the number of intraday providers linked to a CCP and the size of that CCP.
5.1 Impact of intraday liquidity and credit provider defaults on other CCPs
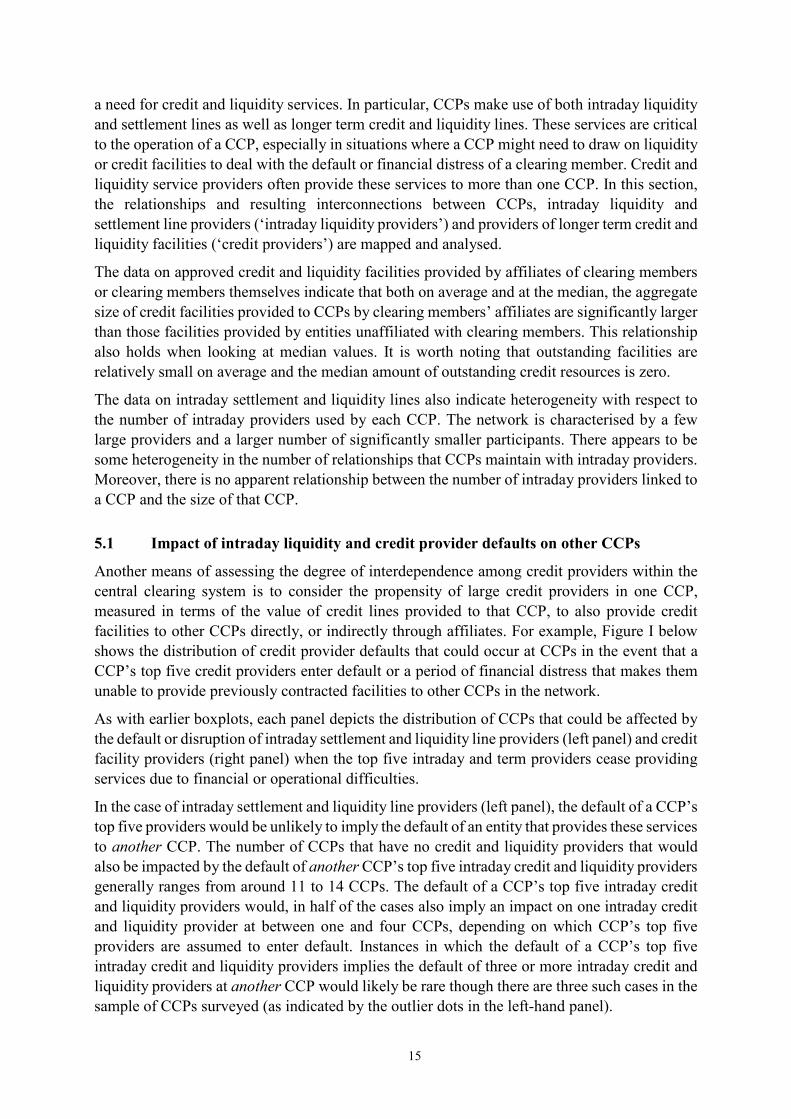
Another means of assessing the degree of interdependence among credit providers within the central clearing system is to consider the propensity of large credit providers in one CCP, measured in terms of the value of credit lines provided to that CCP, to also provide credit facilities to other CCPs directly, or indirectly through affiliates. For example, Figure I below shows the distribution of credit provider defaults that could occur at CCPs in the event that a CCP’s top five credit providers enter default or a period of financial distress that makes them unable to provide previously contracted facilities to other CCPs in the network.
As with earlier boxplots, each panel depicts the distribution of CCPs that could be affected by the default or disruption of intraday settlement and liquidity line providers (left panel) and credit facility providers (right panel) when the top five intraday and term providers cease providing services due to financial or operational difficulties.
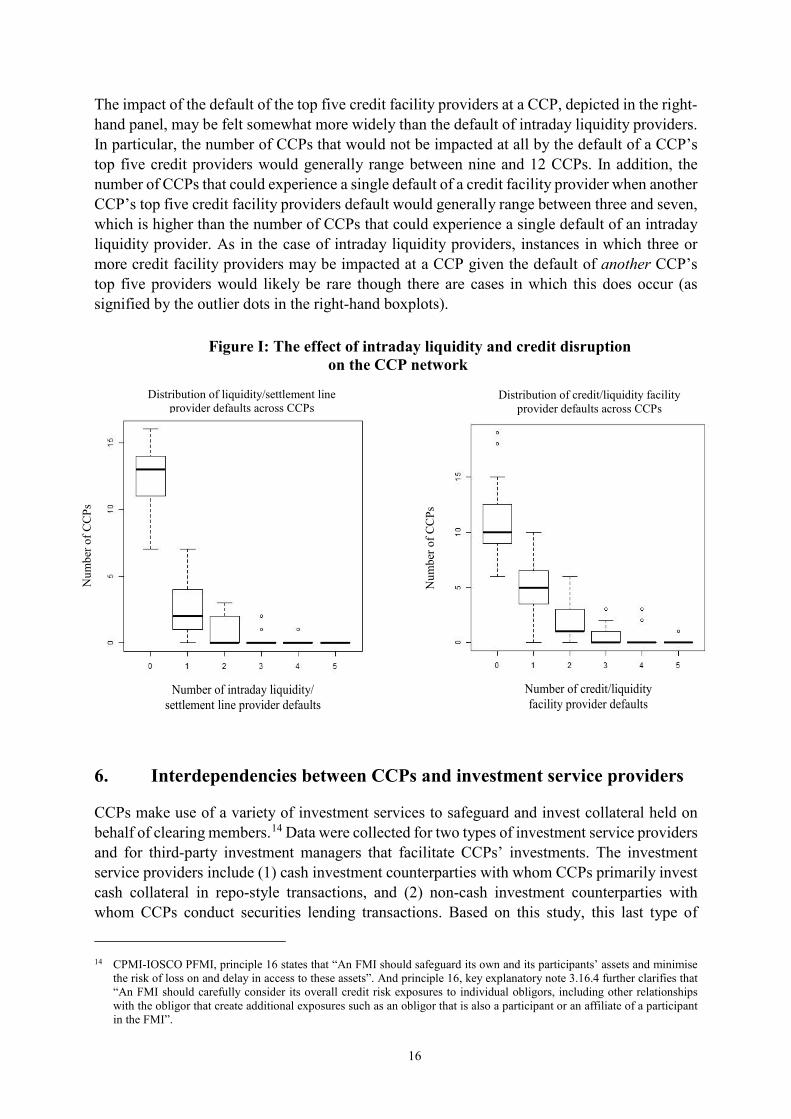
In the case of intraday settlement and liquidity line providers (left panel), the default of a CCP’s top five providers would be unlikely to imply the default of an entity that provides these services to another CCP. The number of CCPs that have no credit and liquidity providers that would also be impacted by the default of another CCP’s top five intraday credit and liquidity providers generally ranges from around 11 to 14 CCPs. The default of a CCP’s top five intraday credit and liquidity providers would, in half of the cases also imply an impact on one intraday credit and liquidity provider at between one and four CCPs, depending on which CCP’s top five providers are assumed to enter default. Instances in which the default of a CCP’s top five intraday credit and liquidity providers implies the default of three or more intraday credit and liquidity providers at another CCP would likely be rare though there are three such cases in the sample of CCPs surveyed (as indicated by the outlier dots in the left-hand panel).
16
The impact of the default of the top five credit facility providers at a CCP, depicted in the right-hand panel, may be felt somewhat more widely than the default of intraday liquidity providers. In particular, the number of CCPs that would not be impacted at all by the default of a CCP’s top five credit providers would generally range between nine and 12 CCPs. In addition, the number of CCPs that could experience a single default of a credit facility provider when another CCP’s top five credit facility providers default would generally range between three and seven, which is higher than the number of CCPs that could experience a single default of an intraday liquidity provider. As in the case of intraday liquidity providers, instances in which three or more credit facility providers may be impacted at a CCP given the default of another CCP’s top five providers would likely be rare though there are cases in which this does occur (as signified by the outlier dots in the right-hand boxplots).
Figure I: The effect of intraday liquidity and credit disruption on the CCP network
6. Interdependencies between CCPs and investment service providers
CCPs make use of a variety of investment services to safeguard and invest collateral held on behalf of clearing members.14 Data were collected for two types of investment service providers and for third-party investment managers that facilitate CCPs’ investments. The investment service providers include (1) cash investment counterparties with whom CCPs primarily invest cash collateral in repo-style transactions, and (2) non-cash investment counterparties with whom CCPs conduct securities lending transactions. Based on this study, this last type of
14 CPMI-IOSCO PFMI, principle 16 states that “An FMI should safeguard its own and its participants’ assets and minimise
the risk of loss on and delay in access to these assets”. And principle 16, key explanatory note 3.16.4 further clarifies that “An FMI should carefully consider its overall credit risk exposures to individual obligors, including other relationships with the obligor that create additional exposures such as an obligor that is also a participant or an affiliate of a participant in the FMI”.
Number of intraday liquidity/ settlement line provider defaults
Number of credit/liquidity facility provider defaults
Num
ber o
f CC
Ps
Num
ber o
f CC
Ps
Distribution of liquidity/settlement line provider defaults across CCPs
Distribution of credit/liquidity facility provider defaults across CCPs
17
investment service provider is used much less frequently by CCPs than the first type. In particular, only seven out of 26 CCPs reported any relationship with a non-cash investment counterparty. Accordingly, in what follows, the analysis focuses primarily though not exclusively on the results pertaining to cash investment counterparties and looks also at third-party investment managers, whom some CCPs appoint to manage investments on their behalf.
The provision of investment services is critical to the operation of CCPs and so understanding the interdependencies between investment service providers and CCPs is important. These data suggest a significant amount of interdependence between investment service providers and CCPs. Many investment service providers offer their services to a wide range of CCPs so that distress at a single service provider may often be felt at more than a single CCP in the network. The most interconnected cash investment counterparties maintain more relationships with CCPs than the most interconnected third-party investment managers though the concentration of CCP assets is considerably higher among third-party investment managers. Moreover, there is some evidence that entities that are large members of the clearing system (as measured by prefunded financial resources) are also more likely to be significant providers of investment services so that the distress of a large clearing member in the CCP network could cause disruptions at an investment service provider with relationships at multiple CCPs.
6.1 The CCP-investment service provider network
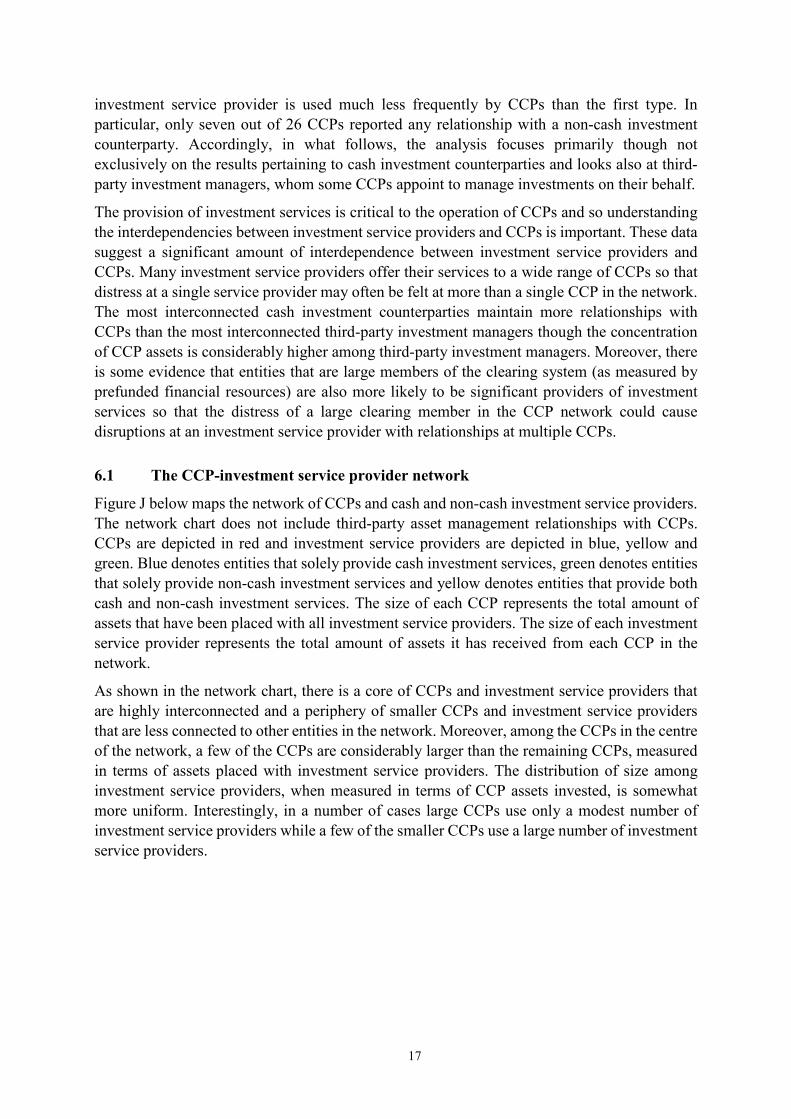
Figure J below maps the network of CCPs and cash and non-cash investment service providers. The network chart does not include third-party asset management relationships with CCPs. CCPs are depicted in red and investment service providers are depicted in blue, yellow and green. Blue denotes entities that solely provide cash investment services, green denotes entities that solely provide non-cash investment services and yellow denotes entities that provide both cash and non-cash investment services. The size of each CCP represents the total amount of assets that have been placed with all investment service providers. The size of each investment service provider represents the total amount of assets it has received from each CCP in the network.
As shown in the network chart, there is a core of CCPs and investment service providers that are highly interconnected and a periphery of smaller CCPs and investment service providers that are less connected to other entities in the network. Moreover, among the CCPs in the centre of the network, a few of the CCPs are considerably larger than the remaining CCPs, measured in terms of assets placed with investment service providers. The distribution of size among investment service providers, when measured in terms of CCP assets invested, is somewhat more uniform. Interestingly, in a number of cases large CCPs use only a modest number of investment service providers while a few of the smaller CCPs use a large number of investment service providers.
18
Figure J: CCP-investment service provider network
6.2 Impact of cash investment counterparty default on other CCPs
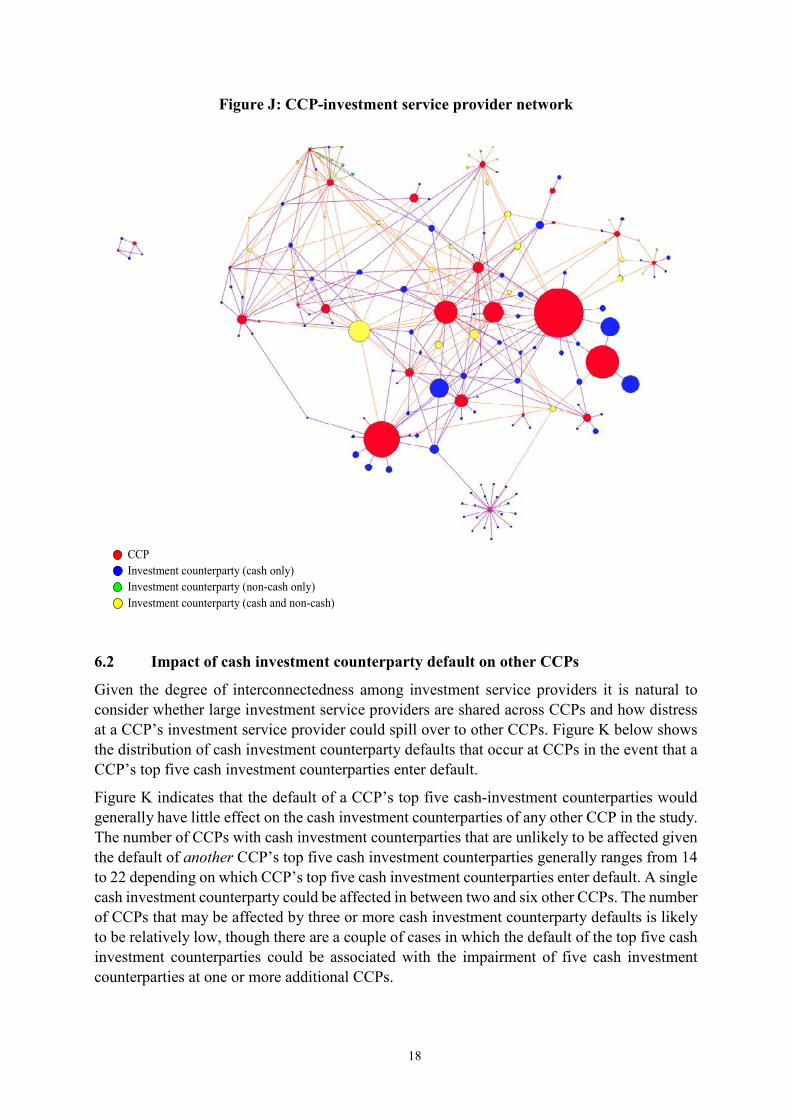
Given the degree of interconnectedness among investment service providers it is natural to consider whether large investment service providers are shared across CCPs and how distress at a CCP’s investment service provider could spill over to other CCPs. Figure K below shows the distribution of cash investment counterparty defaults that occur at CCPs in the event that a CCP’s top five cash investment counterparties enter default.
Figure K indicates that the default of a CCP’s top five cash-investment counterparties would generally have little effect on the cash investment counterparties of any other CCP in the study. The number of CCPs with cash investment counterparties that are unlikely to be affected given the default of another CCP’s top five cash investment counterparties generally ranges from 14 to 22 depending on which CCP’s top five cash investment counterparties enter default. A single cash investment counterparty could be affected in between two and six other CCPs. The number of CCPs that may be affected by three or more cash investment counterparty defaults is likely to be relatively low, though there are a couple of cases in which the default of the top five cash investment counterparties could be associated with the impairment of five cash investment counterparties at one or more additional CCPs.
CCP Investment counterparty (cash only) Investment counterparty (non-cash only) Investment counterparty (cash and non-cash)
19
Figure K: Clearing membership and investment service provision
7. Conclusion CCPs are an important part of the financial system. Their importance has grown significantly since the financial crisis and their importance is likely to grow over the coming years as central clearing continues to expand. As part of the broader financial system, CCPs maintain a number of relationships with other financial entities that either make use of services offered by the CCP or provide important services to the CCP that are necessary for its operation in both normal times and times of stress. It is also the case that several CCPs often maintain relationships with the same financial entities, which creates a complex network between multiple CCPs and the financial entities with which they maintain relationships. Understanding this network on a broad and comprehensive scale is important for assessing the state of the central clearing system and its overall risk profile.
This report utilises a novel data set that contains comprehensive information about a global set of CCPs, their members, and other critical service providers such as custodians and investment service providers to map the resulting CCP network. The report attempts to shed light on the interdependencies between CCPs and different aspects of the financial system. The results indicate that there is a wide range of patterns in interconnectedness across different CCPs as well as across the several networks that CCPs maintain with different types of financial entities (e.g. members, settlement banks, investment counterparties, etc.). Further, CCPs interact with a broad range of entities that are located globally (based on where the parent company resides).
The results presented in this report are largely descriptive and reflect the state of the central clearing system at a single point in time and do not account for feedback effects. Accordingly, it is not appropriate to draw any strong conclusions regarding the overall risk profile, adequacy of financial resources, or systemic risks posed based on these results. At the same time, the results in the report are useful for making comparative analyses of different aspects of the central clearing system such as differences between the interdependencies in the CCP-clearing member network versus the CCP-custodian network.15 Finally, the data that has been collected and analysed in this report provide valuable insight into the central clearing system.
15 It is also useful to distil the main features of the network into a small number of quantitative metrics that can be easily
compared across different networks and across time for a given network. A set of standard, quantitative network metrics are presented in Annex C for the various networks considered in this report.
Num
ber o
f CC
Ps th
at
expe
rienc
e ca
sh in
vest
or d
efau
lt
Number of cash investor defaults
20
Annex A: Participating CCPs in the bespoke data collection
CCP name Jurisdiction
Americas
BM&F Bovespa Brazil
Asigna, Compensación y Liquidación Mexico
Contraparte Central de Valores Mexico
CME Group Inc US
DTCC – Fixed Income Clearing Corporation (FICC) US
DTCC – National Securities Clearing Corporation (NSCC) US
ICE Clear Credit LLC US
ICE Clear US US
The Options Clearing Corporation (OCC) US
Europe
LCH.Clearnet SA France
Eurex Clearing AG Germany
Cassa di Compensazione e Garanzia s.p.a. (CC&G) Italy
European Central Counterparty NV (EuroCCP) Netherlands
Nasdaq Clearing AB Sweden
SIX x-clear AG Switzerland
ICE Clear Europe Ltd UK
LCH Ltd UK
LME Clear Ltd UK
Asia-Pacific
ASX Clear (Futures) Pty Limited Australia
ASX Clear Pty Limited Australia
HKFE Clearing Corporation Limited Hong Kong
Hong Kong Securities Clearing Company Limited Hong Kong
Clearing Corporation of India Limited India
Japan Securities Clearing Corporation Japan
The Central Depository (Pte) Limited Singapore
The Singapore Exchange Derivatives Clearing Limited Singapore
21
Annex B: Clearing services across the participating CCPs
1. Base metals 2. Bonds 3. Cash bonds and repurchase
agreements 4. Cash equity 5. Cash equity 6. Cash equities, equity derivatives,
ETFs 7. Cash equities and listed derivatives 8. Cash securities 9. Cash securities 10. Cash securities 11. Cash securities 12. Cash securities 13. CDS 14. CDS 15. CDS 16. Commodities 17. Commodities 18. Commodities and interest rates 19. Credit 20. Credit 21. Currency derivatives 22. Derivative products, on equity
indexes, equities, currencies, interest rates, fixed income and commodities
23. Derivatives (futures, options, swaps) 24. Equities 25. Equities, derivatives 26. Equities and equity derivatives 27. Equities, equity ETFs, bonds 28. Equities, ETFs, warrants 29. Equity derivatives, fixed income
derivatives, interest rate derivatives, commodity derivatives, precious
metal derivatives, FX derivatives, property futures, dividend futures, volatility futures, cash equities, bonds, OTC interest rate swaps
30. Equity options, Equity index options 31. Exchange traded derivatives, OTC
commodities, OTC financial derivatives
32. Financial and commodity derivatives and gold
33. Financials 34. Foreign exchange 35. Freight, coal, fertilisers and steel
derivatives 36. Futures and options on futures 37. FX forwards 38. FX forwards 39. Government bonds 40. Index 41. Index 42. Index 43. Interest rates, equity index,
agricultural products, energy products, OTC interest rate swaps, index swaps, and basis swaps
44. Interest rate swaps 45. Interest rate swaps 46. Listed cash products 47. Listed derivatives 48. Non-deliverable forwards 49. OTC CDS 50. OTC equity options 51. Repurchase agreements 52. Repurchase agreements
* Product descriptions are as provided by each CCP unless the description uses specific product names that would reveal the identity of the CCP, in which case a more general description is used.
22
Annex C: Quantitative network statistics Network Density Diameter Degree Closeness Betweenness Eigenvector
Directed charts – Exposures from participants to CCPs Clearing member 0.0066 1 0.0901 0.0002 0 0.8663
Custodian 0.0145 1 0.0725 0.0010 0 0.8198
Settlement 0.0165 1 0.0548 0.0014 0 0.8251
Cash investment 0.0129 1 0.0696 0.0005 0 0.8669
Non-cash investment 0.0282 1 0.1539 0.0005 0 0.8669
Undirected charts – Bilateral exposures Clearing member 0.0132 6 0.1796 0.4583 0.2486 0.8663
Custodian 0.0290 9 0.1434 0.0506 0.3021 0.8198
Settlement 0.0330 10 0.1085 0.3286 0.3267 0.8251
Cash investment 0.0258 8 0.1386 0.0434 0.2176 0.8669
Non-cash investment 0.0565 2 0.3007 0.0121 0.0577 0.8664
Key:
Density measures the proportion of the potential connections in a network that are actual connections. It is defined as the number of connections divided by the number of possible connections.
Diameter measures the distance that a network covers. It is defined as the length of the shortest distance between the two most distant institutions in the network. Diameter for a directed chart based on the SGCCI data is always 1.0.
Degree measures the average number of other institutions to which a generic institution is connected, normalised by the maximum theoretical degree level.
Closeness measures the inverse of the average length of the shortest path between a generic institution and all other institutions in the network, normalized by the maximum theoretical closeness.
Betweenness measures the number of times a generic institution acts as a bridge along the shortest path connecting two other generic institutions, normalized by the maximum theoretical betweenness level. Betweenness for a directed chart based on the SGCCI data is always 0.
Eigenvector a measure of centrality that is based on the number of connections a generic institution has to other well-connected institutions.
23
Annex D: Members of the SGCCI and data analysis teams
Chair Sean Campbell∗ Associate Director Federal Reserve Board
France Clément Martin* Payment Systems and Financial Infrastructures Expert Banque de France
Germany Stephan Hackenberg Senior Policy Officer Bundesanstalt für Finanzdienstleistungsaufsicht (BaFin)
Hong Kong Rico Leung Senior Director, Supervision of Markets Securities and Futures Commission
Japan Fumikazu Nishio Deputy Director, International Financial Markets Financial Services Agency
Singapore Lim Sui Hui Assistant Director, Markets Policy and Infrastructure Monetary Authority of Singapore
Sweden Erik Lenntorp Head of Financial Infrastructure Division Riksbank
Switzerland Roman Jucker Head of FMI Supervision Financial Market Supervisory Authority (FINMA)
United Kingdom Graham Young Head of FMI Risk Bank of England Gerardo Ferrara* Research Economist Bank of England
∗ Member of the data analysis team for the bespoke data collection.
24
United States Caren Cox Officer Federal Reserve Bank of New York Ning Luo Supervising Examiner Federal Reserve Bank of New York John Lawton Deputy Director for Risk Surveillance Commodity Futures Trading Commission Narahari Phatak∗ Supervisory Economist, Division of Economic and Risk Analysis Securities and Exchange Commission
Bank for International Settlements
Mathias Drehmann Principal Economist Egemen Eren Economist
European Central Bank Pier Bierbach Principal Supervisor Banking Supervision Grzegorz Hałaj Senior Financial Stability Expert Eszter Tanai Senior Market Infrastructure Expert Directorate General-Market Infrastructure & Payments
European Single Resolution Board
Axel Kunde Head, Resolution Planning and Decisions Unit
International Monetary Fund
Froukelien Wendt Senior Financial Sector Expert
BCBS Secretariat Carlos Sosa Member of Secretariat
CPMI Secretariat Cristina Picillo Member of Secretariat
IOSCO Secretariat Patricia Sáenz de Maturana Pinedo Senior Policy Advisor
FSB Secretariat Amandeep Rehlon Grace Sone Members of Secretariat
∗ Member of the data analysis team for the bespoke data collection.