analysis of chemical contaminants in groundwater … of chemical contaminants in groundwater of...
TRANSCRIPT
Analysis of chemical contaminants in groundwater of communities surrounding UCIL plant site in Bhopal
Main report __________________________________________________________________________________
__________________________________________________________________________________
- Analysis of chemical contaminants in groundwater and assessment of the qualitative and quantitative drinking water supply situation in the communities surrounding Union Carbide India Ltd. (UCIL) plant site in Bhopal
-
Report by The Bhopal Medical Appeal (UK Registered Charity No. 1117526)
On behalf of the Sambhavna Trust Clinic, Bhopal © Sambhavna Trust Clinic, 2009

Analysis of chemical contaminants in groundwater of communities surrounding UCIL plant site in Bhopal
Main report __________________________________________________________________________________
__________________________________________________________________________________
-2-
Authors: Aio Häberli and Colin Toogood Organisations: The Bhopal Medical Appeal Unit 2, The Foundry 8/9 St.George's Mews, Brighton BN1 4EU, England Sambhavna Trust Clinic Bafna Colony, Berasia Road Bhopal 462 001 Madhya Pradesh, India Duration community survey: October 2007 – March 2008 Date of report submission: October, 2009 Contact: [email protected]

Analysis of chemical contaminants in groundwater of communities surrounding UCIL plant site in Bhopal
Main report __________________________________________________________________________________
__________________________________________________________________________________
-3-
Abstract A comprehensive survey conducted in fifteen communities surrounding the Union Carbide India Limited (UCIL) plant site in Bhopal has revealed that the drinking water supply in the majority of these communities is insufficient or, in many cases, is contaminated with toxic chemicals. Thousands of residents are lacking access to clean drinking water as the water supply system, installed by the Bhopal Municipal Corporation, is in poor condition while groundwater from private hand pumps and bore wells is of poor quality and/or contaminated with chemicals. The water supply system consists of large water plastic tanks that are either refilled by surface pipes or by tanker trucks. The system is not properly maintained; many water tanks are broken, water pipes are often ruptured and the water supply from tanker trucks is irregular. Residents try to use private hand pumps and bore wells to close the resulting supply gaps. However, these private water sources do not provide sufficient water and the water is often of poor quality. In the dry season, many wells stop providing water as the groundwater table lowers. During the monsoon, the groundwater accessed by hand pumps and bore wells is often muddy and potentially contaminated with coliform bacteria due to sewage water infiltration from the surface. Furthermore, there is serious chemical contamination of groundwater in much of the investigated area. Our groundwater sampling campaign showed the highest chloroform and carbon tetrachloride concentrations of 259 µg/L and 3790 µg/L, respectively, in water drawn from a hand pump in the community of Atal Ayub Nagar. Furthermore, both 1,2,3-trichlorobenzene (17 µg/L) and dichloromethane (19 µg/L) were present in the water sample. Chloroform concentrations exceeded U.S. Environmental Protection Agency (EPA) drinking water guideline values 2 to 3.5 times, while carbon tetrachloride exceeded its World Health Organization (WHO) guideline value 900 to 2400 times. Our results were confirmed by another water sample measurement from Atal Ayub Nagar, taken by the Bhopal Medical Appeal in June 2009, in which even higher chloroform and carbon tetrachloride concentrations of 266 µg/L and 4880 µg/L, respectively, were detected. The sampling design of our survey allows conclusions to be drawn only on a local scale regarding groundwater quality, i.e. in Atal Ayug Nagar. However, our results combined with data from former sampling campaigns conducted by NGOs and governmental agencies (e.g. Greenpeace 1999, Srishti 2002, Madhya Pradesh Pollution Control Board (MPPCB)) strongly indicate that groundwater is contaminated on a larger-scale, and not limited to Atal Ayub Nagar. Communities located northeast of the UCIL plant site are thought to be the most affected, as a geological survey (NEERI 1990) has revealed, that the groundwater flow is in a north-easterly direction. The current water supply situation within the communities included in this survey is unacceptable. The supply is clearly insufficient and chemical contaminants present in groundwater at concentrations massively exceeding WHO drinking water guideline values, posing potential health risks to thousands of residents. In order to improve the water supply within these communities, the authorities (i.e. the Bhopal Municipal Corporation) have to take immediate action. It must be ensured that sufficient quantities of clean drinking water are delivered to the residents in these areas, and that the water supply system is maintained properly. It is also important to clearly identify the outer boundary of groundwater contamination as well as to identify areas with high concentrations of contaminants in the groundwater. This information can be used to prevent health problems, by denoting areas where people should not use groundwater for drinking, washing, or cooking. To do so, we propose that a large-scale groundwater sampling campaign, which includes the communities located northeast of the UCIL plant site, must be conducted, followed by a long term monitoring program of the contaminated sites.
Analysis of chemical contaminants in groundwater of communities surrounding UCIL plant site in Bhopal
Main report __________________________________________________________________________________
__________________________________________________________________________________
-4-
Directory
Part І: Introduction............................................................................................................................................... 7 1.1 Rationale ....................................................................................................................................................................... 7
1.2 Objective and content ................................................................................................................................................... 8
1.3 Methodology................................................................................................................................................................. 9
1.4 Study area ................................................................................................................................................................... 10
Part ІІ: Guideline to the water supply system in the communities and description of area of interest ...... 12 2.1 Introduction to the guideline...................................................................................................................................... 12
2.2 Water supply............................................................................................................................................................... 12
2.2.1 Private water sources - hand pumps and bore wells.......................................................................................... 12
2.2.2 Municipal water supply..................................................................................................................................... 14 2.2.3 Problems encountered with water tanks and pipe system................................................................................. 19
2.3 Solar evaporation pond (SEP) .................................................................................................................................... 21
2.4 UCIL plant site ........................................................................................................................................................... 22
Part ІІІ: Summary of Community Reports ...................................................................................................... 25 3.1 Introduction to the Community Reports ..................................................................................................................... 25
3.2 Method........................................................................................................................................................................ 25
3.3 Results......................................................................................................................................................................... 25
3.3.1 Water supply ..................................................................................................................................................... 25 3.3.2 Water quality ..................................................................................................................................................... 26
3.3.3 Health ................................................................................................................................................................ 28 3.4 Community case studies ............................................................................................................................................. 30
3.4.1 Atal Ayub Nagar ............................................................................................................................................... 30 3.4.2 Garib Nagar ....................................................................................................................................................... 30
Part ІV: Literature review of selected water quality monitoring and assessment studies ........................... 33 4.1 Introduction to the literature review ........................................................................................................................... 33
4.2 National Environmental Engineering Research Institute (NEERI), 1990, “Assessment of pollution damage due to
Solar Evaporation Ponds at UCIL, Bhopal” ...................................................................................................................... 33
4.2.1 Methods and study setting................................................................................................................................. 34
4.2.2 Geological Survey ............................................................................................................................................. 35 4.2.3 Hydrogeological Survey.................................................................................................................................... 35

Analysis of chemical contaminants in groundwater of communities surrounding UCIL plant site in Bhopal
Main report __________________________________________________________________________________
__________________________________________________________________________________
-5-
4.2.4 Investigation of Solar Evaporation Pond (SEP)................................................................................................ 37 4.2.5 Findings and conclusion of NEERI report ........................................................................................................ 39
4.2.6 Critique of NEERI study................................................................................................................................... 39 4.3 Greenpeace studies ..................................................................................................................................................... 40
4.3.1 Greenpeace, 1999, The Bhopal Legacy, “Toxic contaminants at the former Union Carbide factory site, Bhopal, India: 15 years after the Bhopal accident”........................................................................................................ 40 4.3.2 Greenpeace, 2002, “Chemical Stockpiles at Union Carbide India Limited in Bhopal: an investigation”........ 41
4.3.3 Greenpeace, 2004, “High levels of chlorinated organic compounds, including tetrachloromethane, in water from well adjacent to former Union Carbide India Ltd (UCIL) pesticide plant, Bhopal (India)” ................................. 42
4.4 Srishti, 2002, “A Report on Human and Environmental Chemical Contamination around the Bhopal disaster site”43
4.5 Extraction of information from literature review ....................................................................................................... 44
Part V: Water sampling campaign .................................................................................................................... 46 5.1 Introduction to water sampling campaign .................................................................................................................. 46
5.2 Sample collection........................................................................................................................................................ 46
5.3 Results of groundwater sample analysis..................................................................................................................... 48
5.3.1 Water sample analysis at AES Laboratories in Delhi, India ............................................................................. 49
5.3.2 Water sample analysis at an accredited Swiss laboratory ................................................................................. 49 5.3.3 Third party water sampling and analysis in an accredited UK laboratory ........................................................ 53
5.4 Chemicals found in previous third party studies or sampling campaigns in Atal Ayub Nagar and Preet Nagar....... 53
5.4.1 Example Preet Nagar......................................................................................................................................... 53 5.4.2 Example Atal Ayub Nagar ................................................................................................................................ 54
5.5 Discussion................................................................................................................................................................... 56
Part VІ: Conclusion............................................................................................................................................. 59
Part VІІ: Appendix.............................................................................................................................................. 62 5.1 References................................................................................................................................................................... 62
5.2 Drinking water guidelines........................................................................................................................................... 62
5.3 Figure and table directory ........................................................................................................................................... 63
5.4 Data collection form for water sources in communities ............................................................................................. 64
5.5 Acknowledgment ........................................................................................................................................................ 66

Analysis of chemical contaminants in groundwater of communities surrounding UCIL plant site in Bhopal
Main report __________________________________________________________________________________
__________________________________________________________________________________
-6-
- Part І: Introduction
-

Analysis of chemical contaminants in groundwater of communities surrounding UCIL plant site in Bhopal
Main report __________________________________________________________________________________
__________________________________________________________________________________
-7-
Part І: Introduction 1.1 Rationale On the night of December 2nd to the early morning of the 3rd, 1984, a Union Carbide India Limited (UCIL) pesticide plant in Bhopal, India, leaked 27 tons of the deadly gas methyl isocyanate (MIC). Half a million people were exposed to the gas that night and 8-10,000 are believed to have died within 72 hours. Up to 25,000 people are now estimated to have died as a result of their exposure to MIC1. Today, more than 120,000 people still suffer from ailments caused directly by exposure to MIC or by the subsequent pollution caused by the UCIL plant site. Although pesticide production in the plant had stopped after the disaster in 1984, the plant was never dismantled and the site has never been properly cleaned up. Unsheltered chemicals have been stored on-site for decades and these chemicals continuously leach into soil and groundwater. As a result of the inaction to remove these chemicals, contamination of soil and groundwater in the surrounding communities may be a source of many health problems among residents within these communities. In past years, groundwater contamination has been shown to exist by NGOs and governmental organisations. Greenpeace (1999, 2002, 2004) conducted three studies and found that groundwater was highly contaminated with toxic chemicals. The Madhya Pradesh Pollution Control Board (MPPCB) has monitored the groundwater quality for years and analysed water samples from different communities located in close vicinity of the UCIL plant side. MPPCB found toxic chemicals greatly exceeding drinking water guideline values. Furthermore, Srishti (2002) analysed water samples from seven communities around the UCIL plant side and reported the presence of several contaminants. Most chemicals found in these studies are chlorinated organic compounds and are known to potentially cause adverse health effects to humans. Besides carbon tetrachloride, dichlorobenzenes, trichlorobenzenes and chloroform, a variety of other chemicals were identified. All these chemicals were used in the pesticide manufacturing process at UCIL pesticide plant. In 2001, the chemical corporation Dow Chemical purchased Union Carbide, thereby acquiring its assets and liabilities. However, Dow Chemical has steadfastly refused to clean up the site, provide safe drinking water, compensate the victims, or disclose the composition of the gas leak. The Indian government started planning the clean-up of the contaminated area in 2005. However, the planned arrangements, including the use of landfills and incinerators for chemical waste disposal, have not been satisfactory. Disposal through incinerators and landfills can potentially pose a threat to human health, if not properly carried out. In 2009, the situation on-site remains the same and no efforts have been undertaken to clean up the site. 1 These numbers are still subject to discussions, but it is important to mention that many circulating numbers are most likely underestimating the death toll. Many estimates do not take into account the difficulty in record-keeping associated with many bodies never being identified and many more fleeing Bhopal in the days following the disaster.
Analysis of chemical contaminants in groundwater of communities surrounding UCIL plant site in Bhopal
Main report __________________________________________________________________________________
__________________________________________________________________________________
-8-
1.2 Objective and content The objectives of this study are (1) to describe the qualitative and quantitative water supply situation within communities surrounding the Union Carbide India Limited (UCIL) plant site and (2) to determine the extent of groundwater contamination with toxic chemicals (pesticides, organochlorines, dioxins) by collecting and analysing water samples. This present report consists of different sections, each one of them highlighting another aspect of the current water supply situation, thereby contributing to answer the two above mentioned study objectives. A short summary of each section`s content is given below. Part І: Introduction The first part presents introductory background information about the Bhopal gas disaster, followed by a brief description of the study objectives, methodology and study area. Part ІІ: Guideline to the water supply system in the communities and description of area of interest The second part provides a brief introduction to the water supply system within the communities, including other study-relevant sites such as the UCIL plant site and the Solar evaporation ponds (SEP). The information from this part shall help to illustrate the current situation in the communities and serve as a guideline for people who want to conduct further research in this area. Part ІІІ: Summary of community reports Detailed information about the quantitative and qualitative water supply in the communities surrounding UCIL plant site is given in the “Community reports”. Fifteen single reports, one report for each community that has been investigated, were developed. Each report provides satellite maps on which a total of 500 water sources (hand pumps, bore wells) were marked. Data was collected from 300 of these water sources. Section two summarises the information from these “Community reports”. Part ІV: Literature review of selected water quality monitoring and assessment studies In the fourth part, studies that were previously conducted in the area of investigation are summarised as well as critically reviewed. Part V: Water sampling campaign Part four focuses on the methodology and the results of the water sampling campaign that was conducted in the communities. Results from laboratory analysis as well as data from previous studies conducted by other parties are presented and discussed. Part VІ:Conclusion The findings of this study and further research needs are presented and discussed in part six. Part VІІ:Annex The Annex presents references of cited studies and other relevant supplements.
Analysis of chemical contaminants in groundwater of communities surrounding UCIL plant site in Bhopal
Main report __________________________________________________________________________________
__________________________________________________________________________________
-9-
1.3 Methodology In this chapter, we only describe the general approach of how this study has been planned and conducted. The detailed methodology for the development of the community reports and the water sampling are given in the corresponding sections of this report. In order to conduct a groundwater sampling campaign with subsequent sample analysis, it was necessary to investigate the set up of the water supply system. The community reports are the result of large-scale investigations in the field. Discussions with inhabitants of the communities, data collection and mapping of water sources using satellite maps helped to establish detailed descriptions of the qualitative and quantitative water supply situation in the area of interest. The community reports are the groundwork of this study as the collected data was used to determine from which water sources to collect the water samples. The “guideline” which is presented in Part І of this study emerged directly from the work done for the community reports and is presented in the very beginning to give the reader an understanding of the situation in the study area. A literature review was conducted to learn about results from studies that investigated the water quality in Bhopal. The selected studies also provided information about topology, climate and groundwater flow and revealed which chemicals were potentially present in the groundwater. With the review it was possible to identify target chemicals for which the water samples were then analysed. A number of groundwater samples were taken from hand pumps and bore wells in order to determine the water quality by quantifying pollutants such as pesticides and organic solvents. These results, in combination with water sampling data from other studies, were used to describe potential adverse health effects for people drinking the water.
Analysis of chemical contaminants in groundwater of communities surrounding UCIL plant site in Bhopal
Main report __________________________________________________________________________________
__________________________________________________________________________________
-10-
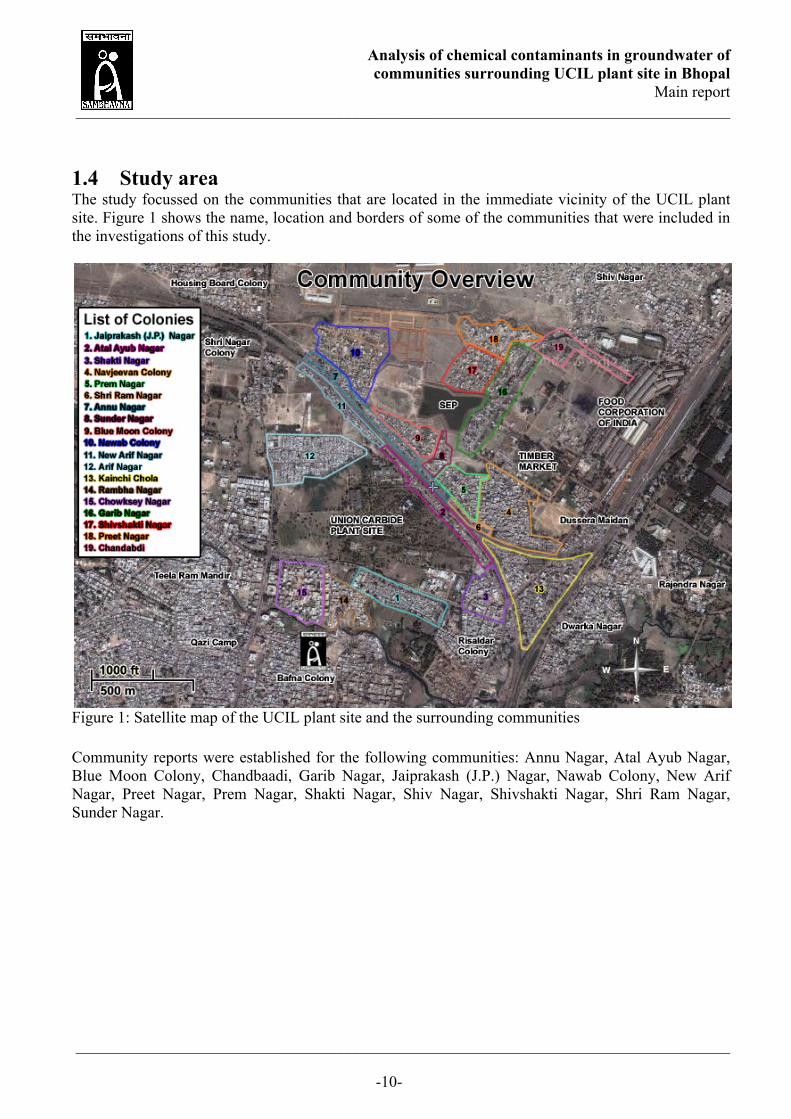
1.4 Study area The study focussed on the communities that are located in the immediate vicinity of the UCIL plant site. Figure 1 shows the name, location and borders of some of the communities that were included in the investigations of this study.
Figure 1: Satellite map of the UCIL plant site and the surrounding communities Community reports were established for the following communities: Annu Nagar, Atal Ayub Nagar, Blue Moon Colony, Chandbaadi, Garib Nagar, Jaiprakash (J.P.) Nagar, Nawab Colony, New Arif Nagar, Preet Nagar, Prem Nagar, Shakti Nagar, Shiv Nagar, Shivshakti Nagar, Shri Ram Nagar, Sunder Nagar.

Analysis of chemical contaminants in groundwater of communities surrounding UCIL plant site in Bhopal
Main report __________________________________________________________________________________
__________________________________________________________________________________
-11-
- Part ІІ: Guideline to the water supply system in the communities and
description of area of interest -

Analysis of chemical contaminants in groundwater of communities surrounding UCIL plant site in Bhopal
Main report __________________________________________________________________________________
__________________________________________________________________________________
-12-
Part ІІ: Guideline to the water supply system in the communities and description of area of interest 2.1 Introduction to the guideline This guideline is intended to provide a detailed insight into how the communities surrounding the UCIL plant site are supplied with water. Pictures show the present installations and infrastructure, helping to illustrate the condition of the water supply system. Additionally, information and illustrations of some important sites such as the UCIL plant site and the Solar evaporation ponds (SEP) are presented. 2.2 Water supply There are several possibilities as to how residents in the communities can access drinking water. There are large numbers of private hand pumps or bore wells which are located in houses or backyards. Access to these private water sources is restricted to the owner of the well. In contrast to private pumps, public hand pumps (also called governmental hand pumps) are open to everybody as they are often located on clearances. Besides these private and public water sources, the municipal water supply is the most important way for accessing drinking water. The water is delivered to the communities using tanker trucks or by pipe system. The following chapters describe the private water sources and the municipal water supply in more detail. 2.2.1 Private water sources - hand pumps and bore wells The most important feature of a hand pump or a bore well is the depth. Because of long dry seasons on the one hand and the monsoon season on the other hand, the depth partly dictates the water quality and availability throughout the year. Many private hand pumps and bore wells stop providing water during the summer time when the water table is lowered. During the monsoon, when the table rises again, the water from these hand pumps is often muddy. As many people cannot afford sophisticated filtration systems, the only available filtration technique is close-meshed fabric. Yet, much particle matter remains in the water as many particles are too small to be retained by the fabric. It is important to point out that clear water is not necessarily an indicator of good quality. It was often the case that within many of these communities, clear water had a metallic taste or smelt of solvent. Public hand pumps usually provide a continuous water supply throughout the year, but odor problems were observed from their water as well. Public hand pumps are among the deepest hand pumps with a depth usually in the range of 150 feet, but depths up to 350 feet were also encountered. Depths of private hand pumps usually range between 60 – 80 feet, shallow pumps with only 30 feet and deep pumps of >100 feet are rare. Depths of boreholes are typically similar to those of the private hand pumps. Figures 2-9 show hand pumps and bore wells in Shiv Nagar. Note that public hand pumps can be easily identified by their distinct shape.

Analysis of chemical contaminants in groundwater of communities surrounding UCIL plant site in Bhopal
Main report __________________________________________________________________________________
__________________________________________________________________________________
-13-
Figure 2: Public hand pump, out of commission
Figure 3: Public hand pump in use
Figure 4: Public hand pump in use
Figure 5: Private hand pump in a backyard
Figure 6: Private hand pump inside a house
Analysis of chemical contaminants in groundwater of communities surrounding UCIL plant site in Bhopal
Main report __________________________________________________________________________________
__________________________________________________________________________________
-14-
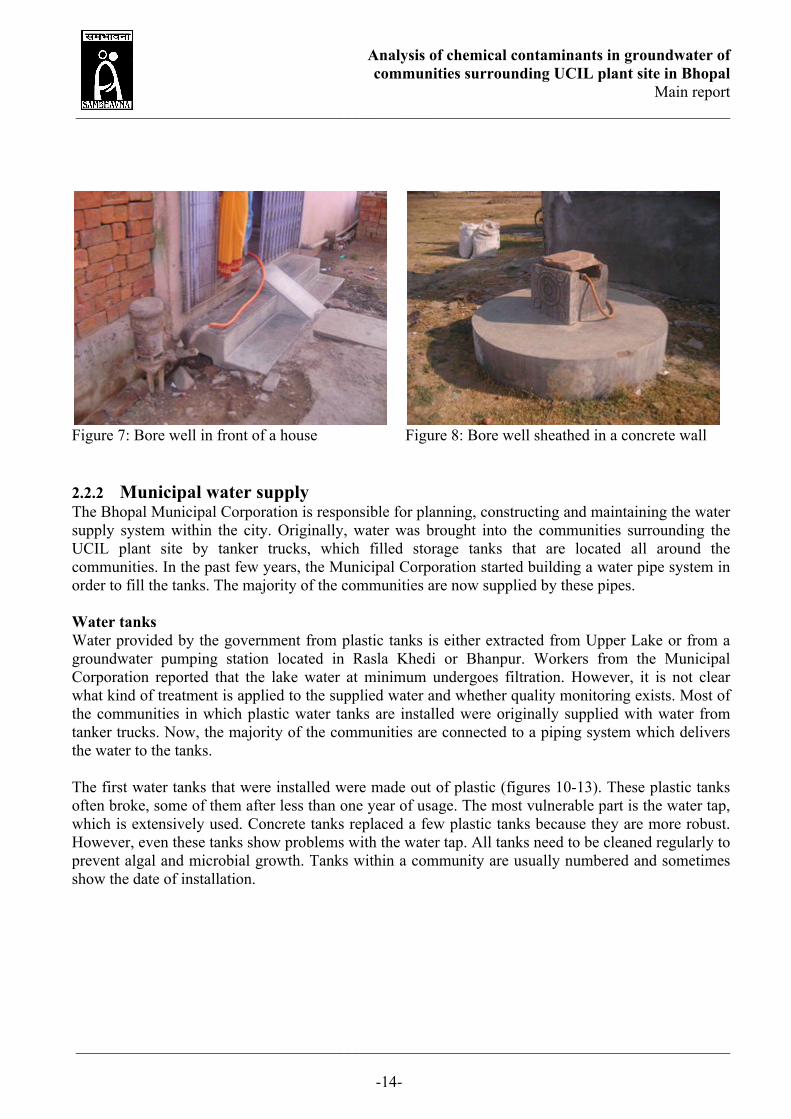
Figure 7: Bore well in front of a house
Figure 8: Bore well sheathed in a concrete wall
2.2.2 Municipal water supply The Bhopal Municipal Corporation is responsible for planning, constructing and maintaining the water supply system within the city. Originally, water was brought into the communities surrounding the UCIL plant site by tanker trucks, which filled storage tanks that are located all around the communities. In the past few years, the Municipal Corporation started building a water pipe system in order to fill the tanks. The majority of the communities are now supplied by these pipes. Water tanks Water provided by the government from plastic tanks is either extracted from Upper Lake or from a groundwater pumping station located in Rasla Khedi or Bhanpur. Workers from the Municipal Corporation reported that the lake water at minimum undergoes filtration. However, it is not clear what kind of treatment is applied to the supplied water and whether quality monitoring exists. Most of the communities in which plastic water tanks are installed were originally supplied with water from tanker trucks. Now, the majority of the communities are connected to a piping system which delivers the water to the tanks. The first water tanks that were installed were made out of plastic (figures 10-13). These plastic tanks often broke, some of them after less than one year of usage. The most vulnerable part is the water tap, which is extensively used. Concrete tanks replaced a few plastic tanks because they are more robust. However, even these tanks show problems with the water tap. All tanks need to be cleaned regularly to prevent algal and microbial growth. Tanks within a community are usually numbered and sometimes show the date of installation.
Analysis of chemical contaminants in groundwater of communities surrounding UCIL plant site in Bhopal
Main report __________________________________________________________________________________
__________________________________________________________________________________
-15-
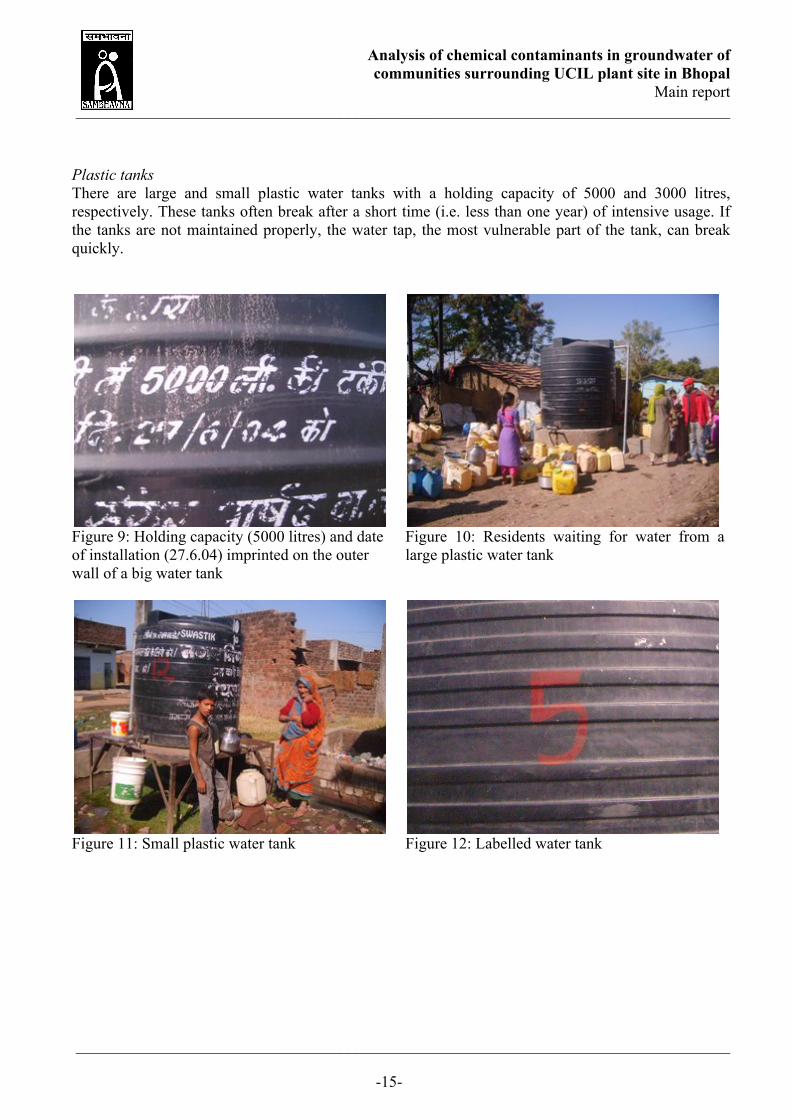
Plastic tanks There are large and small plastic water tanks with a holding capacity of 5000 and 3000 litres, respectively. These tanks often break after a short time (i.e. less than one year) of intensive usage. If the tanks are not maintained properly, the water tap, the most vulnerable part of the tank, can break quickly.
Figure 9: Holding capacity (5000 litres) and date of installation (27.6.04) imprinted on the outer wall of a big water tank
Figure 10: Residents waiting for water from a large plastic water tank
Figure 11: Small plastic water tank
Figure 12: Labelled water tank
Analysis of chemical contaminants in groundwater of communities surrounding UCIL plant site in Bhopal
Main report __________________________________________________________________________________
__________________________________________________________________________________
-16-
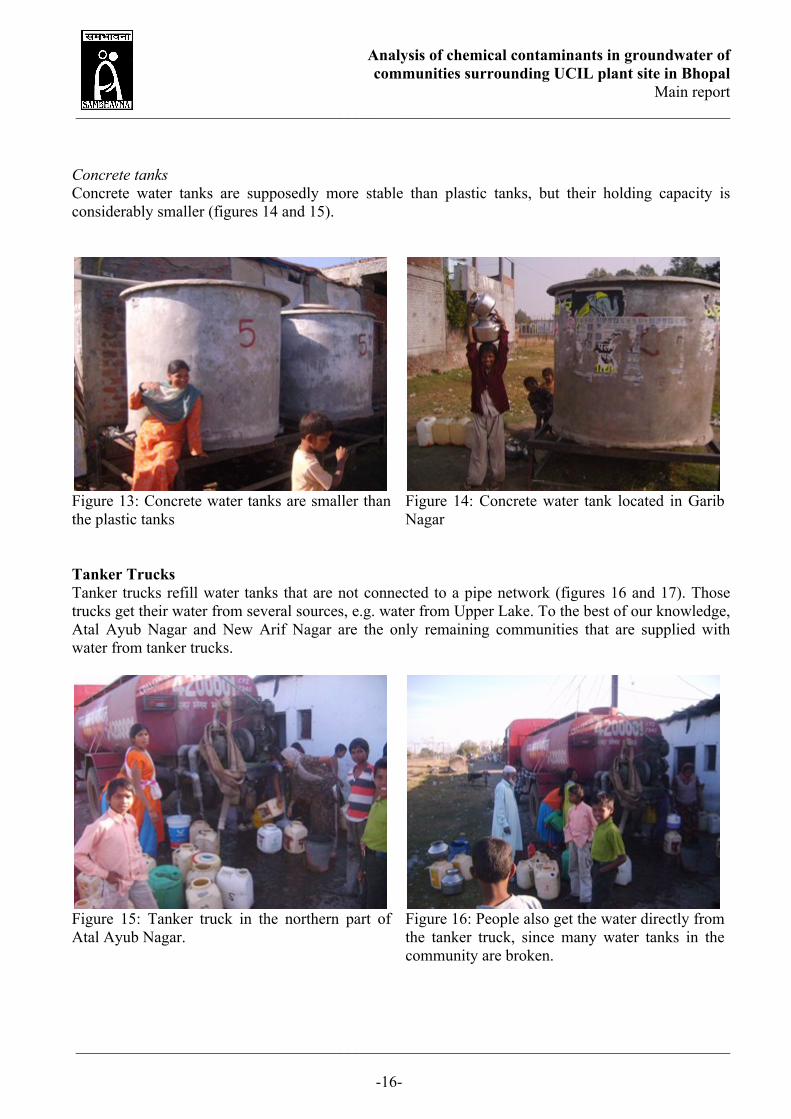
Concrete tanks Concrete water tanks are supposedly more stable than plastic tanks, but their holding capacity is considerably smaller (figures 14 and 15).
Figure 13: Concrete water tanks are smaller than the plastic tanks
Figure 14: Concrete water tank located in Garib Nagar
Tanker Trucks Tanker trucks refill water tanks that are not connected to a pipe network (figures 16 and 17). Those trucks get their water from several sources, e.g. water from Upper Lake. To the best of our knowledge, Atal Ayub Nagar and New Arif Nagar are the only remaining communities that are supplied with water from tanker trucks.
Figure 15: Tanker truck in the northern part of Atal Ayub Nagar.
Figure 16: People also get the water directly from the tanker truck, since many water tanks in the community are broken.
Analysis of chemical contaminants in groundwater of communities surrounding UCIL plant site in Bhopal
Main report __________________________________________________________________________________
__________________________________________________________________________________
-17-
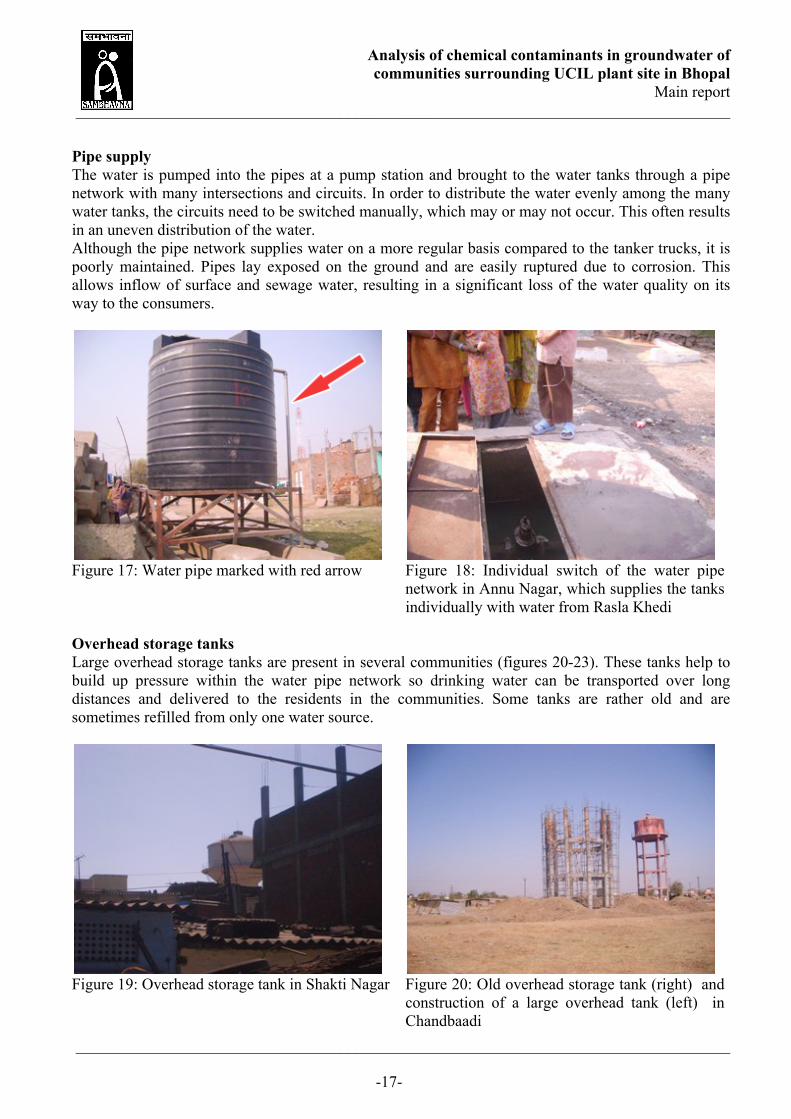
Pipe supply The water is pumped into the pipes at a pump station and brought to the water tanks through a pipe network with many intersections and circuits. In order to distribute the water evenly among the many water tanks, the circuits need to be switched manually, which may or may not occur. This often results in an uneven distribution of the water. Although the pipe network supplies water on a more regular basis compared to the tanker trucks, it is poorly maintained. Pipes lay exposed on the ground and are easily ruptured due to corrosion. This allows inflow of surface and sewage water, resulting in a significant loss of the water quality on its way to the consumers.
Figure 17: Water pipe marked with red arrow
Figure 18: Individual switch of the water pipe network in Annu Nagar, which supplies the tanks individually with water from Rasla Khedi
Overhead storage tanks Large overhead storage tanks are present in several communities (figures 20-23). These tanks help to build up pressure within the water pipe network so drinking water can be transported over long distances and delivered to the residents in the communities. Some tanks are rather old and are sometimes refilled from only one water source.
Figure 19: Overhead storage tank in Shakti Nagar
Figure 20: Old overhead storage tank (right) and construction of a large overhead tank (left) in Chandbaadi

Analysis of chemical contaminants in groundwater of communities surrounding UCIL plant site in Bhopal
Main report __________________________________________________________________________________
__________________________________________________________________________________
-18-
Figure 21: Overhead tank in Jaiprakash (J.P.) Nagar
Figure 22: Construction of overhead water storage tank at Blue Moon pumping station.
Water pump station The pump station in Blue Moon Colony (figures 24 and 25) is a sort of a distribution centre for water which comes from Rasla Khedi. Groundwater is extracted in Rasla Khedi and delivered to the pump station where it is stored in a large ground tank before being pumped to the adjacent communities. A worker at the station reported that the pump station delivers water to nine communities: Nawab Colony, Prem Nagar, Sunder Nagar, Shri Ram Nagar, Shivshakti Nagar, Preet Nagar, Annu Nagar, Majara Bustee and Blue Moon Colony.
Figure 23: A so-called sub-tank (ground storage tank) at the pumping station in Blue Moon Colony with a capacity of 400`000 litres. The tank was built in 2005.
Figure 24: Construction of an overhead water storage tank, with a capacity of 1`000`000 litres, in addition to the existing ground storage tank, for the pumping station,.

Analysis of chemical contaminants in groundwater of communities surrounding UCIL plant site in Bhopal
Main report __________________________________________________________________________________
__________________________________________________________________________________
-19-
2.2.3 Problems encountered with water tanks and pipe system As mentioned earlier, the pipe system and the water tanks require considerable attention in order to supply clean water. Figures 26-33 illustrate that without proper maintenance, a water supply system performs poorly in fulfilling its purpose.
Figure 25: Algae and dirt inside a water tank which has not been refilled on a regular basis. The tank is located in Blue Moon Colony.
Figure 26: Bottom of the water tank from Fig. 26
Figure 27: Water tap, the most vulnerable part of a tank because it tends to easily break
Figure 28: Broken water tap

Analysis of chemical contaminants in groundwater of communities surrounding UCIL plant site in Bhopal
Main report __________________________________________________________________________________
__________________________________________________________________________________
-20-
Figure 29: Broken tank in Shri Ram Nagar
Figure 30: Remnants of a pipe system in Shri Ram Nagar
Figure 31: Ruptured pipe in Shri Ram Nagar
Figure 32: Overhead water storage tank in Arif Nagar which used to supply parts of the community with water by a pipe network. The network is broken and hence New Arif Nagar does not get water from the tank

Analysis of chemical contaminants in groundwater of communities surrounding UCIL plant site in Bhopal
Main report __________________________________________________________________________________
__________________________________________________________________________________
-21-
2.3 Solar evaporation pond (SEP) The solar evaporation ponds (SEP) are artificial ponds which were constructed by UCIL for dumping chemical waste. They are located northeast of the plant site and remain a prominent landmark. Detailed information about the SEP is given in Part ІV - Literature review of this report.
Figure 33: View on the Solar Evaporation Ponds (SEP), dumping site of waste water from UCIL plant.
Figure 34: Muddy water in the SEP
Figure 35: A thin polyethylene plastic layer, covered with soil, was supposed to prevent leaching of the pond water into the groundwater
Figure 36: Disruption of the plastic layer on the dam of the SEP
Analysis of chemical contaminants in groundwater of communities surrounding UCIL plant site in Bhopal
Main report __________________________________________________________________________________
__________________________________________________________________________________
-22-
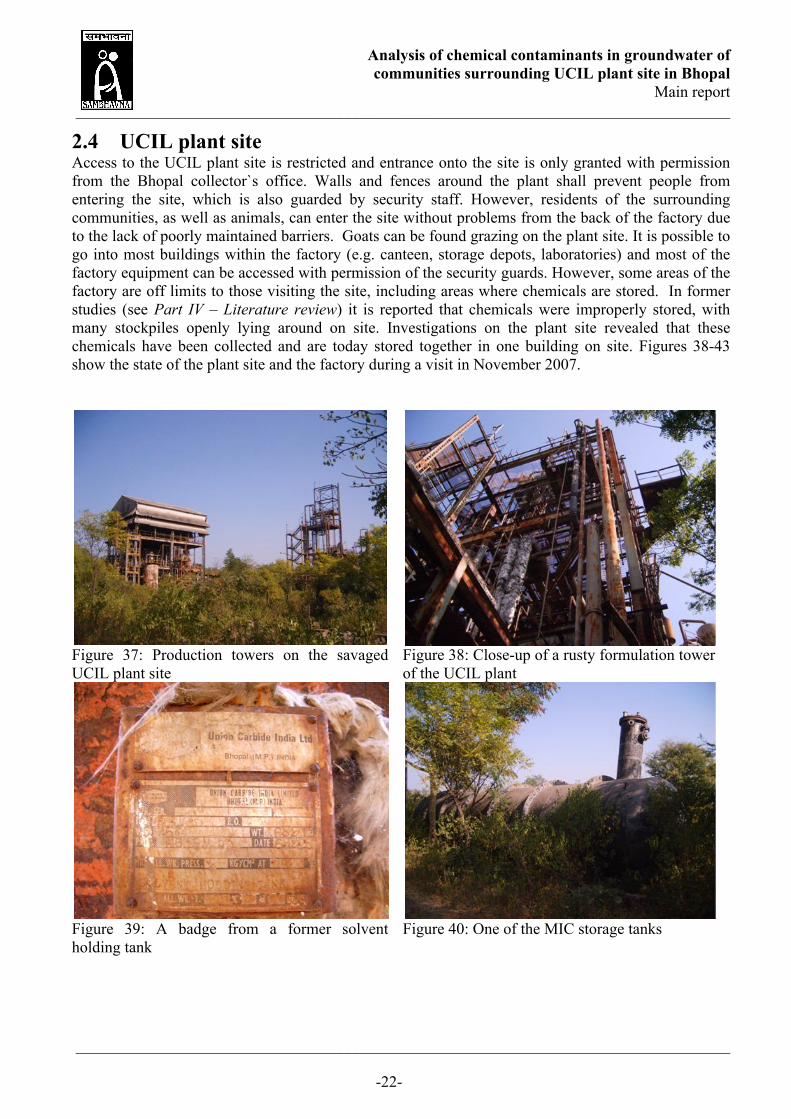
2.4 UCIL plant site Access to the UCIL plant site is restricted and entrance onto the site is only granted with permission from the Bhopal collector`s office. Walls and fences around the plant shall prevent people from entering the site, which is also guarded by security staff. However, residents of the surrounding communities, as well as animals, can enter the site without problems from the back of the factory due to the lack of poorly maintained barriers. Goats can be found grazing on the plant site. It is possible to go into most buildings within the factory (e.g. canteen, storage depots, laboratories) and most of the factory equipment can be accessed with permission of the security guards. However, some areas of the factory are off limits to those visiting the site, including areas where chemicals are stored. In former studies (see Part ІV – Literature review) it is reported that chemicals were improperly stored, with many stockpiles openly lying around on site. Investigations on the plant site revealed that these chemicals have been collected and are today stored together in one building on site. Figures 38-43 show the state of the plant site and the factory during a visit in November 2007.
Figure 37: Production towers on the savaged UCIL plant site
Figure 38: Close-up of a rusty formulation tower of the UCIL plant
Figure 39: A badge from a former solvent holding tank
Figure 40: One of the MIC storage tanks

Analysis of chemical contaminants in groundwater of communities surrounding UCIL plant site in Bhopal
Main report __________________________________________________________________________________
__________________________________________________________________________________
-23-
Figure 41: Residents and grazing goat on the plant site
Figure 42: The flare tower which was not in operation when the disaster happened on December 2nd in 1984
Analysis of chemical contaminants in groundwater of communities surrounding UCIL plant site in Bhopal
Main report __________________________________________________________________________________
__________________________________________________________________________________
-24-
- Part ІІІ: Summary of community reports
-
Analysis of chemical contaminants in groundwater of communities surrounding UCIL plant site in Bhopal
Main report __________________________________________________________________________________
__________________________________________________________________________________
-25-
Part ІІІ: Summary of Community Reports 3.1 Introduction to the Community Reports In total, fifteen Community reports were developed using data that was collected during more than a month of field work. The location of over five hundred water sources was determined and marked on satellite maps. For over three hundred out of the five hundred water sources, data such as depth was collected and included in the reports. Each community report describes the water supply situation in the corresponding community. Community Reports were established for the following communities: Annu Nagar, Atal Ayub Nagar, Blue Moon Colony, Chandbaadi, Garib Nagar, Jaiprakash (J.P.) Nagar, Nawab Colony, New Arif Nagar, Preet Nagar, Prem Nagar, Shakti Nagar, Shiv Nagar, Shivshakti Nagar, Shri Ram Nagar, Sunder Nagar. In this part of the study, we summarise the findings from the Community Reports. 3.2 Method Satellite maps for communities surrounding the UCIL plant site were prepared. With help from residents and Sambhavna Trust Clinic staff, community borders were identified and marked on satellite maps (see chapter 1.4 Study area). Using these maps, we conducted a survey in the communities determining the geographical location of all water sources (hand pumps, mechanical bore wells, tube wells and water tanks) in the area of interest. For more than half of the water sources, information such as depth of the water source, the operational reliability, the water quality (only visual assessment and description of smell/taste) and the purpose of the water (e.g. drinking water, water for washing, agriculture) was collected using a questionnaire sheet (see Part VІІ: Annex). 3.3 Results The findings from the community reports are given in the following chapters, arranged accordingly to topic. 3.3.1 Water supply The investigated communities show different patterns as to where residents get their water. There are communities where almost every household has its own private hand pump, while other communities depend almost entirely on the water supplied by the government. The community reports reveal that the water supply in the majority of the investigated communities is not sufficient. People without access to private hand pumps are highly dependent on water supplied by the Bhopal Municipal Corporation through the pipe network or the tanker trucks. In Atal Ayub Nagar for example, there is not a single private hand pump installed and the water from the governmental hand pumps smells as if high amounts of solvents are present in the groundwater. There is only one private hand pump in Chandbaadi and only a small number in Annu Nagar. Residents living in communities with a low density of installed bore wells or hand pumps are affected the most from lack of drinking water, as it has been shown that the water supply system is in poor shape. Many water tanks are broken and are not being repaired on a timely basis by the Municipal Corporation, and the tanker trucks deliver water only on an irregular basis.

Analysis of chemical contaminants in groundwater of communities surrounding UCIL plant site in Bhopal
Main report __________________________________________________________________________________
__________________________________________________________________________________
-26-
The pipe network that replaced the tanker trucks, for refilling the water tanks in many communities, does not work properly for two reasons. First, an engineer working at the pumping station in Blue Moon Colony reported that there is not sufficient water being delivered from Rasla Khedi. The pumping station cannot cover the demand of all the communities it is supposed to supply and many water tanks are refilled irregularly. Secondly, there is not enough staff to operate and maintain the pipe network. The circuits of the pipe network need to be switched manually to assure that the water is evenly distributed among the communities and the water tanks. Many pipes are corroded or even broken and have to be fixed. However, both of these requirements cannot be met if there is not enough staff. Residents of some communities have started to keep track of the frequency and amount of water delivery in order to collect further evidence of anomalies and scarcity of water supply (see Figure 43).
Figure 43: Resident of New Arif Nagar with calendar for reporting the water tank supply. The amount of water is noted on the days when the tank is refilled.
3.3.2 Water quality The water quality was determined by visual assessment (e.g. clearness, particle matter) and sometimes by tasting the samples. The water coming from pipes and tanker trucks was reported to be of poor quality. Because the tanks are not refilled and cleaned regularly, build-up of biofilms inside the tanks can often be observed, resulting in foul taste of the water. Ruptured pipes may not only leak a lot of water, but inflow of waste water containing all sorts of microorganisms (e.g. coliforms) can lead to contamination of the drinking water. Regarding bore well and hand pump water, we observed considerable disparities of the water quality not only between the communities, but also within communities even in small areas. This is not surprising as aquifers are not homogenous and the depths of hand pumps and bore wells differ greatly. Multiple problems were observed when hand pumps and bore wells are used to extract groundwater. In many cases, the water was muddy throughout the year and contained much particle matter as can be seen in Figure 44. Residents reported that, especially during the monsoon season, the water becomes muddy and smelly, whereas in summer time the water tends to be clearer. Infiltration of surface waste water from open sewer channels during the monsoon may serve as a source of pollution of shallow aquifers. These are the same aquifers from which groundwater is drawn by private hand pumps. However, accessing deeper aquifers does not always guarantee better water quality. Water drawn from

Analysis of chemical contaminants in groundwater of communities surrounding UCIL plant site in Bhopal
Main report __________________________________________________________________________________
__________________________________________________________________________________
-27-
public hand pumps is generally clearer than water from private hand pumps, but it often tastes as if solvents are present. Except for filtering the water through a piece of fabric in order to retain the largest particles, residents do not have an alternative to improve the water quality. High-flow water filter units containing charcoal cartridges would be needed to remove particles and organic pollutants from the water, but such units are too costly in acquisition and maintenance even if they could be shared among several households.
Figure 44: Muddy water from hand pump H/P An 4 in Annu Nagar. This water is also used for drinking.
Figure 45: Muddy, yellowish water with bad smell from hand pump H/P ShB 47 in Shiv Nagar. The water cannot be used for drinking.
Figure 46: Water coming from a bore well in Shiv Nagar is forming bubbles and foam without addition of any washing detergents.
Figure 47: Muddy water with bad smell from H/P ShD 1 in Shiv Nagar. People have stopped using this water for drinking, because they have become sick from it.

Analysis of chemical contaminants in groundwater of communities surrounding UCIL plant site in Bhopal
Main report __________________________________________________________________________________
__________________________________________________________________________________
-28-
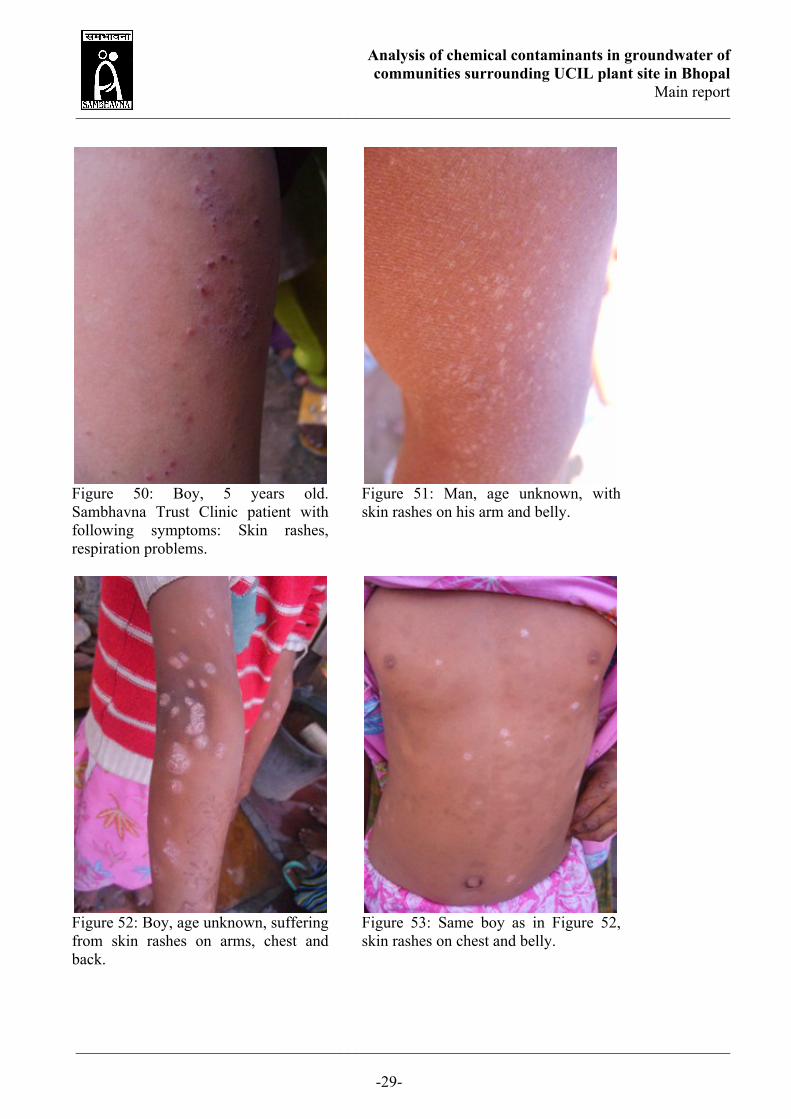
3.3.3 Health A considerable number of residents in the communities reported a variety of health problems, of which some can be related directly to the poor drinking water quality. Headaches, combined with diarrhoea and stomach cramps after consumption of groundwater or water from tanks are the most common ailments that people have reported. Besides these symptoms, skin rashes were widespread among residents. Some communities seemed to be more affected by this phenomenon. It is likely that chemical pollutants may cause such skin rashes and the majority of inhabitants in the investigated areas urge that the bad water quality is responsible for causing their skin problems. Nawab Colony was the community where skin rashes were observed most frequently (figures 49-54). The following pictures show typical lesions of Nawab Colony residents using groundwater, as well as tank water, for drinking and washing.
Figure 48: Woman, 40 years old, suffering from skin rashes. Sambhavna Trust Clinic patient with following symptoms: skin rashes, bodyache, neuromuscular problems. Diagnosis: hypertention. (Identity of person is known)
Figure 49: Woman, 27 years old, suffering from skin rashes. Sambhavna Trust Clinic patient with following symptoms: skin rashes, joint pain, breathlessness, neuromuscular problems. (Identity of person is known)
Analysis of chemical contaminants in groundwater of communities surrounding UCIL plant site in Bhopal
Main report __________________________________________________________________________________
__________________________________________________________________________________
-29-
Figure 50: Boy, 5 years old. Sambhavna Trust Clinic patient with following symptoms: Skin rashes, respiration problems.
Figure 51: Man, age unknown, with skin rashes on his arm and belly.
Figure 52: Boy, age unknown, suffering from skin rashes on arms, chest and back.
Figure 53: Same boy as in Figure 52, skin rashes on chest and belly.

Analysis of chemical contaminants in groundwater of communities surrounding UCIL plant site in Bhopal
Main report __________________________________________________________________________________
__________________________________________________________________________________
-30-
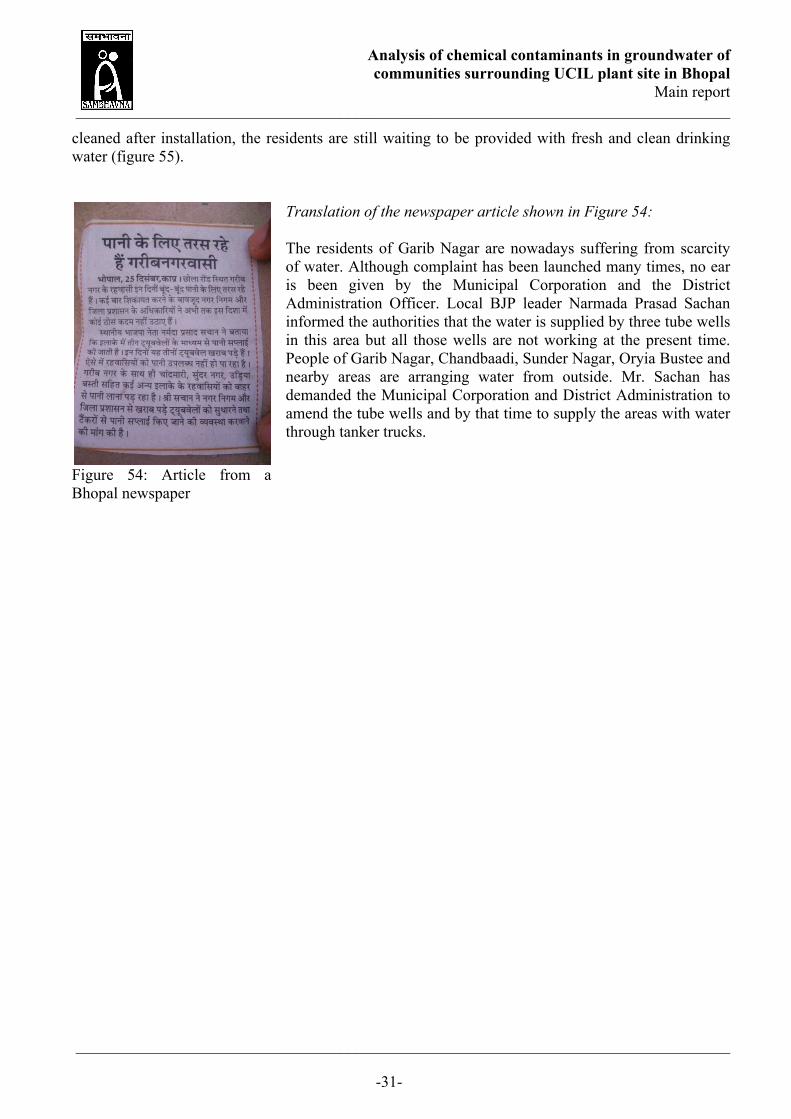
3.4 Community case studies The community of Atal Ayub Nagar is among the communities which are the most affected by groundwater contamination and insufficient water supply. In Atal Ayub Nagar, the whole range of problems regarding access to clean drinking water is present. Garib Nagar has similar problems and its residents are struggling with city authorities to gain an appropriate water supply in their area. These two communities are used as a surrogate for other communities to illustrate the problems that people face regarding access to drinking water. The findings of the Community reports from these two communities are therefore presented in the following two sections. 3.4.1 Atal Ayub Nagar Atal Ayub Nagar is located in close proximity to the UCIL pesticide plant. Residents built their houses from wood, plastic, cow dung, asbestos and corrugated metal sheets alongside the railway tracks. Residents of this community cannot afford to build their own private hand pumps or bore wells. A few governmental hand pumps are present, but the water quality of these hand pumps is poor and tastes strongly of solvents. The main sources for drinking water are several plastic water tanks located throughout the community, which are refilled by government tanker trucks. The water supply in Atal Ayub Nagar is clearly insufficient. Residents depend on the supply from tanker trucks that is highly irregular. The plastic water tanks are either broken or badly maintained. Previous reports showed the presence of several chemicals in water samples taken from governmental hand pumps. Greenpeace (1999), Srishti (2002) and monitoring data from the Madhya Pradesh Pollution Control Board (MPPCB) show that groundwater in Atal Ayub Nagar is contaminated with solvents, pesticides and chemicals that have been used in the production process of Sevin in the UCIL pesticide plant. 3.4.2 Garib Nagar Garib Nagar is built alongside a road on a length of about 600 meters. The houses are generally in good shape, but the inhabitants are poor. Most of them have low incomes from daily work. Garib Nagar is located right next to the Solar Evaporation Ponds (SEP) of UCIL. Since residents have a low household income, they cannot afford to construct their own private water source. Just a few private hand pumps and bore wells can be found in Garib Nagar. Most of the hand pumps and bore wells provide salty water. Many private hand pumps and bore wells have been closed down because the water was too salty for use as drinking water or for washing. The nearby SEP was a wastewater dumping site for UCIL when the plant was still running. NEERI (1990) investigated soil and water from the SEP and found high concentrations of chloride (see Part ІV: Literature review). Garib Nagar has a serious water problem and people are fighting for a better water supply for their community (see Figure 54 and translation of newspaper article). Only a few people get water from their own source and even that water is often too salty and not fit to drink. In addition to the salty taste, the Madhya Pradesh Pollution Control Board (MPPCB) found several toxic chemicals in the groundwater of Garib Nagar. Furthermore, the electricity supply of the community is unstable and vulnerable to collapse and people can often not use their mechanical bore wells. In order to improve the situation, water tanks have been recently installed by the Bhopal Municipal Corporation. Ten tanks have been installed between January and June 2007. Those tanks are refilled daily (except Sundays) by a tanker truck. Since this water is often muddy and the tanks were never
Analysis of chemical contaminants in groundwater of communities surrounding UCIL plant site in Bhopal
Main report __________________________________________________________________________________
__________________________________________________________________________________
-31-
cleaned after installation, the residents are still waiting to be provided with fresh and clean drinking water (figure 55).
Figure 54: Article from a Bhopal newspaper
Translation of the newspaper article shown in Figure 54: The residents of Garib Nagar are nowadays suffering from scarcity of water. Although complaint has been launched many times, no ear is been given by the Municipal Corporation and the District Administration Officer. Local BJP leader Narmada Prasad Sachan informed the authorities that the water is supplied by three tube wells in this area but all those wells are not working at the present time. People of Garib Nagar, Chandbaadi, Sunder Nagar, Oryia Bustee and nearby areas are arranging water from outside. Mr. Sachan has demanded the Municipal Corporation and District Administration to amend the tube wells and by that time to supply the areas with water through tanker trucks.
Analysis of chemical contaminants in groundwater of communities surrounding UCIL plant site in Bhopal
Main report __________________________________________________________________________________
__________________________________________________________________________________
-32-
- Part ІV: Literature review of selected water quality
monitoring and assessment studies -
Analysis of chemical contaminants in groundwater of communities surrounding UCIL plant site in Bhopal
Main report __________________________________________________________________________________
__________________________________________________________________________________
-33-
Part ІV: Literature review of selected water quality monitoring and assessment studies 4 4.1 Introduction to the literature review The contamination of groundwater has been proven by several studies. Greenpeace (1999, 2002, 2004) conducted three studies and found that groundwater was highly contaminated with toxic chemicals. The Madhya Pradesh Pollution Control Board (MPPCB) has monitored the groundwater quality over the years and has analysed water samples from several communities located in close proximity to the UCIL plant site. The MPPCB found toxic chemicals greatly exceeding guideline values, their data is given in the “Community Reports” and partly summarised in Part V: Water sampling campaign of this report. Furthermore, Srishti (2002) analysed water samples from seven communities surrounding the UCIL plant site for several chemicals. In 1990, the National Environmental Engineering Research Institute (NEERI) conducted an assessment study to investigate the pollution of surface water bodies and groundwater caused by the Solar Evaporation Ponds (SEP) on the former UCIL plant site. Most chemicals found in the studies mentioned above are chlorinated organic compounds which have been shown to cause severe health effects on humans. Besides carbon tetrachloride, dichlorobenzenes, trichlorobenzenes and chloroform, a variety of other chemicals were identified. Some of these chemicals were used in the pesticide manufacturing process at UCIL pesticide plant. Subsequently, we will summarise and discuss parts of the NEERI study (1990), the three Greenpeace studies (1999, 2002, 2004) and the Srishti report (2002) as they all contain helpful information for planning water sampling campaigns. Besides assessing possible environmental pollution due to leakage of SEP water, the NEERI study investigated the geological and hydrological setting including the groundwater flow in the study area. The study provides, to the best knowledge of the authors, the only available hydrogeological map of Bhopal. As already mentioned above, the Greenpeace studies give important information about chemical pollutants in groundwater, helping to select target chemicals for analysis of water samples. Alongside environmental sampling, the Srishti report was the only available study that investigated chemical concentrations in vegetables and breast milk. Note that this summary is not meant to be comprehensive and the selected studies are summarised just briefly. For more detailed results we refer to the studies as found online. 4.2 National Environmental Engineering Research Institute (NEERI),
1990, “Assessment of pollution damage due to Solar Evaporation Ponds at UCIL, Bhopal”
The assessment study conducted by the National Environmental Engineering Research Institute (NEERI) in 1990 investigated the pollution due to the Solar Evaporation Pond (SEP) on the former
Analysis of chemical contaminants in groundwater of communities surrounding UCIL plant site in Bhopal
Main report __________________________________________________________________________________
__________________________________________________________________________________
-34-
UCIL plant site. The SEP was used to dump waste water emerging from the Sevin production process at the UCIL plant. The study was commissioned by the State Government of Madhya Pradesh to investigate the “extent of contamination of soil and groundwater near SEP” and to suggest the decontamination of the SEP as well as of the contaminated water and soil. At the time the study was conducted, the M.P. State Government was considering reclaiming the land occupied by the SEP to establish a new industrial area, which would be part of the rehabilitation process for gas victims (NEERI, 1990). The study included the investigation of climatic, geological (stone formations) and hydrogeological (surface waters, groundwater flow) settings of the area on which the SEP is located. Furthermore, an assessment of the water quality and the soil contamination around the SEP was conducted by testing water and soil samples for several chemicals. The hydrogeological survey includes an investigation of the groundwater table and groundwater aquifers in the study area and provides a hydrogeological map. The geological survey contains information about rock formations and soil strata, whereas the climatic survey, which is not summarised in this review, highlights some climatic data. 4.2.1 Methods and study setting For the hydrogeological and the geological survey, NEERI (1990) used data from the following sources:
- Geological Survey of India (GSI) - Central Groundwater Board (CGWB) - M.P. State Groundwater Board in Bhopal - Madhya Pradesh Council on Science and Technology (MAPCOST)
Based on the above data and further physical investigation of the area conducted by NEERI (1990), groundwater flow directions of aquifers were identified and noted in a hydrogeological map. The investigations included data collection of a “large number of dug wells and hand pumps, located within 3 km of the SEP” for estimating the water table in the area (NEERI, 1990). In order to define the underground area of the SEP, the existing data from the above mentioned sources needed to be extended, since this data did not provide detailed information for the area around the SEP. Geophysical methods such as electrical resistivity (ER) were used by NEERI (1990) to define the soil texture and stone formation, as well as to determine the groundwater direction and contamination through vertical electrical soundings (VES). VES was conducted at eighteen locations in the immediate vicinity of the SEP. The soundings measure the resistivity of the formations in the ground. Electrodes, introduced into the ground introduce an artificial source of current. The resistivity was determined by measuring the current on other electrodes in the vicinity. In order to determine the extent of groundwater contamination due to leakage of impounded water into the SEP, NEERI (1990) established a network of monitoring wells. In order to design the groundwater monitoring network, the following aspects were taken into consideration: geological setting around SEP, topography, hydrogeological framework, ER profiles and quality of water from nearby dug and tube wells, whose water quality was already known.
Analysis of chemical contaminants in groundwater of communities surrounding UCIL plant site in Bhopal
Main report __________________________________________________________________________________
__________________________________________________________________________________
-35-
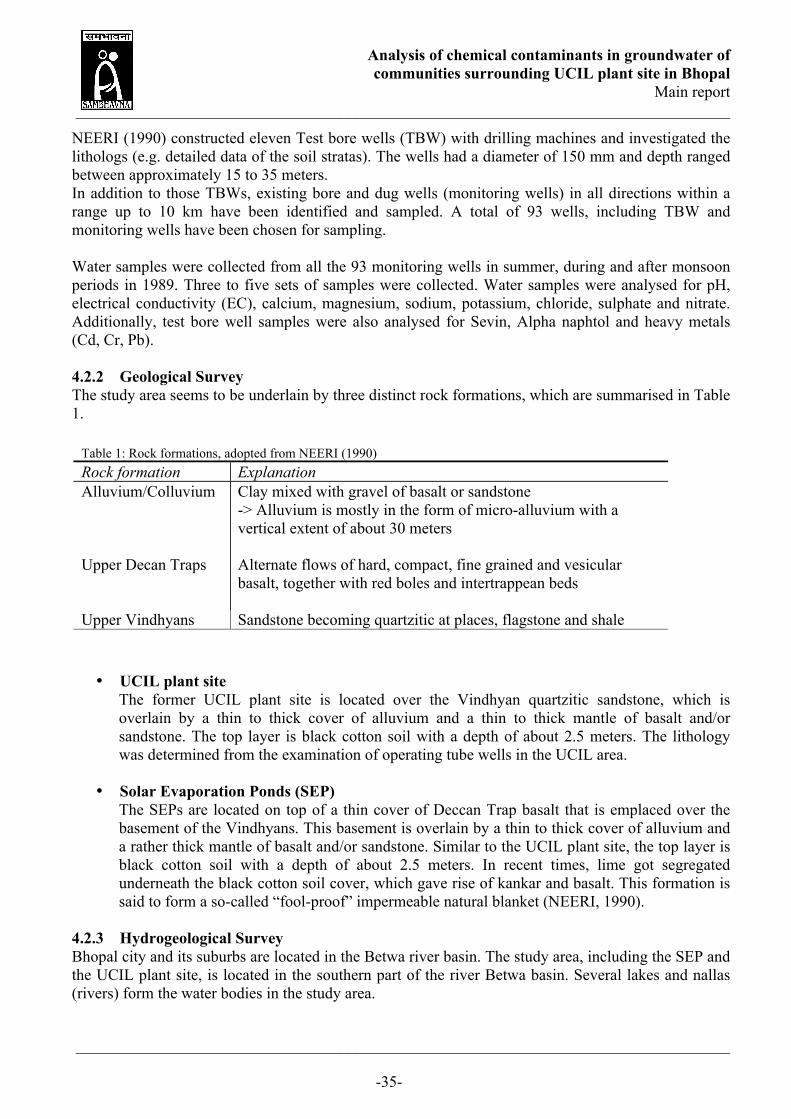
NEERI (1990) constructed eleven Test bore wells (TBW) with drilling machines and investigated the lithologs (e.g. detailed data of the soil stratas). The wells had a diameter of 150 mm and depth ranged between approximately 15 to 35 meters. In addition to those TBWs, existing bore and dug wells (monitoring wells) in all directions within a range up to 10 km have been identified and sampled. A total of 93 wells, including TBW and monitoring wells have been chosen for sampling. Water samples were collected from all the 93 monitoring wells in summer, during and after monsoon periods in 1989. Three to five sets of samples were collected. Water samples were analysed for pH, electrical conductivity (EC), calcium, magnesium, sodium, potassium, chloride, sulphate and nitrate. Additionally, test bore well samples were also analysed for Sevin, Alpha naphtol and heavy metals (Cd, Cr, Pb). 4.2.2 Geological Survey The study area seems to be underlain by three distinct rock formations, which are summarised in Table 1.
• UCIL plant site The former UCIL plant site is located over the Vindhyan quartzitic sandstone, which is overlain by a thin to thick cover of alluvium and a thin to thick mantle of basalt and/or sandstone. The top layer is black cotton soil with a depth of about 2.5 meters. The lithology was determined from the examination of operating tube wells in the UCIL area.
• Solar Evaporation Ponds (SEP) The SEPs are located on top of a thin cover of Deccan Trap basalt that is emplaced over the basement of the Vindhyans. This basement is overlain by a thin to thick cover of alluvium and a rather thick mantle of basalt and/or sandstone. Similar to the UCIL plant site, the top layer is black cotton soil with a depth of about 2.5 meters. In recent times, lime got segregated underneath the black cotton soil cover, which gave rise of kankar and basalt. This formation is said to form a so-called “fool-proof” impermeable natural blanket (NEERI, 1990).
4.2.3 Hydrogeological Survey Bhopal city and its suburbs are located in the Betwa river basin. The study area, including the SEP and the UCIL plant site, is located in the southern part of the river Betwa basin. Several lakes and nallas (rivers) form the water bodies in the study area.
Table 1: Rock formations, adopted from NEERI (1990) Rock formation Explanation Alluvium/Colluvium Clay mixed with gravel of basalt or sandstone
-> Alluvium is mostly in the form of micro-alluvium with a vertical extent of about 30 meters
Upper Decan Traps Alternate flows of hard, compact, fine grained and vesicular basalt, together with red boles and intertrappean beds
Upper Vindhyans Sandstone becoming quartzitic at places, flagstone and shale

Analysis of chemical contaminants in groundwater of communities surrounding UCIL plant site in Bhopal
Main report __________________________________________________________________________________
__________________________________________________________________________________
-36-
• Surface water The Upper and Lower lakes are the prominent water bodies in Bhopal. All other lakes are small in size and reported to be particularly dry in summer season. Upper lake is located in the southwest of Bhopal and is the only major source of water to the city. The level of the lake is approximately 510 meters above sea level (asl) and 24 meters above the level of the UCIL plant side. Lower lake, which is located approximately one kilometre east of Upper lake, is shallow (maximum depth of 12 meters) and receives domestic sewage and runoff water from nearby areas. The level of the lake is 503 meters asl and about 15 meters above the UCIL plant site.
The two main rivers in Bhopal are Patra and Chola Nalla, which join 2 km east of the UCIL plant site near Semarakalan and are then named Patra Nadi. Patra Nadi finally joins Halal river about 12 kms north of UCIL. Halal river itself is a tributary of river Betwa. During the monsoon, both Patra and Chola Nalla flow to their full capacity whereas, in the dry season, their depth hardly exceeds a meter. The overflow from Lower Lake gives rise to Patra Nalla in the south, which flows in a northerly direction along the railway tracks. As Patra Nalla carries the overflow from Lower Lake, its flow is not significantly reduced in summer. Chola Nalla originates 5 km west of the UCIL plant site and flows then east-southeasterly along the boundary of the UCIL plant site. The runoff water from UCIL plant side joins Chola Nalla. Many other small nallas flow through the city, but they are almost dry throughout the year, except for a few days during the monsoon season. The nalla near SEP is hardly visible except for a small stretch. This nalla joins with Patra Nadi at about 5 km north of SEP. Since both Upper and Lower lakes in the city are at higher elevation (15 to 24 meters, respectively) compared to the UCIL area and the two main Nallas, any polluted water from the Nallas or UCIL plant site cannot reach the lakes. Additionally, Chola Nalla acts as a barrier between UCIL area and the lakes. NEERI (1990) therefore rules out the contamination of the lake waters by waste disposals activities of UCIL at SEP.
• Groundwater
The groundwater flow is locally towards the Nalla and generally towards the river Betwa, following the surface drainage of the basin. Generally, the groundwater flows in a northerly to north-easterly direction, with local fluctuations in the gradient and direction. Two types of aquifers were encountered in the study area: A shallow (unconfined) aquifer and a deep (semi-confined to confined) aquifer. The shallow aquifers are located above the first confining layer of massive Basalt, normally encountered about a few to 30 meters below ground level (BGL). The deep aquifers occur below the first confining layer of the massive Basalt. Depending on their relation to the water table body, they occur under semi-confined or confined conditions.
• Water table
Both Patra and Chola Nalla are influent after monsoon and are recharged by the groundwater table. With recession of the monsoon, the nallas become effluent, hence getting discharged from the water table.

Analysis of chemical contaminants in groundwater of communities surrounding UCIL plant site in Bhopal
Main report __________________________________________________________________________________
__________________________________________________________________________________
-37-
The altitude (above sea level) of the water table ranges from 485-500 m with a northerly gradient of 0.6 m/km. The depth of water in most of the dug wells within the area ranges from 3 to 9 meters BGL. In Basalts, the depth of water level varies from approximately 3 to 14 m BGL, whereas in Vindhyans, it varies from 2.5 to 9.5 m BGL.
• Hydrogeological map of study area
The hydrogeological map shows the local and general groundwater flow in the area around the SEP and UCIL plant site (figure 56). As an orientation aid, main streets of Bhopal city and railway tracks are marked on the map. The hydrogeological map in the NEERI report (1990) is hand drawn and was therefore adopted for this report. NEERI (1990) found that the general groundwater flow is in a northerly to north-easterly direction, towards the river Betwa as can be seen in Figure 55.
4.2.4 Investigation of Solar Evaporation Pond (SEP)
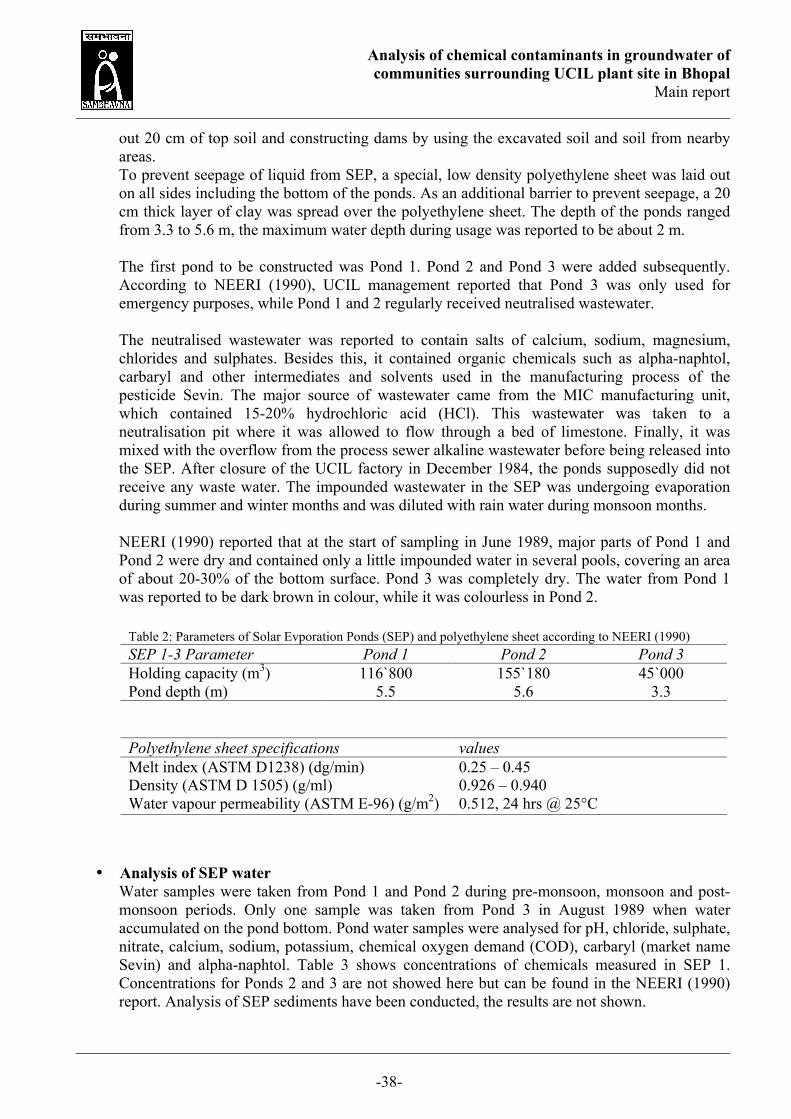
• General information Three Solar Evaporation Ponds (SEP) covering an area of 14 hectares were built for waste water dumping, resulting from UCILs activities (see table 2). The ponds were built by taking
Figure 55: Groundwater Flow, adopted from NEERI (1990)
Analysis of chemical contaminants in groundwater of communities surrounding UCIL plant site in Bhopal
Main report __________________________________________________________________________________
__________________________________________________________________________________
-38-
out 20 cm of top soil and constructing dams by using the excavated soil and soil from nearby areas. To prevent seepage of liquid from SEP, a special, low density polyethylene sheet was laid out on all sides including the bottom of the ponds. As an additional barrier to prevent seepage, a 20 cm thick layer of clay was spread over the polyethylene sheet. The depth of the ponds ranged from 3.3 to 5.6 m, the maximum water depth during usage was reported to be about 2 m. The first pond to be constructed was Pond 1. Pond 2 and Pond 3 were added subsequently. According to NEERI (1990), UCIL management reported that Pond 3 was only used for emergency purposes, while Pond 1 and 2 regularly received neutralised wastewater. The neutralised wastewater was reported to contain salts of calcium, sodium, magnesium, chlorides and sulphates. Besides this, it contained organic chemicals such as alpha-naphtol, carbaryl and other intermediates and solvents used in the manufacturing process of the pesticide Sevin. The major source of wastewater came from the MIC manufacturing unit, which contained 15-20% hydrochloric acid (HCl). This wastewater was taken to a neutralisation pit where it was allowed to flow through a bed of limestone. Finally, it was mixed with the overflow from the process sewer alkaline wastewater before being released into the SEP. After closure of the UCIL factory in December 1984, the ponds supposedly did not receive any waste water. The impounded wastewater in the SEP was undergoing evaporation during summer and winter months and was diluted with rain water during monsoon months. NEERI (1990) reported that at the start of sampling in June 1989, major parts of Pond 1 and Pond 2 were dry and contained only a little impounded water in several pools, covering an area of about 20-30% of the bottom surface. Pond 3 was completely dry. The water from Pond 1 was reported to be dark brown in colour, while it was colourless in Pond 2.
• Analysis of SEP water Water samples were taken from Pond 1 and Pond 2 during pre-monsoon, monsoon and post-monsoon periods. Only one sample was taken from Pond 3 in August 1989 when water accumulated on the pond bottom. Pond water samples were analysed for pH, chloride, sulphate, nitrate, calcium, sodium, potassium, chemical oxygen demand (COD), carbaryl (market name Sevin) and alpha-naphtol. Table 3 shows concentrations of chemicals measured in SEP 1. Concentrations for Ponds 2 and 3 are not showed here but can be found in the NEERI (1990) report. Analysis of SEP sediments have been conducted, the results are not shown.
Table 2: Parameters of Solar Evporation Ponds (SEP) and polyethylene sheet according to NEERI (1990) SEP 1-3 Parameter Pond 1 Pond 2 Pond 3 Holding capacity (m3) 116`800 155`180 45`000 Pond depth (m) 5.5 5.6 3.3 Polyethylene sheet specifications values Melt index (ASTM D1238) (dg/min) 0.25 – 0.45 Density (ASTM D 1505) (g/ml) 0.926 – 0.940 Water vapour permeability (ASTM E-96) (g/m2) 0.512, 24 hrs @ 25°C
Analysis of chemical contaminants in groundwater of communities surrounding UCIL plant site in Bhopal
Main report __________________________________________________________________________________
__________________________________________________________________________________
-39-
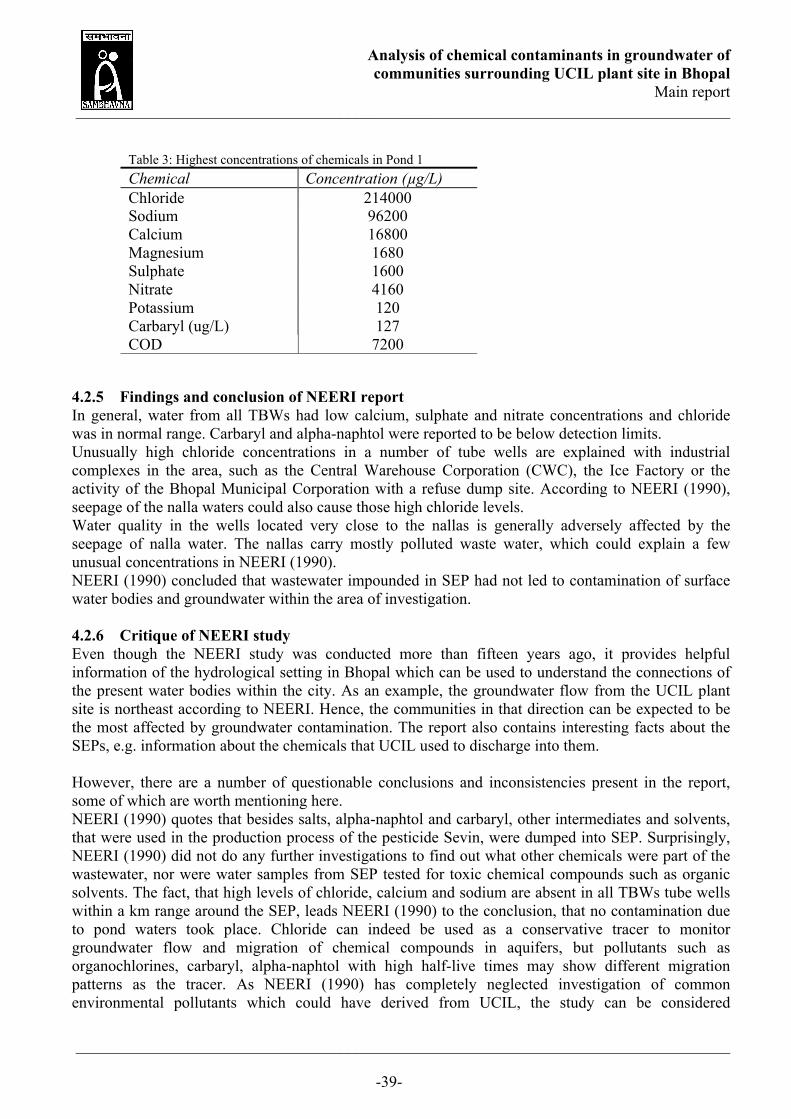
4.2.5 Findings and conclusion of NEERI report In general, water from all TBWs had low calcium, sulphate and nitrate concentrations and chloride was in normal range. Carbaryl and alpha-naphtol were reported to be below detection limits. Unusually high chloride concentrations in a number of tube wells are explained with industrial complexes in the area, such as the Central Warehouse Corporation (CWC), the Ice Factory or the activity of the Bhopal Municipal Corporation with a refuse dump site. According to NEERI (1990), seepage of the nalla waters could also cause those high chloride levels. Water quality in the wells located very close to the nallas is generally adversely affected by the seepage of nalla water. The nallas carry mostly polluted waste water, which could explain a few unusual concentrations in NEERI (1990). NEERI (1990) concluded that wastewater impounded in SEP had not led to contamination of surface water bodies and groundwater within the area of investigation. 4.2.6 Critique of NEERI study Even though the NEERI study was conducted more than fifteen years ago, it provides helpful information of the hydrological setting in Bhopal which can be used to understand the connections of the present water bodies within the city. As an example, the groundwater flow from the UCIL plant site is northeast according to NEERI. Hence, the communities in that direction can be expected to be the most affected by groundwater contamination. The report also contains interesting facts about the SEPs, e.g. information about the chemicals that UCIL used to discharge into them. However, there are a number of questionable conclusions and inconsistencies present in the report, some of which are worth mentioning here. NEERI (1990) quotes that besides salts, alpha-naphtol and carbaryl, other intermediates and solvents, that were used in the production process of the pesticide Sevin, were dumped into SEP. Surprisingly, NEERI (1990) did not do any further investigations to find out what other chemicals were part of the wastewater, nor were water samples from SEP tested for toxic chemical compounds such as organic solvents. The fact, that high levels of chloride, calcium and sodium are absent in all TBWs tube wells within a km range around the SEP, leads NEERI (1990) to the conclusion, that no contamination due to pond waters took place. Chloride can indeed be used as a conservative tracer to monitor groundwater flow and migration of chemical compounds in aquifers, but pollutants such as organochlorines, carbaryl, alpha-naphtol with high half-live times may show different migration patterns as the tracer. As NEERI (1990) has completely neglected investigation of common environmental pollutants which could have derived from UCIL, the study can be considered
Table 3: Highest concentrations of chemicals in Pond 1 Chemical Concentration (µg/L) Chloride 214000 Sodium 96200 Calcium 16800 Magnesium 1680 Sulphate 1600 Nitrate 4160 Potassium 120 Carbaryl (ug/L) 127 COD 7200

Analysis of chemical contaminants in groundwater of communities surrounding UCIL plant site in Bhopal
Main report __________________________________________________________________________________
__________________________________________________________________________________
-40-
incomplete and groundwater contamination due to leakage of SEP at the time the study was conducted, can therefore not be ruled out. It is remarkable that chloride, calcium, magnesium and sulphates which are naturally occurring substances in water, are mentioned as contaminants alongside carbaryl and alpha-naphtol in the NEERI report. Analysis of the groundwater samples was described to be conducted “as per standard methods for the analysis of water and wastewater” without further explanation of the methods used or quotation of any references. It can generally be said that the NEERI report performs poorly if it comes to a description of methodology. 4.3 Greenpeace studies Greenpeace conducted a number of studies in order to identify the chemical pollutants present on the UCIL plant site and the surrounding area. The first Greenpeace report was conducted in 1999 and focuses primarily on the contamination of soil and drinking water. The second report published in 2002 focuses on the solar evaporation pond (SEP) and on the chemical stockpiles that were at that time still stored in buildings on the plant site. The last report published by Greenpeace on Bhopal is a short technical note discussing results from analysis of a few water samples that have been collected south of the UCIL plant site. The above mentioned studies will only be briefly summarised as they are all available online. The focus of the summary is on the chemicals that have been found in water, soil, sediments and stockpiles in order to identify target chemicals for our sampling campaign. 4.3.1 Greenpeace, 1999, The Bhopal Legacy, “Toxic contaminants at the former Union
Carbide factory site, Bhopal, India: 15 years after the Bhopal accident” Content The report begins by providing information about the production process of methyl isocyanate (MIC), phosgene and the pesticide Sevin (Carbaryl) as it was performed at the Bhopal plant, as well as unwanted by-products that emerged in the manufacturing of Sevin. Subsequently, the sampling program is described, followed by the results of the laboratory analysis. The authors then propose a rough guideline of how a decontamination and cleanup of the site could be undertaken. An extensive appendix provides a description of materials and methods used in the study, a list of organic compounds identified in soil and water samples. Finally, a toxicological profile for some key organic compounds as well as for heavy metals is provided. Results Greenpeace took a total of thirty-one water and soil samples on the plant site and in adjacent communities. Soil samples were taken from several locations within the plant site including the formulation plant, the incinerator and neutralisation pit. Soil samples were also taken from the SEP. Water samples were taken from hand pumps located southerly (J.P. Nagar) and northerly (Nawab Colony, Atal Ayub Nagar, Shivshakti Nagar) of UCIL plant site as well as from a borehole located on the plant site. Soil samples collected on the plant site and in the vicinity of the formulation unit showed the presence of heavy metals and chlorinated organic compounds. Elevated levels of mercury, chromium, copper, nickel and organochlorines such as hexachloroethane, hexachlorobutadiene (HCBD),
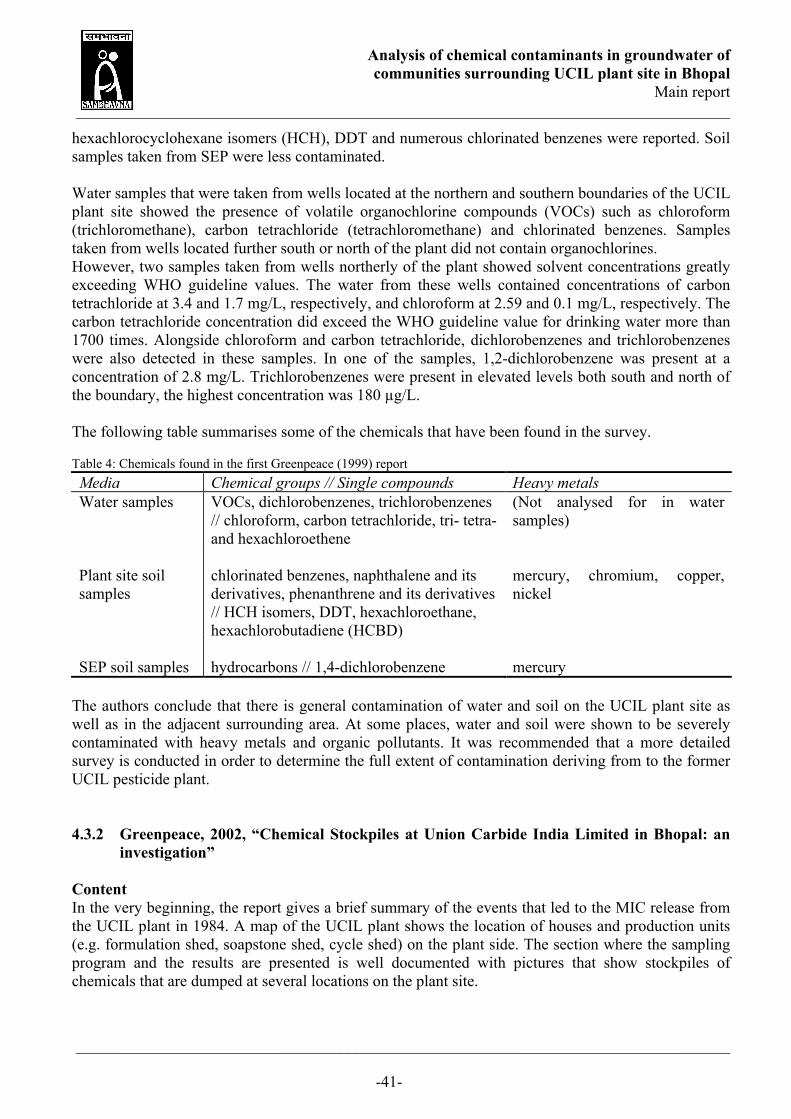
Analysis of chemical contaminants in groundwater of communities surrounding UCIL plant site in Bhopal
Main report __________________________________________________________________________________
__________________________________________________________________________________
-41-
hexachlorocyclohexane isomers (HCH), DDT and numerous chlorinated benzenes were reported. Soil samples taken from SEP were less contaminated. Water samples that were taken from wells located at the northern and southern boundaries of the UCIL plant site showed the presence of volatile organochlorine compounds (VOCs) such as chloroform (trichloromethane), carbon tetrachloride (tetrachloromethane) and chlorinated benzenes. Samples taken from wells located further south or north of the plant did not contain organochlorines. However, two samples taken from wells northerly of the plant showed solvent concentrations greatly exceeding WHO guideline values. The water from these wells contained concentrations of carbon tetrachloride at 3.4 and 1.7 mg/L, respectively, and chloroform at 2.59 and 0.1 mg/L, respectively. The carbon tetrachloride concentration did exceed the WHO guideline value for drinking water more than 1700 times. Alongside chloroform and carbon tetrachloride, dichlorobenzenes and trichlorobenzenes were also detected in these samples. In one of the samples, 1,2-dichlorobenzene was present at a concentration of 2.8 mg/L. Trichlorobenzenes were present in elevated levels both south and north of the boundary, the highest concentration was 180 µg/L. The following table summarises some of the chemicals that have been found in the survey. Table 4: Chemicals found in the first Greenpeace (1999) report Media Chemical groups // Single compounds Heavy metals Water samples VOCs, dichlorobenzenes, trichlorobenzenes
// chloroform, carbon tetrachloride, tri- tetra- and hexachloroethene
(Not analysed for in water samples)
Plant site soil samples
chlorinated benzenes, naphthalene and its derivatives, phenanthrene and its derivatives // HCH isomers, DDT, hexachloroethane, hexachlorobutadiene (HCBD)
mercury, chromium, copper, nickel
SEP soil samples
hydrocarbons // 1,4-dichlorobenzene
mercury
The authors conclude that there is general contamination of water and soil on the UCIL plant site as well as in the adjacent surrounding area. At some places, water and soil were shown to be severely contaminated with heavy metals and organic pollutants. It was recommended that a more detailed survey is conducted in order to determine the full extent of contamination deriving from to the former UCIL pesticide plant. 4.3.2 Greenpeace, 2002, “Chemical Stockpiles at Union Carbide India Limited in Bhopal: an
investigation” Content In the very beginning, the report gives a brief summary of the events that led to the MIC release from the UCIL plant in 1984. A map of the UCIL plant shows the location of houses and production units (e.g. formulation shed, soapstone shed, cycle shed) on the plant side. The section where the sampling program and the results are presented is well documented with pictures that show stockpiles of chemicals that are dumped at several locations on the plant site.
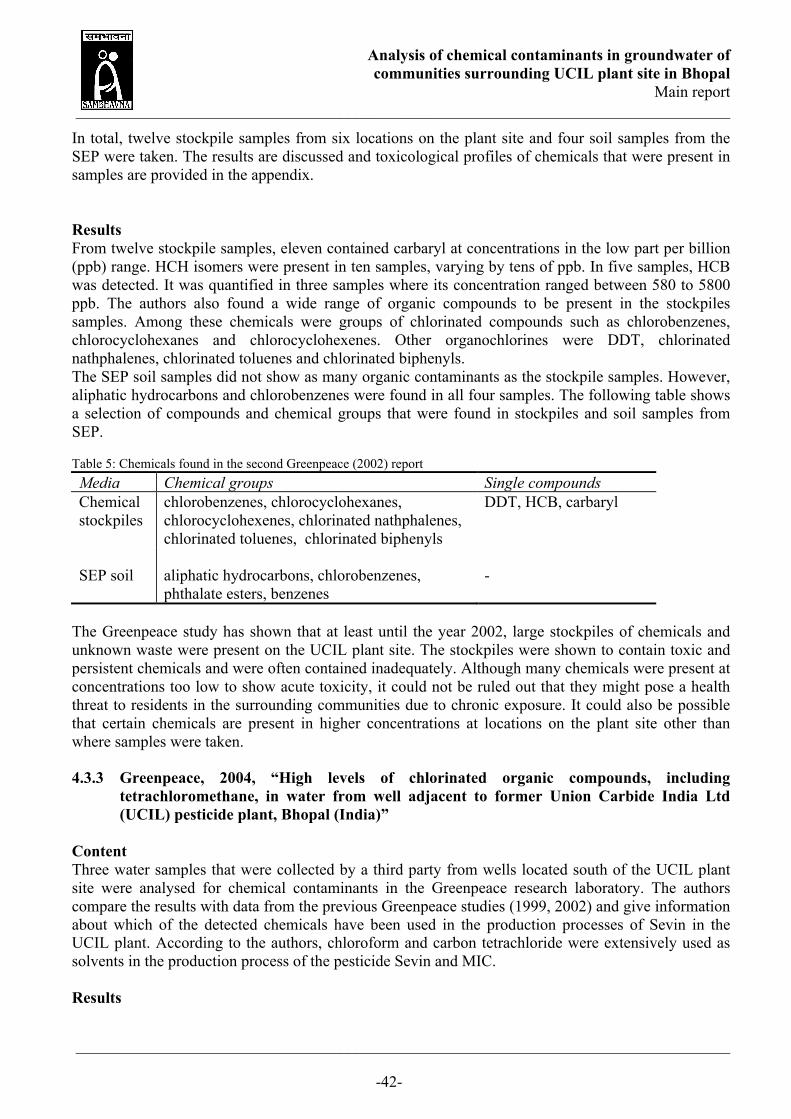
Analysis of chemical contaminants in groundwater of communities surrounding UCIL plant site in Bhopal
Main report __________________________________________________________________________________
__________________________________________________________________________________
-42-
In total, twelve stockpile samples from six locations on the plant site and four soil samples from the SEP were taken. The results are discussed and toxicological profiles of chemicals that were present in samples are provided in the appendix. Results From twelve stockpile samples, eleven contained carbaryl at concentrations in the low part per billion (ppb) range. HCH isomers were present in ten samples, varying by tens of ppb. In five samples, HCB was detected. It was quantified in three samples where its concentration ranged between 580 to 5800 ppb. The authors also found a wide range of organic compounds to be present in the stockpiles samples. Among these chemicals were groups of chlorinated compounds such as chlorobenzenes, chlorocyclohexanes and chlorocyclohexenes. Other organochlorines were DDT, chlorinated nathphalenes, chlorinated toluenes and chlorinated biphenyls. The SEP soil samples did not show as many organic contaminants as the stockpile samples. However, aliphatic hydrocarbons and chlorobenzenes were found in all four samples. The following table shows a selection of compounds and chemical groups that were found in stockpiles and soil samples from SEP. Table 5: Chemicals found in the second Greenpeace (2002) report Media Chemical groups Single compounds Chemical stockpiles
chlorobenzenes, chlorocyclohexanes, chlorocyclohexenes, chlorinated nathphalenes, chlorinated toluenes, chlorinated biphenyls
DDT, HCB, carbaryl
SEP soil
aliphatic hydrocarbons, chlorobenzenes, phthalate esters, benzenes
-
The Greenpeace study has shown that at least until the year 2002, large stockpiles of chemicals and unknown waste were present on the UCIL plant site. The stockpiles were shown to contain toxic and persistent chemicals and were often contained inadequately. Although many chemicals were present at concentrations too low to show acute toxicity, it could not be ruled out that they might pose a health threat to residents in the surrounding communities due to chronic exposure. It could also be possible that certain chemicals are present in higher concentrations at locations on the plant site other than where samples were taken. 4.3.3 Greenpeace, 2004, “High levels of chlorinated organic compounds, including
tetrachloromethane, in water from well adjacent to former Union Carbide India Ltd (UCIL) pesticide plant, Bhopal (India)”
Content Three water samples that were collected by a third party from wells located south of the UCIL plant site were analysed for chemical contaminants in the Greenpeace research laboratory. The authors compare the results with data from the previous Greenpeace studies (1999, 2002) and give information about which of the detected chemicals have been used in the production processes of Sevin in the UCIL plant. According to the authors, chloroform and carbon tetrachloride were extensively used as solvents in the production process of the pesticide Sevin and MIC. Results

Analysis of chemical contaminants in groundwater of communities surrounding UCIL plant site in Bhopal
Main report __________________________________________________________________________________
__________________________________________________________________________________
-43-
The authors report the presence of carbon tetrachloride, chloroform and various chlorinated benzenes in the well water. Carbon tetrachloride greatly exceeded WHO guideline values, showing a concentration between 2‐3ppm. Additionally, elevated levels of chloroform and 1,2,4‐trichlorobenzene were found. All of these chemicals were also detected in the earlier Greenpeace studies and support the findings of those previous publications. 4.4 Srishti, 2002, “A Report on Human and Environmental Chemical
Contamination around the Bhopal disaster site” Content The Srishti report provides an assessment of water, soil, vegetable and breast milk sample analysis with the objective to investigate how chemical contaminants are transferred from the environment into humans. Alongside the findings from the sampling campaign, the authors also discuss various tools and issues such as the environmental impact assessment (EIA), toxics release inventories (TRI), siting processes for industries and handling/disposal of hazardous waste, which are all necessary to ensure more environmentally sound industrial activities, i.e. production. The focus is placed on the Indian legislation; the implementation of the above mentioned tools in India are compared with their implementation internationally. The report also includes information on which chemicals have been used at UCIL pesticide plant and on the quantities of chemicals that have been stored or dumped on site. Results The study was conducted in the communities that are located in the vicinity of the UCIL plant site. Samples have been taken from J.P. Nagar, Kanchi, Nawab Colony, Atal Ayub Nagar, Annu Nagar, Arif Nagar, Ramgarh Colony and from factory premises (Srishti 2002). A total of 14 soil samples (5 from the plant site, 9 from residential areas), 11 water samples (hand pumps in residential areas, plant site, pond near SEP), 11 breast milk samples and an unknown number of food samples were taken and analysed. Srishti (2002) reported that heavy metals and organochlorine compounds were present in all of the investigated media, i.e. soil, groundwater, vegetables and breast milk. Table 6 shows a selection of chemicals and heavy metals found in the four media at the sampling sites. Table 6: Chemicals found in the Srishti (2002) report Media Chemicals Heavy metals Groundwater Dichloromethane, chloroform Nickel Soil
Chloroform, HCH isomers, VOCs
Nickel, mercury, chromium
Vegetables
Chloroform
Nickel, chromium, mercury
Breast milk
Chloroform, HCH isomers, VOCs
Nickel, mercury, lead
According to the authors, there are no other chemical industries present in a radius of 3-5 km from UCIL which have used the same compounds as have been used by UCIL. The results from the study

Analysis of chemical contaminants in groundwater of communities surrounding UCIL plant site in Bhopal
Main report __________________________________________________________________________________
__________________________________________________________________________________
-44-
clearly indicate that the UCIL plant site is still a source for chemical contaminants and that the chemicals are mobile in the underground. 4.5 Extraction of information from literature review The literature review revealed several key points that can be used for setting up a water sampling campaign. The NEERI (1990) report suggests that the groundwater flow is in a north-easterly direction and thus, chemicals leaching into the ground at the UCIL plant site are expected to be transported mainly in this direction. Groundwater samples are therefore preferentially taken from wells in the area and the communities located northeast of the plant site. The Greenpeace studies (1999, 2002, 2004) and the Srishti report (2002) provide useful information for selecting target contaminants which are present in soil, water, food and even breast milk. There is a vast variety of toxic chemicals such as organochlorine compounds, heavy metals and various pesticide residues present in the groundwater. Of all these compounds, chloroform, carbon tetrachloride and the dichloro- and trichlorobenzenes were found to be present at the highest concentrations and could thus be identified as target chemicals. Our sampling campaign has been conducted in light of this information and the sampling sites as well as the analysis method have been chosen accordingly.

Analysis of chemical contaminants in groundwater of communities surrounding UCIL plant site in Bhopal
Main report __________________________________________________________________________________
__________________________________________________________________________________
-45-
- Part V: Water sampling campaign
-
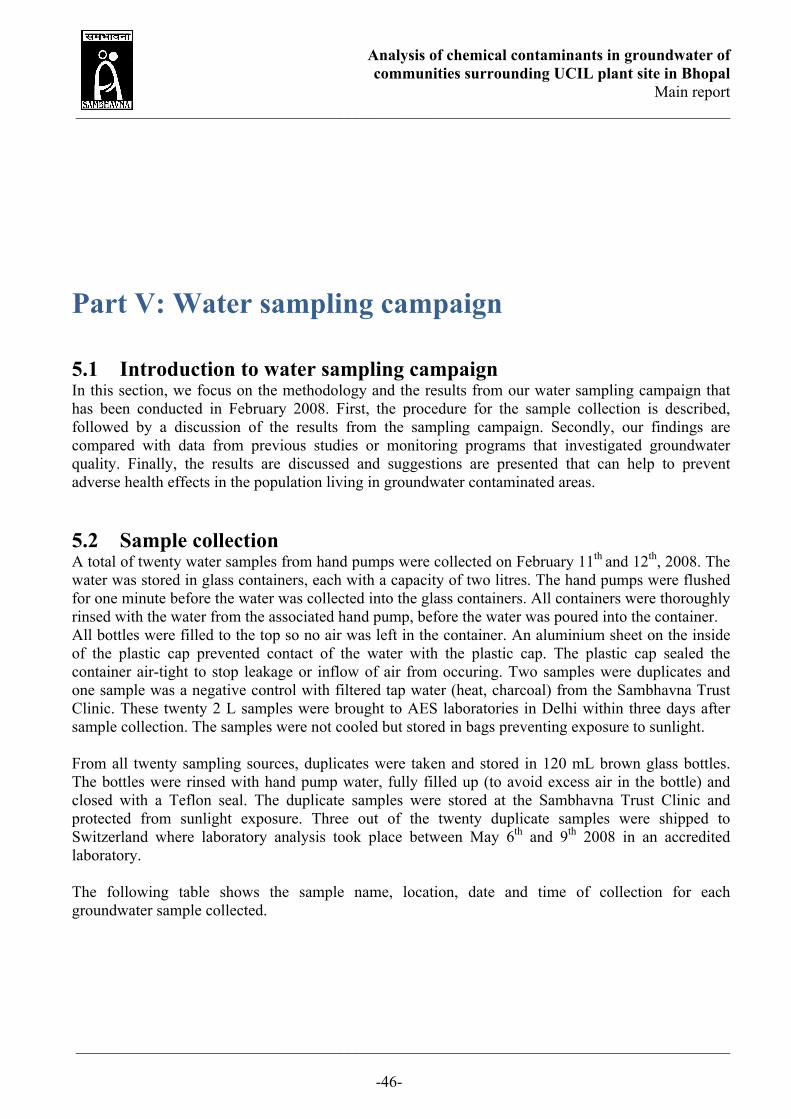
Analysis of chemical contaminants in groundwater of communities surrounding UCIL plant site in Bhopal
Main report __________________________________________________________________________________
__________________________________________________________________________________
-46-
Part V: Water sampling campaign 5.1 Introduction to water sampling campaign In this section, we focus on the methodology and the results from our water sampling campaign that has been conducted in February 2008. First, the procedure for the sample collection is described, followed by a discussion of the results from the sampling campaign. Secondly, our findings are compared with data from previous studies or monitoring programs that investigated groundwater quality. Finally, the results are discussed and suggestions are presented that can help to prevent adverse health effects in the population living in groundwater contaminated areas. 5.2 Sample collection A total of twenty water samples from hand pumps were collected on February 11th and 12th, 2008. The water was stored in glass containers, each with a capacity of two litres. The hand pumps were flushed for one minute before the water was collected into the glass containers. All containers were thoroughly rinsed with the water from the associated hand pump, before the water was poured into the container. All bottles were filled to the top so no air was left in the container. An aluminium sheet on the inside of the plastic cap prevented contact of the water with the plastic cap. The plastic cap sealed the container air-tight to stop leakage or inflow of air from occuring. Two samples were duplicates and one sample was a negative control with filtered tap water (heat, charcoal) from the Sambhavna Trust Clinic. These twenty 2 L samples were brought to AES laboratories in Delhi within three days after sample collection. The samples were not cooled but stored in bags preventing exposure to sunlight. From all twenty sampling sources, duplicates were taken and stored in 120 mL brown glass bottles. The bottles were rinsed with hand pump water, fully filled up (to avoid excess air in the bottle) and closed with a Teflon seal. The duplicate samples were stored at the Sambhavna Trust Clinic and protected from sunlight exposure. Three out of the twenty duplicate samples were shipped to Switzerland where laboratory analysis took place between May 6th and 9th 2008 in an accredited laboratory. The following table shows the sample name, location, date and time of collection for each groundwater sample collected.

Analysis of chemical contaminants in groundwater of communities surrounding UCIL plant site in Bhopal
Main report __________________________________________________________________________________
__________________________________________________________________________________
-47-
Table 7: Identification of water samples
Location of water samples
No.
Community
H/P ID according to Community Report
Date
Time
WS 1001 Prem Nagar Pr 9 11.02.2008 10.30 a.m. WS 1002 Prem Nagar Pr 2 11.02.2008 10.45 a.m. WS 1003 Prem Nagar Pr 7 11.02.2008 11.00 a.m. WS 1004 Prem Nagar Pr 19 11.02.2008 11.40 a.m. WS 1005 Prem Nagar Pr 8 11.02.2008 11.50 a.m. WS 1006 Preet Nagar Pe 12 12.02.2008 10.45 a.m. WS 1007+ Preet Nagar Pe 10 12.02.2008 11.00 a.m. WS 1008+ Preet Nagar Pe 10 12.02.2008 11.00 a.m. WS 1009+ Preet Nagar Pe 13 12.02.2008 11.25 a.m. WS 1010+ Preet Nagar Pe 13 12.02.2008 11.25 a.m. WS 1011 Preet Nagar Pe 14 12.02.2008 12.00 a.m. WS 1012 Preet Nagar Pe 11 12.02.2008 12.20 p.m. WS 1013 Chandbaadi Ch 1 12.02.2008 12.40 p.m. WS 1014 Annu Nagar Au 3 12.02.2008 13.15 p.m. WS 1015 Blue Moon Colony BM 3 12.02.2008 14.10 p.m. WS 1016 Blue Moon Colony BM 5 12.02.2008 14.30 p.m. WS 1017 Annu Nagar Au 1 12.02.2008 14.55 p.m. WS 1018 Sambhavna Trust Clinic - 13.02.2008 - WS 1019 Atal Ayub Nagar AA 2 12.02.2008 15.30 p.m. WS 1020 Atal Ayub Nagar AA 1 12.02.2008 15.45 p.m.
+ duplicates Figure 56-60 provide a visual description of the sampling procedure and the amount of particles present in some of the water samples.
Analysis of chemical contaminants in groundwater of communities surrounding UCIL plant site in Bhopal
Main report __________________________________________________________________________________
__________________________________________________________________________________
-48-
Figure 56: Sample collection
Figure 57: Muddy water from one of the hand pumps
Figure 58: Muddy water from another well
Figure 59: Clear groundwater sample
5.3 Results of groundwater sample analysis The collected water samples were analysed in a laboratory in Delhi, India, as well as in an accredited laboratory in Switzerland. The results are supplemented by analysis of a single water sample that was

Analysis of chemical contaminants in groundwater of communities surrounding UCIL plant site in Bhopal
Main report __________________________________________________________________________________
__________________________________________________________________________________
-49-
collected, by The Bhopal Medical Appeal (BMA), with subsequent analysis in an accredited laboratory in the UK. 5.3.1 Water sample analysis at AES Laboratories in Delhi, India The analysis of the water samples was performed by AES Laboratories in Delhi. The samples were analysed for the following chemicals:
Isomers of Hexachlorocyclohexane (alpha-, beta-, gamma- [Lindane], delta-, epsilon-HCH) 1,2-Dichlorobenzene 1,4-Dichlorobenzene 1,2,3-Trichlorobenzene 1,2,4-Trichlorobenzene Carbon tetrachloride Carbaryl (Sevin) Aldrin Dieldrin
The laboratory performed the analyses according to the EPA Methods 8260C for volatile organic compounds using gas chromatography/mass spectrometry (GC/MS) and 8270C for semi-volatile organic compounds using gas chromatography/mass spectrometry (GC/MS). Surprisingly, the chemical concentrations were reported to be below detection limit in all analyzed samples and for all chemicals tested. Since some of the water samples clearly smelled of solvents, we question the results of the lab. The glass containers were sealed properly and no leakage during transport was observed. Unfortunately we did not spike samples with a known amount of a chemical to ensure validity of the analysis, but since another laboratory in Switzerland was able to measure carbon tetrachloride at a concentration of mg/L (see next section), we assume that the analysis by AES Laboratories may not have been conducted properly. This could be either explained by technical problems or it could well be that the laboratory did not take the risk to pass on the results, because of the ongoing political controversy around the Bhopal disaster. 5.3.2 Water sample analysis at an accredited Swiss laboratory Three water samples from hand pumps were brought to a Swiss lab for analysis. Two samples were from hand pumps located in Atal Ayub Nagar and one sample from a hand pump located in Preet Nagar. The laboratory analysed the samples for 26 chlorinated pesticides and 62 halogenated organic compounds using the EPA method 524.2 for volatile organic compounds. Chlorinated organic compounds were found in two water samples from Atal Ayub Nagar, but no pesticides were present in the samples. All chemicals tested for were found to be below detection limits in the sample from Preet Nagar. The results of the analysis are shown in Table 8. Table 8: Chemical concentration in µg/L in different water samples Sample No. Chloroform Carbon
tetrachloride 1,2,3-Trichlorobenzene
Dichloromethane
WS 1009, H/P Pe 13 (Preet Nagar) - - - -
WS 1019, H/P AA2 (Atal Ayub Nagar)
259
3790
17
19
17 -

Analysis of chemical contaminants in groundwater of communities surrounding UCIL plant site in Bhopal
Main report __________________________________________________________________________________
__________________________________________________________________________________
-50-
WS 1020, H/P AA1 (Atal Ayub Nagar)
148 1790
The following tables provide further information about the three wells from which samples were drawn and analysed in the Swiss lab. The information includes date, time and location of the sampling, hand pump ID according to the Community Reports and data on the hand pump which has been collected using a questionnaire sheet (see Part VІІ: Appendix ). The results are also compared to WHO or EPA guideline values. The ratio was calculated from the lower of the two guideline values. Table 9: Information about water Sample WS 1009
Sample No.: WS 1009 Sampling information Community Preet Nagar
Hand pump ID H/P Pe 13
Date of Collection 12.2.08
Time at sample collection 11.25 a.m.
Hand pump information Installation 2000
Current status Working and in use
Depth ~ 70-80 ft Water quality Muddy water and petrol-like smell even after extensive flushing; very muddy in monsoon season Water availability Continuous supply, in summer only 1-2 buckets/day Estimated # of people using the source 5 families (27 people) and one family (4 people) that purchases water
Water used for drinking? Yes
Additional information Private hand pump. Sampling results All chemicals analysed for below detection limits.

Analysis of chemical contaminants in groundwater of communities surrounding UCIL plant site in Bhopal
Main report __________________________________________________________________________________
__________________________________________________________________________________
-51-
Table 10: Information about water Sample WS 1019 Sample No.: WS 1019 Sampling information Community Atal Ayub Nagar
Hand pump ID H/P AA 2
Date of Collection 12.2.08
Time at collection 3.30 p.m.
Hand pump information Installation 2005
Current status Working and in use
Depth unknown Water quality Clear, bad smell Water availability Continuous supply Estimated # of people using the source Many people
Water used for drinking? Yes
Additional information Governmental hand pump. Sampling results
Guideline values [ug/L] Chemical Concentration [ug/L] WHO EPA
Concentration/ EPA or WHO Guideline ratio
Dichloromethane (Methylene chloride) 19 20 5 ~ 1
Trichloromethane (Chloroform) 259 300 70 ~ 3.5
Tetrachloromethane (Carbon tetrachloride) 3790 2 5 ~ 1900
1,2,3-Trichlorobenzene 17 20 - ~ 0.85 X

Analysis of chemical contaminants in groundwater of communities surrounding UCIL plant site in Bhopal
Main report __________________________________________________________________________________
__________________________________________________________________________________
-52-
Table 11: Information about water Sample WS 1020 Sample No.: WS 1020 Sampling information Community Atal Ayub Nagar
Hand pump ID H/P AA 1
Date of Collection 11.2.08
Time at collection 3.45 p.m.
Hand pump information Installation 1992
Current status Working and in use
Depth unknown Water quality Metallic taste, particle matter Water availability Continuous supply Estimated # of people using the source ~ 100 families
Water used for drinking? Yes
Additional information Governmental hand pump. Sampling results
Guideline values [ug/L] Chemical Concentration [ug/L] WHO EPA
Concentration/ EPA or WHO Guideline ratio
Trichloromethane (Chloroform) 148 300 70 ~ 2
Tetrachloromethane (Carbon tetrachloride) 1790 2 5 ~ 900
1,2,3-Trichlorobenzene
17 20 - ~ 0.85 x

Analysis of chemical contaminants in groundwater of communities surrounding UCIL plant site in Bhopal
Main report __________________________________________________________________________________
__________________________________________________________________________________
-53-
5.3.3 Third party water sampling and analysis in an accredited UK laboratory In June 2009, a single water sample was collected from hand pump H/P AA 1 in Atal Ayub Nagar. A water sample from this hand pump had been previously analysed in the Swiss lab as can be seen from Table 8 in this chapter. The location of this sample (i.e. the handpump) was identified using pictures and satellite maps from the Community Report of Atal Ayub Nagar. After collection, the sample was stored in appropriate flasks that were provided by the laboratory and then flown to the UK in a cooled box. The sample was submitted to the lab on July 4th 2009, the analysis was completed on July 22nd 2009. The analysis of the sample revealed a chloroform concentration of 266 µg/L and a carbon tetrachloride concentration of 4880 µg/L. These values are higher than the ones from the sample that had been taken a year earlier, as can be seen from Table 12. Table 12: Chemical concentration in ug/L in different water samples H/P AA1 (Atal Ayub Nagar)
Chloroform Carbon tetrachloride 1,2,3-Trichlorobenzene
UK lab July 2009 266 4880 -
Swiss lab May 2008
148
1790
17
5.4 Chemicals found in previous third party studies or sampling
campaigns in Atal Ayub Nagar and Preet Nagar In this chapter, we summarise results from sampling campaigns that have been conducted in Atal Ayub Nagar and Preet Nagar by NGOs and governmental authorities. Atal Ayub Nagar and Preet Nagar are the two communities for which groundwater samples were analysed in the Swiss and UK laboratories. Tables in chapters 5.4.1 and 5.4.2 show which chemicals were found in previous sampling conducted by the Madhya Pradesh Pollution Control Board (MPPCB), Greenpeace and Srishti (2002) in Preet Nagar and Atal Ayub Nagar. The exact location of where the samples were taken by these groups is not known. Greenpeace took samples at three different locations in Atal Ayub Nagar in 1999 while MPPCB most likely took samples at the same location in this community over the years. Summaries of chemicals that have been found in other communities are not shown here but can be found in the Community Reports. 5.4.1 Example Preet Nagar Groundwater in Preet Nagar was monitored by the Madhya Pradesh Pollution Control Board (MPPCB) over several years. MPPCB tested for several chemicals at irregular time intervals. Several chemicals exceeded drinking water guideline values and are therefore highlighted with bold letters. Note that there are no guideline values available for certain chemicals, but these may still be present at high concentrations, and may pose a health threat.

Analysis of chemical contaminants in groundwater of communities surrounding UCIL plant site in Bhopal
Main report __________________________________________________________________________________
__________________________________________________________________________________
-54-
Table 13: Comparison of chemical concentrations detected in Preet Nagar by MPPCB to guideline values. Note that the above guideline values are subject to change.
Chemicals detected in the community of Preet Nagar
Guideline value [ug/L]
Chemical
WHO1
EPA2
Concentration in water [ug/L]
Date of sampling
Data source
1,2,3-Trichlorobenzene 204 - 12.95 21.11.2005 MPPCB 1,3-Dichlorobenzene - - 93.11 21.11.2005 MPPCB 1,4-Dichlorobenzene 300 75 41.95 21.11.2005 MPPCB
1.43 07.10.2003 MPPCB 1.55 24.02.2006 MPPCB 4,4-DDT 1 - 1.91 29.05.2006 MPPCB 4.65 07.10.2003 MPPCB Aldrin 0.03 - 0.05 08.02.2005 MPPCB 0.19 07.10.2003 MPPCB 0.39 08.02.2005 MPPCB Alpha-BHC - - 56.71 18.05.2005 MPPCB 0.38 07.10.2003 MPPCB 0.03 08.02.2005 MPPCB 0.36 24.02.2006 MPPCB Dieldrin 0.03 -
0.18 29.05.2006 MPPCB 2.34 07.10.2003 MPPCB 0.12 08.02.2005 MPPCB Endosulphan-I - - 0.15 29.05.2006 MPPCB 7.99 07.10.2003 MPPCB Endosulphan-II - - 0.12 29.05.2006 MPPCB
Endrin 0.6 2 0.04 08.02.2005 MPPCB Heptachlor 30 0.4 0.59 29.05.2006 MPPCB Gamma-HCH (Lindane) 23 0.2 35.02 18.05.2005 MPPCB Metoxychlor 20 40 0.4 08.02.2005 MPPCB Sevin (Carbaryl) 50 - 0.41 29.05.2006 MPPCB
1 WHO drinking water guidelines for each chemical can be found on http://www.who.int/water_sanitation_health/dwq/chemicals/en/ 2 all EPA drinking water guideline values can be found as a PDF file on http://www.epa.gov/safewater/consumer/pdf/mcl.pdf 3 ATSDR, 1998, proposed WHO guideline value of 0.3 ug/L 4 health-based value, as total trichlorobenzenes (TCBs)
5.4.2 Example Atal Ayub Nagar Groundwater in Atal Ayub Nagar was also monitored by the Madhya Pradesh Pollution Control Board (MPPCB) over several years. Furthermore, Srishti (2002) analysed water samples from seven communities around the UCIL plant side for several chemicals and took samples in Atal Ayub Nagar. Greenpeace (1999) investigated toxic contaminants at UCIL and took groundwater samples in Atal Ayub Nagar. In those studies, several chemicals were found in the groundwater, some of them greatly exceeded guideline or health-based values. These chemicals are marked with bold letters. Table 14: Comparison of chemical concentrations detected in Preet Nagar by MPPCB, Greenpeace and Srishti to guideline values. Note that the above guideline values are subject to change.

Analysis of chemical contaminants in groundwater of communities surrounding UCIL plant site in Bhopal
Main report __________________________________________________________________________________
__________________________________________________________________________________
-55-
Chemicals detected in the community of Atal Ayub Nagar
Guideline value [ug/L]
Chemical
WHO1
EPA2
Concentration in water [ug/L]3
Date of sampling
Data source
35, 20 ,15 1999 Greenpeace 0.81 03.10.2002 MPPCB 1,2,3-Trichlorobenzene 206 - 12.1 07.10.2003 MPPCB
1,2,4-Trichlorobenzene 206 70 145, 25, 15 1999 Greenpeace 1,2-Dichlorobenzene 1000 600 2875, 20,35 1999 Greenpeace
205, 25, 10 1999 Greenpeace 1,3-Dichlorobenzene - - 19.17 21.11.2005 MPPCB 865, 10, 15 1999 Greenpeace
405.09 03.10.2002 MPPCB 1,4-Dichlorobenzene 300 75 73.91 03.10.2002 MPPCB
Carbon Tetrachloride 4 5 3410, 1730, 200 1999 Greenpeace Alpha-HCH - - 0.14 08.02.2005 MPPCB
1.6 2002 Srishti Beta-HCH - - 0.04 07.10.2003 MPPCB 1.1 2002 Srishti 1.8 24.04.2003 MPPCB 0.01 03.07.2003 MPPCB Gamma-HCH (Lindane) 24 0.2
1.74 07.10.2003 MPPCB 0.36 24.02.2006 MPPCB 4,4-DDT 1 - 0.02 29.05.2006 MPPCB 0.11 07.10.2003 MPPCB Aldrin 0.03 - 0.06 08.02.2005 MPPCB 0.04 08.02.2005 MPPCB Dieldrin 0.03 - 0.004 29.05.2006 MPPCB
Endosulphan-I - - 0.34 29.05.2006 MPPCB 0.51 18.02.2003 MPPCB 0.06 08.02.2005 MPPCB 0.08 24.02.2006 MPPCB Endosulphan-II - -
0.18 29.05.2006 MPPCB 2590, 100, 160 1999 Greenpeace Chloroform 300 705
1359.1 2002 Srishti Chlorobenzene 300 100 56, <5, <5 1999 Greenpeace Dichloromethane 20 5 106.5 2002 Srishti Tetrachloroethene 40 5 45, 20, 15 1999 Greenpeace Hexachloroethane - - 85, <5 ,15 1999 Greenpeace Trichloroethene 20 5 250, <5, <5 1999 Greenpeace Heptachlor 30 0.4 0.33 29.05.2006 MPPCB Methoxychlor 20 40 8.6 18.02.2003 MPPCB Sevin (Carbaryl) 50 - 0.28 29.05.2006 MPPCB
1 WHO drinking water guidelines for each chemical can be found on http://www.who.int/water_sanitation_health/dwq/chemicals/en/ 2 all EPA drinking water guideline values can be found as a PDF file on http://www.epa.gov/safewater/consumer/pdf/mcl.pdf
3 Greenpeace (1999) took water samples at three sampling sites in Atal Ayub Nagar, the exact position of these sampling sites are not known, all values are given in the same order according to their sampling sites 4 ATSDR, 1998, proposed WHO guideline value of 0.3 ug/L 5 as total trihalomethanes (TTHMs) 6 health-based value, as total trichlorobenzenes (TCBs)
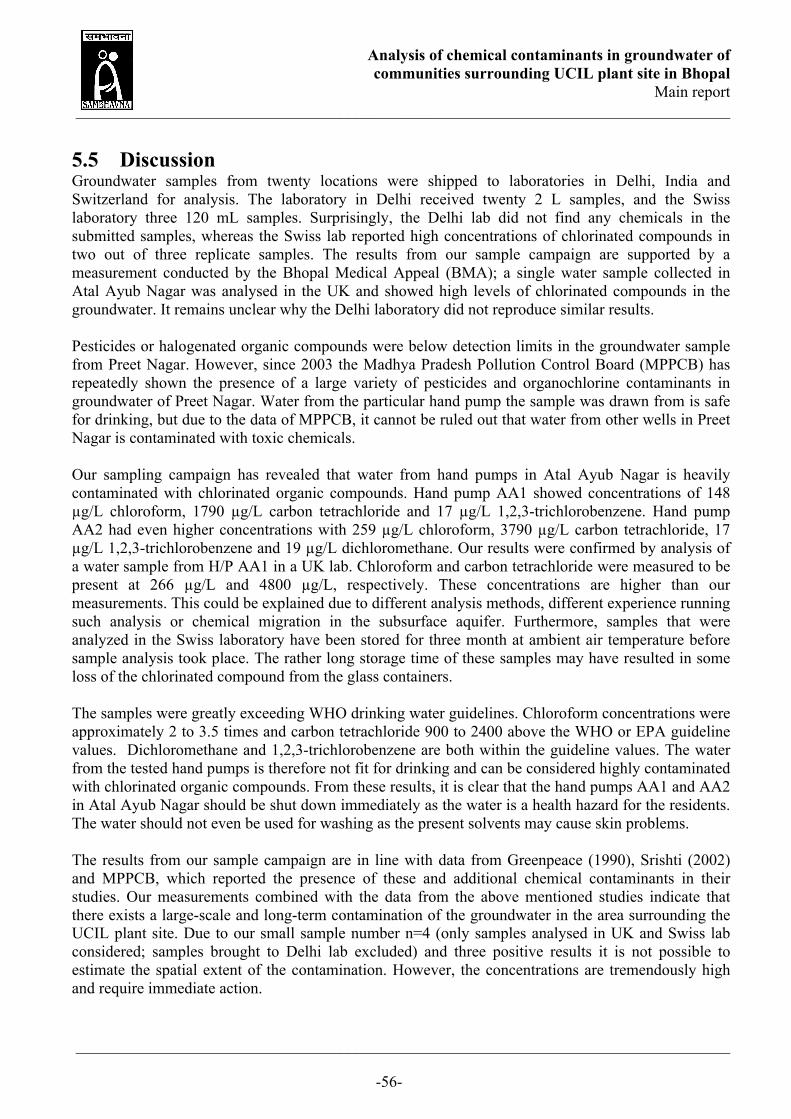
Analysis of chemical contaminants in groundwater of communities surrounding UCIL plant site in Bhopal
Main report __________________________________________________________________________________
__________________________________________________________________________________
-56-
5.5 Discussion Groundwater samples from twenty locations were shipped to laboratories in Delhi, India and Switzerland for analysis. The laboratory in Delhi received twenty 2 L samples, and the Swiss laboratory three 120 mL samples. Surprisingly, the Delhi lab did not find any chemicals in the submitted samples, whereas the Swiss lab reported high concentrations of chlorinated compounds in two out of three replicate samples. The results from our sample campaign are supported by a measurement conducted by the Bhopal Medical Appeal (BMA); a single water sample collected in Atal Ayub Nagar was analysed in the UK and showed high levels of chlorinated compounds in the groundwater. It remains unclear why the Delhi laboratory did not reproduce similar results. Pesticides or halogenated organic compounds were below detection limits in the groundwater sample from Preet Nagar. However, since 2003 the Madhya Pradesh Pollution Control Board (MPPCB) has repeatedly shown the presence of a large variety of pesticides and organochlorine contaminants in groundwater of Preet Nagar. Water from the particular hand pump the sample was drawn from is safe for drinking, but due to the data of MPPCB, it cannot be ruled out that water from other wells in Preet Nagar is contaminated with toxic chemicals. Our sampling campaign has revealed that water from hand pumps in Atal Ayub Nagar is heavily contaminated with chlorinated organic compounds. Hand pump AA1 showed concentrations of 148 µg/L chloroform, 1790 µg/L carbon tetrachloride and 17 µg/L 1,2,3-trichlorobenzene. Hand pump AA2 had even higher concentrations with 259 µg/L chloroform, 3790 µg/L carbon tetrachloride, 17 µg/L 1,2,3-trichlorobenzene and 19 µg/L dichloromethane. Our results were confirmed by analysis of a water sample from H/P AA1 in a UK lab. Chloroform and carbon tetrachloride were measured to be present at 266 µg/L and 4800 µg/L, respectively. These concentrations are higher than our measurements. This could be explained due to different analysis methods, different experience running such analysis or chemical migration in the subsurface aquifer. Furthermore, samples that were analyzed in the Swiss laboratory have been stored for three month at ambient air temperature before sample analysis took place. The rather long storage time of these samples may have resulted in some loss of the chlorinated compound from the glass containers. The samples were greatly exceeding WHO drinking water guidelines. Chloroform concentrations were approximately 2 to 3.5 times and carbon tetrachloride 900 to 2400 above the WHO or EPA guideline values. Dichloromethane and 1,2,3-trichlorobenzene are both within the guideline values. The water from the tested hand pumps is therefore not fit for drinking and can be considered highly contaminated with chlorinated organic compounds. From these results, it is clear that the hand pumps AA1 and AA2 in Atal Ayub Nagar should be shut down immediately as the water is a health hazard for the residents. The water should not even be used for washing as the present solvents may cause skin problems. The results from our sample campaign are in line with data from Greenpeace (1990), Srishti (2002) and MPPCB, which reported the presence of these and additional chemical contaminants in their studies. Our measurements combined with the data from the above mentioned studies indicate that there exists a large-scale and long-term contamination of the groundwater in the area surrounding the UCIL plant site. Due to our small sample number n=4 (only samples analysed in UK and Swiss lab considered; samples brought to Delhi lab excluded) and three positive results it is not possible to estimate the spatial extent of the contamination. However, the concentrations are tremendously high and require immediate action.

Analysis of chemical contaminants in groundwater of communities surrounding UCIL plant site in Bhopal
Main report __________________________________________________________________________________
__________________________________________________________________________________
-57-
First of all, the situation on a local scale has to be improved. Residents of Atal Ayub Nagar cannot rely on drinking water from their hand pumps as the aquifer underneath the community seems to be highly contaminated. The people must be supplied with clean drinking water on a regular basis. As can be seen from the Community Report of Atal Ayub Nagar, today`s drinking water supply is insufficient in this community. The Bhopal Municipal Corporation has to take immediate action and improve the water supply by tanker trucks. This is not only true for Atal Ayub Nagar, but also for many other communities as discussed in Part ІІІ: Summary of Community Reports in this report. Secondly, we propose a large-scale water sampling campaign that covers all communities surrounding the UCIL plant site. Water samples from hand pumps and bore wells that are located in the north-east of the UCIL plant side, hence located along the flow direction of the groundwater, should be taken and analysed. The large numbers of private and governmental hand pumps, reaching different depths, creates the possibility of obtaining a detailed description of the spatial extent of groundwater contamination. This information can help to determine regions with strong groundwater contamination. In these regions it would be a high priority task to keep people from drinking contaminated groundwater by simultaneously supplying them with clean drinking water.
Analysis of chemical contaminants in groundwater of communities surrounding UCIL plant site in Bhopal
Main report __________________________________________________________________________________
__________________________________________________________________________________
-58-
- Part VІ: Conclusion
-

Analysis of chemical contaminants in groundwater of communities surrounding UCIL plant site in Bhopal
Main report __________________________________________________________________________________
__________________________________________________________________________________
-59-
Part VІ: Conclusion It can generally be said that the quantitative water supply is insufficient in the vast majority of the fifteen investigated communities. The Community Reports have revealed that thousands of residents do not have enough clean water for drinking, washing and cooking. Households without private hand pumps are highly dependent on the water supplied by the government, i.e. the Bhopal Municipal Corporation. The water supply system, where it has been installed, is in poor shape. Plastic water tanks are often broken and are not being cleaned on the inside, promoting algal and microbial growth. Water supply by tanker trucks is irregular and the pipe system is not maintained properly, resulting in poor water quality. It is important to point out that even residents owning their own hand pumps or bore wells do have problems getting enough clean drinking water. The quantity of pumped groundwater ceases during the dry season due to the lowered water table as many of the private hand pumps or bore wells do not reach deep enough in the subsurface. The hand pumps provide more water during the monsoon season, but this water is often muddy and potentially contaminated with coliform bacteria, hence not fit for drinking. Furthermore, data obtained from the literature review showed that organochlorine compounds and pesticides have been detected in various sampling campaigns and monitoring programs which were conducted by governmental agencies as well as NGOs. In our sampling campaign we have confirmed the presence of organochlorine compounds massively exceeding international drinking water guidelines. Chloroform concentrations exceeded guideline values 4 to 7 times and carbon tetrachloride 900 to 2400 times. Due to the small sample size we cannot draw conclusions regarding the spatial distribution of the groundwater contamination. However, from the compiled data it is clear that the pollutant load of the groundwater has remained high throughout the past decade, posing a health threat to residents due to chronic exposure. There is strong evidence that groundwater is contaminated on a large-scale area and that the contamination is especially high in the communities located northeast of the UCIL plant site. The use of groundwater from private and public hand pumps or bore wells for drinking should therefore be avoided as much as possible, at least as long as the spatial distribution of the contaminants is not fully understood. Residents of many communities have reported suffering from various ailments and have attributed these ailments, including skin rashes, nausea, stomach problems, headaches and weakness, to the poor drinking water. Even though we have not collected health related data during our survey, certain patterns of health related issues became evident. For example, skin problems were especially pronounced in ”Nawab Colony” and other railway communities. As one of the first steps to improve the situation, Bhopal Municipal Corporation must ensure that sufficient clean drinking water is delivered to the residents in the communities surrounding the UCIL plant site. While providing this service, it is also important that the government takes immediate action to improve the maintenance of the water pipe system and the water tanks. Tanker trucks need to provide clean drinking water on a regular basis. The water from the lake or the large groundwater pumping stations needs to undergo quality monitoring and a proper treatment process, if necessary. Sufficient water supply is worthless if the water quality is poor.

Analysis of chemical contaminants in groundwater of communities surrounding UCIL plant site in Bhopal
Main report __________________________________________________________________________________
__________________________________________________________________________________
-60-
There are communities where the current water supply system is not operational or simply no such system is installed at all (e.g. Chandbaadi). We urge the Bhopal authorities to connect all communities to the water supply system as quickly as possible and to install a dense network of pipes and tanks that is capable of supplying sufficient clean drinking water. In order to clearly identify the outer boundary of groundwater contamination, we propose a groundwater sampling campaign covering the communities whose water supply situation has been described in this report. By conducting this survey, it will be possible to differentiate between those communities which are more affected and those which are less affected by contamination. This knowledge could help to develop guidelines of where residents should not use groundwater for drinking. Such guidelines could help to reduce health problems among residents living in the affected communities.

Analysis of chemical contaminants in groundwater of communities surrounding UCIL plant site in Bhopal
Main report __________________________________________________________________________________
__________________________________________________________________________________
-61-
- Part VІІ: Annex
-

Analysis of chemical contaminants in groundwater of communities surrounding UCIL plant site in Bhopal
Main report __________________________________________________________________________________
__________________________________________________________________________________
-62-
Part VІІ: Appendix 5.1 References Labunska, I., Stephenson, A., Brigden, K., Stringer, R., Santillo, D. & Johnston, P.A. 1999. The
Bhopal Legacy: Toxic contaminants at the former Union Carbide factory site, Bhopal, India: 15 years after the Bhopal accident. Greenpeace Research Laboratories, Department of Biological Sciences, University of Exeter, Exeter UK.
Labunska, I & Santillo, D. 2004. High levels of chlorinated organic compounds, including
tetrachloromethane, in water from well adjacent to former Union Carbide India Ltd (UCIL) pesticide plant, Bhopal (India). Greenpeace Research Laboratories.
National Environmental Engineering Research Institute (NEERI). 1990. Assessment of pollution
damage due to Solar Evaporation Ponds at UCIL, Bhopal. Published by NEERI, Nagpur – 440 020, Madhya Pradesh Pradushan Nirawan Mandal, Bhopal.
Srishti. 2002. Toxic Present - Toxic Future: A Report on Human and Environmental Chemical
Contamination around the Bhopal disaster site. H-2, Jangpura Extension, New Delhi – 110 014. Stringer, R., Labunska, I., Brigden, K. & Santillo, D. 2002. Chemical Stockpiles at Union Carbide
India Limited in Bhopal: an investigation. Greenpeace Research Laboratories.
5.2 Drinking water guidelines WHO Drinking water guidelines An overview of all existing chemicals (various chemicals and heavy metals) for which WHO drinking water guidelines are established can be found on the WHO homepage: http://www.who.int/water_sanitation_health/dwq/chemicals/en/ US EPA Drinking water guidelines The latest EPA drinking water guideline values can be found as a PDF file or a list on the EPA homepage: http://www.epa.gov/safewater/consumer/pdf/mcl.pdf http://www.epa.gov/safewater/contaminants/index.html#1
Analysis of chemical contaminants in groundwater of communities surrounding UCIL plant site in Bhopal
Main report __________________________________________________________________________________
__________________________________________________________________________________
-63-
5.3 Figure and table directory Figure directory FIGURE 1: SATELLITE MAP OF THE UCIL PLANT SITE AND THE SURROUNDING COMMUNITIES ........................................... 10 FIGURE 2: PUBLIC HAND PUMP, OUT OF COMMISSION ....................................................................................................... 13 FIGURE 3: PUBLIC HAND PUMP IN USE ................................................................................................................................. 13 FIGURE 4: PUBLIC HAND PUMP IN USE ................................................................................................................................. 13 FIGURE 5: PRIVATE HAND PUMP IN A BACKYARD................................................................................................................. 13 FIGURE 6: PRIVATE HAND PUMP INSIDE A HOUSE................................................................................................................ 13 FIGURE 7: BORE WELL IN FRONT OF A HOUSE ...................................................................................................................... 14 FIGURE 8: BORE WELL SHEATHED IN A CONCRETE WALL ..................................................................................................... 14 FIGURE 9: HOLDING CAPACITY (5000 LITRES) AND DATE OF INSTALLATION (27.6.04) IMPRINTED ON THE OUTER WALL OF
A BIG WATER TANK...................................................................................................................................................... 15 FIGURE 10: RESIDENTS WAITING FOR WATER FROM A LARGE PLASTIC WATER TANK......................................................... 15 FIGURE 11: SMALL PLASTIC WATER TANK............................................................................................................................. 15 FIGURE 12: LABELLED WATER TANK...................................................................................................................................... 15 FIGURE 13: CONCRETE WATER TANKS ARE SMALLER THAN THE PLASTIC TANKS ................................................................ 16 FIGURE 14: CONCRETE WATER TANK LOCATED IN GARIB NAGAR ........................................................................................ 16 FIGURE 15: TANKER TRUCK IN THE NORTHERN PART OF ATAL AYUB NAGAR. ..................................................................... 16 FIGURE 16: PEOPLE ALSO GET THE WATER DIRECTLY FROM THE TANKER TRUCK, SINCE MANY WATER TANKS IN THE
COMMUNITY ARE BROKEN. ......................................................................................................................................... 16 FIGURE 17: WATER PIPE MARKED WITH RED ARROW.......................................................................................................... 17 FIGURE 18: INDIVIDUAL SWITCH OF THE WATER PIPE NETWORK IN ANNU NAGAR, WHICH SUPPLIES THE TANKS
INDIVIDUALLY WITH WATER FROM RASLA KHEDI ....................................................................................................... 17 FIGURE 19: OVERHEAD STORAGE TANK IN SHAKTI NAGAR .................................................................................................. 17 FIGURE 20: OLD OVERHEAD STORAGE TANK (RIGHT) AND CONSTRUCTION OF A LARGE OVERHEAD TANK (LEFT) IN
CHANDBAADI ............................................................................................................................................................... 17 FIGURE 21: OVERHEAD TANK IN JAIPRAKASH (J.P.) NAGAR.................................................................................................. 18 FIGURE 22: WORK IN PROGRESS FOR THE OVERHEAD WATER STORAGE TANK AT BLUE MOON PUMPING STATION, STATE
OF CONSTRUCTION ON 12.2.08. .................................................................................................................................. 18 FIGURE 23: A SO CALLED SUB‐TANK (GROUND STORAGE TANK) AT THE PUMP STATION IN BLUE MOON COLONY WITH A
CAPACITY OF 400`000 LITRES. THE TANK WAS BUILT IN 2005..................................................................................... 18 FIGURE 24: ONGOING CONSTRUCTION OF AN OVERHEAD WATER STORAGE TANK FOR THE PUMP STATION, IN ADDITION
TO THE EXISTING GROUND STORAGE TANK. THE WORK ON THE OVERHEAD TANK WITH A CAPACITY OF 1`000`000 LITRES (EXPECTED COMPLETION AT END OF 2008). .................................................................................................... 18
FIGURE 25: ALGAE AND DIRT INSIDE A WATER TANK WHICH HAS NOT BEEN REFILLED ON A REGULAR BASIS. THE TANK IS LOCATED IN BLUE MOON COLONY. ............................................................................................................................. 19
FIGURE 26: BOTTOM OF THE WATER TANK FROM FIG. 26 ................................................................................................... 19 FIGURE 27: WATER TAP, THE MOST VULNERABLE PART OF A TANK BECAUSE IT TENDS TO EASILY BREAK......................... 19 FIGURE 28: BROKEN WATER TAP .......................................................................................................................................... 19 FIGURE 29: BROKEN TANK IN SHRI RAM NAGAR .................................................................................................................. 20 FIGURE 30: REMNANTS OF A PIPE SYSTEM IN SHRI RAM NAGAR......................................................................................... 20 FIGURE 31: RUPTURED PIPE IN SHRI RAM NAGAR ................................................................................................................ 20 FIGURE 32: OVERHEAD WATER STORAGE TANK IN ARIF NAGAR WHICH USED TO SUPPLY PARTS OF THE COMMUNITY
WITH WATER BY A PIPE NETWORK. THE NETWORK IS BROKEN AND HENCE NEW ARIF NAGAR DOES NOT GET WATER FROM THE TANK ............................................................................................................................................. 20
FIGURE 33: VIEW ON THE SOLAR EVAPORATION PONDS (SEP), DUMPING SITE OF WASTE WATER FROM UCIL PLANT. .... 21 FIGURE 34: MUDDY WATER IN THE SEP ................................................................................................................................ 21 FIGURE 35: A THIN POLYETHYLENE PLASTIC LAYER, COVERED WITH SOIL, WAS SUPPOSED TO PREVENT LEACHING OF THE
POND WATER INTO THE GROUNDWATER ................................................................................................................... 21 FIGURE 36: DISRUPTION OF THE PLASTIC LAYER ON THE DAM OF THE SEP ......................................................................... 21 FIGURE 37: PRODUCTION TOWERS ON THE SAVAGED UCIL PLANT SITE .............................................................................. 22 FIGURE 38: CLOSE‐UP OF A RUSTY FORMULATION TOWER OF THE UCIL PLANT ................................................................. 22 FIGURE 39: A BADGE FROM A FORMER SOLVENT HOLDING TANK....................................................................................... 22

Analysis of chemical contaminants in groundwater of communities surrounding UCIL plant site in Bhopal
Main report __________________________________________________________________________________
__________________________________________________________________________________
-64-
FIGURE 40: ONE OF THE MIC STORAGE TANKS (INFORMATION PROVIDED BY A GUARD) ................................................... 22 FIGURE 41: RESIDENTS AND GRAZING GOAT ON THE PLANT SITE........................................................................................ 23 FIGURE 42: THE FLARE TOWER WHICH WAS NOT IN OPERATION WHEN THE DISASTER HAPPENED ON DECEMBER 2ND IN
1984 ............................................................................................................................................................................. 23 FIGURE 43: RESIDENT OF NEW ARIF NAGAR WITH CALENDAR FOR REPORTING THE WATER TANK SUPPLY. THE AMOUNT
OF WATER IS NOTED ON THE DAYS WHEN THE TANK IS REFILLED.............................................................................. 26 FIGURE 44: MUDDY WATER FROM HAND PUMP H/P AN 4 IN ANNU NAGAR. THIS WATER IS ALSO USED FOR DRINKING. 27 FIGURE 45: MUDDY, YELLOWISH WATER WITH BAD SMELL FROM HAND PUMP H/P SHB 47 IN SHIV NAGAR. THE WATER
CANNOT BE USED FOR DRINKING................................................................................................................................ 27 FIGURE 46: WATER COMING FROM A BORE WELL IN SHIV NAGAR IS FORMING BUBBLES AND FOAM WITHOUT ADDITION
OF ANY WASHING DETERGENTS. ................................................................................................................................. 27 FIGURE 47: MUDDY WATER WITH BAD SMELL FROM H/P SHD 1 IN SHIV NAGAR. PEOPLE HAVE STOPPED USING THIS
WATER FOR DRINKING, BECAUSE THEY HAVE GOTTEN SICK FROM IT. ....................................................................... 27 FIGURE 48: WOMAN, 40 YEARS OLD, SUFFERING FROM SKIN RASHES. SAMBHAVNA TRUST CLINIC PATIENT WITH
FOLLOWING SYMPTOMS: SKIN RASHES, BODYACHE, NEUROMUSCULAR PROBLEMS. DIAGNOSIS: HYPERTENTION. (IDENTITY OF PERSON IS KNOWN)............................................................................................................................... 28
FIGURE 49: WOMAN, 27 YEARS OLD, SUFFERING FROM SKIN RASHES. SAMBHAVNA TRUST CLINIC PATIENT WITH FOLLOWING SYMPTOMS: SKIN RASHES, JOINT PAIN, BREATHLESSNESS, NEUROMUSCULAR PROBLEMS. (IDENTITY OF PERSON IS KNOWN)................................................................................................................................................ 28
FIGURE 50: BOY, 5 YEARS OLD. SAMBHAVNA TRUST CLINIC PATIENT WITH FOLLOWING SYMPTOMS: SKIN RASHES, RESPIRATION PROBLEMS. ............................................................................................................................................ 29
FIGURE 51: MAN, AGE UNKNOWN, WITH SKIN RASHES ON HIS ARM AND BELLY................................................................ 29 FIGURE 52: BOY, AGE UNKNOWN, SUFFERING FROM SKIN RASHES ON ARMS, CHEST AND BACK. ..................................... 29 FIGURE 53: SAME BOY AS IN FIGURE 53, SKIN RASHES ON CHEST AND BELLY. .................................................................... 29 FIGURE 54: ARTICLE FROM A BHOPAL NEWSPAPER ............................................................................................................. 31 FIGURE 55: GROUNDWATER FLOW, ADOPTED FROM NEERI (1990) .................................................................................... 37 FIGURE 56: SAMPLE COLLECTION.......................................................................................................................................... 48 FIGURE 57: MUDDY WATER FROM ONE OF THE HAND PUMPS............................................................................................ 48 FIGURE 58: MUDDY WATER FROM ANOTHER WELL ............................................................................................................. 48 FIGURE 59: CLEAR GROUNDWATER SAMPLE ........................................................................................................................ 48 All pictures by Aio Häberli. Table directory TABLE 1: ROCK FORMATIONS, ADOPTED FROM NEERI (1990).............................................................................................. 35 TABLE 2: PARAMETERS OF SOLAR EVPORATION PONDS (SEP) AND POLYETHYLENE SHEET ACCORDING TO NEERI (1990). 38 TABLE 3: HIGHEST CONCENTRATIONS OF CHEMICALS IN POND 1........................................................................................ 39 TABLE 4: CHEMICALS FOUND IN THE FIRST GREENPEACE (1999) REPORT............................................................................ 41 TABLE 5: CHEMICALS FOUND IN THE SECOND GREENPEACE (2002) REPORT....................................................................... 42 TABLE 6: CHEMICALS FOUND IN THE SRISHTI (2002) REPORT .............................................................................................. 43 TABLE 7: IDENTIFICATION OF WATER SAMPLES.................................................................................................................... 47 TABLE 8: CHEMICAL CONCENTRATION IN µG/L IN DIFFERENT WATER SAMPLES................................................................. 49 TABLE 9: INFORMATION ABOUT WATER SAMPLE WS 1009.................................................................................................. 50 TABLE 10: INFORMATION ABOUT WATER SAMPLE WS 1019................................................................................................ 51 TABLE 11: INFORMATION ABOUT WATER SAMPLE WS 1020................................................................................................ 52 TABLE 12: CHEMICAL CONCENTRATION IN UG/L IN DIFFERENT WATER SAMPLES .............................................................. 53 TABLE 13: COMPARISON OF CHEMICAL CONCENTRATIONS DETECTED IN PREET NAGAR BY MPPCB TO GUIDELINE.......... 54 TABLE 14: COMPARISON OF CHEMICAL CONCENTRATIONS DETECTED IN PREET NAGAR BY MPPCB, GREENPEACE .......... 54 5.4 Data collection form for water sources in communities

Analysis of chemical contaminants in groundwater of communities surrounding UCIL plant site in Bhopal
Main report __________________________________________________________________________________
__________________________________________________________________________________
-65-
••••••••••••••••••••••••••••••••••••••••••••••••••••••••••••••••••••••••••••••••••••••• Community: Date: Translator: Shortcuts: Hand pump (H/P), Tube well (T/W), Water tank (W/T), Bore Well (B/W), Municipal water supply (MWS)
•••••••••••••••••••••••••••••••••••••••••••••••••••••••••••••••••••••••••••••••••••••••
Identification Water source
H/P T/W W/T B/W MWS Private Mechanical Source No.:_________ PICT ID.:_________ Source working? Yes No -> Reason:_____________________ __________________________________________________________ Questionnaire
When was it installed?
Depth of source?
Is the water used as drinking water?
Was source ever closed down?
Estimated # of people using the source?
Change in water quality during year?
Water availability during year?
Additional information.

Analysis of chemical contaminants in groundwater of communities surrounding UCIL plant site in Bhopal
Main report __________________________________________________________________________________
__________________________________________________________________________________
-66-
5.5 Acknowledgment We would like to thank Ritesh Kumar Pal, Prabjit Barn and Tasneem Zaidi for their kind assistance with surveying, sampling and reviewing this report.