analysis of ecosystem structure and function: extended ... analysis/whipple 1997.pdf · analysis of...
TRANSCRIPT
Ecological Modelling 114 (1999) 251–274
Analysis of ecosystem structure and function: extended pathand flow analysis of a steady-state oyster reef model
Stuart J. Whipple *
Biology Department, 3359 Mississauga Road North, Uni6ersity of Toronto at Mississauga, Mississauga, ON, Canada L5L 1C6
Accepted 19 August 1998
Abstract
An analysis of the extended path and flow structure of a six compartment steady-state oyster reef model wasconducted. The extended path and flow structure were analyzed in the context of a refined canonical pathclassification system based on the systems theory methods of environ and network unfolding analyses. A computerimplementation of an operational path classification system facilitated investigation of a finite portion (path length517 arcs) of the direct and indirect path structure of the oyster reef model. Important results of the path structureanalysis include: (1) few simple paths and large numbers of compound paths enumerated; (2) dominance of pathnumbers by subsequent passage terminal cycle paths; (3) structural evidence in support of feedback control inecosystems; (4) results provide evidence by analogy to support the hypothesis of network homogenization firstdescribed using the systems analysis methods of environ analysis and network unfolding; (5) constancy of the patternof origin–destination path counts with increasing path length; (6) importance of nonliving compartments in theextended path structure of ecosystems. Simultaneous path and flow analysis of the oyster reef model assessed the flowcontributions of the fundamental path categories for this model using a modification of a path-based networkunfolding method. First passage paths contribute most of the flow; however, multiple passage cyclic paths alsoprovide a large (22%) flow contribution. Because of cycling in the system, the numerous long paths in the extendedpath structure of this ecosystem model are significant in its function as represented by the flows. These results providemicroscopic evidence for the macroscopic results of environ analysis that implicate cycling as a key ecosystemattribute in the mechanisms of holistic system determination. The principles enunciated here for a model with a lowcycling index (11%) carry over to, and would be even more significant for, models with high cycling indexes. Theseresults also serve to form a link between the extended structure of food webs and their functioning as represented byenergy-matter flows. The present analysis demonstrates that extended path structure, and the component articulationfrom which it is generated, have significant consequences for ecosystem function. © 1999 Elsevier Science B.V. Allrights reserved.
Keywords: Extended path structure; Flow analysis; Cycling; Network analysis; Food webs
* Tel.: +1-905-828-5452; fax: +1-905-828-3792; e-mail: [email protected].
0304-3800/99/$ - see front matter © 1999 Elsevier Science B.V. All rights reserved.
PII: S 0304 -3800 (98 )00154 -9

S.J. Whipple / Ecological Modelling 114 (1999) 251–274252
1. Introduction
The structure of food webs describes the path-ways available for flows of energy–matter thatproduce ecosystem function. Food webs havebeen described as road maps; there are many waysto travel from one point to another on a roadmap. In ecosystems all possible ways are utilizedto a greater or lesser degree, which can be spe-cified. The extended path structure characterizesthe direct and indirect relationships between com-partments in an ecosystem model through exami-nation of paths of length greater than or equal toone; the indirect relationships are an elaborationof the direct relationships represented in the foodweb. The following section gives a brief summaryof some of the approaches that ecologists haveemployed to study the path structure of foodwebs.
1.1. Path analysis of food webs
Hundreds of food webs have been collected andcatalogued (e.g. Cohen, 1978; Briand, 1983; Co-hen et al., 1990; Schoenly et al., 1991). The cata-logued food webs were analyzed to characterizetheir patterns and statistics and to detect general-izations and regularities that might give insightinto the ecological implications of food webstructure.
The results of this analysis have been reportedin a number of papers. (e.g. Briand, 1983; Cohenet al., 1990; Pimm et al., 1991). These paperspresented the results as characteristic of the gen-eral features of real food webs, and often biologi-cal or ecological mechanisms that might beresponsible for the patterns were discussed. Inreviews of the results from food web theory, Polisproduced a partial summary of the pattern analy-sis results from the food web literature (Polis,1994, 1995). A list of the two results most relevantto this paper follows: (1) food chain lengths areusually three or four trophic levels (Pimm, 1982;Briand, 1983; Cohen et al., 1986); (2) loops (cyclesof length 1 arc) and cycles (length ]2 arcs) arerare in food webs (e.g. Gallopin, 1972; Cohen,1978; Pimm et al., 1991).
Results from food web pattern analysis stimu-lated a number of ecologists to develop large-scalefood webs with the purpose of comparing foodweb patterns from their studies with the results ofthe compiled food web catalogues. Examples in-clude the Coachella Valley desert web (Polis,1991), Little Rock lake web (Martinez, 1991), andthe Ythan estuary web (Hall and Raffaelli, 1991).
Hall and Raffaelli (1991) and Polis (1995) foundanalysis results from many of the large-scale foodwebs differed substantially from results of analysesof the original food web catalogue (e.g. Pimm etal., 1991). Hall and Raffaelli also state that thedifferent food web pattern results for the large-scale webs may be a product of better taxonomicresolution of web compartments and the greatereffort made in documenting linkages, rather thanthe larger size of the webs, per se.
The approach described in this paper extendsthe analysis of food web structure in two direc-tions. First, the analysis of extended path struc-ture, which includes the indirect relationships,provides a more complete analysis of the ecologi-cal relationship between compartments than anal-ysis using only direct food web connections.Second, because the extended path structure anal-ysis is combined with flow analysis, the functionalsignificance of the extended path structure ofecosystems is demonstrated. These analyses sug-gest that there is a great deal more to food webcomplexity than is evident from examination ofonly the direct connections.
The two main contributors to the network ap-proach to food web structure analysis have beenPatten, Ulanowicz, and their colleagues. Ulanow-icz (1983) presented theory and methods for theanalysis of cycles in ecosystem models. Ulanowicz(1983) describes and implements methods for theenumeration and systematic removal of all of thesimple cycles of a cyclic ecosystem network. Thiscycle analysis provided the basis for the pathenumeration methodology used in this paper.
Ulanowicz (1986) proposed a quantitative mea-sure to describe ecosystem development that henamed ascendency. Extensive and intensive prop-erties of a system are incorporated into the ascen-dency metric. Extensive properties are thoseassociated with system size or magnitude—the

S.J. Whipple / Ecological Modelling 114 (1999) 251–274 253
flows. The extensive measure used is total systemthroughflow. Intensive properties of the systemrefer to the organization or articulation of thesystem components. The intensive measure chosenis the average mutual information of the system.Ascendency is defined as the product of the totalsystem throughflow and the average mutual infor-mation (Ulanowicz, 1986). Ascendency is a hybridmeasure that encapsulates, in one number, at-tributes of the structure and function of a flow–storage model. With goals similar to those inUlanowicz (1986), a combined structural–func-tional systems analysis technique was imple-mented in this paper to simultaneously analyzethe path structure and flow attributes of anecosystem network.
Patten and colleagues developed methods forecosystem structural analysis in the context ofmathematical digraph theory and state-space sys-tem theory. Patten (1985a) described an initialsystematic characterization of the structure ofcyclic ecosystem networks and its theoretical im-plications for flow analysis and indirect effects inecosystems.
Patten (1985a) recognized that networks thatcontain one or more simple cycles have an ex-tended path structure, and he developed a pathclassification scheme to describe this structure. Asimple path from an origin j to a terminal node ihas no repeated nodes, whereas a compound pathdoes. Paths that are part of the extended structureare compound paths that contain repeated nodes,and hence cycles (Patten, 1985a).
Patten (1985a) laid the groundwork for thenetwork approach to systematic investigation ofecosystem structure and its implications. Thisgroundwork was extended in a series of papersthat discussed path structure analysis in the con-text of trophic network unfolding (Patten et al.,1989, 1990; Higashi et al., 1993); these paperspresented the theory and notation for path clas-sification structure which form the basis for thepath category system described in this paper.
1.2. Purposes of this work
The primary purposes of the current paper areas follows:
1. Describe a canonical path classification basedon the systems ecology path theory of Pattenet al. (1989), Patten et al. (1990), and Higashiet al. (1993).
2. Describe an operational path classificationmethodology based on the canonical pathclassification.
3. Present results from a computer-algorithm im-plementation of this operational classificationfor a defined path length for an oyster reefmodel.
4. Determine if the patterns of the counts pro-duced for the oyster reef model differ signifi-cantly between operational path categories orwithin operational path categories for increas-ing path length.
5. Describe the functional implications of theoperational path categories using simultaneousflow and path analysis for the oyster reefmodel. Examine the flow contributions of theoperational path categories and how thesecontributions change with increasing pathlength.
2. Methods
The two primary methods developed for thisanalysis are a theoretical framework and com-puter methods. The theoretical framework is theconceptual basis for creation of the path cate-gories and will be presented in Section 3.1. Thecomputer methods include: (1) algorithms forenumerating paths in ecosystem models; (2) al-gorithms for partitioning the enumerated pathsinto operational path categories; and (3) path-based network unfolding methods for calculatingthe flow amounts contributed by the enumeratedand classified paths (Whipple, 1998).
2.1. Computational algorithms
2.1.1. Path enumeration using a depth-first searchThe computer algorithm used is a modification
of a depth-first search algorithm used in cycleanalysis (Ulanowicz, 1983; Ulanowicz and Kay,1991). The depth-first search algorithm wasmodified to enable it to enumerate all types of
S.J. Whipple / Ecological Modelling 114 (1999) 251–274254
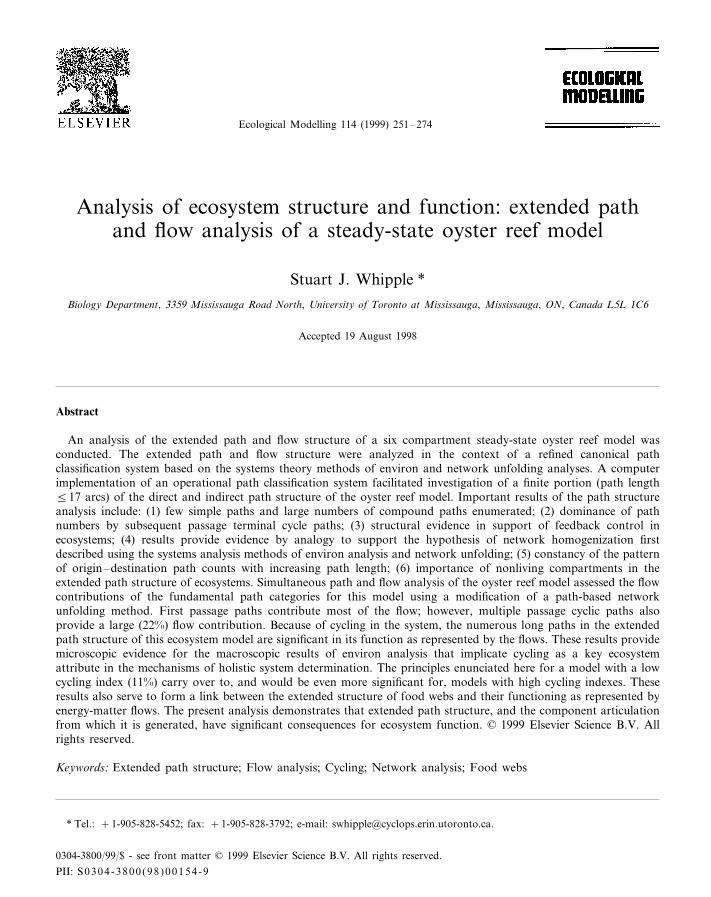
Fig. 1. Computation of the amount of flow contributed by three paths with origin=1 and destination=2 with path lengths of 2and 3 arcs. Paths are identified by arrow color: path 1 has black flow arrows; path 2 has white flow arrows; and path 3 has grayflow arrows. The gij entries shown next to the flow arrows represent the donor-normalized flow intensity for the oyster reef model.Path-wise flow intensity for path m from origin j to destination i is represented as gij(cm). The amount of flow accounted for bythe path of length L from origin j to destination i is denoted by fij(L).
paths—acyclic and cyclic—and not merely thecycles for which it was originally designed. Thedepth-first search with backtracking was contin-ued until all of the possibilities for a focal origincompartment with the maximum path length havebeen exhausted. Since the total number of pathsin a cyclic model increases without bound withincreasing path length, the algorithm was de-signed to find all paths up to a specified length.The specified length can be any finite number, butcomputation time limits this number to moder-ately short path lengths in practice.
2.1.2. Partitioning the enumerated paths intooperational categories
A computer algorithm was developed whichsearches each path after it is enumerated by thedepth-first search methods described above, andparses it so that it can be placed into one of 16basic operational path categories. Various statis-tics on path origin, destination, and medial com-
partments used, as well as operational path countsfor the 16 categories by path length and categorywere computed.
2.1.3. Flow analysis using path-based networkunfolding
In order to calculate the amount of flow con-tributed by each path enumerated, a modificationof a path-based network unfolding method hasbeen developed (Whipple, 1998). This path-basedunfolding method is based on the systems analysismethods of environ (Patten, 1982) and networkunfolding (Higashi et al., 1993) analyses. The modeldata required is the donor-normalized flow inten-sity matrix, G, for the focal model. This matrix iscomputed by dividing the flow, fij, from j to i by Tj,which is the sum of the outflows from compartmentj. This method uses the same depth-first searchdescribed above to enumerate path sequences.
Fig. 1 shows a graphical representation of theflow analysis method applied to a portion of the

S.J. Whipple / Ecological Modelling 114 (1999) 251–274 255
oyster reef model extended path structure. Thefirst step in generating the path-partitioning offlows is to compute gij(cm), which is the path-wiseflow intensity for path m, from origin compart-ment j, which has received an input zj, to destina-tion compartment i. To calculate thedimensionalized flow amount which this path con-tributes one must multiply gij(cm) by zj. Thismethod calculates the amount of flow contributedby any path that has a nonzero input from out-side the system.
After calculating the flow amount for eachpath, the path is assigned to an operational pathcategory. Running totals are kept for eachorigin–destination pair by path length and pathcategory so that total flows by path length orbasic operational path category can be computed.
2.1.4. Similarity index algorithmA similarity index for comparing origin–desti-
nation path count matrices generated by the pathanalysis methods was developed. The index pro-vides a quantitative measure to compare the pat-terns of origin–destination path count matrices. Iftwo path count matrices of different path lengthsare compared, the magnitudes of the counts maybe quite different. To address this, the similarityindex produces a normalized proportion matrixfor each of the matrices to be compared. Thesimplest method of normalization is to computethe proportions based on the grand total countfor the entire path count matrix. Therefore, atotal-normalized path count matrix, P, for thefirst path count matrix, C1, would be created bythe following method:
pij=c1ij/Sn
j=1 Sni=1 c1
ij
where cij is the ijth element in the first path countmatrix C1, and pij is the ijth element in the firsttotal-normalized path proportion matrix P. Cal-culation of the second total-normalized propor-tion matrix, Q, is identical except that a pathcount matrix C2 is used in place of C1, as follows:
qij=c2ij/Sn
j=1 Sni=1 c2
ij
where qij is the ijth element in the total-normal-ized path proportion matrix Q. The similaritymatrix S is calculated using the P and Q matrices
in the following manner:
sij= (pij−qij)2/(pij+qij/2)
where pij and qij are as previously defined, and sij
is the ijth element in the similarity matrix S,which provides an index of similarity for the pathcount matrices C1 and C2. The full similarityindex, S, is calculated as follows:
S=Snj=1 Sn
i=1 sij
The maximum value that can be obtained for anyentry sij is 2.0.
2.2. Materials: description of model
2.2.1. Oyster reef ecosystem modelA flow–storage diagram of the intertidal oyster
reef ecosystem model used for the path and flowanalysis is shown in Fig. 2. The construction ofthe intertidal oyster reef is described in Dame andPatten (1981). The model is composed of sixcompartments with flows among the compart-ments and inputs and outputs across the systemboundary. For brevity the mnemonic compart-ment names listed in Fig. 2 will be used forreference.
There are 12 intercompartmental transfers andone input from the environment to FF(1). Theinput (z1) represents ingestion of phytoplanktonand suspended particulate detritus by filter feedersfrom the surrounding estuarine ecosystem. Thereis one output from each of the six compartmentsto the estuarine system. These outputs representmortality and the output products of resuspensionand respiration processes (Dame and Patten,1981). The conceptual compartments were devel-oped according to feeding type and size. The unitused for standing stocks of compartments is kcalm−2, and the unit used for intercompartmentalflows, inputs, and outputs is kcal m−2 day−1
(Dame and Patten, 1981).
3. Results
3.1. Theoretical framework
The theoretical framework can be divided into

S.J. Whipple / Ecological Modelling 114 (1999) 251–274256
Fig. 2. Oyster reef model diagram with intercompartmental flows, inputs, and outputs. Flows amounts are shown next to the arrows;standing stock amounts are shown inside the compartment boxes. The dotted-line border denotes the system boundary. Unit forstocks is kcal m−2, and the unit for intercompartmental flows, inputs, and outputs is kcal m−2 day−1. The bottom half of the figureshows a table of compartment full names and numbers, mnemonic short names, and brief biological descriptions. Model source:Dame and Patten (1981).
two parts: canonical path categories and opera-tional path categories. The canonical path categories create the conceptual basis for the opera-tional path categories. The operational path cate-gories have been implemented as computeralgorithms to generate the analysis results.
3.1.1. Canonical path classificationThe canonical path classification defines the
path types that are possible when starting atorigin compartment j and ending at terminal com-partment i (Patten et al., 1990; Higashi et al.,1993). A diagrammatic representation of this path

S.J. Whipple / Ecological Modelling 114 (1999) 251–274 257
scheme is shown in the top half of Fig. 3, and atable of the major path sets is shown in thebottom half. Medial compartments occur at theinside positions of the path. For paths with Lcompartments, there are M medial compartmentswhere M=L−2. Medial compartments will bereferred to as km, where the total number ofmedial compartments is given by: SM
m=1 km. Forpaths with only two compartments, M=0, andthere are no medial compartments.
The path set from j to i is divided into twomain categories. The first category is the firstpassage or mode 1 paths, and is represented withthe symbol Fij. The second category is the subse-quent passage or mode 2 path set.
The first passage paths, which are made up ofone acyclic and two cyclic path sets, start at
compartment j and terminate at i, touching i onlyonce. The acyclic simple paths from j to i, inwhich no medial compartment, km, is touchedmore than once, are called alpha paths, notatedAij. As shown on the left-hand side of Fig. 3, thenon-feedforward cycles, Vjj �i, defined relative to aparticular terminal node i, start at compartment j,move to some medial compartment, km, whichdoes not include i, and terminate at j. The secondset of first passage cyclic paths is the root medialcycle set, Vij. The root medial cycle set begins atcompartment j, contains at least one medial cyclethat does not touch the origin or the terminalcompartment, and ends with compartment i.
From these three path sets, two derived pathsets are possible for the first passage paths. Thefirst is the root path set, Pij, which is the union ofthe simple paths and the root medial cycle paths.The second derived path set is the formation ofthe complete first passage path set. This path set,notated Fij, is the concatenation of the non-feed-forward cycles, Vjj �i, with the root path set, Pij, togive the complete set of paths from j to i in whichthe terminal compartment is touched once.
The second main category of paths is the subse-quent passage or mode 2 paths. These paths occurafter the first passage paths have touched thedestination compartment once. Subsequent pas-sage paths form terminal cycles such that thedestination compartment is touched two or moretimes. The first path set is the non-feedback termi-nal cycles, Vii � j. These start at compartment i,move to some medial compartment which doesnot include the origin compartment j, and termi-nate at i. The simple return paths, notated Aji, arepaths from compartment i to j in which no medialcompartment is touched more than once. Thereturn medial cycles, Vji, which begin at compart-ment i, contain at least one medial cycle whichdoes not touch the origin or destination compart-ments, and end at compartment j. The return pathset, Pji, is the union of the simple return pathswith the return medial cycle path set.
Two subsequent passage meta-categories can beformed from the basic sets just defined. The termi-nal feedback cycle path set, notated, V%ii � j, is theconcatenation of the return path set, Pji, with the
Fig. 3. Diagram of the canonical path categories. Origin anddestination compartments are represented by circles. Medialcompartments are represented by squares. A solid-line squarerepresents a medial compartment ‘required’ by the definitionof the path category. A dotted-line square represents a ‘possi-ble’ medial compartment for the path category. The bottom ofthe figure shows a table of the major canonical path cate-gories. Aij indicates a set of acyclic paths from j to i. Vij
indicates a set of cyclic paths from j to i. The set unionoperation is indicated by the symbol: @ . The concatenationoperation is indicated by the symbol: �.

S.J. Whipple / Ecological Modelling 114 (1999) 251–274258
first passage path set, Fij. This path completes afeedback cycle by touching the origin compart-ment, j, for the second time. The second meta-cat-egory set is total mode 2 paths or the completecycle nexus at compartment i. This set, notated,V%%ii � j, is the union of the terminal non-feedbackcycles, Vii � j, with the terminal feedback cycle set,V%ii � j, as defined above, to give the complete termi-nal cycle nexus. A final derived set is the totalpath set, cij, which is the concatenation of the firstpassage Fij path set with the total subsequentpassage path set, V%%ii � j, to give the full set of pathspossible from j to i.
To summarize the total path set, a completeenumeration will be given. A particle leaves theorigin compartment j and travels by following thefirst passage path sets, non-feedforward cyclesconcatenated with either a simple root path or amedial cycle root path, to touch destination com-partment i for the first time. Upon leaving com-partment i, the particle may form a terminal cycleat i by two means. The first option is that theparticle could leave compartment i and touchsome medial compartment and return, withouttouching the origin compartment j, to complete aterminal non-feedback cycle. The second option isfor the particle to leave compartment i and travelto touch compartment j by the return paths, Pji,forming a feedback cycle, and then return tocompartment i by following paths in the firstpassage set to complete a terminal feedback cycle.
3.1.2. Operational path categoriesIn order to implement the canonical path type
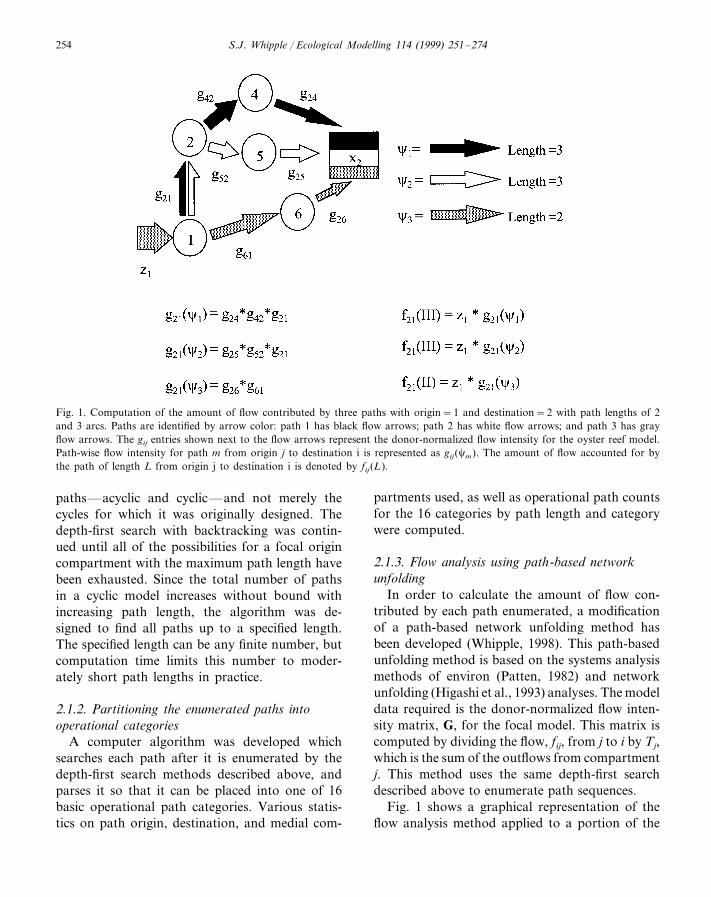
categorization with an ecosystem model it wasnecessary to construct an operational path classifi-cation scheme. There are eight basic categoriesand eight combination categories derived from thebasic categories with sixteen operational cate-gories for the entire classification system. Thesecategories are organized into higher level cate-gories based on the canonical path classificationdescribed above. In Figs. 4–6 the portion of thecanonical path structure described above relevantto the operational path category depicted isshown as a dotted-line arrow in the path diagrambelow each table. There are two major types of
operational path categories: cyclic pathwayswhere path endpoints are the same compartment:origin j= terminal i, and forward pathways wherethe path endpoints are not the same: origin j"terminal i.
The cyclic operational path categories with cat-egory names, notation, and examples of areshown in Fig. 4. The first category where j= i isthe set of simple cycles, denoted V( jj This setincludes those simple paths that begin and endwith the same compartment without touching anymedial compartment twice.The second categorywhere j= i is the nested cycle set, Vj�kmk 1�j wherethe origin and terminal compartments are thesame and there is at least one nested cycle at amedial compartment, km, which cannot touch theendpoint compartment. The third category wherej= i is the set of repeated cycles, (V( jj)t This setincludes paths where the endpoint compartment isencountered t times (t=1 to T) with no medialcompartments within the sub-path cycles re-peated. The repeated cycles must be discrete. Thefinal category where j= i, is the combination cate-gory of repeated and nested cycles (Vj�kmk 1�j)t inwhich the endpoint, j, is encountered t times (t=1to T), with at least one medial cycle at compart-ment km nested to form a cyclic sub-path.
The second major operational path category isforward paths, shown in Figs. 5–7, where theorigin and terminal compartments are not thesame. The two main categories of these forwardpaths are the first passage paths and the subse-quent passage terminal cycle paths. The threebasic and one combined first passage categorypath sets, their notation, and examples are shownin Fig. 5. The first category, Aij, of this set issimple acyclic paths, which are the paths from j toi in which no compartment is repeated. The sec-ond category is the set of origin cycle paths. Thesepaths include at least one cycle at the origincompartment, j, within which the destinationcompartment is not touched, and end with theterminal compartment i. The medial cycle pathset, the third category, includes at least one cycleat a medial compartment in which neither theorigin nor terminal compartment is touched. Thelast category is a combined one in which non-feedforward origin cycles and medial cycle sub-paths occur in the same j to i path.

S.J. Whipple / Ecological Modelling 114 (1999) 251–274 259
Fig. 4. Non-feedforward cycle pathways. The portion of the canonical path structure described above relevant to the operationalpath category depicted is shown as a dotted-line flow arrow in the path diagram below each table. For the example paths, thecompartments in boldface in the table are cycles nexuses. The concatenation operation is indicated by the symbol: �.
The second major forward operational pathcategory is the subsequent passage terminal cyclepath sets shown in Figs. 6 and 7. The subsequentpassage terminal cycle paths may be further di-vided into those paths that contain terminal non-feedback cycles and those that contain terminalfeedback cycles. The terminal non-feedback cyclepaths, their notation, and examples are given inFig. 6. There are one basic and three combinedterminal non-feedback categories. The terminalnon-feedback cycles includes paths which have atleast one cycle at the terminal node, i, which doesnot touch the origin compartment j, and does notcontain origin or medial cycles. Other sub-path
cycles may be nested within the terminal cycle.The three combined terminal non-feedback cyclepath categories contain at least one terminal non-feedback cycle as described above, and also con-tain origin or medial cycles as shown in Fig. 6.
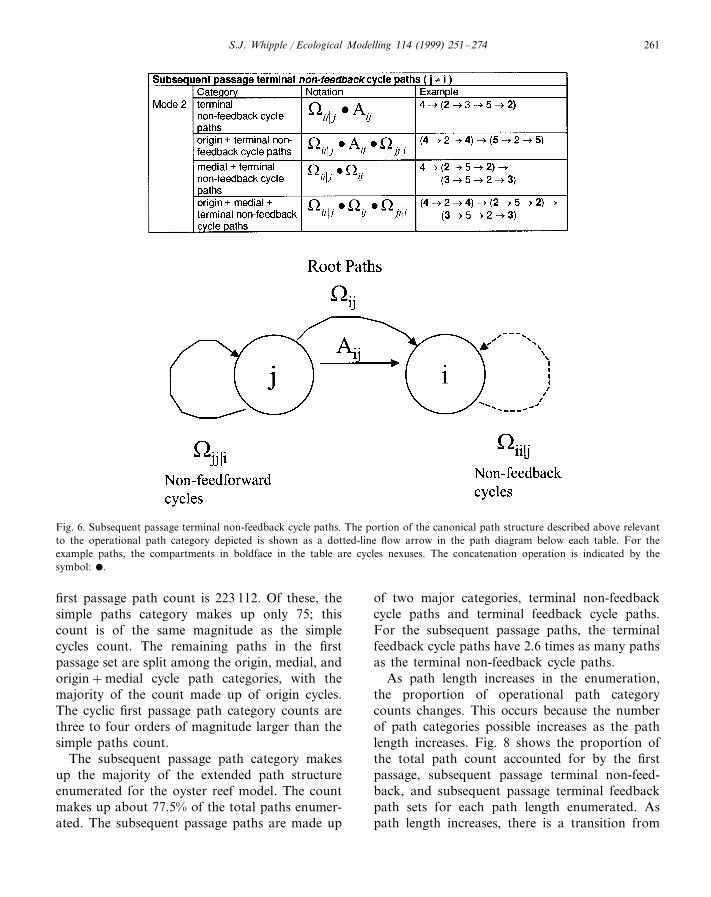
The other subsequent passage category is theterminal feedback cycle set. These categories, theirnotation, and examples are shown in Fig. 7. Inthe path diagram in the bottom half of the figurethe first-passage pathways are shown as solid-linearrows, and the subsequent passage pathways areshown as dotted-line arrows. There are one basicand three combined terminal feedback path cate-gories. The basic terminal feedback cycle path

S.J. Whipple / Ecological Modelling 114 (1999) 251–274260
Fig. 5. First passage paths. The portion of the canonical path structure described above relevant to the operational path categorydepicted is shown as a dotted-line flow arrow in the path diagram below each table. For the example paths, the compartments inboldface in the table are cycles nexuses. The concatenation operation is indicated by the symbol: �.
category includes paths which have at least onecycle at the terminal node, i, in which the originnode, j, is touched at least once, but which do notcontain any other origin or medial cycles. Othersub-path cycles may be nested within the terminalfeedback cycle. The three combined terminal feed-back cycle path categories contain at least oneterminal feedback cycle as described above, but alsocontain origin or medial cycles as shown in Fig. 7.
3.2. Path enumeration and classification
3.2.1. Summary of path counts for operationalcategories
The summary of the results for the path enumer-ation and categorization of the oyster reef model is
displayed in Table 1. A maximum path length of 17arcs was used for the enumeration because most ofthe initially introduced energy would be exhaustedthrough dissipation with paths less than or equal tothis length.
As shown at the bottom of Table 1, the totalcount for the enumeration is 4 653 646 distinctpaths. For paths where the origin=destination,shown in the upper section of Table 1, there are only33 simple cycles in the oyster model. However, forthe compound cycle path categories the counts arethree to four orders of magnitude greater than thecounts for the simple cycles.
The forward path categories (origin"destina-tion) show strikingly different results for the firstpassage and subsequent passage path sets. The total
S.J. Whipple / Ecological Modelling 114 (1999) 251–274 261
Fig. 6. Subsequent passage terminal non-feedback cycle paths. The portion of the canonical path structure described above relevantto the operational path category depicted is shown as a dotted-line flow arrow in the path diagram below each table. For theexample paths, the compartments in boldface in the table are cycles nexuses. The concatenation operation is indicated by thesymbol: �.
first passage path count is 223 112. Of these, thesimple paths category makes up only 75; thiscount is of the same magnitude as the simplecycles count. The remaining paths in the firstpassage set are split among the origin, medial, andorigin+medial cycle path categories, with themajority of the count made up of origin cycles.The cyclic first passage path category counts arethree to four orders of magnitude larger than thesimple paths count.
The subsequent passage path category makesup the majority of the extended path structureenumerated for the oyster reef model. The countmakes up about 77.5% of the total paths enumer-ated. The subsequent passage paths are made up
of two major categories, terminal non-feedbackcycle paths and terminal feedback cycle paths.For the subsequent passage paths, the terminalfeedback cycle paths have 2.6 times as many pathsas the terminal non-feedback cycle paths.
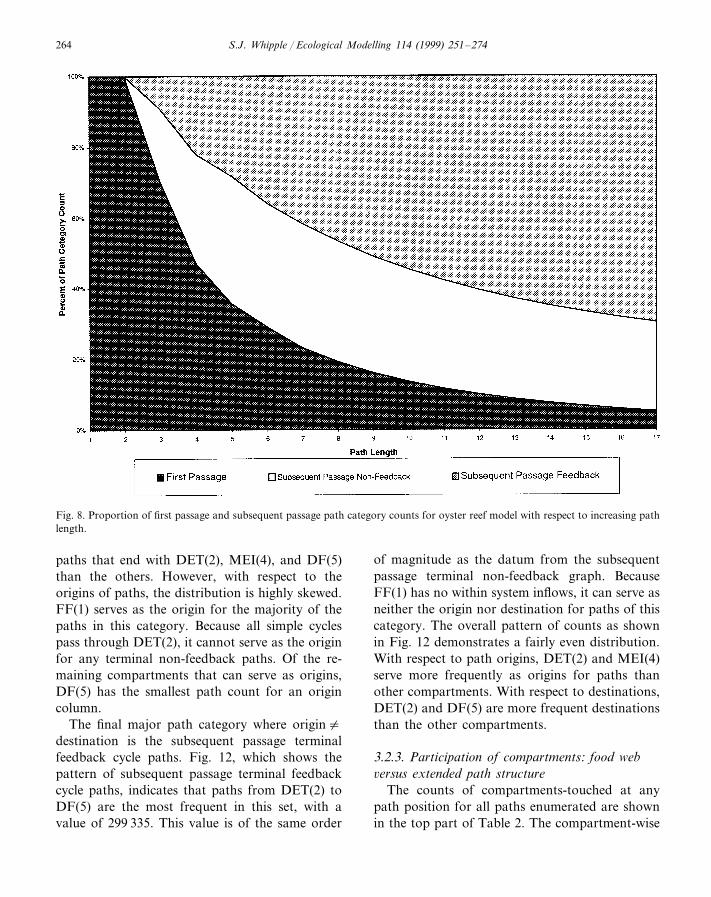
As path length increases in the enumeration,the proportion of operational path categorycounts changes. This occurs because the numberof path categories possible increases as the pathlength increases. Fig. 8 shows the proportion ofthe total path count accounted for by the firstpassage, subsequent passage terminal non-feed-back, and subsequent passage terminal feedbackpath sets for each path length enumerated. Aspath length increases, there is a transition from
S.J. Whipple / Ecological Modelling 114 (1999) 251–274262
Fig. 7. Subsequent passage terminal feedback cycle paths. For the example paths, the compartments in boldface in the table arecycles nexuses, and the origin compartments contained in the terminal feedback cycle are underlined. In the path diagram in thebottom half of the figure, the first-passage pathways are shown as solid-line flow arrows, and the subsequent passage pathways areshown as dotted-line flow arrows.
complete dominance of first passage paths for lowpath lengths, to a complete dominance by thesubsequent passage categories at path length 17arcs, with subsequent passage terminal feedbackcycle paths making up the over 60% of the pathsat this length.
3.2.2. Pattern of origin–destination path countmatrices
The pattern of path counts with respect toorigin and destination compartments provides in-sight into the structural organization revealed by
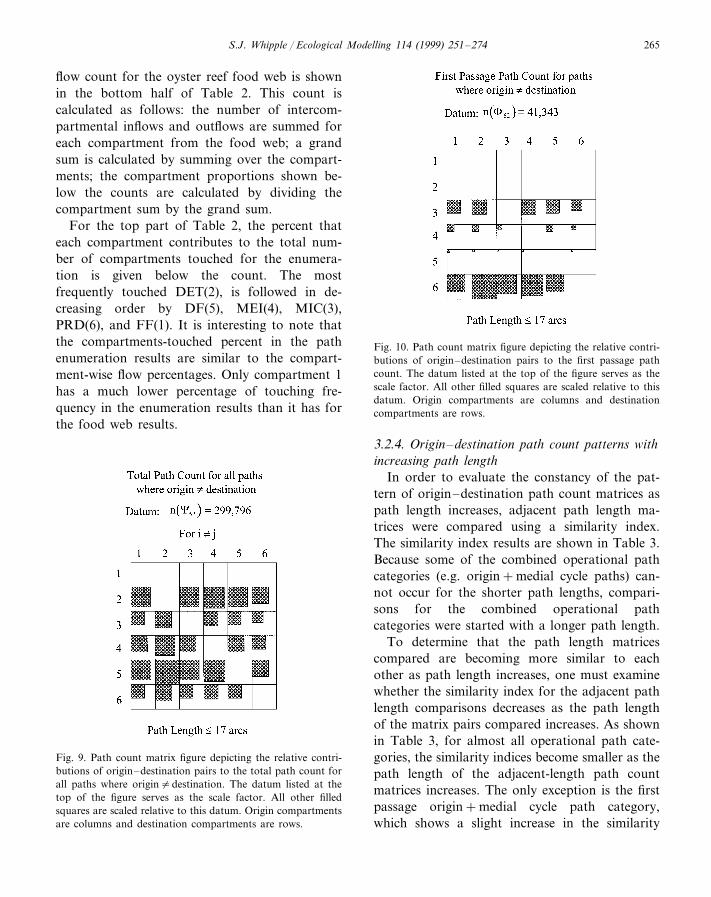
extended path analysis. Graphs of the operationalpath category counts were created in which theorigin compartments are represented as columnsand the destination compartments as rows (Figs.9–12). The datum at the top of each figure estab-lishes the scale for the figure. For example, in Fig.9, the datum is n(c52), indicating that the largestcount represented in this matrix is the path countat column 2, row 5, and its amount is 299 796paths, signified by this block of the matrix beingcompletely shaded. The shading in all of the othercells is scaled to this datum. Fig. 9 shows the total

S.J. Whipple / Ecological Modelling 114 (1999) 251–274 263
Table 1Summary of the total counts for the operational path categories for the oyster model for a path length 517 arcs
CategoryMajor category Path countSub-category
Origin=destination j= i33Simple cyclesSimple cycles Simple
Nested Nested cyclesCompound cycles 345 769Repeated Repeated 41 028
Nested+repeated cycles 437 960824 790Total cycles
Path countOrigin"destination j" iSimple Alpha pathsFirst passage 75
126 874Compound Origin cycle pathsMedial cycle paths 43 222
52 941Origin+medial cycle paths223 112Total first passage
Terminal non-feedback Terminal non-feedback cycle paths 649 864Subsequent passage56 524Origin+terminal non-feedback cycle paths
Medial+terminal non-feedback cycle paths 260 956Origin+medial+terminal non-feedback cycle paths 23 715
991 059Total terminal non-feedback
Terminal feedback cycle paths 1 818 117Subsequent passage Terminal feedbackOrigin+terminal feedback cycle paths 635 668
120 757Medial+terminal feedback cycle pathsOrigin+medial+terminal feedback cycle paths 40 143
2 614 685Total terminal feedback3 605 744Total subsequent passage
Total paths 4 653 646
count matrix for all paths where origin"destina-tion (i.e. non-diagonal blocks). The pattern shownis a fairly even distribution among origin anddestination compartments. There are slightlylarger counts for paths with DET(2) and DF(5) asdestinations. Also, no paths have FF(1) as adestination; this is true for all operational pathcategories because compartment 1 has no inflowsfrom other compartments in the oyster model; itsonly input is z1 from outside the system.
One could also examine the pattern of the pathcategory counts for the major operational pathcategories. Fig. 10 shows the results for the firstpassage path category counts. The datum for firstpassage paths is F62, and equals 41 343, which issmall when compared to the datum for all pathswith origin"destination just examined. Row 1 isempty due to lack of inflow to FF(1), as explainedabove. Row 2 appears empty because of the small
numbers of paths with DET(2) as a destination;among first passage paths, only acyclic or alphapaths have compartment 2 as a destination. Thegeneral pattern of Fig. 10 reveals that the com-partments used as destinations for first passagepaths in order from most to least frequent are:compartments PRD(6), MIC(3), MEI(4), DF(5),and DET(2). Compartments 2 and 4 are used asorigins more frequently than the othercompartments.
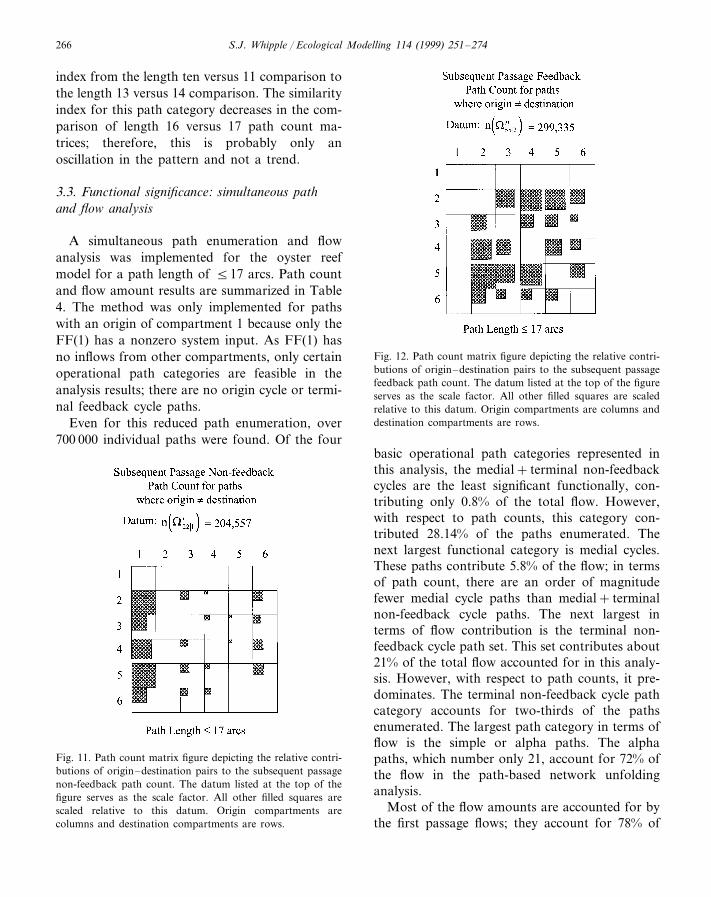
The subsequent passage terminal non-feedbackpath count pattern is shown in Fig. 11. Thedatum for this category, column 1 and row 2, is204 557; this is an order of magnitude larger thanthe datum for the first passage paths. The patternof path counts is quite different from that seen inthe first passage graph. Looking down the rows ofFig. 11, the distribution of path counts to destina-tions is fairly even. There are somewhat more
S.J. Whipple / Ecological Modelling 114 (1999) 251–274264
Fig. 8. Proportion of first passage and subsequent passage path category counts for oyster reef model with respect to increasing pathlength.
paths that end with DET(2), MEI(4), and DF(5)than the others. However, with respect to theorigins of paths, the distribution is highly skewed.FF(1) serves as the origin for the majority of thepaths in this category. Because all simple cyclespass through DET(2), it cannot serve as the originfor any terminal non-feedback paths. Of the re-maining compartments that can serve as origins,DF(5) has the smallest path count for an origincolumn.
The final major path category where origin"destination is the subsequent passage terminalfeedback cycle paths. Fig. 12, which shows thepattern of subsequent passage terminal feedbackcycle paths, indicates that paths from DET(2) toDF(5) are the most frequent in this set, with avalue of 299 335. This value is of the same order
of magnitude as the datum from the subsequentpassage terminal non-feedback graph. BecauseFF(1) has no within system inflows, it can serve asneither the origin nor destination for paths of thiscategory. The overall pattern of counts as shownin Fig. 12 demonstrates a fairly even distribution.With respect to path origins, DET(2) and MEI(4)serve more frequently as origins for paths thanother compartments. With respect to destinations,DET(2) and DF(5) are more frequent destinationsthan the other compartments.
3.2.3. Participation of compartments: food web6ersus extended path structure
The counts of compartments-touched at anypath position for all paths enumerated are shownin the top part of Table 2. The compartment-wise
S.J. Whipple / Ecological Modelling 114 (1999) 251–274 265
flow count for the oyster reef food web is shownin the bottom half of Table 2. This count iscalculated as follows: the number of intercom-partmental inflows and outflows are summed foreach compartment from the food web; a grandsum is calculated by summing over the compart-ments; the compartment proportions shown be-low the counts are calculated by dividing thecompartment sum by the grand sum.
For the top part of Table 2, the percent thateach compartment contributes to the total num-ber of compartments touched for the enumera-tion is given below the count. The mostfrequently touched DET(2), is followed in de-creasing order by DF(5), MEI(4), MIC(3),PRD(6), and FF(1). It is interesting to note thatthe compartments-touched percent in the pathenumeration results are similar to the compart-ment-wise flow percentages. Only compartment 1has a much lower percentage of touching fre-quency in the enumeration results than it has forthe food web results.
Fig. 10. Path count matrix figure depicting the relative contri-butions of origin–destination pairs to the first passage pathcount. The datum listed at the top of the figure serves as thescale factor. All other filled squares are scaled relative to thisdatum. Origin compartments are columns and destinationcompartments are rows.
3.2.4. Origin–destination path count patterns withincreasing path length
In order to evaluate the constancy of the pat-tern of origin–destination path count matrices aspath length increases, adjacent path length ma-trices were compared using a similarity index.The similarity index results are shown in Table 3.Because some of the combined operational pathcategories (e.g. origin+medial cycle paths) can-not occur for the shorter path lengths, compari-sons for the combined operational pathcategories were started with a longer path length.
To determine that the path length matricescompared are becoming more similar to eachother as path length increases, one must examinewhether the similarity index for the adjacent pathlength comparisons decreases as the path lengthof the matrix pairs compared increases. As shownin Table 3, for almost all operational path cate-gories, the similarity indices become smaller as thepath length of the adjacent-length path countmatrices increases. The only exception is the firstpassage origin+medial cycle path category,which shows a slight increase in the similarity
Fig. 9. Path count matrix figure depicting the relative contri-butions of origin–destination pairs to the total path count forall paths where origin"destination. The datum listed at thetop of the figure serves as the scale factor. All other filledsquares are scaled relative to this datum. Origin compartmentsare columns and destination compartments are rows.
S.J. Whipple / Ecological Modelling 114 (1999) 251–274266
index from the length ten versus 11 comparison tothe length 13 versus 14 comparison. The similarityindex for this path category decreases in the com-parison of length 16 versus 17 path count ma-trices; therefore, this is probably only anoscillation in the pattern and not a trend.
3.3. Functional significance: simultaneous pathand flow analysis
A simultaneous path enumeration and flowanalysis was implemented for the oyster reefmodel for a path length of 517 arcs. Path countand flow amount results are summarized in Table4. The method was only implemented for pathswith an origin of compartment 1 because only theFF(1) has a nonzero system input. As FF(1) hasno inflows from other compartments, only certainoperational path categories are feasible in theanalysis results; there are no origin cycle or termi-nal feedback cycle paths.
Even for this reduced path enumeration, over700 000 individual paths were found. Of the four
Fig. 12. Path count matrix figure depicting the relative contri-butions of origin–destination pairs to the subsequent passagefeedback path count. The datum listed at the top of the figureserves as the scale factor. All other filled squares are scaledrelative to this datum. Origin compartments are columns anddestination compartments are rows.
basic operational path categories represented inthis analysis, the medial+ terminal non-feedbackcycles are the least significant functionally, con-tributing only 0.8% of the total flow. However,with respect to path counts, this category con-tributed 28.14% of the paths enumerated. Thenext largest functional category is medial cycles.These paths contribute 5.8% of the flow; in termsof path count, there are an order of magnitudefewer medial cycle paths than medial+ terminalnon-feedback cycle paths. The next largest interms of flow contribution is the terminal non-feedback cycle path set. This set contributes about21% of the total flow accounted for in this analy-sis. However, with respect to path counts, it pre-dominates. The terminal non-feedback cycle pathcategory accounts for two-thirds of the pathsenumerated. The largest path category in terms offlow is the simple or alpha paths. The alphapaths, which number only 21, account for 72% ofthe flow in the path-based network unfoldinganalysis.
Most of the flow amounts are accounted for bythe first passage flows; they account for 78% of
Fig. 11. Path count matrix figure depicting the relative contri-butions of origin–destination pairs to the subsequent passagenon-feedback path count. The datum listed at the top of thefigure serves as the scale factor. All other filled squares arescaled relative to this datum. Origin compartments arecolumns and destination compartments are rows.

S.J. Whipple / Ecological Modelling 114 (1999) 251–274 267
Fig. 13. The top graph shows a double-axis plot, with a bar graph of the proportion of total flow contributed by the four operationalpath categories shown, and a line graph of the total flow plotted against path length. The left-hand axis is the proportion ordinate;the right-hand axis is the flow ordinate with units of kcal m−2 day−1. The bottom graph shows the total path count enumeratedfor the oyster model with only compartment 1 as origin for paths of length 517 arcs plotted against path length.

S.J. Whipple / Ecological Modelling 114 (1999) 251–274268
Table 2Participation of compartments: extended path structure versus food web in oyster reef model*
4 5 61 2 Total3
Counts of compartments touched and their percentage distribution from oyster model path enumeration6 646 085 79 711 754739 167 28 307 580 9 365 053 15 271 971 19 381 898
19.16% 24.31% 8.34%0.93% 35.51% 11.75%
Sum of intercompartmental inflows and outflows for each compartment and their percentage distribution by compartmentfrom the oyster model food web
4 5 3 242 7 316.67% 20.83% 12.50%8.3% 29.17% 12.5%
* Frequency distribution of compartments touched in any path for the oyster reef model is shown in the top half of the table.Frequency distribution of direct intercompartment flows is shown in the bottom half of the table.
the flow in the unfolding analysis, with the vastmajority of this accounted for by the alpha paths.However, the subsequent passage non-feedbackcycle set makes a significant contribution to thefunction of the oyster reef model system, account-ing for 22% of the flow. The total cyclic path set,which includes first passage and subsequent pas-sage cycles, accounts for 11.7 kcal m−2 day−1, or27.7% of the total flow.
Fig. 13 depicts a bar graph of the proportion offlow accounted for by the four operational pathcategories at each path length enumerated, alongwith a line graph indicating the amount of flowoccurring for paths of each length enumerated.The alpha paths contribute most of the flow forshort path lengths. Since alpha path length islimited to 5 arcs (n−1, n=6), their contributionis truncated there. The flow contribution of themedial cycle first-passage paths peaks at pathlength 4 arcs, and then declines to less than 5% bypath length 17 arcs. The subsequent passage ter-minal non-feedback cycle paths begin to provide asignificant proportion of the flow at path length 3arcs, and dominate the flow proportion after pathlength 5 arcs, though with small and diminishingflows per individual path as lengths increase. It isinteresting to note that the terminal non-feedbackcycles, which can only begin at path length 3 arcsby their definition, contribute a fairly constantproportion of the flow by path length 5 arcs, andmaintain this through path-length 17 arcs. Theother subsequent passage path set, medial+ ter-minal non-feedback paths, shows a gradual rise in
its flow proportion as path length increases. Thetotal flow declines rapidly as path length increasesso that, for example, the total flow accounted forby all paths of length 7 arcs is less than 1 kcalm−2 day−1. Despite this, as shown in the bottomgraph shown in Fig. 13, enormous numbers ofsubsequent passage terminal non-feedback cyclesaccumulate at the higher path lengths.
4. Discussion and conclusions
4.1. Path classification scheme
4.1.1. Canonical path classificationThe main contribution of the canonical path
category results is to refine the notation of theoriginal ecological path classification developed inPatten et al. (1989), Patten et al. (1990) andHigashi et al. (1993). The first refinement is thecompletion of the categorization so that it isexplicitly symmetrical. The classification of Pattenet al. (1990) did not include the explicit acyclicreturn path category, Aji, of the current classifica-tion. Therefore, the current classification presentsa symmetrical forward path, Pij, and return path,Pji, classification. The second refinement to thecanonical path classification is the inclusion of anexplicit reference term in the non-feedforward cy-cles and non-feedback cycles. For the non-feed-forward cycles, Vjj �i, the reference compartment iindicates that the origin cycles at j cannot touchcompartment i. The reference compartment j in

S.J. Whipple / Ecological Modelling 114 (1999) 251–274 269
Tab
le3
Sim
ilari
tyin
dex
resu
lts
for
com
pari
sons
ofca
tego
ryco
unt
mat
rice
sfo
rdi
ffer
ent
path
leng
thsa
Maj
orca
tego
ryP
ath
cate
gory
Len
gth
4L
engt
h16
Len
gth
7L
engt
h13
Len
gth
10ve
rsus
14ve
rsus
8ve
rsus
11ve
rsus
17ve
rsus
5
Ori
gin
cycl
epa
ths
3.69
E-0
11.
87E
-02
Fir
stpa
ssag
e9.
79E
-03
4.49
E-0
32.
83E
-03
Med
ial
cycl
epa
ths
5.04
E-0
13.
27E
-02
Cyc
lepa
ths
1.98
E-0
21.
20E
-02
7.39
E-0
3O
rigi
n+m
edia
lcy
cle
path
s*
*2.
52E
-03
3.36
E-0
31.
91E
-03
Ter
min
alno
n-fe
edba
ckcy
cle
path
s3.
73E
-01
Subs
eque
nt1.
30E
-02
8.22
E-0
35.
42E
-03
3.65
E-0
3P
assa
geO
rigi
n+te
rmin
alno
n-fe
edba
ckcy
cle
path
s*
*1.
24E
-02
8.06
E-0
35.
88E
-03
Med
ial+
term
inal
non-
feed
back
cycl
epa
ths
**
Non
-fee
dbac
k8.
68E
-03
5.06
E-0
33.
24E
-03
Ori
gin+
med
ial+
term
inal
non-
feed
back
cycl
epa
ths
**
5.50
E-0
25.
43E
-03
3.36
E-0
3
Ter
min
alfe
edba
ckcy
cle
path
s4.
18E
-01
Subs
eque
nt6.
41E
-03
1.05
E-0
33.
44E
-04
1.45
E-0
4P
assa
geO
rigi
n+te
rmin
alfe
edba
ckcy
cle
path
s*
*7.
28E
-03
1.80
E-0
37.
13E
-04
Med
ial+
term
inal
feed
back
cycl
epa
ths
**
Fee
dbac
k5.
37E
-03
1.14
E-0
34.
74E
-04
Ori
gin+
med
ial+
term
inal
feed
back
cycl
epa
ths
**
3.13
E-0
17.
66E
-03
2.08
E-0
3
aP
ath
leng
thin
crea
ses
from
left
tori
ght
acro
ssco
lum
ns.
*In
dica
teth
ata
com
pari
son
cann
otbe
mad
efo
rth
eca
tego
ryan
dpa
thle
ngth
sin
dica
ted.

S.J. Whipple / Ecological Modelling 114 (1999) 251–274270
Table 4Comparison of the structural and functional significance of the operational path categories for paths with origin=1 for pathlength517 arcs using simultaneous path and flow analysis
Path counts Total flow accounted for by major operationalTotal flow accounted for by pathForward ( j" i ) pathpath category (kcal m−2 day−1)categories category (kcal m−2 day−1)
21 (0.0028%)Alpha paths First passage30.5015 (72.28%)37 815 (5.12%) 2.4458 (5.8%)Medial cycle paths 32.95 (78%)
8.9162 (21.13%)493 308 (66.74%)Terminal non-feedback Subsequent passage208 023 (28.14%) 9.25 (22%)0.3385 (0.8%)Medial+terminal
non-feedback
739 146 (99.997%)Forward and non- 11.70 (27.7%)feedforward cycles
42.20739 167Totals
the non-feedback cycles, Vii � j, indicates that theterminal cycles at i cannot touch the origin com-partment j. In both cases, selection of anotherreference compartment, for example k, wouldchange the sets in question. That is, Vjj �i"Vjj �kand Vii � j"Vii �k..
4.1.2. Operational path categorizationThe major contribution of the operational path
categorization scheme is to enable implementationof the concepts embodied in the canonical pathclassification. The operational path categories,like the canonical path classification, are generaland could be implemented for any food webmodel within the computational constraints previ-ously discussed. Because the operational pathclassification was developed in the context of asystems theory approach to ecology, the analysisresults may be related to other systems theorymethods such as environ and network unfoldinganalyses.
4.2. Implications of the oyster reef pathenumeration
The oyster reef model used for the operationalpath enumeration and classification is a small-scale ecosystem model with only six compart-ments and twelve direct intercompartmentalconnections. Despite this model’s seeming simplic-ity, it actually contains 4 653 646 paths with a
path length of less than or equal to 17 arcs, whichaccount for most of the flow. The extended pathstructure of even this simple model is quiteextensive.
The acyclic or alpha paths, which are the onlyones possible in acyclic models, make up a smallpercentage of the extended path structure of thecyclic oyster model. The simple cycles are alsovery few in this model.
However, the implications of the presence ofcycles is apparent in the path counts for the cyclicfirst passage paths, and is even more dramatic forthe cyclic subsequent passage path counts. Of thepaths enumerated for the oyster model, about77% are subsequent passage terminal cycle paths.These represent energy that leaves the origin com-partment and reaches a terminal compartment,then cycles to touch the terminal compartment atleast once more. For terminal feedback cyclepaths, the energy feeds back to the origin com-partment, touching it at least once more in itspathway through the system. The importance offeedback as a control mechanism in dynamicalsystems is well known (e.g. Forrester, 1961; Pat-ten, 1964; Watt, 1968; Van Dyne, 1969), and thenumerical dominance of terminal feedback cyclesin this path enumeration provides strong micro-scopic structural evidence for the dominance offeedback control in this oyster reef ecosystemmodel.

S.J. Whipple / Ecological Modelling 114 (1999) 251–274 271
The subsequent passage terminal cycles, partic-ularly the terminal feedback cycles, rise to domi-nance in the path enumeration as path lengthincreases. If the path arcs were assumed to requiretime intervals for energy transfer between com-partments, and the oyster model structure re-mained the same, the influence of subsequentpassage path categories, particularly terminalfeedback cycles, would become greater as theexistence time of the oyster reef model increased.The predominance of these subsequent passagepaths by path number provides evidence of astructural mechanism of feedback control in cyclicecosystem networks.
4.2.1. Origin–destination path count patternsOrigin–destination path count patterns provide
another means by which extended path analysisprovides insight into model system structure. Thedistribution of origin–destination path counts forthe total path count where origin"destination isfairly even. FF(1), which has no intra-system infl-ows, is the only exception.
When the origin–destination path count pat-tern is examined for the major operational pathcategories, a number of different patterns emerge.The patterns observed for the origin–destinationpath category counts are a combination of theinfluence of path category definition and thestructure of the model under analysis. The firstpassage path count pattern illustrates strong ef-fects of model structure and operational pathcategory constraints. An example of path cate-gory constraints is the apparently empty row 2 ofFig. 10. Row 2 has non-visible, but very smallcount entries because only acyclic first-passagepaths can terminate with DET(2), because it ap-pears as a cycle nexus or medial compartment inall of the simple cycles. The high frequency ofPRD(6) destinations for cyclic first passage pathsis explained in part by the fact that PRD(6) servesas a simple cycle nexus very few times. Becausecompartment 6 is seldom a cycle nexus, it is morelikely to serve as the destination for first passagepaths, which do not allow terminal cycles.
The general pattern observed for the subse-quent passage non-feedback path is also a combi-
nation of path structure and path categoryconstraints. FF(1) serves as the origin for subse-quent passage non-feedback paths more oftenthan do the other compartments. This is becausecompartment 1 does not form cycles with anypath, so that all paths with terminal cycles andcompartment 1 as origin must be terminal non-feedback cycle paths.
The pattern seen for subsequent passage termi-nal feedback cycle paths is attributable primarilyto the simple cycle frequency of DET(2), and thatcompartment 2 is touched by all simple cycles inthe oyster model. These features produce highercounts for the subsequent passage terminal feed-back paths with DET(2) as the origin or destina-tion compartment.
The origin–destination path count patterns re-sults show very different patterns in comparingthe first passage and subsequent passage non-feedback and feedback cycle path categories. Fig.10 shows a distribution of path counts that isskewed toward two destination compartments—predators (6) and microbiota (3). If one imaginesa first-time pass through the system, these com-partments as destinations follow from ecologicalintuition. PRD(6) serves as the top predator ofthe food chains involving the small detritivores,primary predators, and omnivores in the foodweb. If paths representing only one pass throughthe system are considered, most should terminatewith compartment 6. These are the results foundfor the first passage origin–destination path countpattern.
In contrast, the subsequent passage origin–des-tination pattern for the terminal feedback cyclepaths has a much more even or homogenizeddistribution. The subsequent passage terminalfeedback cycle paths form cycles at the destina-tion compartment, within which the origin com-partment is touched. Therefore, matter that hascome into the system and passed through subse-quent passage paths has passed through the eco-logical circuits more than once. As a result, thepath count patterns represent the visiting of multi-ple compartments in the model by the matteroriginally input into FF(1). The graphic result ofthis process is that the subsequent passage termi-
S.J. Whipple / Ecological Modelling 114 (1999) 251–274272
nal feedback origin–destination path count ma-trix has a more even appearance than the firstpassage matrix.
The path analysis results described aboveprovide support by analogy for the network ho-mogenization concept that was proposed and ex-amined in environ and network unfolding analysis(Patten, 1985b; Patten et al., 1989, 1990; Higashiet al., 1993). Briefly, the environ analysis resultsshowed that the ultimate utilization coefficients ofN matrices take on more uniform values whencompared to the analogous G matrices that repre-sent only the direct interactions of a model. Theextended path analysis results can be related tothe environ theory results by comparing theorigin–destination path count patterns for thefirst-passage path set with those of the subsequentpassage terminal feedback path set. The first pas-sage path set represents the initial pass-throughfor matter in the system. Therefore, the first pas-sage paths are analogous to the G matrices ofenviron theory. For the subsequent passage termi-nal feedback paths, matter has undergone morethan one circuit in the ecosystem, and this pathset is analogous to the ultimate utilization coeffi-cient N matrix of environ theory. Similar to theN–G comparison, the subsequent passage termi-nal feedback path count matrix is more uniformthan the first passage path count matrix. By thisanalogy, the path count pattern results provideevidence in support of the network homogeniza-tion hypothesis.
4.2.2. Compartment participation: first-orderstructure 6ersus extended path structure
Another way of comparing the extended pathstructure to the direct path structure is to com-pare the frequency of compartment ‘hits’ in thepath enumeration with the number of direct infl-ows and outflows to compartments in the model.The compartment touching probability, as repre-sented by the percentage of compartment ‘hits’ inthe path enumeration, agrees fairly well with theset of compartment percentages calculated usingthe direct flow matrix. The exception is FF(1),which shows a very different percentage for thetwo measures. Because compartment 1 lacks
within-system inflows, it cannot participate in thelarge number of terminal feedback paths, andtherefore participates in the extended path struc-ture of the model less than its direct flow com-partment-touching probability would predict. Incontrast, the other compartments, which are morefully articulated in the model structure, partici-pate in the extended path structure about as muchas their direct flows would predict.
In ecosystem ecology, the term ‘detritus-basedecosystems’ has been used to describe the trophicdynamics of many systems (e.g. Odum and de laCruz, 1967; Odum and Heald, 1975; Moran et al.,1988; Sherr et al., 1988). Oyster model path anal-ysis results show that deposited detritus (2) wasthe most frequently touched medial compartmentfor all operational path categories. As Table 2shows, DET(2) has the highest touching percent-age in the oyster model path enumeration. Thecentral important role played by the detritus com-partment in the expression of extended path struc-ture in the oyster model provides evidence of astructural foundation for detritus-basedecosystems.
4.2.3. Constancy of origin–destination path countpatterns with increasing path length
The trend in similarity index scores for pairedmatrices of adjacent path lengths with increasingpath length characterizes how the pattern oforigin–destination path counts changes with in-creasing path length. If the similarity index foradjacent path length matrix count pairs decreasesas the path lengths compared increased, thiswould indicate that the origin–destination pathcount matrix pattern becomes less variable withincreasing path length. This is the outcome ob-served for the oyster model.
This result indicates that the changes in thepath length origin–destination pattern representsan asymptotic process in which the pattern estab-lished for each operational path category remainsstable and changes less and less as the path lengthincreases. Therefore, the proliferation of pathnumbers with increasing path length creates acertain pattern for each of the operational pathcategories, and once this pattern becomes estab-lished, it remains very similar for the longer path

S.J. Whipple / Ecological Modelling 114 (1999) 251–274 273
lengths. The patterns shown by the origin–desti-nation path count matrices represent a fundamen-tal expression of the direct and indirect pathstructure of the model. Since the paths enumer-ated for the quantified version of the oyster modelcarry an increment of energy from origin to desti-nation for any focal path enumerated, the pat-terns of the path counts as described in thischapter also have important implications for thefunctional characteristics of this model.
4.3. Functional significance: path structure andflows
The most important result that emerges fromthe simultaneous path and flow analysis is thefinding of a significant functional role played bycycles in general, and the subsequent passageterminal non-feedback cycles in particular. In theoyster model, a subsequent passage terminal non-feedback cycle’s flow contribution to total func-tion represents a contribution of energy thatenters the system at compartment 1, reaches theterminal compartment, and then travels to an-other medial compartment to return at least oncemore to the terminal compartment. This amountquantifies the functional importance of the subse-quent passage path category.
Most of the energy in the oyster model (78%),as accounted for by path-based flow analysis,enters at compartment 1 and touches a destina-tion compartment only once before exiting thesystem. The path counts for these first passageflows are much fewer than the subsequent passagepath counts. In fact, the first passage paths con-tribute less than 6% of the total origin 1 pathsenumerated.
Structural mechanisms that contribute to thefunctional significance of the various path cate-gories are demonstrated in Fig. 13. The domi-nance of system flow by the first passage alphapaths and medial cycle paths of short lengths isconsistent with the low (11%) cycling index (Finn,1978) of this model. The first passage path cate-gory functional contribution is made with smallnumbers of short paths where the path-wise flowcontribution is large. This mechanism producesthe large first passage flow proportions seen for
path lengths B7 arcs. However, a transition oc-curs at about path length 7 arcs, and continues upto the maximum computed path length of 17 arcs.The transition is from a dominance of flow pro-portion by first passage paths to a dominance offlow proportion by subsequent passage paths. Thenumber of subsequent passage paths is very large,accounting for about 95% of the paths enumer-ated in the functional analysis. In addition, thepath numbers increase to very large numbers forthe longer path lengths.
Therefore, one of the mechanisms which pro-duces the functional contribution of the subse-quent passage paths is a large number of paths,each contributing a small path-wise flow to thefunctional path category total (Patten, 1985a).The paths of length 7–17 arcs in the oyster modelanalysis contribute 1.84 kcal m−2 day−1, whichaccounts for 4.3% of the total flow, and 15.7% ofthe total cyclic paths flow. The proliferation ofvery large numbers of these long paths, eachmaking a very small contribution, helps to pro-duce the significant (22%) flow contribution of thesubsequent passage paths. Therefore, due to cy-cling in the system, the numerous long paths inthe extended path structure of this ecosystemmodel are significant in its function.
These results provide microscopic evidence forthe macroscopic results of environ analysis (e.g.Patten, 1982, 1985a,b), which implicate cycling asan important ecosystem attribute in the mecha-nisms of holistic system determination. Theseprinciples, demonstrated here for a model with alow cycling index, would probably be even moresignificant for a model with high cycling index.These results form a link between the extendedstructure of food webs and their functioning asrepresented by the flow analysis results. Thepresent analysis establishes that extended pathstructure, and the component articulation fromwhich it is generated, have significant conse-quences for ecosystem function.
Acknowledgements
This work was a part of my doctoral disserta-tion, and it was completed while I was a student

S.J. Whipple / Ecological Modelling 114 (1999) 251–274274
at the Institute of Ecology, University of Georgia,USA. I would like to thank the faculty, staff, andstudents for various types of assistance that theyprovided during my tenure there. I thank ThelmaRichardson of the Institute of Ecology for com-puter-related assistance. I thank Steve Rathbun ofthe Statistics Department at the University ofGeorgia for assistance in the development of thesimilarity index formula. I would especially like tothank my adviser Professor Bernard C. Patten forencouraging me to tackle this problem, and forhis many hours of help in completing this contri-bution to its elucidation.
References
Briand, F., 1983. Environmental control of food web struc-ture. Ecol. 64, 253–263.
Cohen, J.E., 1978. Food Webs and Niche Space. PrincetonUniversity Press, Princeton, NJ.
Cohen, J.E., Briand, F., Newman, C., 1986. A stochastictheory of community food webs. III. Predicted and ob-served lengths of food chains. Proc. Roy. Soc. Lond. B.228, 317–353.
Cohen, J.E., Briand, F., Newman, C.M., 1990. CommunityFood Webs: Data and Theory. Springer-Verlag, Berlin.
Dame, R.F., Patten, B.C., 1981. Analysis of energy flows in anintertidal oyster reef. Mar. Ecol. Prog. Ser. 5, 115–124.
Finn, J.T., 1978. Cycling index: a general definition of cyclingin compartment models. In: Adriano, D.C., Brisbin, I.L.(Eds.), Environmental Chemistry and Cycling ProcessesSymposium. US Energy Research and Development Asso-ciation, Washington, D.C, pp. 138–164.
Forrester, J.W., 1961. Industrial Dynamics. MIT Press, Cam-bridge, MA.
Gallopin, G.C., 1972. Structural properties of food webs. In:Patten, B.C. (Ed.), Systems Analysis and Simulation inEcology, vol. 2. Academic Press, New York, pp. 241–282.
Hall, S.J., Raffaelli, D.G., 1991. Food web patterns: lessonsfrom a species rich web. J. Anim. Ecol. 60, 823–841.
Higashi, M., Patten, B.C., Burns, T.P., 1993. Network trophicdynamics: the modes of energy utilization in ecosystems.Ecol. Modell. 66, 1–42.
Martinez, N., 1991. Artifact or attribute? Effects of resolutionon the Little Rock Lake food web. Ecol. Monogr. 61,367–392.
Moran, M.A., Legovic, T., Benner, R., Hodson, R.E., 1988.Carbon flow from lignocellulose: a simulation analysis of adetritus-based ecosystem. Ecology 69, 1525–1536.
Odum, E.P., de la Cruz, A.A., 1967. Particulate organicdetritus in a Georgia salt marsh-estuarine ecosystem. In:Lauff, G.H. (Ed.), Estuaries, vol. 53. American Associa-tion for the Advancement of Science, Washington, D.C,pp. 383–388.
Odum, W.E., Heald, E.J., 1975. The detritus-based food webof an estuarine mangrove community. In: Cronin, L.E.(Ed.), Estuarine Research, vol. 1. Academic Press, NewYork, pp. 265–286.
Patten, B.C., 1964. The Systems Approach in Radiation Ecol-ogy. Oak Ridge National Laboratory Report No. ORNL/TM-1008, Oak Ridge, TN, 19 pp.
Patten, B.C., 1982. Environs: relativistic elementary particlesfor ecology. Am. Nat. 119, 179–219.
Patten, B.C., 1985a. Energy cycling in the ecosystem. Ecol.Modell. 28, 1–71.
Patten, B.C., 1985b. Energy cycling, length of food chains anddirect versus indirect effects in ecosystems. Can. Bull. Fish.Aquat. Sci. 213, 119–138.
Patten, B.C., Higashi, M., Burns, T.P., 1989. Network trophicdynamics: the food web of an Okefenokee swamp aquaticbed marsh. In: Sharitz, R.R., Gibbons, J.W. (Eds.), Fresh-water Wetlands and Wildlife: Perspectives on Natural,Managed, and Degraded Ecosystems, vol. 61. Office ofScientific and Technical Information, U.S. Department ofEnergy, Oak Ridge, TN, pp. 401–424.
Patten, B.C., Higashi, M., Burns, T.P., 1990. Trophic dynam-ics in ecosystem networks: significance of cycles and stor-age. Ecol. Model. 51, 1–28.
Pimm, S.L., 1982. Food Webs. Chapman and Hall, London.Pimm, S.L., Lawton, J.H., Cohen, J.E., 1991. Food web
patterns and their consequences. Nature 350, 669–674.Polis, G.A., 1991. Complex trophic interactions in deserts: an
empirical critique of food-web theory. Am. Nat. 138, 123–155.
Polis, G.A., 1994. Food webs, trophic cascades, and commu-nity structure. Aust. J. Ecol. 19, 121–136.
Polis, G.A., 1995. Complex food webs. In: Patten, B.C.,Jorgensen, S.E. (Eds.), Complex Ecology: the Part-WholeRelation in Ecosystems. Prentice Hall, Englewood Cliffs,NJ, pp. 513–548.
Schoenly, K., Beaver, R., Heumier, T., 1991. On the trophicrelationships of insects: a food web approach. Am. Nat.137, 597–638.
Sherr, B.F., Sherr, E.B., Hopkinson, C.S., 1988. Trophic inter-actions within pelagic microbial communities: indicationsof feedback regulation of carbon flow. Hydrobiology 159,19–26.
Ulanowicz, R.E., 1983. Identifying the structure of cycling inecosystems. Math. Biosci. 65, 219–237.
Ulanowicz, R.E., 1986. Growth and Development: EcosystemsPhenomenology. Springer-Verlag, New York.
Ulanowicz, R.E., Kay, J.J., 1991. A package for the analysisof ecosystem flow networks. Environ. Softw. 6, 131–142.
Van Dyne, G.M., 1969. Grasslands Management, Research,and Training Viewed in a Systems Context. Range ScienceDepartment, Science Series, no. 3. Colorado State Univer-sity, Fort Collins, CO, 50 pp.
Watt, K.E.F., 1968. Ecology and Resource Management. Mc-Graw-Hill, New York.
Whipple, S.J., 1998. Path-based network unfolding: a solutionfor the problem of mixed trophic and nontrophic processesin trophic dynamic analysis. J. Theor. Biol. 190, 263–276.