analysis of investment behaviour of individual investors ... · the aim of the study is analysis of...
TRANSCRIPT

www.pbr.co.in
Analysis of Investment Behaviour of Individual Investors of Stock Market:
A Study in Selected Districts of West Bengal
Pacific Business Review InternationalVolume 10 Issue 7, January 2018
07
Abstract
The study is an analysis of investment behaviour of individual investors of stock market to enquire whether there is any impact of three independent variables namely Demographic Factors, Awareness and Perceived Risk Attitude on only one dependent variable Investment Behaviour. The study has collected primary data from 400 randomly selected individual investors of stock market from various districts of West Bengal using a structured questionnaire on five point Likert scale. The study finds that the awareness levels of the individual investors are on moderate level and financial awareness is more than social learning. Perceived Risk Attitude is mainly guided by Affect rather than Cognition. The analysis indicate that Demographic Factors, Awareness and Perceived Risk Attitude significantly influence Investment Behaviour of individual investors of stock market.
Keywords: Stock Market, Behavioural Finance, Demographic Factors, Awareness, Perceived Risk Attitude
JEL classification: G1, G02
Introduction
Investors are the backbone of capital market. A developing economy, like India, needs a growing amount of savings to flow to corporate enterprises. The level of equity market participation of the retail investors has been increasing over the past few years. Investment is the flow of capital which is used for productive purposes. There is a great emphasis on investment for being the primary instrument of economic growth and development for a country. There are a large number of investment instruments available today. Some of them are marketable and liquid while others are non-marketable and illiquid. There are instruments which are highly risky while others are almost riskless. The investors choose avenues, depending upon their specific need, risk appetite, and return expected. Investment avenues can broadly be categorized into two spheres, namely, economic investment and financial investment. Purchasing of a physical asset such as a building or equipment is an economic investment. Economic investments contribute to the net additions to the capital stock of a society. Financial investments, on the other hand, refer to investment in financial instruments like shares, debentures, insurance policies, mutual fund units etc. Financial investments help in creating the capital stock of the country. In the long term, investment is important for improving productivity and increasing the competitiveness of an economy.
Arup Kumar SarkarAssistant Professor
Department of Commerce
Sidho-Kanho-Birsha University, Purulia
West Bengal, India
Dr. Tarak Nath SahuAssistant Professor
Department of Commerce with
Farm Management
Vidyasagar University
Midnapore
West Bengal, India

www.pbr.co.inwww.pbr.co.in
Pacific Business Review International
08
Without investment, an economy could enjoy high levels of consumption, but this creates an unbalanced economy. The states having more commitments to investment are more progressive. In India, few states have created a niche for economic development, the main reason being that they attracted large investments. As investments have a ‘multiplier’ effect, they generate income and employment and create demand and consumption.
This study has been done to know the impact of Demographic Factors, Awareness and Perceived Risk Attitude on Investment Behaviour in stock market and the study is made in the context of individual investors of different districts of West Bengal.
Literature Review
Review of earlier studies helps a researcher to get a research idea. A critical and systematic review of existing studies on same area or in some other areas helps the researcher to develop an in-depth understanding and insight into the relevant previous studies and have an understanding on current state of knowledge on the topic and also to explore the research gap.
Nayak (2010) seeks to examine the nature of investor’s grievances and also to evaluate the role of grievance redressal agencies. Using convenient random sampling technique he collects primary data on the investor’s demographic profile, knowledge about various grievances, awareness about the functions of various grievances redressal agencies, loading of complain and their satisfaction level in Valsad district of Gujarat State. By using chi square analysis he shows that there is significant difference between the various demographic variables and investor’s knowledge of grievances, awareness of functions of redressal agencies, loading of complain and their satisfaction level. Varadharajan and Vikkraman (2011) focus on identifying the investors’ perceptions towards investment decision in equity market. Using ANOVA on a sample size of 50 investors in Coimbatore they study their attitude towards selection of stock, company, risk, equity portfolio, financial affairs and their expected return. They find that there exists an independency between the demographics, majority of the factors and the returns obtained. Kadariya (2012) analyzes the market reactions to tangible information and intangible information in Nepalese stock market to examine the investors’ opinions in Nepalese stock market issues. After analysis of a sample of 185 stock investors he finds that the capital structure and average pricing method is one factor that influence the investment decisions, the next is political and media coverage, the third factor is belief on luck and the financial education, and finally the forth component for stock market movement is trend analysis. Thus, he concludes that both the tangible and intangible information are essential to succeed in Nepalese capital market. Hon (2012) investigates the behaviour of
small investors in Hong Kong’s derivatives markets. The study period covers the global economic crisis of 2011- 2012, and he focuses on small investors’ behaviour during and after the crisis. He attempts to identify and analyse the key factors that capture small investor’s behaviour in derivatives markets in Hong Kong. He collects data 524 respondents through a questionnaire survey. Exploratory factor analysis rotated principal component loadings, scree test, KMO and Bartlett’s test, and a reliability test show that the behaviour of small investors in derivatives markets in Hong Kong consistently indicates the ascending order of importance of return performance, reference group, and personal background. Chaudhary (2013) examines the meaning and importance of behavioural finance and its application in investment decisions. He has also discussed some trading approaches for investors in stocks and bonds to assist them in manifesting and controlling their psychological roadblocks. Ngoc (2014) aim to investigate behavioural factors influencing the decisions of individual investors at the Securities Companies in Ho Chi Minh City, Vietnam. He collects data from 188 individual investors with a response rate of 63%. There are five behavioural factors of individual investors at the Ho Chi Minh Stock Exchange: Herding, Market, Prospect, Overconfidence-gamble’s fallacy, and Anchoring-ability bias. The herding factor includes behavioural dimensions: following the decisions of the other investors (buying and selling, choice of trading stocks, volume of trading stocks). The market factor consists of dimensions: price changes, market information. The prospect factor consists of dimensions: loss aversion, regret aversion, and mental accounting. The heuristic dimensions are grouped into two factors: overconfidence-gamble’s fallacy and anchoring-ability bias. He recommends that investors should consider carefully before investment, but should not care too much about the prior loss for later investment. Besides, the investors should not reduce their regret in investment by avoiding selling decreasing stocks and selling increasing ones. Sindhu, Kalidas and Anil Chandran (2014) try to analyse the various factors influencing investor sentiments in the Indian stock market. They use both secondary and primary data for the study. They collect secondary data for the study from books, journals, periodicals, various websites, and government publications and primary data from 60 staffs (both teaching and non-teaching) in the NSS College, Nemmara who are selected by convenience sampling method and Multi-stage sampling method. Using percentage, mean, standard deviation, cronbatch alpha and ANOVA with the help of SPSS they conclude that there exists significant relationship between gender of the investors and the factors like herd behavior, risk factors, and confidence and performance factors. Kengatharan and Kengatharan (2014) explore the behavioural factors influencing individual investors’ decisions at the Colombo Stock Exchange and the relations between these factors and

09www.pbr.co.in
Volume 10 Issue 7, January 2018
investment performance. They collect data through the questionnaires distributed to individual investors at the Colombo Stock Exchange. After analysis of the collected data using SPSS They show that there are four behavioural factors affecting the investment decisions of individual investors at the Colombo Stock Exchange which are Herding, Heuristics, Prospect and Market and among the behavioural factors mentioned above, only three variables are found to influence the investment performance: choice of stock has negative influence which is from herding factor. Over confidence from heuristics factor has negative influence on investment performance. Anchoring from heuristics factor has positive influence on investment performance. All other variables which are volume of stock, buying and selling and speed of herding variables of herding factor, loss aversion and regret aversion variables of prospect factor and market information and customer preference variables of market factor do not have influence on investment performance.
In the previous studies mentioned above sometimes, sample size is not enough and there is no justification for taking that sample size. Convenience sampling technique has been used for selecting sample. For example, Sindhu, et al (2014) has used Convenience sampling technique for selecting respondent for their study. In some previous studies, only a single factor has been taken as independent variable and all the biases and their components has not been considered as dependent variable. For example, Arnott and Chevas (2012) have used only demographic factor as independent variable. Ngoc (2014) uses only two components of Heuristics Bias. The present study under the title “Analysis of Investment Behaviour of Individual Investors of Stock Market - a Study in select districts of West Bengal” is an empirical analysis to overcome the limitations of the previous studies and also to make a valid conclusion.
Objective of The Study
The aim of the study is analysis of Investment Behaviour of individual investors of stock market. To reach the aim we have three specific objectives. These are
i. To know the influence of Demographic Factors on Investment Behaviour
ii. To find out how investor Awareness affects Investment Behaviour.
iii. To learn effect of Perceived Risk Attitude on Investment Behaviour.
Propositions of The Study
For achieving the objective, the study has three Propositions
1) Demographic Factors has impact on Investment Behaviour in Stock Market.
2) Awareness influences Investment Behaviour in Stock Market.
3) There is effect of Perceived Risk Attitude on Investment Behaviour in Stock Market
Research Design and Methodology
Variables Under Study
Demographic Factors, Awareness and Perceived Risk Attitude have been considered as independent variables and Investment Behaviour has been considered as dependent variable.
Demographic Factors
Demographic Factors of an investor refers to investor’s age, gender, academic qualification, annual income, experience, etc.
Awareness
Awareness refers to the consciousness. There are two components of Awareness namely Social Learning and Financial Awareness.
Perceived Risk Attitude
It refers to the perceived degree of uncertainty regarding an unknown event. There are two components of Perceived Risk Attitude namely Affect and Cognition. Affect is mainly guided by emotion when Cognition is logical.
Investment Behaviour
Two types of investors invest in stock market. They are individual investors and institutional investors. In the present research focus is on individual investors. There are four main biases that may have any impact on investment behaviour. These are Heuristics Bias, Prospect Bias, Markets Bias and Herding Bias. There are five components under Heuristics Bias such as Representativeness, Overconfidence, Anchoring, Availability Bias and Gambler’s Fallacy. Under Prospects Bias, there are three components such as Loss Aversion, Regret Aversion and Mental Accounting. Markets Bias has six components namely Price Changes, Over Reaction, Market Information, Past Trend of Stock, Companies’ Customer Preference and Fundamentals of Underlying Stocks and there are four components of Herding Bias namely Buying and Selling, Stock Volume, Stock Type and Speed of Herding.
Sample Design and Methodology
The study is based on primary data that have been collected from 400 randomly selected individual investors of stock market from different districts of West Bengal through a structured questionnaire using 5 point Likert scale ranging from strongly disagree to strongly agree in appropriate areas. For this study we have collected the required data during January, 2014 to December, 2016. With a view to accomplish the pre-determined set of objectives of the study we have used several statistical and econometrics tools and techniques such as Descriptive Statistics, Cronbach Alpha,

www.pbr.co.in10
Pacific Business Review International
Factor Analysis, Correlation Coefficient and Probit Regression Model using SPSS and Stata Softwares for analyzing the data.
Analysis and Findings of The Study
This chapter contains the results and interpretation of the findings of the Cronbach’s alpha test for measurement of reliability, factor analysis to know the relative importance of the factors included in the variables namely Awareness and Perceived Risk Attitude , correlation coefficient among the variables as well as regression analysis through Probit model in relation to the objectives of our study.
Findings of Reliability Test
The result of the reliability test or internal consistency test
by Cronbach alpha shows that the value of alpha for Awareness is 0.768, for Perceived Risk Attitude is 0.638 and for investment behaviour is 0.701. So we can say that the scale is reliable as values of Cronbach alpha is more than 0.6 in all the cases.
Findings of Factor Analysis
From the table we can see that in case of financial awareness the Eigen value is 4.668, KMO is .738 (sig. is 0.000), percentage of total variance explained is 58.35% and most of the factors loading are more than 0.5. So, we can say that all the factors have relative importance. Important factors of financial awareness that may affect awareness are, FA8 (.814), FA1 (.785), FA5 (.588), FA3 (.548), FA4 (.547), FA6 (.499), FA2 (.482) and FA7 (.405) (Table 1.).
Table 1. Factor Analysis of AwarenessAwareness Financial Awareness Social Learning
FA1 .785FA2 .482FA3 .548FA4 .547FA5 .588FA6
.499
FA7
.405FA8
.814
SL1
.699SL2 .527SL3 .494SL4 .671SL5 .437SL6 .279
Eigen Value 4.668 3.107Variance% 58.351 51.789
KMO 0.738 0..612Sig 0.000 0.000
Calculated by Authors
From the table we can see that in case of social learning the Eigen value is 3.11, KMO is .612 (sig. is 0.000), percentage of total variance explained is 51.79% and most of the factors loading are more than 0.5. So, we can say that all the factors have relative importance. Important factors of social learning that may affect awareness are, SL1 (.699), SL4 (.671), SL2 (.527), SL3 (.494), SL5 (.437) and SL6 (.279) (Table 1.).
From the analysis we can say that individual investors of the study areas rely more on financial awareness in comparison
to social learning (Table 1.).
From the table we can see that in case of Affect the Eigen value is 5.17, KMO is .516 (sig. is 0.000), percentage of total variance explained is 64.57% and most of the factors loading are more than 0.5. So, we can say that all the factors have relative importance. Important factors of Affect that may affect Perceived Risk Attitude are A1 (.755), A2 (.737), A5 (.710), A6 (.695), A3 (.683), A8 (.628), A4 (.617) and A7 (.338) (Table 2.).
Table 2. Factor Analysis of Perceived Risk Attitude Perceived Risk Attitude Affect Cognition A1 .755A2 .737A3 .683A4 .617A5 .710A6 .695

11www.pbr.co.in
Volume 10 Issue 7, January 2018
From the table we can see that in case of Cognition, the Eigen value is 3.14, KMO is .609 (sig. is 0.000), percentage of total variance explained is 52.35% and most of the factors loading are more than 0.5. So, we can say that all the factors have relative importance. Important factors of Cognition that may affect Perceived Risk Attitude are C4 (.706), C3 (.666), C2 (.650), C6 (.619), C5 (.469) and C1 (.296) (Table 2.).
From the analysis we can say that individual investors Perceived Risk Attitude guided mostly by Affect in comparison to Cognition (Table 2.).
Findings of Relationship between the Variables by using Correlation Coefficient
From the analysis of the relationship of Demographic Factors and the components of different biases of Investment Behaviour we can see that
Age has significant relationship with only one component of Prospects Bias of Investment Behaviour namely Regret Aversion. In case of Markets Bias, Age has significant relationship with all the components except Price Changes and Fundamentals of Underlying Stocks. Age has significant relationship with Choosing Stock Type and Stock volume only of Herding Bias (Table 3 – Table 6).
A7 .338A8 .628C1 .296C2 .650C3 .666C4 .706C5 .469C6 .619
Eigen Value 5.165 3.141Variance% 64.565 52.347
KMO .516 .609Sig 0.000 0.000
Calculated by Authors
Table 3. - Association between Demographic Factors and Investment Behaviour component - wise (Heuristics)
Demographic Factors
Investment BehaviourHeuristics
Representativeness Overconfidence Anchoring AvailabilityBias
GamblersFallacy
Age (-)0.02096 0.05594 0.00094 0.03778 0.02255Education 0.09274* 0.04505 0.16747** 0.09713* (-)0.0853*Occupation (-)0.0067 (-)0.01461 (-)0.05756 (-)0.06722 0.00059Annual Income 0.10765** 0.18793** 0.19215** 0.13041** 0.01308Experience (-)0.03476 0.13705** 0.03521 0.18219** 0.03088Objective (-)0.01508 0.01193 (-)0.19697** 0.00435 (-)0.14132**
** - Significant at 1%, level, * - Significant at 5% level
Calculated by Authors
Table 4. - Association between Demographic Factors and Investment Behaviour component - wise (Prospects)
Demographic Factors Investment Behaviour
ProspectsLoss Aversion Regret Aversion Mental Accounting
Age 0.05980 0.12775** (-)0.03712Education 0.21915** 0.14203** (-)0.11306**Occupation (-)0.07625* (-)0.00326 0.06684Annual Income 0.14394** 0.13998** 0.18199**Experience (-)0.03179 (-)0.02726 0.04308Objective (-)0.03993 (-)0.04708 (-)0.05142
** - Significant at 1%, level, * - Significant at 5% level
Calculated by Authors

Demographic Factors
Investment BehaviourHerding
Buying and Selling Choosing Stock Type
Stock Volume Speed of Herding
Age (-)0.06217 (-)0.09166* (-)0.12109** (-)0.06793Education 0.02748 0.06322 0.10639** 0.10259**Occupation (-)0.04292 (-)0.09833* (-)0.13408** (-)0.16486**Annual Income 0.10189** 0.12264** 0.09450* 0.18156**Experience (-)0.08035* (-)0.20803** (-)0.17979** (-)0.16607**Objective (-)0.00688 0.06043 (-)0.00125 0.02590
** - Significant at 1%, level, * - Significant at 5% level
Calculated by Authors
www.pbr.co.in12
Pacific Business Review International
Table 5. - Association between Demographic Factors and Investment Behaviour component - wise (Markets)
Demographic Factors
Investment BehaviourMarkets
Price Changes
OverReaction
MarketInformation
PastTrend ofStocks
Companies’CustomerPreference
Fundamentalsof underlying
stocks
Age (-)0.05246 (-)0.17605** (-)0.22876** (-)0.08756* (-)0.16246** 0.02626Education (-)0.03936 0.28919** (-)0.04814 0.08152* 0.04061 0.11519**Occupation (-)0.02988 (-)0.2476** (-)0.05261 (-)0.18745** (-)0.23061** (-)0.02608Annual Income
0.11122** 0.17843** (-)0.09262* 0.16992** (-)0.09731* (-)0.0792*
Experience 0.00061 (-)0.17168** 0.01044 (-)0.05407 (-)0.12865** 0.06857Objective (-)0.21977** (-)0.05292 0.00655 (-)0.11266** (-)0.06699 (-)0.0281
** - Significant at 1%, level, * - Significant at 5% level
Calculated by Authors
Table 6. - Association between Demographic Factors and Investment Behaviour component - wise (Herding)
In case of Heuristics Bias, Education has significant relationship with all the components except Overconfi-dence. It has significant relationship with all the factors of Prospects Bias. It has significant relation with Over Reaction, Past Trend of Stocks, and Fundamentals of Underlying Stocks only of Markets Bias. It also has significant relation with Stock Volume and Speed of Herding components of Herding Bias (Table 3 – Table 6).
Occupation has no significant relation on Heuristics Bias. It has significant relationship with only Loss Aversion component of Prospects Bias. Occupation has significant relationship with Over Reaction, Past Trend of Stocks and Companies Customer Preference only of Markets Bias. It also has significant relation with Choosing Stock Type, Stock Volume and Speed of Herding only on Herding Bias (Table 3 – Table 6).
Annual Income has significant relation with Representati-veness, Overconfidence, and Anchoring and Availability Bias only of Heuristics Bias. It has significant relationship with. It also has significant relationship with all components of Prospects Bias, Markets Bias and Herding Bias (Table 3 – Table 6).
In case of Experience on Heuristics Bias, Experience has significant relationship with Over Confidence and Availability Bias only. It has no significant relationship with
Prospects Bias. It has significant relationship with Over Reaction and Companies’ Customer Preference only of Markets Bias. It also has significant relationship with the factors such as Choosing Stock Type, Stock Volume and Speed of Herding only of Herding Bias (Table 3 – Table 6).
Objective of making investment has significant relationship with Anchoring and Gamblers’ Fallacy only of Heuristics Bias. It has significant relationship with Loss Aversion only of Prospects Bias. It has significant relationship with Price Changes and Past Trend of Stocks of Markets Bias. It has no significant relationship with Herding Bias (Table 3 – Table 6).
From the analysis of the relationship of Awareness and the factors of different biases of Investment Behaviour we can see that in case of social learning on Heuristics Bias social learning has significant relationship with all the components such as representativeness, over confidence, anchoring, availability bias and gamblers’ fallacy. On Prospects Bias, Social Learning has significant relationship with regret aversion and mental accounting only. On Markets Bias, social learning has significant relationship with price changes, market information, past trend of stocks and companies’ customer preference only. On Herding Bias, Social Learning has significant relationship with buying and selling pattern and choosing stock type only (Table 7. - Table 10.).

Table 10.
Association between Awareness and Investment Behaviour component - wise (Herding)
Awareness
Investment Behaviour
HerdingBuying and Selling
Choosing Stock Type
Stock Volume Speed of Herding
Social Learning 0.07973* 0.09873* 0.00457 0.01808Financial Awareness
0.08104* 0.05315 0.09399* 0.09744*
** - Significant at 1%, level, * - Significant at 5% level
Calculated by Authors
Table 9.
-
Association between Awareness and Investment Behaviour component - wise (Markets)
Awareness
Investment Behaviour
MarketsPrice
ChangesOver
ReactionMarket
InformationPast
Trend ofStocks
Companies’CustomerPreference
Fundamentalsof underlying
stocksSocial Learning
0.23589* 0.04891 0.30271** 0.35841** 0.10379** 0.03519
Financial Awareness
0.12324** 0.08413* 0.14320** 0.33848** 0.25158** 0.29095**
** - Significant at 1%, level, * - Significant at 5% level
Calculated by Authors
Table 8.
-
Association between Awareness and Investment Behaviour component - wise (Prospects)
Awareness
Investment BehaviourProspects
Loss Aversion Regret Aversion Mental AccountingSocial Learning (-)0.02917 (-)0.09694* 0.38437**Financial Awareness 0.17807** (-)0.11007** 0.25855**
** - Significant at 1%, level, * - Significant at 5% level
Calculated by Authors
Table 7. - Association between Awareness and Investment Behaviour component - wise (Heuristics)
Awareness
Investment BehaviourHeuristics
Representativeness Overconfidence Anchoring AvailabilityBias
GamblersFallacy
Social Learning
0.21375** 0.20671** 0.27316** 0.14662** 0.21576**
Financial Awareness
0.30919** 0.03477 0.43371** 0.11372** 0.10398**
** - Significant at 1%, level, * - Significant at 5% level
Calculated by Authors
13www.pbr.co.in
Volume 10 Issue 7, January 2018
In case of financial awareness on Heuristics Bias, financial awareness has significant relationship with all components except overconfidence. Financial awareness has significant relationship with all components of Prospects Bias and Markets Bias. On Herding Bias, financial awareness has significant relationship with buying and selling pattern, stock volume and speed of herding only (Table 7. - Table 10.).
From the analysis of the relationship of Perceived Risk
Attitude and the factors of different biases of Investment Behaviour we can see that in case of impact on Heuristics Bias Affect has significant relationship with representati-veness, availability bias and gamblers’ fallacy only. On Prospects Bias, it has significant relationship with mental accounting only. On Markets Bias, Affect has significant relationship with all components. On Herding Bias, it has significant relationship with choosing stock type only (Table 11. - Table 14.).

Table 14. Association between Perceived Risk Attitude and Investment Behaviour component - wise (Herding)
Perceived Risk Attitude
Investment BehaviourHerding
Buying and Selling Choosing Stock Type
Stock Volume Speed of Herding
Affect 0.00668 0.07581* 0.03386 0.06471Cognition 0.01967 0.06651 0.05923 0.05393
** - Significant at 1%, level, * - Significant at 5% level
Calculated by Authors
Table 13. - Association between Perceived Risk Attitude and Investment Behaviour component - wise (Markets)
Perceived Risk
Attitude
Investment BehaviourMarkets
PriceChanges
OverReaction
MarketInformation
PastTrend ofStocks
Companies’CustomerPreference
Fundamentalsof underlying
stocksAffect 0.12007** 0.19309** 0.38071** 0.32010** 0.18140** 0.15387**Cognition 0.18530** 0.05689 0.05129 0.21832** 0.04907 (-)0.01122
** - Significant at 1%, level, * - Significant at 5% level
Calculated by Authors
Table 12. - Association between Perceived Risk Attitude and Investment Behaviour component - wise (Prospects)
Perceived Risk AttitudeInvestment Behaviour
ProspectsLoss Aversion Regret Aversion Mental Accounting
Affect 0.06436 (-)0.05624 0.25632**Cognition (-)0.00595 (-)0.28406** 0.31630**
** - Significant at 1%, level, * - Significant at 5% level
Calculated by Authors
Table 11. - Association between Perceived Risk Attitude and Investment Behaviour component - wise(Heuristics)
Perceived Risk
Attitude
Investment BehaviourHeuristics
Representativeness Overconfidence Anchoring AvailabilityBias
GamblersFallacy
Affect 0.30459** 0.06418 0.02111 0.28361** 0.18735**Cognition 0.07451* 0.32404** 0.38289** 0.20106** 0.22171**
** - Significant at 1%, level, * - Significant at 5% level
Calculated by Authors
www.pbr.co.in14
Pacific Business Review International
In case of influence of Cognition on Heuristics Bias, it has significant relationship with all components. On Prospects Bias, Cognition has significant relationship with all the factors except loss aversion. On Markets Bias, it has significant relationship with price changes and past trend of stocks only. On Herding Bias, it has no significant relationship (Table 11. - Table 14.).
Findings of Effect of Demographic Factors, Awareness and Perceived Risk Attitude on Investment Behaviour by using Probit Model
This section presents the effect of different components of Demographic Factors, Awareness and Perceived Risk Attitude on different dimensions of Investment Behaviour by applying Probit regression model.
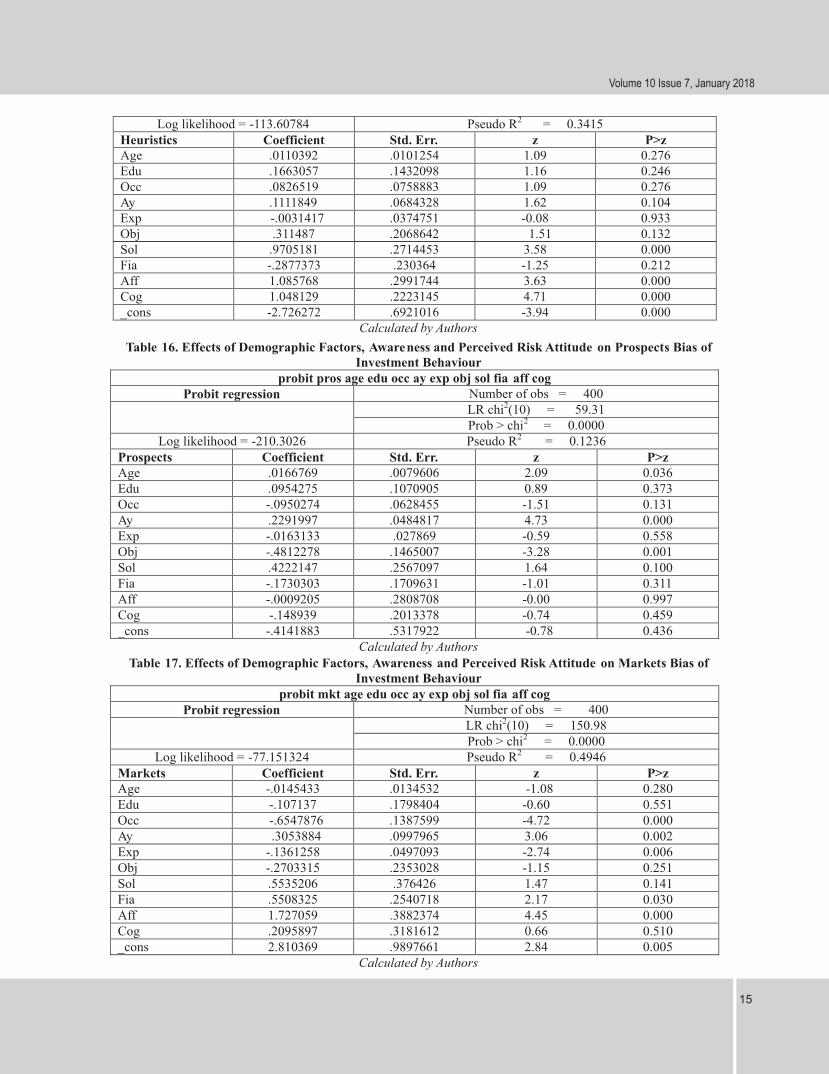
Table 15. Effects of Demographic Factors, Awareness and Perceived Risk Attitude on Heuristics Bias of Investment Behaviour
probit heu age edu occ ay exp obj sol fia aff cogProbit regression Number of obs = 400
LR chi2(10) = 117.81Prob > chi2 = 0.0000
15www.pbr.co.in
Volume 10 Issue 7, January 2018
Sol .9705181 .2714453 3.58 0.000Fia -.2877373 .230364 -1.25 0.212Aff 1.085768 .2991744 3.63 0.000Cog 1.048129 .2223145 4.71 0.000_cons -2.726272 .6921016 -3.94 0.000
Calculated by Authors
Log likelihood = -113.60784 Pseudo R2 = 0.3415Heuristics Coefficient Std. Err. z P>zAge .0110392 .0101254 1.09 0.276 Edu .1663057 .1432098 1.16 0.246Occ .0826519 .0758883 1.09 0.276Ay .1111849 .0684328 1.62 0.104Exp -.0031417 .0374751 -0.08 0.933Obj .311487 .2068642 1.51 0.132
Table 16. Effects of Demographic Factors, Awareness and Perceived Risk Attitude on Prospects Bias of
Investment Behaviourprobit pros age edu occ ay exp obj sol fia aff cog
Probit regression Number of obs = 400LR chi2(10) = 59.31Prob > chi2 = 0.0000
Log likelihood = -210.3026 Pseudo R2 = 0.1236Prospects Coefficient Std. Err. z P>zAge .0166769 .0079606 2.09 0.036 Edu .0954275 .1070905 0.89 0.373Occ -.0950274 .0628455 -1.51 0.131Ay .2291997 .0484817 4.73 0.000 Exp -.0163133 .027869 -0.59 0.558Obj -.4812278 .1465007 -3.28 0.001Sol .4222147 .2567097 1.64 0.100Fia -.1730303 .1709631 -1.01 0.311Aff -.0009205 .2808708 -0.00 0.997Cog -.148939 .2013378 -0.74 0.459_cons -.4141883 .5317922 -0.78 0.436
Calculated by Authors
Table 17.
Effects of Demographic Factors, Awareness and Perceived Risk Attitude on Markets Bias of Investment Behaviour
probit mkt age edu occ ay exp obj sol fia aff cogProbit regression Number of obs = 400
LR chi2(10) = 150.98Prob > chi2 = 0.0000
Log likelihood = -77.151324 Pseudo R2 = 0.4946Markets Coefficient Std. Err. z P>zAge -.0145433 .0134532 -1.08 0.280Edu -.107137 .1798404 -0.60 0.551Occ -.6547876 .1387599 -4.72 0.000 Ay .3053884 .0997965 3.06 0.002Exp -.1361258 .0497093 -2.74 0.006Obj -.2703315 .2353028 -1.15 0.251Sol .5535206 .376426 1.47 0.141Fia .5508325 .2540718 2.17 0.030Aff 1.727059 .3882374 4.45 0.000Cog .2095897 .3181612 0.66 0.510_cons 2.810369 .9897661 2.84 0.005
Calculated by Authors

www.pbr.co.in16
Pacific Business Review International
Table 18. Effects of Demographic Factors, Awareness and Perceived Risk Attitude on Herding Bias of Investment Behaviour
probit hrd age edu occ ay exp obj sol fia aff cogProbit regression Number of obs = 400
LR chi2(10) = 29.28Prob > chi2 = 0.0011
Log likelihood = -166.12222 Pseudo R2 = 0.0810Herding Coefficient Std. Err. Z P>zAge -.016226 .0087079 -1.86 0.062Edu -.0275052 .1072967 -0.26 0.798Occ -.1780813 .0714581 -2.49 0.013Ay .0901826 .0411444 2.19 0.028Exp -.04646 .0306031 -1.52 0.129Obj -.1931231 .1655943 -1.17 0.244Sol -.2313647 .2706427 -0.85 0.393Fia .4751347 .2054904 2.31 0.021 Aff -.5737254 .299569 -1.92 0.055Cog .6393906 .2416758 2.65 0.008_cons .3512706 .5865858 0.60 0.549
Calculated by Authors
The result of the analysis of effect of Demographic Factors on Investment Behaviour of individual investor of stock market shows that Age has significant affect on Prospects Bias (P>Z=0.036) and Herding Bias (P>Z=0.062). Occupation has significant affect on Markets Bias (P>Z=0.000) and Herding Bias (P>Z=0.013). Annual Income has significant affect on Prospects Bias (P>Z=0.000), Markets Bias (P>Z=0.002) and on Herding Bias (P>Z=0.028). Experience has significant effect on Market Bias (P>Z=0.006) only. Objective of making investment has significant effect only on Prospects Bias (P>Z=0.001) (Table 15 – Table 18).
From the result we can also say that if Age increases, Prospects Bias of investment behaviour increases by 1.67% and Herding Bias of investment behaviour decreases by 1.62%. If Occupation changes Markets Bias and Herding Bias both changes in opposite direction by 65.48% and 17.81% respectively. If Annual Income increases, Prospects Bias increases by 22.92%, Market Bias increases by 30.54% and Herding Bias increases by 9.02%. If Experience increases, Markets Bias decreases by 13.62%. While Investment Objective changes Prospects Bias changes by 48.12% in opposite direction (Table 15 – Table 18).
From the analysis of effect of Awareness on Investment Behaviour of individual investor of stock market we can say that Social Learning has significant effect on Heuristics Bias (P>Z=0.000) only (Table 15 – Table 18).
Financial Awareness has significant effect on Markets Bias (P>Z = 0.030) and Herding Bias (P>Z=0.021) (Table 15 – Table 18).
From the result we can also say that if Social Learning increases Heuristics Bias increases by 47.51% (Table 15 – Table 18).
If Financial Awareness increases, Markets Bias increases by 55.08% and Herding Bias increases by 49.50% (Table 15 – Table 18).
From the analysis of impact of Perceived Risk Attitude on Investment Behaviour of individual investor of stock market we can say that Affect has significant impact on Heuristics Bias (P>Z=0.000), Markets Bias (P>Z=0.000) and Herding Bias (P>Z=0.055) only (Table 15 – Table 18).
Cognition has significant impact on Heuristics Bias (P>Z=0.000) and Herding Bias (P>Z=0.008) only (Table 15 – Table 18).
The result also indicates that when Affect increases Heuristics Bias increases by 108.58%, Markets Bias increases by 172.71% and Herding Bias decreases by 57.37% (Table 15 – Table 18).
While Cognition increases Heuristics Bias and Herding Bias increases by 104.81% and 63.94% respectively (Table 15 – Table 18).
Concluding Observations
From the analysis of the Investment Behaviour of individual investors of stock market by collecting 400 samples from different districts of West Bengal, the study concludes that
The result of the Descriptive Statistics like shows that
1. Most of the respondents are of ages between 28 years to 37 years
2. Majority of the investors in the stock market are graduates in academic qualification
3. In occupation most of the investors are businessperson.
4. In case of annual income maximum are in the band of Rs. 100000 to Rs. 500000

17www.pbr.co.in
Volume 10 Issue 7, January 2018
5. Maximum of the investors in the stock market are experienced in this field as they are making investment in stock market for more than five years and
6. The objective of most of the investors to invest in stock market is to make short term profit
The result of the Probit regression analysis shows that
1. Age has significant effect on Prospects Bias and Herding Bias
2. Occupation has significant impact on Markets Bias and Herding Bias
3. Annual income has significant influence on Prospects Bias, Markets Bias and Herding Bias only
4. Experience has significant affect on Markets Bias only
5. Objective of making investment has significant effect on Prospects Bias only
The results of the Descriptive statistics like Percentage, Graphical presentation and Factor Analysis of Awareness of the individual investors of stock market indicate that individual investors rely more on Financial Awareness in comparison to Social Learning.
From the result of the Probit regression analysis we can summarise that
1. Social Learning has significant effect on Heuristics Bias only.
2. Financial Awareness has significant effect on Markets Bias and Herding Bias only.
The results of the Descriptive statistics like Percentage, Graphical presentation and Factor Analysis of Perceived Risk Attitude of the individual investors of stock market indicate that individual investors rely more on Affect in comparison to Cognition.
From the result of the Probit regression analysis we can summarise that
1. Affect has significant impact on Heuristics Bias, Markets Bias and Herding Bias only
2. Cognition has significant impact on Heuristics Bias and Herding Bias only
The study can be extended by
1) Considering institutional investors
2) Using larger and diversified sample
3) Considering other market
But these are not considered in this study. These will be considered in research to be held in near future.
References
Nayak, M. K. (2010). Investigating the nature of investor’s grievances and assessing the role of the grievance redressal Agencies. Journal of Law and Conflict Resolution, 2(4), 60-65.
Varadharajan, P. and Vikkraman, P. (2011).A study on investor’s perception towards investment decision in equity Market. International Journal of Management, IT and Engineering, 1(3), 62-81.
Kadariya, S. (2012). Factors affecting investor decision making: A case of Nepalese Capital Market. Journal of Research in Economics and International Finance, 1(1), 16-30.
Hon, T. Y. (2012). The Behaviour of Small Investors in the Hong Kong Derivatives Markets: A factor analysis. Journal of Risk and Financial Management, 5(2012), 59-77.
Chaudhary, A. K. (2013).Impact of behavioral finance in investment decisions and strategies – a fresh approach. International Journal of Management Research and Business Strategy, 2(2), 85 – 92.
Ngoc, L. T. B. (2014). Behavior Pattern of Individual Investors in StockMarket, International Journal of Business and Management, 9(1), 1-16.
Sindhu, K. P., Kalidas, M. G. and Anil Chandran, S. (2014).A study on factors influencing investor sentiment in Indian Stock Market. International Journal of Management, 5(1), 7 – 13.
Kengatharan, L. and Kengatharan, N. (2014). The Influence of Behavioral Factors in Making Investment Decisions and Performance: Study on Investors of Colombo Stock Exchange, Sri Lanka. Asian Journal of Finance & Accounting, 6(1), 1 – 23.
Pandian, P, (2005). Security Analysis and Portfolio Management, Vikas Publishing House Pvt. Ltd., N. Delhi.
Pathak, B.V, (2008). Indian Financial System (2nd ed), Pearson Education. N. Delhi.