the retail investors behaviour on equity shares …
TRANSCRIPT

1
THE RETAIL INVESTORS BEHAVIOUR ON
EQUITY SHARES IN CHENNAI CITY – A STUDY
Thesis submitted to the
Bharathidasan University, Tiruchirappalli
for the award of the Degree of
DOCTOR OF PHILOSOPHY IN COMMERCE
By
N.SRIVIDHYA,M.Com., M.Phil., MBA.,
Associate Professor, Dept. of Management Studies,
Sri Manakula Vinayagar College of Engineering,
Madagadipet, Puducherry.
Under the Guidance of
Dr.S.RAJKUMAR, M.Com., M.Phil., B.Ed., Ph.D.,
Principal and Research Advisor,
Naina Mohamed College of Arts and Science,
Rajendrapuram, Arantangi Taluk,
Pudukkottai District.
May - 2012

2
Dr. S. RAJKUMAR, M.Com., M.Phil., B.Ed.,
Ph.D,
Principal & Research Advisor,
Naina Mohamed College of Arts and Science,
Rajendrapuram, Aranthangi Taluk,
Pudukkottai District.
e-mail:
Mobile/ Phone:9443588201
Date:
This is to certify that the Ph.D. thesis entitled “The Retail Investors
behaviour on Equity Shares” – A Study is a bonafide record of research work done
by Mrs.N.Srividhya, under my guidance and supervision and the thesis has not
previously formed the basis for the award of any degree, diploma, fellowship or
similar title. The thesis represents entirely an independent work of the candidate.
CERTIFICATE

3
N.Srividhya, M.Com., M.Phil., M.B.A.,
Associate Professor, Dept. of Management Studies,
Sri Manakula Vinayagar Engineering college,
Madagadipet, Puducherry 605107.
Date:
I, N.Srividhya, Ph.D. Scholar, Department of Management Studies, Sri
Manakula Vinayagar Engineering college, Madagadipet, Puducherry, do hereby
declare that the thesis entitled “The Retail Investors behaviour on Equity Shares” –
A Study submitted to Bharathidasan University, Tiruchirappalli for the award of
the degree of “DOCTOR OF PHILOSOPHY IN COMMERCE” is my original
work and that the thesis has not formed the basis for the award of any degree,
diploma, associate ship, fellowship or any other similar titles.
Counter Signed Research Scholar
DECLARATION

4
ACKNOWLEDGEMENT
Dr. S. Rajkumar, my Research Advisor, Principal, Naina Mohamed
College of Arts and Science, Rajendrapuram, Aranthangi Taluk, Pudukkottai
District is the inspiring force behind this research work. He has been my Guide in
the true sense of word. He offered me valuable guidance and suggestions to
complete this work successfully. This study would not have been possible but for
his immense help.
I feel immense pleasure to express my heart-felt gratitude to my Doctoral
committee members Dr.S.Sekar, Principal, Urumu Dhanalakshmi College,
Kattur, Tiruchirappalli – 620 019 and Dr.E.Mubarak Ali, Associate Professor,
P.G. and Research Department of Commerce, Jamal Mohamed College,
(Autonomous), Tiruchirappalli, for providing me the valuable suggestions to make
this study.
The help of librarian of Bharathidasan University is gratefully
acknowledged for their assistance in literature collection.
My acknowledgements are due to all the publishers of both the research
articles and popular articles of mine in their leading national and International
Journals by giving me an opportunity to write my views and findings. I wish to
extend my heartfelt thanks to all the Colleges and Universities for giving me an
opportunity to present my papers on the emerging issues.
I render my thanks to the entire respondents for the co-operation and co-
ordination extended by them in the collection of data needed for the research.
I wish to make a special mention about my better half Mr._G.
Ravichandran, who helped in all the way from the beginning to the end of my
research journey. He gave his moral support in all spheres of my research work. I
am at a loss for words when I think about the sacrifices made by my dear daughter
Selvi._R. Vishnu Priya, and my son Selvan. R. Maadhav, who had to suffer my
absence during the period of my research work.
(N.Srividhya)

5
CONTENTS
CHAPTER TITLE PAGE
NO
I INTRODUCTION AND RESEARCH DESIGN 1
II REVIEW OF LITERATURE 17
III CONCEPTUAL FRAMEWORK OF INDIAN
CAPITAL MARKETS
66
IV ANALYSIS – I 102
V ANALYSIS - II 139
VI FINDINGS, CONCLUSIONS, SUGGESTIONS 236
BIBLIOGRAPHY
ANNEXURE - QUESTIONNAIRE
6
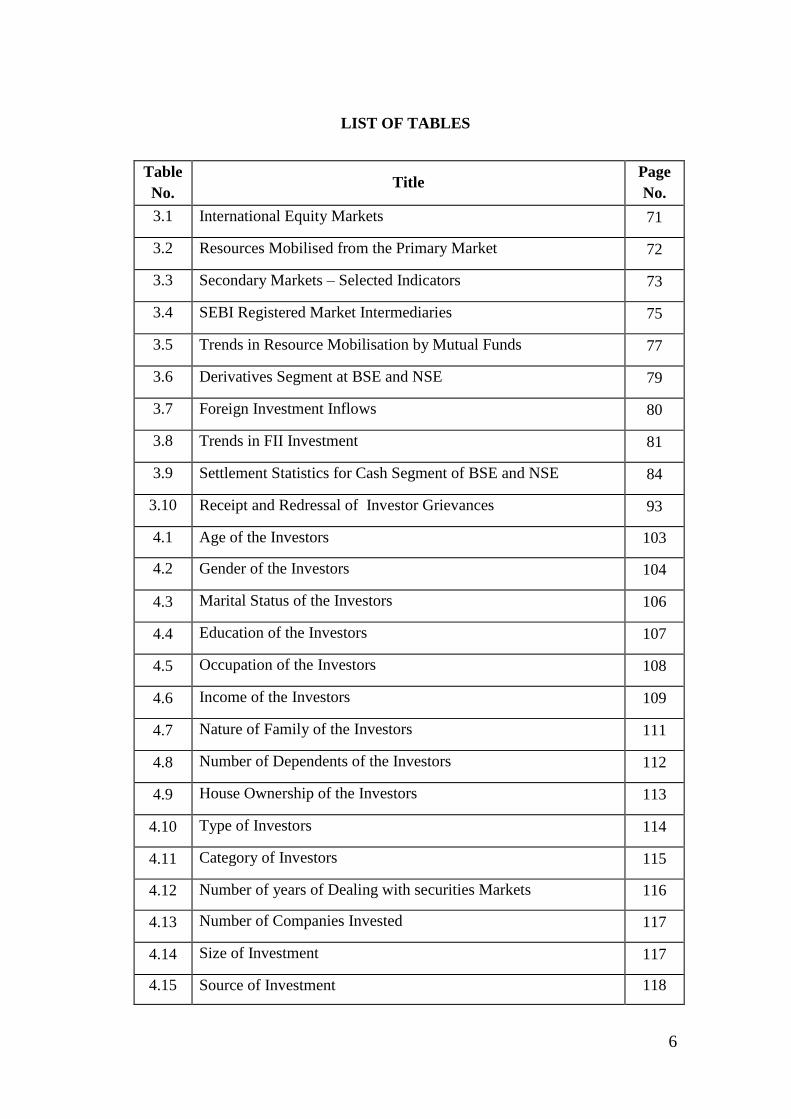
LIST OF TABLES
Table
No. Title
Page
No.
3.1 International Equity Markets 71
3.2 Resources Mobilised from the Primary Market 72
3.3 Secondary Markets – Selected Indicators 73
3.4 SEBI Registered Market Intermediaries 75
3.5 Trends in Resource Mobilisation by Mutual Funds 77
3.6 Derivatives Segment at BSE and NSE 79
3.7 Foreign Investment Inflows 80
3.8 Trends in FII Investment 81
3.9 Settlement Statistics for Cash Segment of BSE and NSE 84
3.10 Receipt and Redressal of Investor Grievances 93
4.1 Age of the Investors 103
4.2 Gender of the Investors 104
4.3 Marital Status of the Investors 106
4.4 Education of the Investors 107
4.5 Occupation of the Investors 108
4.6 Income of the Investors 109
4.7 Nature of Family of the Investors 111
4.8 Number of Dependents of the Investors 112
4.9 House Ownership of the Investors 113
4.10 Type of Investors 114
4.11 Category of Investors 115
4.12 Number of years of Dealing with securities Markets 116
4.13 Number of Companies Invested 117
4.14 Size of Investment 117
4.15 Source of Investment 118

7
Table
No. Title
Page
No.
4.16 Percentage of Savings invested in Securities Markets 119
4.17 Sources of Information 120
4.18 Criteria for Investments 121
4.19 Member of Investors’ Forum 121
4.20 Awareness of Malpractice of Intermediaries 122
4.21 Mode of Trading 122
4.22 Awareness of Financial Sector Reforms in India 123
4.23 Frequency Distribution of Index 124
4.24 Chi-square value for sources of Information with regard to News
papers 125
4.25 Chi-square value for sources of Information with regard to
Journals and Magazines 126
4.26 Chi-square value for sources of Information with regard to T V 126
4.27 Chi-square value for sources of Information with regard to stock
Brokers 127
4.28 Chi-square value for sources of Information with regard to
Investment Consultant 128
4.29 Chi-square value for sources of Information with regard to On
line website 128
4.30 Chi-square value for sources of Information with regard to
Friends and Relatives 129
4.31 Mean and Standard Deviation for preference of Investments and
their Ranks 130
4.32 Mean and Standard Deviation for Ranking of Industries 131
4.33 Mean and Standard Deviation of Reasons for Investments and
their Ranks 132
4.34 Mean and Standard Deviation of Preference of Investment Style 132
4.35 Mean and Standard Deviations for Preference in Choosing Stock
Exchanges 133
4.36 Paired Samples Statistics for the Factors of the risk and return 134
4.37 Paired Samples Correlations for the Factors of the Investment in
equity market 135
4.38 Paired samples Test Values for the Factors of the Latest Reforms
in Capital market 136

8
Table
No. Title
Page
No.
4.39 Frequency Distribution of Percentage of expected return 137
5.1 Clusters of Investors Based on Elements of Retail Investment 140
5.2 Number of cases in Each cluster of Retail Investment 140
5.3 Paired Samples statistics for the Elements of Retail Investment 141
5.4 Paired Samples correlations for the Elements of Retail
Investment 142
5.5 Paired Samples Test values for the Elements of Retail
Investment 143
5.6 Correlation Matrix for Number of year Dealing 145
5.7 Correlation co-efficient Table for percentage of savings in Share
Market 146
5.8 ANOVA for the Elements of capital investments with respect to
investment in shares 147
5.9 ANOVA for the Elements of Retail Investment with respect to
Investment in Government Bonds 148
5.10 ANOVA for the Elements of Retail Investment with respect to
Investment in Fixed Deposits 149
5.11 ANOVA for the Elements of Retail Investment with respect to
Investment in Gold 150
5.12 ANOVA for the Elements of Retail Investment with respect to
Investment in Debentures 151
5.13 ANOVA for the Elements of Retail Investment with respect to
Investment in Mutual Funds 152
5.14 ANOVA for the Elements of Retail Investment with respect to
Investment in Real Estate 153
5.15 ANOVA for the Elements of Retail Investment with respect to
the Reason for Investment - Return 155
5.16 ANOVA for the Elements of Retail Investment with respect to
the Reason for Investment - Liquidity 156
5.17 ANOVA for the Elements of Retail Investment with respect to
the Reason for Investment – Tax Benefits 157
5.18 ANOVA for the Elements of Retail Investment with regard to the
Investment Decisions influenced by Abridged Prospectus 159
5.19 ANOVA for the Elements of Retail Investment with regard to the
Investment Decisions influenced by T V Channels 160
5.20 ANOVA for the Elements of Retail Investment with regard to the 161

9
Table
No. Title
Page
No.
Investment Decisions influenced by Consultant
5.21 ANOVA for the Elements of Retail Investment with regard to the
Investment Decisions influenced by websites 162
5.22 Association between preference of Investment in Equity Shares
and Clusters of Investors 163
5.23 Chi-square for preference of Investments in Equity shares 164
5.24 Multivariate General Linear Model for percentage of
Investments 165
5.25 Association Criteria for Investment and Clusters of Awareness 168
5.26 Chi-square Test and criteria for Investments 169
5.27 Final Cluster Centres for Awareness of the equity Investment 170
5.28 Frequency of Clusters for Awareness of the latest Reforms in
Capital Market 170
5.29 ANOVA for the Elements of Retail investment with regard to
preference of Investment in Banking Sector 172
5.30 ANOVA for the Elements of Retail investment with regard to
preference of Investment in FMCG 173
5.31 ANOVA for the Elements of Retail investment with regard to
preference of Investment in Pharma Sector 174
5.32 ANOVA for the Elements of Retail investment with regard to
preference of Investment in PSE Sector 175
5.33 ANOVA for the Elements of Retail investment with regard to
preference of Investment in MNC Sector 176
5.34 ANOVA for the Elements of Retail investment with regard to
preference of Investment in IT Sector 177
5.35 ANOVA for the Elements of Retail investment with regard to
preference of Investment in Manufacturing Sector 178
5.36 ANOVA for the Elements of Retail investment with regard to
preference of Investment in Service Sector 179
5.37 Investment in Equity Shares is Higher Risk and Clusters of
Awareness on Retail Investment 180
5.38 Chi-square Test Statistics for Investment in Equity Shares is
Higher Risk 181
5.39 ANOVA for the Elements of Retail Investment with regard to
preference of Stock exchanges - Sensex 182
5.40 ANOVA for the Elements of Retail Investment with regard to 183

10
Table
No. Title
Page
No.
preference of Stock exchanges - Nifty
5.41 ANOVA for the Elements of Retail Investment with regard to
preference of Stock exchanges – CNX 100 184
5.42 Reason for Preference Given to Stock Exchange Dealing and
Cluster of Awareness on Retail Investment 185
5.43 Chi-square Tests for Reason of preference Given to Stock
Exchanges 186
5.44 Experience in Dealing shares through Electronic mode (demat)
and Cluster of Awareness on Elements of Retail investment 187
5.45
Chi-square Tests statistics showing Experience in Dealing shares
with Electronic mode (demat) and Cluster of Awareness on
Elements of Retail investment
187
5.46 Percentage of Different sources of Information to know About
Retail investment 189
5.47 Paired Samples statistics for the Factors of the equity investment 190
5.48 Paired Samples correlations for the Factors of the equity
investment 191
5.49 Paired Samples Test values for the Factors of the equity
investment 192
5.50 Multivariate Tests (b) for the Impact of the Latest Reforms in
Capital Market 194
5.51 Impact of the equity investment objectives on the Element of
Investment decision Tests of Between – Subjects Effects 195
5.52 ANOVA for Group means of investment options 199
5.53 Co-efficient of correlations for Number of years Dealing in
Capital market 200
5.54 ANOVA for the Latest Reforms Based on Percentage of savings 201
5.55 Variance of Independent variable on General information’s and
Cluster 1(b) 203
5.56 ANOVA (b.c) for General information’s and Cluster 1 203
5.57 Coefficients (a.b) of General information’s and Cluster 1 204
5.58 Variance of Independent variable on General information’s
and Cluster2 (b) Cluster 2(b) 205
5.59 ANOVA (b, c) for General information’s and Cluster 2 205
5.60 Coefficients (a, b) of General information’s and Cluster 2 206

11
Table
No. Title
Page
No.
5.61 Variance of Independent Variable for Company
management and Cluster 1(b) 207
5.62 ANOVA (b, c) for Company management and Cluster 1 207
5.63 Coefficients (a, b) of Company management and Cluster 1 208
5.64 Variance of Independent Variable for Company management and
Cluster 2(b) 209
5.65 ANOVA (b,c) for Company management and Cluster 2 209
5.66 Coefficients (a,b) for Company management and Cluster 2 210
5.67 Variance of Independent variable on Details of present values
Cluster 1 (b) 211
5.68 ANOVA (b,c) for Details of Present values and Cluster 1 211
5.69 Coefficients (a,b) of Details of present Values and Cluster 1 212
5.70 Variance of Independent Variable on Details of present values
and Cluster 2(b) 213
5.71 ANOVA (b,c) for Details of present values and Cluster 2 213
5.72 Coefficients (a, b) for Details of present values and Cluster2 214
5.73 Variance of Independent Variable on project details and their
changes and Cluster 1(b) 215
5.74 ANOVA (b,c) for project details and their changes and Cluster 1 215
5.75 Coefficients (a,b) for project details and their changes and
Cluster 1 216
5.76 Variance of Independent Variable on Project details and their
Changes and Cluster 2(b) 217
5.77 ANOVA (b, c) for project details and their changes and Cluster 2 217
5.78 Coefficients (a,b) for project details and their changes Cluster 2 218
5.79 Variance of Independent Variable on Financial parameters and
Cluster 1 (b) 219
5.80 ANOVA (b,c) for Financial parameters for Cluster 1 219
5.81 Coefficients (a, b) for Financial Parameters and Cluster 1 220
5.82 Variance of Independent Variable on Financial parameters and
Cluster 2 (b) 221
5.83 ANOVA (b, c) for Financial parameters for Cluster 2 221
5.84 Coefficients (a.b) for Financial parameters and Cluster 2 222

12
Table
No. Title
Page
No.
5.85 Impact of Retail investment preference of returns Amount
Received and Tests of Between – Subjects Effects 223
5.86 Impact of Demographic Variables on the investment objectives,
decision and satisfaction – Tests of Between –Subjects Effects 228
LIST OF FIGURES
Figure
No. Title
Page
No.
4.1 Age of the Investors 104
4.2 Gender of the Investors 105
4.3 Marital status of the Investors 106
4.4 Education of the Investors 107
4.5 Occupation of the Investors 109
4.6 Income of the Investors 110
4.7 Nature of the Family of Investors 111
4.8 Number of Dependents of the Investors 112
4.9 House ownership of the Investors 113
5.1 Investment pattern in stock market 235 - 236

13
LIST OF ABBREVIATIONS
ADRs - American Depository Receipts
AMFI - Association of Mutual Funds in India
AUM - Assets Under Management
BSE - Bombay Stock Exchange
C&D - Corporatisation and Demutualisation
CAGR - Compounded Annual Growth Rate
CC - Clearing Corporation
CDSL - Central Depositary Services (India) Limited
CH - Clearing House
MSX - Madras Stock Exchange
ECS - Electronic Clearing Scheme
EDIFAR - Electronic Data Information Filing and Retrieval
EPS - Earnings Per Share
FAQs - Frequently Asked Questions
FIIs - Foreign Institutional Investors
FMCG - Fast Moving Consumer Goods
GDP - Gross Domestic Product
GDRs - Global Depository Receipts
GDS - Gross Domestic savings
GETFs - Gold Exchange Traded Funds
GIC - General Insurance Corporation

14
HKEx - Hong Kong Exchange and Clearing Ltd
ICICI - Industrial Credit and Investment Corporation of India
IDBI - Industrial Development Bank of India
IFCI - Industrial Financial Corporation of India
IMSS - Integrated Market Surveillance System
IPF - Investor Protection Fund
IPO - Initial Public Offering
IT - Information Technology
LIC - Life Insurance Corporation
MDA - Multiple Discriminate Analysis
MF - Mutual Fund
MIDC - Maharashtra Industrial Development Corporation
MNC - Multi National Company
NCAER - National Council for Applied Economic Research
NISM - National Institute of Securities Markets
NSCCL - National Securities Clearing Corporation Limited
NSDL - National Securities Depository Limited
NSC - National Savings Certificate
NSE - The National Stock Exchange
OIAE - Office of Investor Assistance and Education
OTCEI - Over the Counter Exchange of India Limited
PAN - Permanent Account Number

15
PE ratio - Price Earnings ratio
PPF - Public Provident Fund
PSE - Public Sector Enterprises
QIBs - Qualified Institutional Buyers
RBI - Reserve Bank of India
RSEs - Regional Stock Exchanges
SEBI - Security Exchange Board of India
SGF - Settlement Guarantee Fund
SMAC - Securities Market Awareness Campaign
STP - Straight Trough Processing
UTI - Unit Trust of India
VSAT - Very Small Aperture Terminal

16
CHAPTER - I
INTRODUCTION
Introduction Chapter deals with a brief note about importance of capital
market, Statement of the problem, Objectives of the study, Hypothesis, scope of the
study, Geographical coverage, Field work and collection of data, Limitations of the
study, Research methodology, Main study, Sample size, Tools used in the study,
Operational definitions and Chapter arrangement.
The capital market is used as a main vehicle to mobilize funds for the
economic growth of the country. It performs crucial functions like the conversion of
savings of the households and institutions into investment, creation of financial
assets and development of asset-related products. A well functioning securities
market is conducive to the sustained economic growth of any country in the world1.
There exists a direct relationship between the development in the securities market
and economic growth of a country. The securities market provides a bridge between
ultimate savers and ultimate investors and creates the opportunity to put the savings
of the cautious at the disposal of the enterprising, thus promising to raise the total
level of investment and growth. It allocates scarce savings to the enterprises and
forces them to focus on their performance, which is continuously evaluated through
share prices in the market. It thus converts a given stock of investible resources to a
large flow of goods and services.
The development of the securities market changes the quantum and
composition of savings and investment of the households. The availability of yield-
bearing securities induces people to consume less and invest more in high yielding,
divisible, liquid securities. A strong domestic stock market performance forms the
basis for the well performing domestic corporate to raise capital in the international
markets. The securities market facilitates the internationalization of the economy by
linking it with the rest of the world. This linkage happens through the inflow of
capital in the form of portfolio investment.

17
Financial markets across the globe are undergoing profound, unprecedented
and fast–paced changes2. Technology has revolutionized the processes and the
information explosion has sparked off remarkable changes in the way the world
market has been operating. Change has become an inevitable phenomenon.
Indian Capital market is one of the fastest growing markets in the world. It
has grown impressively during the recent years in tune with the global financial
markets. The Indian Capital Market comprises of two segments, namely, the
Primary and the Secondary market. The fresh issue of securities takes place in
primary market and trading among investors takes place in secondary market. The
primary market is the major channel through which the savings of the households
are mobilized by the companies directly for investment purposes. It is the centre
stage of the capital market that really boosts industrial and financial activities by
providing long term funds to the corporate and the government. It infuses new
securities, adding volume and wider base of securities in the secondary market. The
secondary market affords liquidity to the investment in securities and reflects the
general health of the economy.
Indian corporates mainly raise funds through capital market. Two types of
capital are essentially raised viz., Equity and Debt. Equity forms part of the net
worth and the Debt forms part of the outside liability of the firm. The capital raised
through equity is superior to that of debt capital for both the firm and the investor.
Equity enhances the borrowing power of the firm from banks and financial
institutions. If a firm is able to mobilize sizable amount of equity capital through
primary market, it can approach banks to fund long-term investment. From the
investor’s point of view, it could be noticed that over the long term, the equity
investments have out-performed debt and other asset classes across the globe. In
India, looking at the 8 years Compounded Annual Growth Rate (CAGR), equity
returns have out-performed debt to the tune of 15.8 percent3.
The Indian Capital Market has witnessed unprecedented euphoria from the
early nineties and it has won critical appreciation from various quarters4. At present
there are 19 Stock Exchanges in India. The National Stock Exchange (NSE) and

18
Bombay Stock Exchange (BSE) together account for more than 99 percent of the
total turnover having a combined market capitalization of $ 125.5 billion. Around
9600 companies are listed in NSE and BSE.
Success of equity issues totally depends on the confidence of the investors. If
the investors perceive high profitability prospects, they will invest in equity. There
are two types of investors, namely, institutional investors and retail investors
(households). Institutional investors are huge investors who operate through
Portfolio Managers. Portfolio Managers only shuffle around the holdings in the
existing scrips in their basket, based on their subjective evaluation of various scrips
but they do not inject the much needed risk capital to upcoming enterprises to
undertake new industrial activities. Even Foreign Institutional Investors (FII’s)
generally bring capital into the country only to acquire shares in the existing highly
profitable companies but do not provide risk capital to the corporate world. It is the
Retail Investor i.e. the household sector, who is the only source of providing risk
capital5. The Retail Investor provides this risk capital, either directly by investing in
equity market or through collective schemes popularly called as Mutual Funds.
There are 39 Mutual Funds offering about 600 schemes to the households, managing
assets to the tune of Rs. 3,10,171 crores (US $ 68 billion) at the end of October
20066. Indian retail investors have been directly participating in equity markets and
taking price fluctuations for decades. The household sector generates more than $ 30
billion of savings every year, which is available to the Indian financial system. It is
the only source of providing risk capital within the country.
It is globally recognized that the growth of the economy depends to a large
extent on the growth of the securities market, as it provides the vehicle for raising
resources and managing risks. The growth of the securities market is the result of
high confidence of the investors, that too the retail equity investors, the only risk
capital providers of yesterday, today and tomorrow.
1.2 STATEMENT OF THE PROBLEM
The stock market is one of the most vital and dynamic sectors in the financial
system making an important contribution to the economic development of a country.

19
Investors are the backbone of the capital market and they are not alike. Institutional
investors are capable of understanding the intricacies involved in the stock market
activities but the retail investors lack adequate awareness about it. As the bulk of the
savings of the country generally emanate from the households, and the retail investor
is still the major source of risk capital to upcoming enterprises, to undertake new
industrial activities, the capital market cannot grow without their participation,
directly or indirectly.
With the liberalization of the Indian capital markets, securities market has
grown into one of the most dynamic, modern and efficient markets. The
infrastructure and operating efficiency of the Indian stock markets are well
appreciated by its global counterparts. In India, to encourage, enhance and safeguard
retail investor participation and to make the markets more efficient, a number of
reforms have been initiated by the Security Exchange Board of India (SEBI). In the
case of fixed price public issues and book built issues, 50 percent and 35 percent
shares respectively are being allotted to the retail investors7. As small investors find
it difficult to participate directly in the capital market to a significant extent, SEBI
encourages mutual fund industry to offer innovative products to suit the risk appetite
of the retail investors.
In spite of all the efforts taken by SEBI to attract and enhance retail
participation, the household (retail) savings and investment scenario is highly
disappointing. According to the SEBI – NCAER survey, only 7.4 per cent of the
Indian households directly participated in the securities market in 2000 as against
about 50 percent in the USA. As the economy grew at 8.5% in 2003-04, GDS (Gross
Domestic Savings) rate reached 28.1 percent of GDP, (Gross Domestic Product) and
the household financial savings increased to 11.4 percent of GDP, but the capital
market instruments contributed barely 1.4 percent of the financial savings and
investment. In 2004 – 2005, though India’s GDS in proportion to GDP was 29.1
percent, the investment by households in shares and debentures stood at a meager
0.8 percent of GDP8.

20
Despite the developments happening in the capital market in India and even
after a decade of existence of a vibrant capital market, the equity instruments are not
considered as an attractive household investment.
The ill effect of such a phenomenon is that, if such a situation persists, the
performance of the capital markets will be determined and dominated by a few large
and wealthy players. High dependence on FII funds will lead to a volatile and high
risk market which will make the retail investor the only risk capital provider-extinct.
This will hamper the whole growth of the securities market and in turn the economic
growth of the nation. So bringing the retail investors back into the equity market
would be a very healthy structural development for the nation itself.
The recent economic recession had a great impact on stock market. The
developing countries also taste the economic downtrend. The Indian economy is also
not left out. Before the recession, Indian economy was moving at a faster rate
because of the growth in information technology and other sectors. But after the
recession the economic level comes down and there will be some velocity in the
Indian stock market conditions. As the regulatory system is so strong in India, the
stock market is able to withstand many odds. Since the stock market is all the time
unpredictable and unstable, the investors are all the time at very high risk. They have
to consider many factors like Economic environment, Political stability, Industrial
growth etc., before they invest. Though there are many studies on the stock market
related areas, the information provided to the investor and industry is not sufficient.
As a result the investor and the stock market players will be searching for required
information. There are some research gaps in the existing literature relating to the
stock market.
Hence the current study is undertaken to fill the gaps in the existing research
in the field of stock market and also to provide required information to the investors
as well as industry.

21
1.3 OBJECTIVES OF THE STUDY
1. To study the investment pattern of retail equity investors in Chennai.
2. To analyse the information search and investment option of retail investors.
3. To identify the various investment preferences and investors perception on
risk and return.
4. To examine factors influencing investment evaluation and decision of
investors.
5. To evaluate investors level of satisfaction and their futuristic perceptions
towards retail equity investment.
6. To find the relationship between demographic variables of investors and
their investment objectives, decision and satisfaction.
1.4 RESEARCH HYPOTHESES
1. There is no significant difference between level of risk and returns of
investors.
2. There is no association between investment objectives and satisfaction.
3. There is no association between investment decision and satisfaction.
4. There is no significant influence of demographic variables of investors and
investment objectives, decision and satisfaction.
5. The factors of level of investor’s satisfaction do not differ significantly with
respect to share investments.
1.5 SCOPE OF THE STUDY
The present study covers the investment pattern with regard to retail
investment in equity shares. This study opens fascinating vistas over investor’s

22
preference, perceptional differences and their predominant objectives. This also
paves the way to study the pre and post investment satisfaction in an intensified
manner. It also focuses exact problems associated with equity investment of retail
equity investors in Chennai city.
1.6 GEOGRAPHICAL COVERAGE
The area of coverage of the study is Chennai the capital of Tamilnadu in
India. Chennai is opted for study because of its role in industrial and economic
development of the country.
1.7 FIELD WORK AND COLLECTION OF DATA
Personal interview by the researcher is the major tool used for data
collection. Structured interview schedule is used during personal interviews.
Interviews are conducted at various stock broking houses and at the residence of the
equity investors at their convenience. Before the interview, proper rapport is
established. The data collected are recorded by the researcher in the interview
schedule. The schedules thus filled up are thoroughly checked to ensure accuracy,
consistency and completeness. On an average, each interview took about an hour.
The data thus collected were categorized and posted in the master table for further
processing.
1.8 LIMITATIONS OF THE STUDY
The major limitations of the study are:-
The study is confined to Chennai District alone. Hence the findings
may not be generalised for the other parts of the country.
The study is confined to the retail equity investors alone. Institutional
investors remain uncovered.
The limitations associated with the statistical tools are applicable for the
tools employed in this study also.

23
RESEARCH METHODOLOGY
1.9 PILOT STUDY AND PRE-TESTING
A preliminary investigation is undertaken by contacting 75 investors of
equity shares to identify the important variables regarding characteristic features of
equity shares, instrument and the changes, return of investments, investment
decisions and satisfaction. The purpose of the pilot study is to test the quality of the
items in the questionnaire and to confirm the feasibility of the study. This
preliminary investigation is conducted in different parts of Chennai. The random
sampling method, Cronbach alpha method and Hotellings t-square test are applied. It
is found that the Cronbach alpha value is 0.912 and hotelling t-square value is
422.31 which are statistically significant at 5 per cent level.
It is ascertained that the items in Likert’s five point scale of the questionnaire
are highly reliable and the samples satisfy the normal distribution rationally. So, the
items in the questionnaire can be used further in the study.
1.10 MAIN STUDY
The data is collected for the study by means of a two section questionnaire
(refer Appendix). Section 1 for the questionnaire is framed to obtain the general
information about investment preferences, percentage of investment in equity shares
and different portfolio and sources of information of the equity investment. Section
II deals with the characteristic features of equity shares, their changes, and return on
investments. The section –I of the questionnaire is designed in optional type, where
as the section II is designed in Likerts 5-point scale, ranging from 5-strongly agree,
4-agree, 3-neutral, 2-disagree, 1-strongly disagree. The questionnaire with covering
letter is handed over personally to each and every respondent and they are requested
to return the filled in questionnaire after 15 days, when the researchers visit them.
The respondents took the period of 15 days to 2 months to return the completed
questionnaire.

24
1.11 SAMPLE SIZE
Initially 623 questionnaires are circulated to investors in all the areas of
Chennai city, by following simple random sampling method. Out of the 623
questionnaires only 514 respondents returned the filled in questionnaires. But only
507 of them are found usable. Hence, the exact sample of the study is 507.
1.12 DATA ANALYSIS
The sources of data are primary as well as secondary. The data collected
from the investors’ survey constitutes primary and information gathered through
books, journals, magazines, reports, dairies are considered as the secondary source.
The data collected from both the sources is scrutinized, edited and tabulated. The
data is analyzed using statistical package for social sciences (SPSS) and other
computer packages. The following statistical tools are used in the study.
1. Measures of central tendency and measures of dispersion.
2. Parametric t-test.
3. One-way analysis of variance.
4. Factor analysis.
5. K-means cluster analysis.
6. Multiple discriminant analysis
7. Multiple regression analysis.
8. Non-parametric chi-square analysis
1.13 OPERATIONAL DEFINITIONS
a. Investment
The use of capital is to create money, either through income producing
vehicles or through more risky ventures designed to create capital gains.

25
b. Investment Practices
Usual and repeated way of doing investment (i.e.) usual investment pattern,
preferences, perceptions, investment objectives, factors generally influencing
investments, investment satisfaction, investor’s confidence and problems faced by
investors regularly.
c. Retail Equity Investor
Individual share investor or households investing in shares or small investor.
d. Institutional Investor
Corporates investing huge money in securities.
e. Primary Market
A market where corporates directly issue securities i.e., where initial public
offering is made.
f. Secondary Market
A market where the already issued securities are traded.
g. Mutual Funds
Small investor, collective investment scheme.
h. Derivatives
Financial contracts, whose values are derived from the value of an
underlying primary financial instrument (i.e.) stock futures and options.
i. Dividend
The part of company’s profit distributed to shareholders.
j. Capital Gain

26
Gain arising due to sale of stock.
k. Liquidity
Availability of stock coupled with buyers and sellers for it in the market.
l. Volatility
Sharp rise or fall of share prices over a short period of time.
m. Rights, Bonus and Stock Splits
Rights : A Method of raising additional capital from the existing share
holders.
Bonus : Shares are issued to the existing shareholders at free of
cost in some decided ratio.
Stock splits : Splitting the face value of existing shares and distributing
additional shares on pro-rata to shareholders.
n. Floor Based, Forward Trading
Trading on the stock exchange floor, where contracts traded today are settled
at some future date at the price decided today.
o. Anonymous Screen Based Electronic Trading
Buying and selling of securities using computers and electronic matching of
orders on price / time priority without knowing who the trader is.
p. Clearing and T+2 Rolling Settlement
Clearing is the process by which all the transactions between members are
settled. T+2 Rolling Settlement is the system where trades executed during the day
are settled based on the net obligations for the day. The maximum time that may be
taken for settlement is T+2 (i.e.) Trading day + 2 working days.

27
q. Straight Through Processing (STP)
STP is a system, which allows electronic capturing and processing of
transactions in one pass from the point of order origination to the final settlement.
r. Dematerialisation
The process by which shares in the paper form are converted into electronic
form popularly called as demat.
s. Market Capitalisation
The market value of a company found by multiplying the number of ordinary
shares outstanding with its current market price.
t. Fundamental Analysis
Method of predicting the behaviour of company stock by looking at
fundamental information about the company such as financial health, sales, earnings
and dividends.
u. Technical Analysis
Techniques of predicting share price behaviour by studying the price
movements and trading volumes using charts.
v. Corporatisation and Demutualisation
The system where ownership, management and trading membership would
be segregated from one another.
w. Settlement Guarantee Fund
Fund maintained by the stock exchange to take care of investor claims,
which may arise out of non-settlement of obligations by the trading member as he
has been declared a defaulter or expelled.

28
x. Circuit Breakers
It is an investor protection measure by SEBI to curb excessive price
volatility. It brings about a nation – wide coordinated halt in trading on all equities.
y. Mark-to-Market Margin
It is a risk containment measure computed based on mark-to-market loss of a
trading / clearing member.
z. VaR Based Margins
It is a risk containment measure intended to cover the largest loss that can be
encountered on 99% (value at risk) of the days.
1.14 CHAPTER ARRANGEMENT
Chapter - I Introduction - deals with a brief account on history of equity shares,
elements of equity shares, need and importance of the study and research
methodology.
Chapter - II Review of literature - relevant to the present study, studies on
information search, awareness of factors of characteristics of equity shares and
capital market and investment preferences are included in this chapter.
Chapter - III A conceptual frame work of Indian Equity shares - An Overview -
explains the growth of the market, trends in various years and certain important
overviews.
Chapter - IV Analysis of investment preference and decision deals with an
analysis of primary data with the help of statistical tool.
Chapter - V Analysis of investment satisfaction and portfolio choice –encounters
with multivariate statistical analysis of the primary data

29
Chapter - VI Summary of Findings, Suggestions and Conclusions - summarizes
the findings along with the suggestions to the investors for framing the investment
strategies.
1.15 SUMMARY
In this chapter, the research design is adopted as per the norms and followed
by review of literature in the next chapter.
REFERENCES
1 Levine and Ross, “Stock market Development and Economic Growth”, The
world Bank Economic Review, Vol. 1012), 2008, pp: 323 – 339.
2 Bajpai G.N, “Indian Securities Markets – New Bench Marks”, SEBI
Bulletin, Vol.1, No.8, August 2009, pp: 5-14.
3 “Retail Investments into Equity”, IIM Working paper series, E27119, p:4.
4 Tarapore wala, Russi Jai, “The Union Budget 2005 -06 and the Capital
Market”, BMA Review, Vol. III, No.26, March 14-278, 2006.
5 Ramesh Gupta, “Retail Investor – A lost Species”, IIM Working paper
series, E 15378, p:1.
6 Chopra V.K, “Capital Market Reforms in India: Recent Initiatives”, SEBI
Bulletin, Vol.4, No. 11, Nov 2008, pp: 7-11.
7 Chopra V. K, “Investor Protection: An Indian Perspective”, SEBI Bulletin,
Vol.4, No.11, Nov 2010, pp: 11-15.
8 Ibid., Pp.24-26

30
CHAPTER - II
REVIEW OF PREVIOUS STUDIES
INTRODUCTION
Chapter two portrays review of literature, which briefly discusses about six
objectives which is stated in the objectives of the study.
Behavioural Finance is the study of how humans interpret and act on
information to make informed investment decisions. It is one of the most interesting
and fascinating fields of research throwing light on the motives, preferences,
perceptions and expectations of the investors. The emergence of behavioural finance
has presented a new realm for analyzing the ways in which investors make decisions
that includes psychological factors, as well as providing new grounds of modeling
investor behaviour. The study of investor behaviour has attracted researchers with a
variety of backgrounds. In this chapter the various literatures over a period of 10
years has been reviewed and presented.
2.2 The investment profile and pattern of retail equity investors.
1. Mart Grinblatt and Matti Keloharju, (2011), in their study entitled, “The
Investment Behaviour and Performance of Various Investor Types: Study of
Finland’s Unique Data set”, analysed the extent to which past returns
determine the propensity to buy and sell. The study revealed that foreign
investors tend to be momentum investors, buying past winning stocks and
selling past losers. Domestic investors, particularly households contradicted
the same. This difference in Investor behaviour was consistent in regular
intervals. The portfolios of foreign investors outperformed the portfolios of
households, even after controlling the behaviour difference.
2. Maruthu Pandian. P, Benjamin Christopher , (2010), conducted a study
entitled, “A Study on Equity Investor Awareness” in order to study the stock

31
market literacy of the investors about the company, stock exchanges as well
as capital market regulatory bodies. The primary data using multiple
regression, path analysis and chi-square test along with ANOVA clearly
revives difference in the awareness among the investors. The research work
found that the awareness index is high among young male investor, post-
graduates and meticulous business men.
3. Society for Capital Market Research and Development, (2009), conducted a
survey entitled, “Indian Household Investors Survey-2004”, the study was
based on direct interviewing of a very large sample of 5908 household heads
over 90 cities and across 24 states. The study states that price volatility, price
manipulation and corporate mismanagement / fraud have persistently been
the household investors’ top three worries in India. A large percentage of
investors had a negative opinion on company managements. A majority of
retail investors in India do not regard mutual fund equity schemes as a
superior investment alternative to direct holding of equity shares. Retail
investors overwhelmingly prefer bank deposits rather than liquid / money
market funds. Shareholding in 3-10 companies is the dominant practice
among retail shareholders in all income and age classes. Middleclass
investors are long term and conservative. Equity shares have achieved a
much higher degree of penetration among middleclass households compared
to other capital market instruments.
4. HorstRaff and Michael J.Ryan, (2008), in their paper, “Firm-Specific
Characteristics and the Timing of Foreign Direct Investment Projects”, this
paper uses a proportional hazard model to study foreign direct investment by
Japanese manufacturers in Europe between 1970 and 1994. We divide each
firm’s investment total into a sequence of individual investment decisions
and analyze how firm-specific characteristics affect each decision. We find
that total factor productivity is a significant determinant of a firm’s initial
and subsequent investments. Parent-firm size does not have a significant
influence on the initial decision to invest. Large firms simply have more
investments than smaller firms. Other firm-specific characteristics, such as

32
the R&D intensity, export share and keiretsu membership, also play a role in
the investment process.
5. Sudershan kuntluru and D. Mohd Akbar Alikhan , (2009) , in their article,
“Financing pattern of foreign and domestic owned pharmaceutical
companies in India”, foreign Direct investment has often seen as major
source of long term capital which provides bundle of other benefits to the
host county company. In this paper, we made an attempt to examine the
financing pattern of foreign and domestic owned pharmaceutical companies
in India. It has been hypothesized that there is no significant difference
between the financing pattern of domestic and foreign owned companies.
The financing pattern has been analyzed based on traditional methodology
such as common size statement, trend analysis and ratio analysis. The results
and analysis indicate mat domestic companies are highly levered than
foreign owned companies in pharmaceutical industry.
6. William A. Birdthistle and M. Todd Henderson, (2009), in their article, “one
Hat Too many? Investment Desegregation in private Equity”, the nature of
private-equity investing has changed significantly as two dynamics have
evolved in recent years: portfolio companies have begun to experience
serious financial distress, and general partners have started to diversify and
desegregate their investment strategies. Both developments have led private-
equity shops—once exclusively interested in acquiring equity positions
through leveraged buyouts—to invest in other trenches of the investment
spectrum, most particularly public debt. By investing now in both private
equity and public debt of the same issuer, general partners are generating a
host of new conflicts of interest between themselves and their limited
partners, between multiple general partners in the same consortia, and
between private investors and public shareholders.
7. Diptendu simlai, (2009), in his paper, “An inquiry into the origin and growth
of the capital market in India”, India’s modern capital market did not emerge
in a day. This market, since its inception in the 18th century with the

33
establishment of the Bank of Hindustan (1770) in Calcutta, laid the
foundation of the modern capital market in India according to A. K. Sur, a
noted stock market economist of his time (Sur, Evolution of Capital Market
in India, Economic Affairs, Nov-Dec/1960). The objective of this paper is to
trace the evolution of this market right from the late 18th century up to our
times. For purposes of our study the entire time span has been divided into
four periods. The first covers the 18th and 19th centuries. The second
extends from the early 20th century up to 1947, the year of Independence.
For the enormous impact of the economic reforms upon the capital market,
the post-Independence era has been divided into two periods: one ending
with 1990 and the other starting with 1991.
8. Yadagiri. M and P.Rajender, (2009), in their article, “Analysis of investment
portfolio of scheduled commercial banks”, the reforms have unleased
tremendous changes in the banking sector. The government of India issued
guidelines to the banks by permitting and encouraging them to diversify their
activities and contributing to the equity of companies by offering financial
services.
2.3 The information search and investment option of retail investors.
9. Bloomfield, Libby and Nelson, (2011), in their study entitled, “Confidence
and the Welfare of Less Informed Investors”, have indicated that less
informed investors are over confident in investments. Providing more
information to professional investors only could harm the welfare of less
informed investors if less informed investors are not aware of the extent of
their informational disadvantage.
10. Statman, (2010), in his research entitled, “A Century of Investors”,
compared the investors a century ago with investors today. He concluded
that today’s investors are more rapidly informed than their predecessors, but
they are neither better informed nor better behaved.

34
11. Stout, (2010), in his study entitled, “The Investor Game”, has indicated that
investors have adaptive and not rational expectations. Adaptive expectations
result in both trust and mistrust in securities market based on past actions.
12. Shivkumar Deene, Madari D.M and Gangashetty, (2009), in their paper,
“Capital market Reforms: some issues”, capital market is vital for the
development and strength of economy. A strong and vibrant capital market
assists corporate world initiatives, finance and exploration of new processes
and instruments facilitates management of financial risk. Retail investor is
the backbone of the capital market. But with the expansion of the capital
market, scams and anomalies, also multiplies. It ultimately leads to the
dilution of the faith of the small investor, mutual funds, pension funds,
Foreign Institutional Investor and insurance companies in the capital.
Realising that the government made different as capital market reforms. This
includes educating capital market participants regarding their rights and
duties for proper functioning of capital market.
13. Alok Kumar, (2009), in his paper, “Who Gambles In the Stock Market? “this
paper examines whether socio-economic and psychological factors, which
are known to influence lottery purchases, lead to excess investment in
lottery-type stocks. The results indicate that, unlike institutional investors,
individual investors prefer stocks with lottery-type features. The demand for
lottery-type stocks increases during bad economic times and demand shifts
influence the returns and idiosyncratic volatility of those stocks. The
evidence of the study indicates that people’s attitudes towards gambling are
reflected in their stock investment choices and stock returns.
14. Nagarajan. R, (2006), in his article, “Green shoe option in IPO”, for
stabilizing post-listing share price, a company making an Initial Public Offer
(IPO) through the Book Building mechanism can hold the Green Shoe
Option. This is an option that allows underwriter of an Initial Public Offering
to sell additional shares to the public. The challenge for the regulator would
be to keep fraudulent issues away from the market. In order to avoid

35
fraudulent issues investors too should do their homework before investing in
IPO, because it is investor's hard earned money and he should invest it
carefully.
15. Subha. M.V, (2008), in her article entitled, “Indian Capital Markets–A Road
Ahead”, addressed the current issues in the Indian capital market, lack of
individual participation and the ways of restoring investor confidence. The
article concluded that the responsibility of creating an environment of trust
and confidence lies with the regulators, stock exchanges and companies.
Each of them should act in a responsible way and provide a healthy
atmosphere for the functioning of an efficient capital market.
16. Kavitha Ranganathan (2008), in their paper, “A study of fund selection
behavior of individual investors towards mutual funds: With reference to
Mumbai city”, consumer behavior from the marketing world and financial
economics has brought together to the surface an exciting area for study and
research: Behavioral finance. As this is a serious subject analysts seem to
treat financial markets as an aggregate of statistical observations, technical
and fundamental analysis. A rich view of research waits this sophisticated
understanding of how financial markets are also affected by the “financial
behavior” of investors. Hence, this study is an attempt to examine the related
aspects of the fund selection behavior of individual investors towards mutual
funds, in the city of Mumbai and it showed the way for further research in
this field.
17. Jones Nilsson , (2007), in his article, “Investment with a Conscience:
Examining the Impact of Pro-Social Attitudes and Perceived Financial
Performance on Socially Responsible Investment Behavior”, this article
addresses the growing industry of retail socially responsible investment
(SRI) profiled mutual funds. The study examined the impact of a number of
pro-social, financial performance, and socio-demographic variables on SRI
behavior in order to explain why investors choose to invest different
proportions of their investment portfolio in SRI profiled funds. Some 528

36
private investors including women were investigated the results showed that
women and better-educated investors were more likely to invest a greater
proportion of their investment portfolio in SRI. Overall, the findings indicate
that both financial perceptions and pro-social attitudes are connected to
consumer investment in SRI.
18. Mahabaleswara Bhatta. H.S., (2009), in his paper, “Behavioral Finance- A
discussion his individual investor biases”, in this article, an attempt has
been made to throw light on the investors’ biases that influence decision
making process. Empirical studies have time and again proved that the
irrational behaviors have caused stock market bubbles and crashes. The
knowledge so developed through the studies would provide a framework of
behavioral principles within which the investors react. The article suggests
for a time bound program to educate and counsel the individual investors
about the wisdom required in stock trading and be aware of unethical and
tactical practices of brokers ,shady dealings of the companies and the insider
trading.
19. Chattopadhyay. P, (2010), in his article, “Retail investors in IPO
subscription”, in the liberalization regime of India, there has been a renewed
emphasis on the equity cult and a growing stress of what is termed market
capitalization. The number of retail investors has already become substantial
and is still growing. This underlines the need for safety and security of the
money invested along with the promise of augmented yield. These have
required the government and the regulatory bodies to provide necessary
systems and methods for safeguarding the interests of the small, retail
investors The Securities and Exchange Board of India has recently mooted a
proposal to the effect that in the cases of retail investors seeking to subscribe
to the share offers by the public limited companies, cash transactions should
take place only after the allotment has been made. The proposed intention of
SEBI is to be lauded; there are other parts which are not as commendable.
The proposal does not appear fool-proof on one side, and may be easily
subject to abuse, on the other. Least of all, the proposal may not restore

37
parity between the institutional and retail investors, which is the major
objective of the new approach. The steps taken by the regulatory authorities
are not enough and the centrifugal forces triggered internally, that would lead
to undesirable repercussion.
2.4 Investment preferences and investors perception on risk and return.
20. Rajarajan. V, (2011), conducted a study entitled, “Investors Life Styles and
Investment Characteristics”, with the objective of analyzing the investors life
styles and to analyse the investment size, pattern, preference of individual
investors on the basis of their life styles. Data was collected from 405
investors in Madras using questionnaire method. The investors were
classified into 3 groups’ viz., active investors, individualists and passive
investors. Cluster Analysis, Correspondence Analysis and Kruskal Wallis
Test were used to study the association between lifestyle groups and the
various investment related characteristics. The study revealed that the level
of expenses, earnings and investment were associated with the size of the
household. Active investor group was dominated by officers, individual
group by clerical cadre and passive investors group by professionals. The
expected rate of return from investments varied between investment styles.
The study clearly indicated that market performance of the share, company’s
operating level, capital performance and the expectation of the investors
were found to influence the risk perception of the investors.
21. Bandgar. P.K, (2011), in his study entitled, “A Study of Middleclass
Investor’s Preferences for Financial Instruments in Greater Bombay”, studied
the existing pattern of financial instruments in India and the performance of
middle class investors, their behaviour and problems. Questionnaire was
administered to collect data. Average, Skewness, Chi-square test and Fisher
Irving Test were used to analyse the data. The study revealed that only 16%
of the investors were facing difficulties in buying and selling securities.
Middle-class investors were highly educated but they were lacking skill and
knowledge to invest. Female investors preferred to invest in risky securities

38
as compared to male investors. The study also revealed that there was a
moderate and continuing shift from bank deposits to shares and debentures,
and a massive shift towards traditional financial instruments namely, life
insurance policies and government securities.
22. Charles Lee, M.C and Balakrishna Radhakrishna, (2010), in an article
entitled, “Inferring Investor Behaviours: Evidence from TORQ Data”, made
an attempt to examine the several techniques commonly used to infer
investor behaviour from transaction data. They adopted Lee-Ready (1991)
algorithm for distinguishing trade decision. The results show that frequency,
size and direction of observed trades provide a reasonable basis for
evaluating the incoming flow of market orders.
23. Dechow, Hutton and Sloan, (2011), in their study entitled, “Mastering
Finance”, found that analysts’ growth forecasts are routinely over optimistic
around new equity offerings, but the most over optimistic are those analysts
employed by the lead underwriters of the offerings.
24. Malcolm Baker and Jeffrey Wurgler, (2011), in their paper, “A catering
theory of dividends”, we develop a theory in which the decision to pay
dividends is driven by investor demand. Managers cater to investors by
paying dividends when investors put a stock price premium on payers and
not paying when investors prefer nonpayer. To test this prediction, we
construct four time series measures of the investor demand for dividend
payers. By each measure, nonpayer’s initiate dividends when demand for
payers is high. By some measures, payers omit dividends when demand is
low. Further analysis confirms that the results are better explained by the
catering theory than other theories of dividends.
25. Selvam. M, et.al, (2010), in their study entitled, “Equity Culture in Indian
Capital Market’, examined the need for promoting equity culture, which
deserves special attention for the development of economic growth. The
study discussed in detail the current trend of equity culture, its implications

39
and its revival and remedial measures. The study suggested intervention by
government, SEBI and RBI and evaluation of suitable credit policy for
projects in order to assure safety and assured returns to the investors, in order
to restore investor confidence.
26. Alexander LJungquist and Matthew Richardson , (2010), in his study, “The
Investment Behaviour of Private Equity Fund managers”, using a unique
dataset of private equity funds over the last two decades, this paper analyzes
the investment behavior of private equity fund managers. Based on recent
theoretical advances, we link the timing of funds’ investment and exit
decisions, and the subsequent returns they earn on their portfolio companies,
to changes in the demand for private equity in a setting where the supply of
capital is ‘sticky’ in the short run. We show that existing funds accelerate
their investment flows and earn higher returns when investment opportunities
improve and the demand for capital increases. Increases in supply lead to
tougher competition for deal flow, and private equity fund managers respond
by cutting their investment spending. These findings provide complementary
evidence to recent papers documenting the determinants of fund-level
performance in private equity.
27. Santi Swarup. K, (2010), in his survey entitled, “Measures for Improving
Common Investor Confidence in Indian Primary Market: A Survey”,
analysed the decisions taken by the investors while investing in primary
markets in the first part: secondly the factors affecting primary market
situation in India was analysed and finally the survey evaluates various
revival measures available for improving investor confidence. The survey
was conducted in 10 cities in India by mailing questionnaire. The survey
results of 367 investors revealed that the investors give importance to own
analysis and market price as compared to broker’s advice.
28. Stephanie Desrosiers, Jean - Francois L”Her and Jean – Francois Plante ,
(2010), in their article, “Style management in Equity Country Allocation”,
strategies that entailed country selection based on relative strength

40
(momentum) posted significant market risk– adjusted returns over the past
30 years, but relative-value strategies based on book value of equity to
market value of equity did not. Because these two fixed-style strategies are
negatively correlated, using them for style diversification and for style timing
(rotation) is potentially rewarding. In the study described here, style
diversification enhanced return and lowered risk but style timing provided
consistent risk-adjusted performance that was superior to the performance of
fixed-style strategies or style diversification.
29. Jaspal Singh and subhash chandler , (2011) , in their article, “Investors’
preference for investment in mutual funds: An empirical evidence”, since
interest rates on investments like PPF, NSC, bank deposits, etc., are falling,
the question to be answered is: What investment alternative should a small
investor adopt? One of the alternatives is to invest in capital markets through
mutual funds. This helps the investor avoid the risks involved in direct
investment. Considering the state of mind of the general investor, this article
figures out: (i) the preference attached to different investment avenues by the
investors; (ii) the preference of mutual funds schemes over others for
investment; (iii) the source from which the investor gets information about
mutual funds; and (iv) the experience with regard to returns from mutual
funds. The results show that the investors consider gold to be the most
preferred form of investment, followed by NSC and post Office schemes.
Hence, the basic psyche of an Indian investor, who still prefers to keep his
savings in the form of yellow metal, is indicated. Investors belonging to the
salaried category, and in the age group of 20-35, years showed inclination
towards close-ended growth (equity-oriented) schemes over the other scheme
types. A majority of the investors based their investment decision on the
advice of brokers, professionals and financial advisors. The findings also
reveal the varied experiences of respondents regarding the returns received
from investments made in mutual funds.
30. Gnana Desigan. C. et.al, (2011), in their study entitled, “Women Investors
Perception Towards Investment–An Empirical Study”, identified the

41
investment pattern, preference, influencing factors and problems of women
investors in Erode town. The findings of the study reveal that, women
investors prefer to invest in bank deposits and jeweler, they are influenced by
safety and liquidity and the problems faced by them are cumbersome
procedures and formalities, commission and brokerage.
31. Shobana. V.K. and Jayalakshmi. J, (2010), in their study entitled, “Investor
Awareness and Preferences”, studied the investors’ preferences, the level of
investor awareness and the factors influencing investor awareness of 100
respondents in Salem District. The study reveals that real estate, bank
deposits and jeweler were the preferred investments. Investors above 50
years of age, post graduates and professionals had high level of awareness.
Age and education do not have any significant influence over investor
awareness but occupational status leads to difference in the awareness level
of people.
32. Meir Statman, Steven Thorley and Keith Vorkink, (2010), in their paper,
“Investor overconfidence and Trading volume”, the proposition that
investors are overconfident about their valuation and trading skills can
explain high observed trading volume. With biased self-attribution, the level
of investor overconfidence and thus trading volume varies with past returns.
We test the trading volume predictions of formal overconfidence models and
find that share turnover is positively related to lag returns for many months.
The relationship holds for both market-wide and individual security turnover,
which we interpret as evidence of investor overconfidence and the
disposition effect, respectively. Security volume is more responsive to
market return shocks than to security return shocks, and both relationships
are more pronounced in small-cap stocks and in earlier periods where
individual investors hold a greater proportion of shares.
33. Viswambharan A.M, (2008), in his article entitled, “Indian Primary Market –
Opportunities and Challenges”, has examined the recent trends in primary
market, the current IPO system – book building process, opportunities for

42
investors, problems faced by the investors and has suggested that investors
should rely on long term investment than speculation. Investor education
shall be strengthened. Commercial banks may take-up investment
consultancy for their clients to improve investor participation.
34. Narendra Jadhav, (2010), in his article, “Development of Securities Market –
The Indian Experience”, the Indian securities markets have witnessed far-
reaching reforms in the post-liberalization era in terms of market design,
technological developments, settlement practices and introduction of new
instruments. The markets have achieved tremendous stability and as a result,
have attracted huge investments by foreign investors. There still is
tremendous scope for improvement in both the equity market and the
government Securities market. However, it is the corporate debt market,
which needs to be given particular emphasis given its importance for
providing long-term finance for development.
35. Dan palmon and Fred Sudit, (2011), in their article, “shareholders’ defensive
security shares”, the purpose of this paper is to explore the possibilities and
merits of offering shareholders an equity instrument (new class of common
shares) designed to protect their investments from managerial opportunism.
To this end, we propose a special class of shares, the Shareholders ’
Defensive Security Shares (SDSS), which would oblige Boards of Directors
to declare a pre-specified extra dividend whenever executive pay exceeds a
contractually pre-determined threshold. SDSS could be extended into a
larger class of Defensive Security Instruments (DSI) that includes regular
bonds, convertible bonds, and preferred stocks. We argue that this defensive
equity, the Shareholders ’ Defensive Security, or SDSS, could be beneficial
to managers as well as shareholders. What’s more, the use of SDSS is
completely voluntary and requires no additional regulation.
36. Kameswari. P, (2008), in his article, “Foreign Direct investment and its role
in developing Indian economy”, investment is an important factor in
influencing the economic development of a country. Developing countries

43
like India have investment requirements far greater than their domestic
savings can meet. Their investment deficits can be bridged by foreign capital
flows in the form of Foreign Direct Investment and Portfolio Investment.
But the huge flows of foreign capital may introduce some problems like
inflation. In the interest of future economic growth and development a
developing economy has to institute some safeguards in its national interest
while welcoming the foreign investment. This article studies how India is
faring in its efforts to attract foreign direct investment and in channelising
the flows for the growth of economic development.
37. Som Sankar Sen and Santanu Kumar Ghosh , (2008) , in their paper, “Stock
Market Liquidity of BSE and NSE: A Comparative Study (1995- 2005)”, this
study compares between BSE and NSE in terms of Stock Market Liquidity
during the study period of January 1995 to December 2005. The study
reports that mean liquidity of NSE is higher than that of the BSE during this
period. It also reveals that in most of the months BSE remains more
vulnerable than NSE during this span of time in terms of liquidity. A
monthly pattern of liquidity could be observed in case of NSE but no such
monthly pattern is there in case of BSE. Finally, a positive correlation
between these two exchanges has been reported indicating no significant
movement of volume from one exchange to another.
38. Nissim Ben David, (2008), in his paper, “An indicator for internalization of
analyst’s recommendations by investors”, this paper proposes an index for
evaluating the internalization of an analyst’s recommendations by investors
at various points of time that follow the recommendation day. The model is
applied to the Israeli stock market for the years 2004 and 2005. The results
indicate that investors in the Israeli stock market internalize a
recommendation 14 days after its publication. Internalization continues 30
days after the publication day. The importance of this paper is that it is the
first time an index for evaluating investor’s reaction to analyst’s
recommendations in various stock markets has been proposed. Such
information is valuable, since it can improve investment strategies that

44
follow the publication of an analyst’s recommendation. An investor would
prefer buying a recommended stock when he expects a large return and
would sell it when the recommendation’s effect is exhausted.
39. Mohanty. B.K , (2008), in his article, “Market capitalization: A suitable
growth approach for share holders’ value creation”, before economic reforms
were initiated in 1991, companies in the Indian corporate sector had to
function amidst the license regime, quotas and restrictions, high taxes and
host of other rules and regulations. Companies are now allowed to borrow
from and invest abroad quite liberally. All this has done wonders for
corporate India. Over the past 15 years of reforms, corporate profits have
gone from Rs. 6440 crore in financial year 1991 to Rs.1,67,801 crore in
financial year 2006.
40. Henry L. Petersen and Harrie Vreden burg, (2009), in their article, “Morals
or Economics? Institutional Investor Preferences for Corporate Social
Responsibility”, this article presents the results of a study that analysed
whether social responsibility had any bearing on the decision making of
institutional investors. Being that institutional investors prefer socially
aligned organizations, this study explored to what extent the corporate
actions and/or social/environmental investments influenced their decisions.
Our results suggest that there are specific variables that affect the perceived
value of the organization, leading to decisions to not only invest, but whether
to hold or sell the shares, and therefore having a consequential impact on the
capital market’s valuation.
41. Sakthivel. N, (2010), in his paper, “EVA – MVA: Shareholders’ value
measure”, maximizing shareholders value is becoming the new corporate
standard in India. The corporate, who gave the lowest preference to the
shareholders’ inquisitiveness, are now bestowing the utmost inclination to it.
Shareholders’ value is measured in terms of the returns they receive on their
investment. The returns can either be in the form of dividends or in the form
of capital appreciation or both. For measuring the corporate financial

45
performance, there are accounting profitability measures and shareholders’
value based measures. Accounting profitability measures include ROI, ROE,
EPS, ROCE and DPS etc., Shareholders valued based measures include EVA
and MVA. EVA in Indian environment and relationship between EVA
(Economic Value Added) and MVA (Market Value Added).
2.5 Factors influencing investment evaluation and decision of investors.
42. Iran Peacock and Stuart Cooper, (2011), in their article, “Private equity:
implications for financial efficiency and Stability”, this article (1) describes
the current state of the UK private equity market. It also considers the extent
to which private equity promotes efficiency by facilitating the ‘shake-up’ of
businesses, and whether the success of investment houses in attracting
substantially increased funds for investment poses any threats to financial
stability. Private equity comprises equity investment in all types of unquoted
companies, whether provided by individuals, funds or institutions.(2) The
article concentrates on larger transactions (particularly management buy-outs
and buy-ins of over £10 million), and excludes start-up and early-stage
venture capital finance, which in effect forms a distinct market with different
characteristics.
43. Security Exchange Board of India (SEBI) along with National Council of
Applied Economic Research (NCAER), (2011), conducted a comprehensive
survey of the Indian investor households entitled, “Survey of Indian
Investors”, in order to study the impact of the growth of the securities market
on the households and to analyse the quality of its growth. 25,000 investors
were drawn from places all over India and the data were collected by
administering questionnaire and through personal interviews. The survey
was carried out with the major objective of drawing a profile of the
households and investors and to describe the demographics, economic,
financial and equity ownership characteristics. The study revealed that
majority of the equity investors had long term motive of investment.

46
Investors revealed that they had a number of broker related problems than
the issuer related problems.
44. David R. Gallagher, (2011), in his study, “Investment manager
characteristics, Strategy, top management changes and fund performance”,
this study examines the performance of Australian investment management
organisations with direct reference to their specific characteristics and
strategies employed. Using a unique information source, performance is
evaluated for actively managed institutional balanced funds, Australian share
funds and Australian bond funds. The study examines the performance of top
management and the impact on returns when turnover arises. The research
documents that a significant number of active Australian equity managers
earned superior risk-adjusted returns in the period; however active managers
perform in line with market indices for balanced funds and Australian bond
funds.
45. Hall, (2011), has conducted research entitled, “Do Brokers Buy, Hold and
Sell Recommendations of Value to Individual Investors? he found that
investors, who invested in the Johannesburg Securities Exchange (JSE)
based on their brokers’ advice, were able to get risk adjusted returns superior
or equal to the market.
46. Santi Swarup. K, (2010), in his study entitled, “Role of Mutual Funds in
Developing Investor Confidence in Indian Capital Markets”, identified safety
and tax savings as the important factors affecting investment in various
avenues by the investor and developed strategies for enhancing common
investor confidence such as good return, transparency, investor education,
guidance etc.
47. Mohammad salahuddin and Md. Rabiul Islam, (2010), in their article,
“Factors affecting investment in developing countries: A panel data study”,
this paper investigates the gross investment behavior in a panel of 97
developing countries spanning a period between 1973 and 2002. Fixed Effect
Model is employed to analyze data. Variance Inflation Factor (VIF) test is

47
conducted to ensure that the data are free from multicollinearity. Also,
Granger Causality test is conducted to see if reverse causality exists. 2- Step
1st Difference Generalized Method of Moments (GMM) dynamic panel
estimator has been employed to offset unobserved heterogeneity and
endogeneity of regressors. The results suggest that investment decisions still
seem to be significantly affected by traditional determinants such as growth,
domestic savings, trade openness etc. The variable aid appeared to
potentially affect investment which calls for developing country’s measures
to ensure proper utilization of it.
48. Alexandra Dawson , (2004), in his study, “Investigating decision- making
criteria of private equity investors in family firms”, this paper examines
decision-making models used by private equity investors in their selection of
family firms. Building on literature on investment criteria at start-up stage, a
series of hypotheses is put forward, based on decision-making, strategic
management and buyout theories. The theoretical model is tested through an
experimental design for which data have been collected among 41
respondents based in Italy. Findings are analysed using hierarchical linear
models, in order to investigate which criteria are used, assess their relative
importance and test whether decision-making models are individual-specific
or influenced by the firm individuals work for.
49. Xuewu wang, (2004), in his paper, “sentiment strategies”, this paper
documents the profitability of the sentiment strategies. Using the aggregate
closed-end fund discount as a proxy for investor sentiment, a simple
sentiment strategy is constructed on the basis of the exposure of stock returns
to the closed-end fund discount. The sentiment strategies buy stocks with
highest exposure to closed-end fund discount and sell stocks with lowest
exposure to closed-end fund discount in the past 36 months. It is shown that
such a strategy can lead to an annualized profit of 11%. The source of the
profitability is explored and it is found that neither market risk nor
momentum anomaly can account for the profitability. However, the
traditional four factor asset pricing model when augmented with an

48
additional sentiment factor can account for the profit. This finding is
interpreted as supportive evidence to the fact that the pricing of the investor
sentiment risk may be a potentially useful explanation for profitability.
50. Arvid O I Hoffmann and Wander jager, (2005), in their paper, “The effect of
different needs, decision-making processes and network-structures on
investor behavior and stock market dynamics: A simulation approach”,
striking investor and stock market behavior have been recurrent items in the
world press for the recent past. Crashes and hypes like the internet bubble are
often hard to explain using existing finance frameworks. Therefore, the
authors provide a complementing multi-theoretical framework that is built on
existing finance research to describe and explain investor’s behavior and
stock market dynamics. This framework is built on three main components:
Needs, decision-making theory, and (social) network effects. This framework
will be used to build a future simulation model of investor behavior and to
generate stock market dynamics. A brief outline of the design of these
simulation experiments as well as examples of the first results will be given.
51. Qiang Cheng and Terry D. Warfield, (2005), in their article, “Equity
incentives and earnings management”, this paper examine the link between
managers’ equity incentives. We hypothesize that managers with high equity
incentives are likely to sell shares in the future and this motivates these
managers to engage in earnings management to increase the value of the
shares to be sold. Using stock – based compensation and stock ownership
data over the 1993- 2000 time period, we document that managers with high
equity incentives sell more shares in subsequent periods. As expected, we
find that managers with high equity incentives are more likely to report
earnings that meet or just beat analysts’ forecasts. We also find that
managers with consistently high equity incentives are less likely to report
large positive earnings surprises. This finding is consistent with the wealth of
these managers being more sensitive to future stock performance, which
leads to increased reserving of current earnings to avoid future earnings

49
disappointments. Collectively, our results indicate that equity incentives lead
to incentives for earnings management.
52. Vibha Mahajan and Poonam Aggarwal, (2005), in their paper, “Foreign
investment – need for a more competitive and open policy”, the forces
driving globalization are changing the way in which MNCs pursue their
objectives of investing abroad. Traditional factors such as existence of a pro-
FDI regime, natural resources, market growth prospects and market size,
labor market conditions are important and also the surveys conducted by
UNCTAD during the first quarter of 2004. FDI flows are expected to pick up
particularly in Asia and Pacific and CEE. China and India in Asia and Poland
in CEE is considered to be especially well positioned for an upswing. This
paper is an attempt to find out ways how India can attract foreign investment.
53. Marcela Meirelles Aurelio, (2008), in his article, “Going Global: The
Changing pattern of U.S. Investment Abroad”, over the past decade, U.S.
holdings of foreign financial assets- stocks and bonds – have grown
remarkably. At the same time, foreign physical assets, such as foreign direct
investment in production plants, have also become far more common.
Overall, the share of U.S. investments allocated to foreign assets swelled
from 40 percent of GDP in 1990 to 89 percent in 2005. This article
investigates the recent behavior of U.S. foreign investment and the factors
driving the change in its fastest growing category – namely, international
equity investment. Home bias in U.S. equity investment has indeed during
the last decade. However, the propensity to invest abroad has varied
significantly across assets from different foreign economies. Specifically,
U.S. investors tend to prefer investing in other industrial countries rather than
in emerging markets. This pattern has likely been developed because the
assets of industrial countries provide a better hedge during downturns in the
U.S. business cycle.
54. Minh Quang Dao, (2009), in his paper, “The impact of investment climate
indicators on gross capital formation in developing countries”, this paper

50
examines the impact of investment climate indicators on gross capital
formation in developing countries. Based on data from the World Bank
Investment Climate Surveys for a sample of thirty-six developing countries,
we find that corruption constraint as measured by the share of senior
managers that ranked “corruption” as a major or very severe constraint in the
investment structure.
55. Maria May Seitanidi, (2007), in his paper, “Intangible economy: how can
investors deliver change in businesses? Lessons from nonprofit-business
partnerships”, the intangible economy (trust, human resources, information,
and reputation) that co-exists draws attention to new expectations that
request the continuous, active and within the public sphere involvement of
investors in order to protect their assets by prioritising intangible resources.
Design/methodology/approach – In this paper the case of non-profit-business
partnerships is employed in order to demonstrate how change can be
achieved. Findings – The paper finds that investors in intangible outcomes
who aim to achieve change in corporations share the same limitations within
the financial and non-financial field. Originality/value – The paper highlights
investment in the intangible economy as a mechanism of co-determining the
priority of responsibilities in the context of corporate social responsibility.
The role of investors is crucial in facilitating the shift from the tangible to the
intangible economy.
56. Brimberg. J , P Hansen , G Laporte , N Mladenovic and D Urosevic ,
(2008), in their article, “ The maximum return-on-investment plant location
problem with market share”, this paper examines the plant location problem
under the objective of maximizing return-on-investment. However, in place
of the standard assumption that all demands must be satisfied, we impose a
minimum acceptable level on market share. The model presented takes the
form of a linear fractional mixed integer program. Based on properties of the
model, a local search procedure is developed to solve the problem
heuristically. Variable neighbourhood search and tabu search heuristics are
also developed and tested. Thus, a useful extension of the simple plant

51
location problem is examined, and heuristics are developed for the first time
to solve realistic instances of this problem.
57. Kenneth A. Froot and Tarun Ramadorai, (2008), in their article,
“Institutional portfolio Flows and international investments”, using a new
technique, and weekly data for 25 Countries from 1994 to 1998, we analyze
the relationship between institutional cross-border portfolio flows, and
domestic and foreign equity returns. In emerging markets, institutional flows
forecast statistically indistinguishable movements in country closed-end fund
NAV returns and price returns. In contrast, closed-end fund flows forecast
price returns, but not NAV returns. Furthermore, institutional flows display
trend-following (trend-reversing) behavior in response to symmetric
(asymmetric) movements in NAV and price returns. The results suggest that
institutional cross-border flows are linked to fundamentals, while closed-end
fund flows are a source of price pressure in the short run.
58. Shollapur. M.R. and A B Kuchanur, (2008), in their article, “Identifying
perceptions and perceptual Gaps: A study on individual investors in selected
investment avenues”, investors hold different perceptions on liquidity,
profitability, collateral quality, statutory protection, etc., for various
investment avenues. In addition, they fix their own priorities for these
perceptions. The formation of perceptions triggers the investment process in
its own way, often leading to unrealistic apprehensions especially among
individual investors. This study attempts to measure the degree of investors’
agreeableness with the selected perceptions as well as to trace the gaps
between their perceptions and the underlying realities. Failure to deal with
these gaps tends to lead the investment clientele to a wrong direction. Hence,
there is a need to help investors develop a realistic perspective of the
investment avenues and their attributes.
59. Eva Hofmann, Erik Hoelzl and Erich Kirchler , (2008) , in their article, “ A
comparison of models Describing the impact of moral decision making on
investment decision”, as moral decision making in financial markets

52
incorporates moral considerations into investment decisions, some rational
decision theorists argue that moral considerations would introduce
inefficiency to investment decisions. The investment decisions are influenced
by both financial and moral considerations. Several models can be applied to
explain moral behaviour. The study tested the suitability of (a) multiple
attribute utility theory (MAUT), (b) theory of planned behavior, and (c)
issue-contingent model of ethical decision making in organizations. Results
indicate that moral considerations influence investment decisions, controlling
for profit. Differences between the three models are discussed.
60. Malcolm Baker and Yuhai xuan, (2009), in their study entitled, “Under New
management: Equity Issues and the Attribution of past Returns”, there is a
strong link between measures of stock market performance and equity issues.
Typically, this performance is considered a characteristic of the firm, not the
CEO who happens to run the firm. In contrast, we find that equity issues
depend on changes in Q and returns to a greater extent if the current CEO
was at the helm when those past returns were realized. Moreover, the
specific share price that the CEO inherited is an important reference point,
while salient share prices prior to turnover are not. A corollary is that a firm
with poor stock market performance will not raise new capital unless the
current CEO is replaced.
2.6 Investors level of satisfaction and their futuristic perceptions towards
retail equity investment.
61. Fieldstein and Yitzhaki, (2011), in their study entitled, “Are High Income
Individuals Better Stock Market Investors?” have presented evidence to
suggest that the corporate stock owned by high-income investors appreciate
substantially faster than stock owned by investors with lower incomes. They
have indicated that high-income individuals have larger portfolios and can
therefore denote more time or resources to their investments, thus resulting
in higher returns.

53
62. Panda. K, Tapan N.P and Tripathi, (2011), in their study entitled, “Recent
Trends in Marketing of Public Issues: An Empirical Study of Investors
Perception”, attempted to identify the investors awareness and attitude
towards public issues. One hundred and twenty five investors covering the
salaried and business class, from the city of Bhuvaneshwar were selected at
random. The data was collected by administering a questionnaire and was
analysed using simple percentage and weighted average analysis. The study
revealed that majority of the investors relied on newspapers as the source of
information. Financial journals and business magazines were ranked next to
newspapers. A large number of investors were of the opinion that they were
not in a position to get the required information from the company in time.
A sizable number of investors were found to face problems while selling
securities. ‘Safety and Regular Return’ stood first and second with regard to
the factors associated with investment activities. Equity shares were
preferred for their higher rate of return by the investors.
63. Hong Kong Exchanges and Clearing Ltd (HKEx) conducted the “Derivatives
Retail Investor Survey (DRIS)”, for the first time in 2001–2002 to study
retail participation in the Hong Kong derivatives market and the investment
behaviour attitude and opinions of derivative investors in Hong Kong. DRIS
was conducted in two stages through a mail questionnaire survey and
personal interviews. The survey revealed that investors were predominantly
males in their 40’s, mostly highly educated and of a high working class. HSI
futures and options were the preferred ones. The median number of years of
experience in trading was 4 years and the median trading frequency was 1-2
times a week. The median deal size was HK $ 60,000. Males were found to
trade more frequently than females. Higher income group had a higher usual
deal size. Profit was the motive behind trading derivatives. Overall, the mail
survey respondents’ perceptions of HKEx derivatives market were positive.
64. Deborah Tan and Julia Henker, (2011), in their article, “Idiosyncratic
volatility and retail investor preferences in the Australian market”, we
explore the negative relation between idiosyncratic volatility and future stock

54
returns observed by previous researchers. We argue that, based on the
observation described in prospect theory, retail investors prefer stocks with a
high level of idiosyncratic volatility and are subsequently willing to overpay
for those stocks. In support of our argument, we find that the negative
idiosyncratic-volatility return relation is present in the Australian market, and
that this relation is affected by the magnitude of retail trading. The relation is
particularly strong when returns and realized volatility are measured at a
daily frequency.
65. Julan Du, (2010), in his paper, “heterogeneity in investor confidence and
asset market under-and overreaction”, this paper develops a behavioral
finance model that may explain under reaction and overreaction in asset
markets from the perspective of heterogeneous investors with different
confidence levels. The model explains the occurrence of under reaction by
the sequential entry of investors with different confidence levels in
interpreting earnings shocks. It is shown that in repeated trading episodes
with repeated earnings shocks, the average investor confidence level would
be higher as a result of the biased self-attribution and confirmatory bias,
causing overreaction more likely to occur. Also, the higher average
confidence level of investors gauged by the later timing of winding up their
asset holding positions also makes overreaction more likely to occur.
66. Lieven Baele ,Olivier De Jonghe and Rudi Vander Vennet , (2005) , in
their paper, “ Does the stock market value bank diversification?
“this paper investigates whether or not diversified banks have a comparative
advantage in terms of long-term performance/risk profile compared to their
specialized competitors. To that end, this study uses market-based measures
of return potential and bank risk. We calculate the franchise value over time
of European banks as a measure of their long-run performance potential. In
addition, we measure risk as both the systematic and the idiosyncratic risk
sensitivities derived from a bank stock return model. Finally, we analyze the
return/risk trade-o¤ implied in different diversification strategies using a
panel data analysis over the period 1989-2004. Diversification affects banks’

55
franchise values positively. Diversification increases the systematic risk of
banks while the effect on the idiosyncratic risk component is non-linear and
predominantly downward- sloping. These findings have conflicting
implications for different stakeholders, such as investors, bank shareholders,
bank managers and bank supervisors.
67. Andreas Kemmerer and Tom Weidig, (2005), in his study, “Reporting Value
to the private Equity Fund Investor”, in this article, we look at the actual
reporting behaviour and information flow of the private equity (mainly
venture capital) fund manager to the fund investors, based on access to a
fund investor’s database. Overall, the study revealed we find that the
European private equity industry has improved their reporting qualitatively
and quantitatively, especially in terms of shorter delivery times of reports.
This change is mainly due to the introduction of the EVCA reporting
guidelines and willingness by both, fund managers and investors, to report
voluntary or contractually bind by contract to report in accordance to these
standards. The study also pointed out that aspects of the relationship
between the entrepreneur and fund manager are also often found at the next
level, between fund managers and investors.
68. Masashi Toshino and megumi suto, (2005), in their paper, “Cognitive biases
of Japanese institutional investor’s consistency with behavioral finance,” this
paper investigates the cognitive biases to which Japanese institutional
investors are subjects. Investors showed optimism in forecasting market
returns, and this tendency was much more significant for domestic markets
and for longer forecasting time-horizons. This optimism is consistent with
the existence of availability heuristics. Herding behavior was also detected.
In addition, Japanese institutional investors showed loss aversion, as
suggested by Tversky and chainman (1979). The median of the relative
weight for loss versus gain was two or three, depending on the amount of
possible loss, and this number is consistent with a coefficient of 2.25 for the
value function estimated in Tversky and kahneman (1992). We conclude that
the concepts of behavioral finance have universality in the sense that they are

56
pertinent among institutional investors as well as students, and that they are
found in an Asian country as well as the U.S.
69. John R. Graham, Alokkumar, (2006), in their study entitled, “Do Dividend
Clienteles Exist? Evidence on Dividend Preferences of Retail Investors”,
studied the stockholding and trading behaviour of more than 60,000
households and found evidence consistent with dividend clienteles. Retail
investor stockholdings indicate a preference for dividend yield that increases
with age and decreases with income, consistent with age and tax clienteles
respectively. Trading patterns reinforce this evidence.
70. Ming Dong, Chris Robinson and Chris veld, (2006), in their paper, “why
individual investors want dividends”, the question of why individual
investors want dividends is investigated by submitting a questionnaire to a
Dutch investor panel. The respondents indicate that they want dividends,
partly because the transaction costs of cashing in dividends are lower than
the transaction costs involved in selling shares. Their answers provide strong
confirmation for the signaling theories of Bhattacharya (1979) and Miller
and Rock (1985). They are inconsistent with the uncertainty resolution
theory of Gordon (1961, 1962) and the agency theories of Jensen (1986) and
Easterbrook (1984). The behavioral finance theory of Shefrin and Statman
(1984) is not confirmed for cash dividends but is confirmed for stock
dividends. Finally, the results indicate that individual investors do not tend to
consume a large part of their dividends. This raises some doubt as to the
effectiveness of the reduction or elimination of dividend taxes in order to
stimulate the economy.
71. Michael Kaestner, (2006), in his article, “investors’ Misreaction to
unexpected earnings: evidence of simultaneous overreaction and under
reaction”, this article investigates the current and past earnings surprises and
subsequent market reactions for listed US companies over the period 1983-
1999. The results suggest that investors simultaneously exhibit short-term
under reaction to ‘earnings announcements’ and long-term overreaction to

57
‘past highly unexpected earnings’. A potential explanation for the reported
overreaction phenomenon is the representativeness bias. The author shows
that overreaction and the later reversal is stronger for events which exhibit a
long series of similar past earnings surprises.
72. Sadhan Kumar Chattopadhyay and Samir Ranjan Behera , (2006) , in their
paper, “Financial Integration for Indian Stock Market”, the Indian stock
market is considered to be one of the earliest in Asia, which is in operation
since 1875. However, it remained largely outside the global integration
process until 1991. The reform of the Indian stock market started with the
establishment of Securities and Exchange Board of India (SEBI), although it
became more effective after the stock market scam in 1991. With the
establishment of SEBI and technological advancement Indian stock market
has now reached the global standard. The study finds that contrary to general
belief, Indian stock market is not co-integrated with the developed market as
yet. It is derived from the study that although some positive steps have been
taken up, which are responsible for the substantial improvement of the Indian
stock market, these are perhaps not sufficient enough to become a matured
one.
73. Larry D. Wall, (2007), in his article, “on investing in the equity of small
firms”, this comment provides a brief discussion of the roles of different
investors in small business firms. It then evaluates the contribution made in
papers by in this issue by Robinson and Cottrell on informal investors in
Alberta, Canada, and by Pintado, Perez de lema, and van Auken on venture
capital investment in Spain.
74. Som Sankar Sen., Bidyut Kumar Ghosh and Dr. Santanu Kumar Ghosh,
(2007), “Stock Market Liquidity and Exchange Rate – A Case Study on BSE
& NSE “, this paper explores significant impact of exchange rate on stock
market liquidity. Taking monthly data on both BSE and NSE the paper
reveals the positive relationship between exchange rate and stock market
liquidity in concurrent, lagged and lead forms. Using R2 statistic it shows a

58
considerable variation in liquidity is explained by exchange rate in both the
major stock exchanges in India.
75. Gerben de zwart, Brian Frieser and Dick van Dijk , (2007), in their article, “
A recommitment strategy for long term Private equity fund investor”, this
paper develops a reinvestment strategy for private equity which aims to keep
its portfolio weight equal to a desired strategic allocation, while taking into
account the illiquid nature of private equity. Historical simulations
(1980{2005) show that our dynamic strategy is capable of maintaining a
stable investment level that is close to the target. This does not only hold for
unrestricted portfolios, but also for investments limited to buy-out or venture
capital, a specific region, or management experience. This finding is of great
importance for investors, because private equity funds have a finite lifetime
and uncertain cash flows.
76. Michael J. Robinson and Thomas J. Cottrell , (2007), in their article,
“ Investment patterns of Informal Investors in the Alberta Private Equity
Market”, this study identifies three main types of informal investors in
private equity markets: relationship investors, opportunity-based investors,
and angel investors. We find evidence that the first two investor types are a
major total source of capital and they prefer to invest smaller amounts close
to home and in the context of existing relationships. With respect to angel
investors, we find evidence of stratification in their desired investment
amount which is consistent with a model where their investments evolve
though a life cycle of investing. We also find evidence that change to capital
market regulations that allow for lower investment amounts by this type of
investor increase the amount of capital available for early-stage firms.
77. Costanza Consolandi, Ameeta Jaiswal-Dale, Elisa Poggiani and Alessandro
Vercelli, (2008), in their article, “Global standards and ethical stock indexes:
The case of the Dow Jones sustainability Stoxx Index”, this article examines
whether these incentives have been so far detectable with particular reference
to the Dow Jones Sustainability Stoxx Index (DJSSI) that focuses on the
59
European corporations with the highest CSR scores among those included in
the Dow Jones Stoxx 600 Index. The aim of the article is twofold. First, we
analyse the performance of the DJSSI over the period 2001–2006 compared
to that of the Surrogate Complementary Index (SCI), a new benchmark that
includes only the components of the DJ Stoxx 600 that do not belong to the
ethical index to evaluate more correctly the size of possible divergent
performances. Second, we perform an event study on the same data set to
analyse whether the stock market evaluation reacts to the inclusion (deletion)
in the DJSSI. In both cases, the results suggest that the evaluation of the CSR
performance of a firm is a significant criterion for asset allocation activities.
78. Gangadhar. V and G. Naresh Reddy , (2008), in their paper, “The Impact of
Foreign Institutional Investment on Stock Market Liquidity and Volatility in
India”, this paper is aimed at examining the investment trends and patterns of
FIIs and their impact on stock market liquidity and volatility. Liquidity with
reference to capital market refers to easy conversion of capital market
securities into cash. Whereas the stock market volatility implies the
fluctuations in the stock market returns over a time period. Volatility is the
inconsistency or variability in the returns of aggregate market portfolio.
79. AI Jun Hou , (2009), in his study, “ EMU Equity markets’ return variance
and spill over effects from short-term interest rates”, this paper examines the
spillover effects from the movement of short term interest rates to equity
markets within the Euro area. The empirical study is carried out by
estimating a Markov Switching GJR-M model with a Bayesian based
Markov Chain Monte Carlo (MCMC) methodology. The result indicates that
stock markets in the Euro area display a significant two regimes with distinct
characteristics. The study indicates that there is a significant impact of
fluctuations in the short term interest rate on the conditional variance and
conditional returns in the EMU countries. Such impact is asymmetrical, and
it appears to be stronger in the bear market and when the interest rate
changes upward.

60
80. Batni Raghavendra Rao , (2009) , in his paper, “ Exchange traded funds - the
cardinal investment option in turbulent times”, the global meltdown,
international reputed firms going bankrupt, fudging of accounting numbers
and dubious corporate governance have made equity investing more
challenging then ever before. The investors are constantly on a look out for
secure and promising bets. Stock picking is not easy as it looks and therefore
construction of equity portfolio is imperative. The premise that
diversification reduces the risk is beyond doubt. Diversification entails
scouting of investment avenues in terms of risk and return. It calls for
developing a portfolio of assets or securities in such a way to minimize the
risk. The individual investors hardly can match up to the institutional
investors in terms of the expertise and also majority of them are not market
savvy. In this context, Exchange traded funds (ETFs) come in handy to help
out the individual investors in the stock market. ETFs are the safe bets and
provide scrupulous diversification. In fact in the developed markets ETFs are
the most sought after means of investing in the equities. In India ETFs are
yet to catch up the attention of the investors.
81. Mamunur Rashid1 and Md. Ainun Nishat, (2009), in their article,
“Satisfaction of retail investors on the structural efficiency of the market:
Evidence from a developing country context”, satisfied investors are a
necessary element of the stock market. They help to finance rapid expansion
in developing countries. This study explores the components of market
structure that contribute to the satisfaction level of retail investors. Around
300 retail investors from 25 randomly selected brokerage houses registered
with the Dhaka Stock Exchange, Bangladesh were surveyed using a
structured questionnaire. Analyses reveal that most investors were young and
inexperienced but educated, with shortages of skills and income. The study
suggests the importance of effective regulation, disclosure requirements to
ensure a supply of quality information, investor education and technology
driven trading in brokerage houses for overall investor satisfaction.

61
82. Raja. M and J. Clement sudhakar, (2010), in their article, “An empirical test
of Indian stock market efficiency in respect of bonus announcement”, as
capital market is said to be efficient with respect to an information item if the
prices of securities fully impound the return implications of that item. The
efficiency with which the capital formation is carried out depends on the
efficiency of the capital markets and financial institutions. A capital market
is said to be efficient with respect to corporate event announcement (stock
split, buyback, right issue, bonus announcement, merger & acquisition,
dividend etc) contained information and its disseminations. How quickly and
correctly the security prices reflect these event contained information show
the efficiency of stock markets. Present study is an attempt to test the
efficiency of Indian stock market with respect to bonus issue announcement
by IT companies.
83. Roopam Kothari and Narendra Sharma, (2010), in their paper, “Testing the
Beta stability of banking sector over various phases in Indian stock market”,
our study aims at creating a banking stock portfolio which serves as a
representative of all the banking stocks traded on Bombay Stock Exchange
and testing the beta instability of the banking sector stock portfolio over
various phases in the Indian stock market. We also evaluate the monthly
stock price returns of the banking portfolio vis-à-vis the market portfolio
from the period ranging from July 1994 to December 2008. The journey of
Sensex during the span of past fourteen years in the post liberalization period
has been divided into three phases based upon technical analysis. An attempt
is made to evaluate the under/ over performance of the banking stock
portfolio returns under various phases.
2.7 Relationship between demographics variable of investors and their
investment objectives, decision and satisfaction.
84. Meenu Verma, (2008), in his article, “Wealth management and behavioral
finance: The effect of demographics and personality on investment choice
among Indian investors”, with the growth of the Indian economy and the rise

62
in the wealth of the people, there is a growing demand for wealth
management functions. Wealth management involves understanding the
clients’ financial and investment requirements and accordingly providing
financial planning and portfolio management services. Behavioral finance is
a nascent but growing discipline, which studies investor’s psychology while
making financial decisions. This paper aims to investigate the effect of
demographic profile and personality type of the investor on investment
choice. Such understanding could prove to be a boon for the burgeoning
wealth management industry in India.
85. Manish Mittal and R K Vyas, (2008), in their paper, “personality type and
investment choice: An empirical study”, investors have certain cognitive and
emotional weaknesses which come in the way of their investment decisions.
Over the past few years, behavioral finance researchers have scientifically
shown that investors do not always act rationally. They have behavioral
biases that lead to systematic errors in the way they process information for
investment decision. Empirical evidence also suggests that factors such as
age, income, education and marital status affect on individual’s investment
decision. This paper classifies Indian investors into different personality
types and explores the relationship between various demographic factors and
the investment personality exhibited by the investors. The results of this
study reveal that the Indian investors can be classified into four dominant
investment personalities- casual, technical, informed and cautious.
2.8 Summary
The above review of literature helps to identify the research gaps and frame
suitable objectives and hypothesis.

63
REFERENCES
1. Mark Grinblatt, Matti Keloharju, “The Investment Behaviour and Performance of
Various Investor Types: Study of Finland’s unique Data set”, Journal of
Financial Economics, Vol. 55, 2011, pp: 43-67.
2. Maruthu Pandian P, Benjamin Christopher S, “A study on Equity Investor
Awareness”, Doctoral Dissertation at Bharathiar University, 2010.
3. Gupta L.C, Naveen Jain and Team, “Indian Household Investors Survey-2004”,
Society for Capital Market Research and Development”, (2009), Delhi.
4. HorstRaff and Michael J.Ryan, “Firm-Specific Characteristics and the Timing
of Foreign Direct Investment Projects”, Review of world Economics Vol. 144
(1) 2008, PP: 1-32.
5. Kuntluru S. and Md. Akbar Ali khan, “Financing pattern of foreign and
Domestic owned Pharmaceutical companies in India”, The management
Accountant ICWAI Journal Vol. 44 No.12 December 2009 PP: 984 – 991.
6. William A. Birdthistle and M.Todd Henderson, “One Hat Too many?
Investment Desegregation in private Equity”, The university of Chicago law
Review 2009 PP: 45- 82.
7. Diptendu simlai,” An Inquiry into the origion and Growth of the modern capital
market in India,” The Management Accountant ICWAI Journal Vol.44.No.3
March 2009 PP: 205-209.
8. Yadagiri M. and P.Rajender, “Analysis of investment portfolio of scheduled
commercial banks”, The Management Accountant ICWAI Journal Vol. 44, No.
10, October 2009, PP: 780-788.
9. Bloomfield, Robert J, Libby, Robert and Nelson, Mark W., “Confidence and
the Welfare of less Informed Investors”, Social Science Research Network,
2010.

64
10. Statman, Meir. “A century of investors”, Santa Clara university–Department of
Finance, working paper no. 02-01, 2002.
11. Stout, Lynn.A , “The investor game”, UCLA school of law, Research paper no.
02-18, 2010.
12. Shivkumar Deene, Madari D.M and Gangashetty, “Capital market Reforms:
some issues”, working paper, 2011 PP: 1-12.
13. Alok Kumar, “Who Gambles In the Stock Market? University of Notre Dame,
Mendoza college of Business, IN 46556, PP: 1-53.
14. Nagarajan R. “Green shoe option in IPO”, The Management Accountant
ICWAI Journal Vol.40, No. 5, May 2008, PP: 398-401.
15. Subha M.V, “Indian Capital Markets-A Road Ahead”, Indian Journal of
Marketing, Vol. XXXVI, No. 12, March 2009, pp: 21-22.
16. Kavitha Ranganathan, “A study of fund selection behavior of individual
investors towards mutual funds: With reference to Mumbai city”, The ICFAI
University Journal of Behavioral Finance,Vol. III, No. 2, 2009, PP: 63-88.
17. Jones Nilsson, “Investment with a Conscience: Examining the Impact of Pro-
Social Attitudes and Perceived Financial Performance on Socially Responsible
Investment Behavior,” Journal of Business Ethics, Vol. 83, 2011, PP: 307-325.
18. Mahabaleswara Bhatta H.S. “Behavioral Finance- A discussion his individual
investor biases”, The Management Accountant ICWAI Journal Vol.44, No. 2,
February2009, PP: 138-141.
19. Chattopadhyay P. “Retail investors in IPO subscription”, The Management
Accountant ICWAI Journal Vol.45, No. 3, March 2010, PP: 194- 198.
20. Rajarajan V, “Investors Life Styles and Investment Characteristics”, Finance
India, Vol. XIV, No. 2, 2010, pp: 465-478.

65
21. Bandgar, P.K, “A study of Middle Class Investor’s Preferences for Financial
Instruments in Greater Bombay”, Finance India, Vol. XIV. No.2, 2010, pp:
574-576.
22. Charles Lee, M.C and Balakrishna Radhakrishna, “Inferring Investor
Behaviours: Evidence from TORQ data”, Journal of Financial Markets, Vol.
XVI, 2010, pp: 83-111.
23. Dechow, Patricia, Hutton, Amy and Sloan, Richard part 5, “Mastering
Finance”, Business standard’s 12 part series on corporate finance Financial
Markets and Investment Management, New Delhi, 2011.
24. Malcolm Baker and Jeffrey Wurgler, “A Catering Theory of Dividends,” The
ICFAI Journal of Behavioral Finance, Vol.59, Issue 3, 2002 PP: 32-60.
25. Selvam M, Rajagopalan V, Vanitha S, Babu M, “Equity culture in Indian
Capital Market”, Sajosps, Vol. 4, No. 1, July-Dec 2008, pp: 66-78.
26. Alexander L Jungquist and Matthew Richardson, “The investment Behaviour of
Private Equity Fund managers,” Nyvistern, New York University, Leonard N.
Stern School of Business, Department of Finance, Working paper series, 2009,
PP: 1-38.
27. Santi Swarup K, “Measures for Improving Common Investor Confidence in
Indian Primary Market: A Survey”, Research Publication, 2009, nseindia.com.
28. Stephanie Desrosiers, Jean-Francois L Her and Jean-Francois Plante,”Style
management in Equity country Allocation”, Financial Analysts Journal, CFA
institute, Vol.60, No.6, 2011, PP: 40-54.
29. Jaspal singh and subhash chander, “Investors’ preference for Investment in
mutual Funds: An Empirical Evidence,” The ICFAI Journal of Behavioral
Finance, March 2010 PP: 7-17.

66
30. Gnana Desigan C, Kalai Selvi S, Anusya L, “Women Investors Perception
Towards Investment – An Empirical study”, Indian Journal of Marketing, Vol.
XXXVI, No. 4. April 2010, pp: 14-37.
31. Shobana V.K. and Jayalakshmi J, “Investor Awareness and Preferences”,
Organisational Management, Vol. XXII, No. 3, Oct-Dec 2011, pp: 16-18.
32. Meir Statman, Steven Thorley and Keith Vorkink, “Investor overconfidence
and Trading volume,” The Review of Financial studies Vol.19, No. 4 , 2011,
PP: 1531- 1565.
33. Viswambharan A.M, “Indian Primary Market–Opportunities and Challenges”,
Facts for You, March 2006, p: 31.
34. Narendra Jadhav, “Development of Securities Market – The Indian
Experience”, Association for Financial Professionals (AFP), Annual
conference, session: 30 2011, PP: 1-34.
35. Dan Palmon and Fred Sudit,”Shareholders’ defensive security Shares”,
International Journal of Disclosure and Governance Vol.4,3, Palgrave
Macmillan Ltd, 2010 PP: 195-203.
36. Kameswari, “Foreign Direct Investment and its role in Developing Indian
Economy,”The Management Accountant ICWAI Journal Vol. 43 No.7 July
2008 PP: 510-517.
37. Sen S.S. and S.K. Ghosh, “Stock Market Liquidity of BSE and NSE: A
comparative study (1999-2005),” Management Accountant ICWAI Journal
Vol.43 No.2 February 2008 PP: 55-60.
38. Nissim Ben David, “An indicator for internalization of analyst’s
recommendations by investors, “The ICFAI University Journal of Behavioral
Finance Vol. V, No. 3, 2008, PP: 23-35.

67
39. Mohanty B.K. “Market capitalization: A suitable growth approach for share
holders’ value creation”, The Management Accountant ICWAI Journal Vol.43,
No. 8, August 2008, PP: 398-401.
40. Henry L. Petersen and Harrie Vreden burg, “Morals or Economics? Institutional
Investor Preferences for Corporate Social Responsibility,” Journal of Business
Ethics Vol. 90, 2009, PP: 1-14.
41. Sakthivel N. “EVA – MVA: Shareholders’ value measure”, The Management
Accountant ICWAI Journal Vol.45, No. 1, January 2010, PP: 10-14 &18.
42. Iran Peacock and Stuart Cooper, “Private equity: implications for financial
efficiency and Stability,” Bank of England quarterly Bulletin, February 2000,
PP: 69-76.
43. Securities and Exchange Board of India-National council of Applied Economic
Research (SEBI – NCAER), “Survey of Indian investors”, Chartered Secretary,
Vol. XXX, No.9, 2000, pp: 1201-1207.
44. David R. Gallagher, “Investment manager characteristics, strategy, top
management changes and fund performance”, Research paper School of
banking and finance, The university of new south wales, Sydney N.S.W. 2052,
Australia (2001) PP 1-52.
45. Hall, John.H, “Do brokers buy, hold and sell recommendations of value to
individual investors?” University of Pretoria, working paper series, 2002.
46. Santi Swarup K, “Role of Mutual Funds in Developing Investor confidence in
Indian Capital Markets”, Sajosps, Vol. 2, No. 2, June 2002, pp: 58-60.
47. Mohammad Salahuddin and Md. Rabiul Islam,” Factors affecting investment in
developing countries: A panel data study,” South east university Bangladesh,
working paper, 2003, PP: 21-37.

68
48. Alexandra Dawson, “Investigating Decision-making criteria of private Equity
investors in family firms,” Bocconi University, working paper, 2004, PP: 1-12.
49. Xuewu wang, “Sentiment strategies,” The ICFAI Journal of Behavioral Finance
December 2004, PP: 60-72.
50. Arvid OI Hoffmann and wander Jager, “The effect of Different needs, Decision-
making processes and Network-Structures on investor Behavior and stock
market Dynamics: A simulation Approach”, The ICFAI Journal of Behavioral
Finance, June 2005 PP: 49-64.
51. Qiang Cheng and Terry D. Warfield,” Equity incentives and earnings
management,” The Accounting Review Vol.80, No. 2, PP: 441-476.
52. Vibha Mahajan and Dr. Poonam Aggarwal, “Foreign investment – need for a
more competitive and open policy”, The Management Accountant ICWAI
Journal Vol.40, No. 6, June 2005, PP: 475-480.
53. Marcela Meirelles Aurelio, “Going Global: The changing pattern of U.S.
Investment Abroad,” Economic – Federal Reserve Bank of Kansas city Vol.93
No.3, Third quarter 2006 PP: 5-33.
54. Minh Quang Dao, “The impact of investment climate indicators on Gross
capital formation in developing countries,” Eastern Illinois university, USA,
working paper, 2006, PP: 1-10.
55. Maria May seitanidi, “Intangible economy: how can investors deliver change in
business? Lessons from non profit business partnerships”, Management
Decision Journal, Emerald Group publishing limited Vol.45 No.5 2007 PP:
853-865.
56. Brimberg J., P. Hansen, G. Laporte, N. Mladenovic and D. Urosevil, “ The
Maximum return-on- investment plant location problem with market share,”
Journal of the operational Research society Vol. 59 No. 3 2008 PP: 399-406.

69
57. Kenneth A.Froot and Tarun Ramadorai, “Institutional portfolio Flows and
international investments,” The Review of Financial studies Vol. 21 No.2, 2008
PP: 1-36.
58. Shollapur M.R. and A B Kuchanur, “Identifying perceptions and perceptual
Gaps: A study on individual investors in selected investment avenues”, The
ICFAI University Journal of Behavioral Finance, Vol. V, No. 2, 2008, PP: 47-
61.
59. Eva Hofmann, Erik Hoelzl and Erich Kirchler, “A comparison of models
describing the impact of moral decision making on investment decision”,
Journal of Business Ethics, Vol. 82, 2008, PP: 171-187.
60. Sen S.S. and S.K. Ghosh, “Stock Market Liquidity of BSE and NSE: A
comparative study (1999-2005),” Management Accountant ICWAI Journal
Vol.43 No.2 February 2008 PP: 55-60.
61. Feldstein, Martin S., Yitzhaki, Shlomo, “Are high income individuals better
stock market investors?” nber w0948, 2000.
62. Panda K, Tapan N.P and Tripathi, “Recent Trends in Marketing of Public
Issues: An Empirical Study of Investors Perception”, Journal of Applied
Finance, Vol. 7, No.1, 2001, pp: 1-6.
63. Hong Kong Exchanges and clearing Ltd (HKEx), (2001-02), “Derivatives
Retail Investor Survey (DRIS)”.
64. Deborah Tan and Julia Henker,”Idiosyncratic volatility and Retail Investor
Preferences in the Australian Market,” The Australian School of Business,
University of New South Wales working paper 2002, PP: 1-55.
65. Julan Du, “heterogeneity in investor confidence and asset market under-and
overreaction”, The ICFAI Journal of Behavioral Finance, June 2004, PP: 55-
85.

70
66. Lieven Baele,” Olivier De Jonghe and Rudi vander Vennet, “Does the Stock
Market value bank diversification? “ Federal public planning service science
policy, inter university Attraction 2005 PP: 1-27.
67. Andreas Kemmerer and Tom Weidig, “Reporting value to the private Equity
Fund investor,” University of Frankfurt, working paper, 2005, PP: 1-49.
68. Masashi Toshino and Megumi suto,” Cognitive biases of Japanese institutional
investor’s consistency with behavioral finance,’ The ICFAI Journal of
Behavioral Finance, March 2005 PP: 7-18.
69. John R. Graham, Alokkumar, “Do Dividend Clienteles Exist? Evidence on
Dividend Preferences of Retail Investors”, The Journal of Finance, Vol. 61,
Issues 3, June 2006, pp: 1305-1336.
70. Ming Dong, Chris Robinson and Chris veld, “Why individual investors want
dividends,” The ICFAI Journal of Behavioral Finance, Vol. III, No. 2, 2006,
PP: 27-62.
71. Michael Kaestner, “investors’ Misreaction to unexpected earnings: evidence of
simultaneous overreaction and under reaction,” The ICFAI Journal of
Behavioral Finance, March 2006, PP: 32-42.
72. Sadhan Kumar Chattopadhyay and Samir Ranjan Behera, “Financial
Integration for Indian Stock Market”, Department of Economic Analysis and
policy of the RBI, Working paper, 2006, PP: 1-29.
73. Larry D. Wall, “On investing in the Equity of small firms”, Journal of small
Business management 2007 45 (1) PP: 89-93.
74. Sen S.S.,B.K. Ghosh and Santanu Kumar Ghosh, “ Stock market liquidity and
Exchange Rate –A case study on BSE & NSE”, The Management Accountant
ICWAI Journal Vol.42, No.10 October 2007 PP: 820-821 & 830.

71
75. Gerben de zwart, Brian Frieser and Dick van Dijk, “A recommitment strategy
for long term private equity fund investor,” ERIM report series research in
management, ERS – 2007-097 – F&A, 2007, PP: 1-46.
76. Michael J. Robinson and Thomas J. Cottrell, “Investment patterns of informal
investors in the Alberta private Equity Market,” Journal of small Business
Management Vol. 45, No. 1 PP: 47-67.
77. Costanza Consolandi, Ameeta Jaiswal-Dale, Elisa Poggiani and Alessandro
Vercelli,
“Global standards and ethical stock indexes: The case of the Dow Jones
sustainability Stoxx Index”, Journal of Business Ethicks Vol.87. 2008, PP: 185-
197.
78. Gangadhar V. and G. Naresh Reddy, “The Impact of Foreign Institutional
Investment on Stock Market Liquidity and Volatility in India”, The
Management Accountant ICWAI Journal Vol. 43, No. 3, March 2008, PP: 179-
84.
79. Ai Jun Hou, “EMU Equity markets’ return variance and spill over effects from
short-term interest rates,” Department of Economics, Lund university, Sweden,
working paper 2009 PP: 1-35.
80. Batni Raghavendra Rao, “Exchange Traded Funds – the cardinal investment
option in turbulent times,” The Management Accountant ICWAI Journal,
Vol.44 No. 6, June 2009, PP: 464-467.
81. Mamunur Rashid1 and Md. Ainun Nishat, “satisfaction of retail investors on
the structural efficiency of the market: Evidence from a developing country
context,” Asian Academy of management Journal, Vol. 14, No. 2 , July 2009,
PP: 41-64.

72
82. Raja M.and J.Clement sudhahar,” An Empirical test of Indian Stock Market
Efficiency in Respect of Bonus Announcement”, Asia pacific Journal of Finance
and Banking Research Vol.4 No.4, 2010 PP: 1-14.
83. Roopam Kothari and Narendra Sharma,” Testing the Beta Stability of Banking
Sector over various Phases in Indian Stock market,” The Management
Accountant ICWAI Journal Vol.45 No.7 July 2010 PP: 591-595.
84. Meenu Verma, “Wealth management and behavioral finance: The effect of
demographics and personality on investment choice among Indian investors”,
The ICFAI University Journal of Behavioral Finance, Vol. V, No. 4, 2008, PP:
31-57.
85. Manish Mittal and R K Vyas, “personality type and investment choice: An
empirical study”, The ICFAI University Journal of Behavioral Finance, Vol. V,
No. 3, 2008, PP: 6-22.

73
CHAPTER – III
INDIAN CAPITAL MARKETS – AN OVERVIEW
INTRODUCTION
Chapter three gives brief account of capital market developments in India
under various heads like Indian capital market before 1990’s , Indian capital market
after 1990’s, primary market developments, secondary market developments, SEBI
registered market intermediaries, mutual funds, derivatives, foreign institutional
investments, screen based trading system, depositories, clearing, processing and
settlement system, risk management system, margin trading facility, Regulatory
frame work for investor protection, security Regulations in force, security guidelines
in force, grievances redressal mechanism, investor education, recent initiatives and
Indian capital market future road map.
Capital market is the backbone of any country’s economy. It is an engine for
economic growth, providing an efficient means of resource mobilisation and
allocation. The literature is full of theoretical and empirical evidence that have
established robust, statistically significant two-way relationship between the
developments in the securities market and economic growth. Levine and Zervos
(1998) argue that well developed stock markets may be able to offer financial
services of different kind that may provide a different kind of impetus to the
economic development1. In India, Agarwall’s (1999), study clearly supports the
Levine and Zervos’s argument and proves that the two main parameters of capital
market development namely, size and liquidity, are found statistically significant to
explain the economic activity.2
The Indian capital market is one of the oldest capital markets in the world. It
dates back to the 18th
century when the securities of the East India Company were
traded in Mumbai and Kolkata. However, the orderly growth of the capital market
began with the setting up of The Stock Exchange of Bombay in July 1875 and
Ahmedabad Stock Exchange in 1984. Eventually 19 other Stock Exchanges sprang
up in various parts of the country.3 In this chapter an attempt has been made by the

74
researcher to review the Capital Market Developments that has taken place in India
in two phases such as:
i. Indian Capital Market – Before 1990’s
ii. Indian Capital Market – After 1990’s
3.2. INDIAN CAPITAL MARKET – Before 1990’s
India’s Capital Market was dormant till the mid – 1980‘s.4 The long term
financing needs of the corporate sector were met by the Development Financial
Institutions (DFI’s) namely IDBI, IFCI, ICICI as well as by other investment
institutions like LIC, UTI, GIC etc. Working capital needs were met by the
Commercial Banks through an elaborate network of bank branches spread all over
the country. Capital Market activities were limited mainly due to the easy
availability of loans from banks and financial institutions and administered structure
of interest rates. However, three important legislations namely Capital Issues
(control) Act 1947: Securities Contracts (Regulation) Act, 1956; and Companies
Act, 1956 were enacted to provide suitable legal framework for the development of
capital market in India. The pricing of the primary issues was decided by the Office
of the Controller of Capital Issues. A few stock exchanges, dominated by Bombay
Stock Exchange (BSE) provided the trading platforms for the secondary market
transactions under an open outcry system.
As of 1992, the Bombay Stock Exchange (BSE) was a monopoly.5 It was an
association of brokers, and imposed entry barriers; leading to elevated costs of
intermediation. Membership was limited to individuals; limited liability firms could
not become brokerage firms. Trading took place by ‘open outcry’ on the trading
floor, which was inaccessible to users. It was routine for brokers to charge the
investor a price that was different from what is actually transacted at.
Retail investors and particularly users of the market outside Bombay,
accessed market liquidity through a chain of intermediaries called “sub–brokers”.
Each sub–broker in the chain introduced a mark-up in the price, in the absence of
unbundling of professional fees from the trade price. It was common for investors in
small towns to face four intermediaries before their order reached the BSE floor, and
to face mark-ups in excess of 10% as compared with the actual trade price. The

75
market used ‘futures–style settlement’ with fortnightly settlement. A peculiar market
practice called ‘badla’ allowed brokers to carry positions across settlement periods.
In other words, even open positions at the end of the fortnight did not always have to
be settled. The efficiencies of the exchange clearing house only applied for the
largest 100 stocks. For other stocks, clearing and settlement were done bilaterally,
which introduced further inefficiencies and costs.
The final leg of the trade was physical settlement, where the share
certificates were printed on paper. This was intrinsically vulnerable to theft,
counterfeiting, inaccurate signature verification, administrative inefficiencies, and a
variety of other malpractice. Involuntary and deliberate delays in settlement could
take place both at the BSE and at the firm. Many firms used the power of delaying
settlement as a tool to support manipulation of their own stock. The problems were
somewhat simpler for investors in Bombay, who could physically visit the BSE
broker, the BSE clearinghouse, or the company’s Registrar, and accelerates transfer.
For investors outside Bombay, who lacked this recourse and were crippled by the
exorbitantly expensive telephone system, delays of six months between purchasing a
stock and the transfer of legal title were common. If stock splits, rights issues, or
dividend pay-outs took place during this period, it was common for the purchaser
not to obtain the benefits.
Floor–based trading, the inefficiencies in clearing and settlement entry
barriers into brokerage, and the low standards of technology and organisational
complexity that accompanied the ban upon corporate membership of the BSE led to
an environment where order execution was unreliable and costly. 6
These factors led
to an extremely poor functioning of the capital markets till 1992.
3.3. INDIAN CAPITAL MARKET – After 1990’s
The Indian capital markets have witnessed a major transformation and
structural change during the past one and half decades, since the early 1990’s.7 The
Financial Sector Reforms in general and the Capital Market Reforms in particular
were initiated in India in a big way since 1991 – 1992. These reforms have been
aimed at improving market efficiency, enhancing transparency, checking unfair
trade practices and bringing the Indian capital market up to the International

76
Standards. The Capital Issues (control) Act, 1947 was repealed in May 1992 and the
office of the Controller of Capital Issues was abolished in the same year. The
National Stock Exchange (NSE) was incorporated in 1992 and was given
recognition as a Stock Exchange in April 1993, which has been playing a lead role
as a change agent in transforming the Indian Capital Market to its present form.8 The
Securities and Exchange Board of India (SEBI) was set up in 1988 and acquired the
statutory status in 1992. Since 1992, SEBI has emerged as an autonomous and
independent statutory body with definite mandate such as: (a) to protect the interests
of investors in securities, (b) to promote the development of securities market and
(c) to regulate the securities market. In order to achieve these objectives, SEBI has
been exercising power under: (a) Securities and Exchange Board of India Act, 1992,
(b) Securities Contracts (Regulation) Act, 1956, (c) Depositories Act, 1996 and
delegated powers under the (d) Companies Act, 1956. Indian Capital Market has
made commendable progress since the inception of SEBI and has been transformed
into one of the dynamic capital markets of the world.9 The statistics on International
equity Markets as on December 31, 2009 given in Table-1 clearly highlights this.
Table – 3.1
International Equity markets (End December 2010) 10
Exchange
Market
Capitalisation
(US $ Million)
No. of
Listed
Companies
Value of Share
trading
(US $ Million)
No. of
trading
days
Americans
American SE
Lima SE
Mexican Exchange
Nasdaq
NYSE
Santiago SE
Sao Paulo SE
132367
71663
352045
3239492
11837793
230732
591966
486
241
406
2852
2327
236
392
561603
4532
84255
28951349
17784586
38103
724199
253
249
252
252
252
250
249
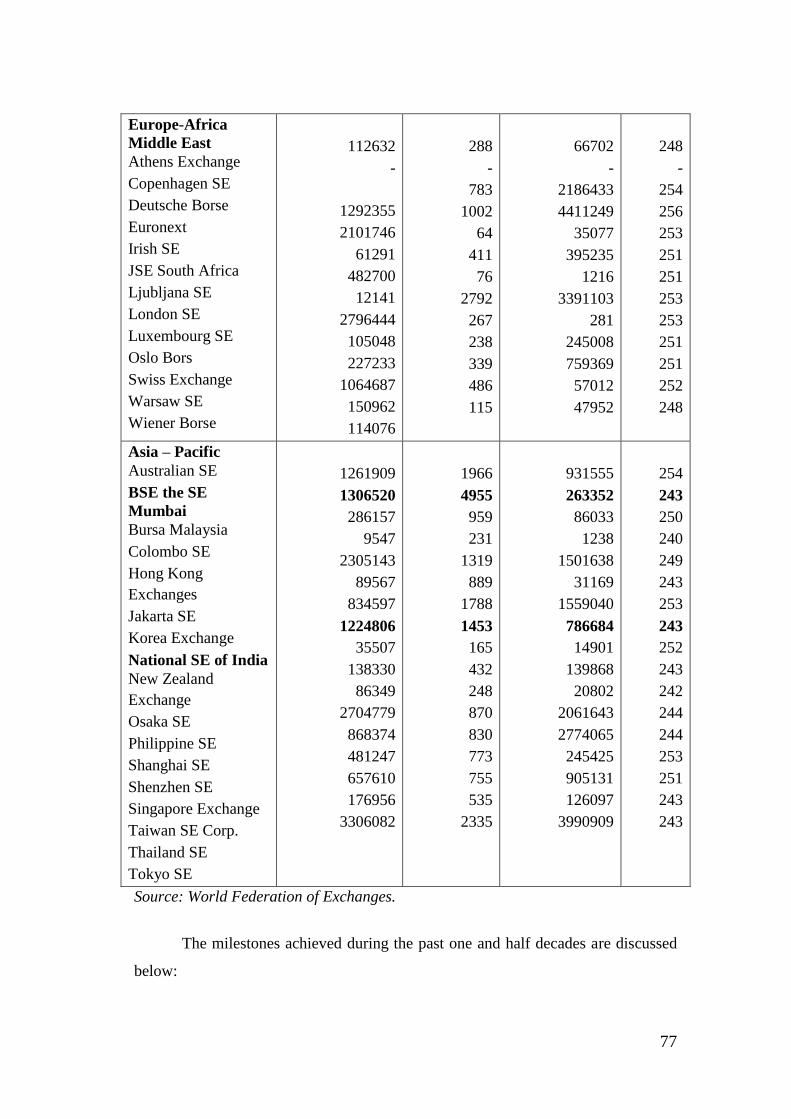
77
Europe-Africa
Middle East
Athens Exchange
Copenhagen SE
Deutsche Borse
Euronext
Irish SE
JSE South Africa
Ljubljana SE
London SE
Luxembourg SE
Oslo Bors
Swiss Exchange
Warsaw SE
Wiener Borse
112632
-
1292355
2101746
61291
482700
12141
2796444
105048
227233
1064687
150962
114076
288
-
783
1002
64
411
76
2792
267
238
339
486
115
66702
-
2186433
4411249
35077
395235
1216
3391103
281
245008
759369
57012
47952
248
-
254
256
253
251
251
253
253
251
251
252
248
Asia – Pacific
Australian SE
BSE the SE
Mumbai
Bursa Malaysia
Colombo SE
Hong Kong
Exchanges
Jakarta SE
Korea Exchange
National SE of India
New Zealand
Exchange
Osaka SE
Philippine SE
Shanghai SE
Shenzhen SE
Singapore Exchange
Taiwan SE Corp.
Thailand SE
Tokyo SE
1261909
1306520
286157
9547
2305143
89567
834597
1224806
35507
138330
86349
2704779
868374
481247
657610
176956
3306082
1966
4955
959
231
1319
889
1788
1453
165
432
248
870
830
773
755
535
2335
931555
263352
86033
1238
1501638
31169
1559040
786684
14901
139868
20802
2061643
2774065
245425
905131
126097
3990909
254
243
250
240
249
243
253
243
252
243
242
244
244
253
251
243
243
Source: World Federation of Exchanges.
The milestones achieved during the past one and half decades are discussed
below:

78
3.3.1 Primary Market Developments
The 1990’s witnessed the emergence of the Capital Market as a major source
of finance for trade and industry in India. A growing number of companies have
been accessing the Capital Market rather than depending on loans from financial
institutions.11
Tremendous developments have taken place in the primary market
where the corporates issue fresh securities through public issues as well as private
placements. Huge amount of resources have been mobilised by the corporates from
the primary market which is shown in Table-2 below: -
Table – 3.2
Resources Mobilised from the Primary Market12
(Rs. in Crores)
Year Total Amount Instrument Wise
Equities CCPS Bonds Others
1998-99 14276 7845 75 5400 957
1999-00 4570 1881 10 1550 1128
2000-01 5587 857 78 4450 202
2001-02 7817 4566 0 3200 51
2002-03 6108 3226 142 2704 36
2003-04 7543 1272 0 5601 670
2004-05 4070 1457 0 2600 13
2005-06 23272 18958 0 4324 0
2006-07 28256 24388 0 3867 0
2007-08 27382 27372 0 0 10
2008-09 33506 32901 0 356 249
2009-10 87029 79739 5687 1603 0
2010-11 14720 14272 0 448 0
Source: SEBI
As on March 31, 2011, Rs. 14,720 crores has been mobilised from the
Primary market, out of which Rs. 14,272 crores has been raised through equities and
Rs. 448 crores through bonds capital market instruments.
Since the early 1990’s, there has been a paradigm shift from merit based
regulated regime to disclosure based regime. Comprehensive guidelines on

79
disclosures and investor protection were issued and were amended by SEBI from
time to time. The companies accessing the capital market through public issues have
to comply with adequate disclosure norms on initial as well as continuous basis.
India’s disclosure norms are considered as one of the best in the world and are often
cited as benchmark for the global standards.13
Indian accounting standards are
principle based and aligned to international accounting standards. In terms of
consolidation segmental reporting, deferred tax accounting and related party
transactions, the gap between India and the US is minimal. In addition to sound
accounting standards, the issues relating to corporate governance have been pursued
in right earnest consistent with the best international practices.
In a deregulated regime, the market determines the price of the public
issues, i.e., either by the issuer through fixed price or by the investors through book-
building process. A fair system of proportionate allotment of shares has been put in
place. The share of retail investors in the allotment of book-built issues has been
increased to 35 percent.14
Discretionary allotment to the Qualified Institutional
Buyers (QIBs) has been withdrawn. Companies are allowed to issue ADRs/ GDRs
and also raise funds through external commercial borrowing. The ADR / GDR’s
have two–way functionality. The Foreign Institutional Investors have been allowed
to invest in primary issues within the sectoral limits set by the Government.
3.3.2. Secondary Market Developments
The securities issued in the Primary Market are traded in the Secondary
Market. Exchanges in India offer screen based, electronic trading. The trading
system is connected using the VSAT technology from around 201 cities. There are
8652 trading members registered with SEBI at the end of March 2009. Enormous
amount of developments have taken place in the secondary market during the last
one decade. The selected indicators in Table-3 below clearly indicate this.
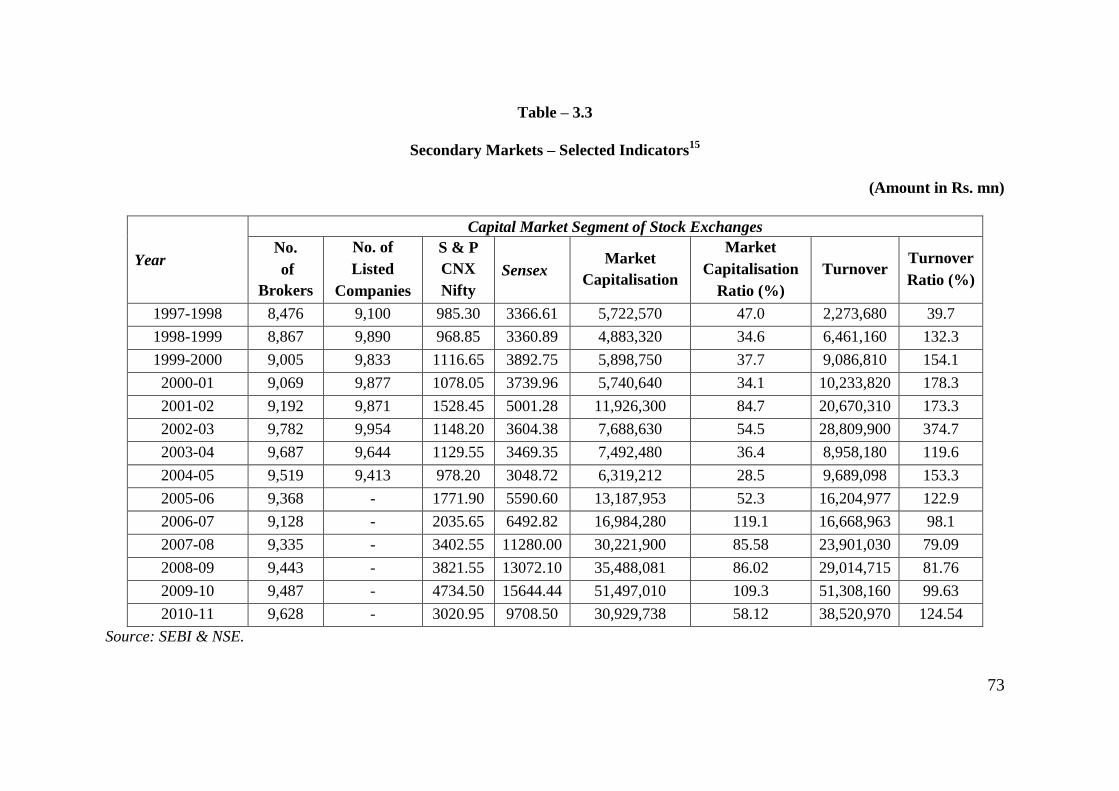
73
Table – 3.3
Secondary Markets – Selected Indicators15
(Amount in Rs. mn)
Year
Capital Market Segment of Stock Exchanges
No.
of
Brokers
No. of
Listed
Companies
S & P
CNX
Nifty
Sensex Market
Capitalisation
Market
Capitalisation
Ratio (%)
Turnover Turnover
Ratio (%)
1997-1998 8,476 9,100 985.30 3366.61 5,722,570 47.0 2,273,680 39.7
1998-1999 8,867 9,890 968.85 3360.89 4,883,320 34.6 6,461,160 132.3
1999-2000 9,005 9,833 1116.65 3892.75 5,898,750 37.7 9,086,810 154.1
2000-01 9,069 9,877 1078.05 3739.96 5,740,640 34.1 10,233,820 178.3
2001-02 9,192 9,871 1528.45 5001.28 11,926,300 84.7 20,670,310 173.3
2002-03 9,782 9,954 1148.20 3604.38 7,688,630 54.5 28,809,900 374.7
2003-04 9,687 9,644 1129.55 3469.35 7,492,480 36.4 8,958,180 119.6
2004-05 9,519 9,413 978.20 3048.72 6,319,212 28.5 9,689,098 153.3
2005-06 9,368 - 1771.90 5590.60 13,187,953 52.3 16,204,977 122.9
2006-07 9,128 - 2035.65 6492.82 16,984,280 119.1 16,668,963 98.1
2007-08 9,335 - 3402.55 11280.00 30,221,900 85.58 23,901,030 79.09
2008-09 9,443 - 3821.55 13072.10 35,488,081 86.02 29,014,715 81.76
2009-10 9,487 - 4734.50 15644.44 51,497,010 109.3 51,308,160 99.63
2010-11 9,628 - 3020.95 9708.50 30,929,738 58.12 38,520,970 124.54
Source: SEBI & NSE.

74
Market capitalization as percentage to GDP in India reached nearly 58
percent in 2008–09 and still further on a fluctuating trend. The rate of growth in
market capitalisation and turnover over the period indicates that more companies
have started using the trading platform of the Stock Exchanges. Although there are
22 stock exchanges, the National Stock Exchange (NSE) and the BSE together
account for more than 99 percent of the total turnover.
Recently, a separate trading platform, namely BSE Indonext, has been set up
jointly by BSE and the Federation of Indian Stock Exchanges to facilitate
transactions of shares exclusively relating to the small and medium enterprises. 16
3.3.3. SEBI Registered Market Intermediaries
Various institutions / intermediaries associated with primary as well as
secondary markets such as merchant bankers, registrars to issues, portfolio
managers, underwriters, bankers to issues, stock exchanges, brokers and sub-
brokers, share transfer agents, depositories, FIIs, custodians, credit rating agencies,
venture capital funds, collective investment schemes including mutual funds have to
register with SEBI and operate within the guidelines issued from time to time. SEBI
also promotes self-regulatory organizations. SEBI registered market intermediaries
from 1996 which are listed below in Table-4.

75
Table – 3.4
SEBI Registered Market Intermediaries17
Market
Intermediaries
As on 31st March
1996
1997
1998
1999
2000
2001
2002
2003
2004
2005
2006
2007
2008
2009
1 2 3 4 5 6 7 8 9 10 11 12 13 14 15
Stock Exchanges
(Cash Market) 22 22 22 23 23 23 23 23 23 22 22 21 19 19
Stock Exchanges
(Derivatives Market) - - - - 2 2 2 2 2 2 2 2 2 3
Brokers
(Cash Segment) 8476 8867 9005 9069 9192 9782 9687 9519 9368 9128 9335 9384 8517 8652
Corporate Brokers
(Cash Segment) 1917 2360 2976 3173 3316 3808 3862 3835 3746 3733 3961 4101 3955 4079
Sub Brokers
(Cash Segment) - 1768 3760 4589 5675 9957 12208 13291 12815 13684 23479 27540 43874 62471

76
Brokers (Derivative) - - - - - 519 705 795 829 994 1120 1258 1442 1587
Foreign Institutional
Investors 367 439 496 450 506 527 490 502 540 685 882 997 1319 1635
Custodians - - - - 15 14 12 11 11 11 11 11 15 16
Depositories - 1 1 2 2 2 2 2 2 2 2 2 2 2
Depository
Participants - 28 52 96 191 335 380 438 431 477 526 593 654 714
Merchant Bankers 1012 1163 802 415 186 233 145 124 123 128 130 152 155 134
Bankers to an issue 77 80 72 66 68 69 68 67 55 59 60 47 50 51
Underwriters 40 38 43 17 42 57 54 43 47 59 57 45 35 19
Debenture Trustees 23 27 32 34 38 37 40 35 34 35 32 30 28 30
Credit Rating
Agencies - - - - 4 4 4 4 4 4 4 4 5 5
Venture Capital
Funds - - - - - 35 34 43 45 50 80 90 106 132
Foreign Venture
Capital investors - - - - - 1 2 6 9 14 39 78 97 129

77
Registrars to an Issue
& Share Transfer
Agents
334 386 334 251 242 186 161 143 78 83 83 82 76 71
Portfolio Managers 13 16 16 18 23 39 47 54 60 84 132 158 205 232
Mutual Funds 27 37 38 41 38 39 38 38 37 39 38 40 40 44
Collective investment
Schemes - - - - 0 0 0 0 0 0 0 0 0 1
Approved
Intermediaries(Stock
Lending Schemes)
- 1 1 4 6 8 10 4 3 3 3 3 2 3
Source: SEBI

77
As on March 31, 2009, there were 19 Stock Exchanges, 8635 Brokers (cash
segment) and 62,471 Sub-brokers, over 9,000 Listed Companies, 2 Depositories,
714 Depository Participants, 134 Merchant Bankers, 19 Underwriters, 5 Credit
Rating Agencies and 1635 Foreign Institutional Investors in India.
3.3.4. Mutual Funds
In order to develop the security cult and also to encourage indirect
participation of households in the Indian Securities Market, Mutual Funds have been
encouraged, both in the public and private sectors. Huge resources have been
mobilised through Mutual Funds. The trend in resource mobilisation by Mutual
Funds is indicated in Table-5 below: -
Table – 3.5
Trends in Resource Mobilisation by Mutual Funds18
(Rs. in Crores)
Year Gross
Mobilisation Redemption Net Inflow
Assets at the
end of the
period
1993-94 62076 - - -
1994-95 13727 - - -
1995-96 6508 - - -
1996-97 4777 - - -
1997-98 11406 - - -
1998-99 22710 23660 -949 68193
1999-00 61241 52271 18970 107946
2000-01 92957 83829 9128 90587
2001-02 164523 157348 7175 100594
2002-03 314706 310510 4196 109299
2003-04 590190 543381 46808 139616
2004-05 839708 837508 2200 149600
2005-06 1098149 1045370 52779 231862
2006-07 1938493 1844508 93985 326292
2007-08 4464377 4310575 53802 505152
2008-09 5426354 5454650 - 28296 417300
Source: SEBI

78
Currently, there are 44 Mutual Funds including foreign mutual funds, offering more
than 400 schemes to the investors .The cumulative Assets Under Management
(AUM) of all the Mutual Funds which were Rs. 3,26,292 crores as on March 31,
2007 and has increased to Rs.5,05,152 crores by March 31, 2008. At the end of
March 2009 there is a sudden decrease when compared to end of March 2009. For
an orderly growth of the mutual funds, prudential regulations have been put in place
keeping in view the interest of the investors.
3.3.5. Derivatives
Introduction of securities related derivatives in India is another milestone
which provides an important avenue to the investors, mainly for hedging. The
securities contract (Regulation) Act, 1956 was amended in December 1999 to
expand the definition of securities to include derivatives so that the entire regulatory
framework governing trading of securities could apply to trading in derivatives.
Derivatives trading began in India with the launch of index futures in June 2000
followed by index options, single stock options and single stock futures in 2001. 19
Interest rate futures were introduced in June 2003. The derivative products have a
monthly maturity cycle. From September 13th
, 2004 weekly stock and index option
was launched on the derivative segment of BSE .Two premier stock exchanges,
namely BSE and NSE, provide trading platforms for derivative transactions.
The growth of the derivatives segment at BSE and NSE is indicated below in
Table-6.

79
Table – 3.6
Derivatives Segment at BSE and NSE20
Year No. of
Trading Days
No. of
Contracts
Turnover
(Rs.Crore)
BSE
2003-04 207 77743 1673
2004-05 247 99918 1812
2005-06 251 137209 2456
2006-07 254 374637 11743
2007-08 253 531630 16111
2008-09 251 201 9
2009-10 249 1781214 59006
2010-11 243 515588 12268
NSE
Jun-00 toMar01 211 90580 2365
2003-04 247 3159344 76764
2004-05 251 13245847 339731
2005-06 254 51303705 1913436
2006-07 253 71972073 2378195
2007-08 251 152378495 4643981
2008-09 249 211600263 7162459
2009-10 251 415552569 12731341
2010-11 243 644094527 10781254
Source: BSE & NSE
Bulk of the derivative trading is done in the NSE. The combined turnover in
derivatives on BSE and NSE surpassed the combined turnover in the cash segments
since early 2009. During 2009-10, the turnover in the derivative segments of NSE
was 223 percent of its cash segment turnover. Similar to international trend, single
stock futures emerged as the most popular derivative product, followed by index
futures, stock options and index options. NSE ranks first in terms of number of
contracts traded in the single stock futures, second in Asia in terms of number of
contracts traded in equity derivatives instrument. 21

80
3.3.6. Foreign Institutional Investments
The Foreign Institutional Investors (FIIs) were allowed to invest in India in
1992 under the portfolio investment scheme. They are also allowed to participate in
the public issues of debt and equities within the sectoral limits set for equities and
the overall limit fixed for the debt instruments by the Government. India has been a
centre of attraction for the FIIS. The growth in foreign investment inflows is
indicated in below in Table-7.
Table – 3.7
Foreign Investment Inflows22
Year A. Direct Investment B. Portfolio
Investment
Total (A +B)
(Rs.
Crore)
(Us $
Million)
(Rs.
Crore)
(US $
Million)
(Rs.
Crore)
(US $
Million)
1992-93 174 97 11 6 185 103
1993-94 316 129 10 4 326 133
1994-95 965 315 748 244 1713 559
1995-96 1838 586 11188 3567 13026 4153
1996-97 4126 1314 12007 3824 16133 5138
1997-98 7172 2144 9192 2748 16364 4892
1998-99 10015 2821 11758 3312 21773 6133
1999-00 13220 3557 6794 1828 20014 5385
2000-01 10358 2462 -257 -61 10101 2401
2001-02 9338 2155 13112 3026 22450 5181
2002-03 18406 4029 12609 2760 31015 6789
2003-04 29235 6130 9639 2021 38874 8151
2004-05 24367 5035 4738 979 29105 6014
2005-06 19860 4322 52279 11377 72139 15699
2006-07 27188 6051 41854 9315 69042 15366
2007-08 39674 8961 55307 12492 94981 21453
2008-09 103367 22826 31713 7003 135080 29829
2009-10 138276 34362 109741 27271 248017 61633
2010-11 161481 35168 -63618 -13855 97863 21313
Source: RBl Bulletin

81
Foreign investment inflows both by direct investment and portfolio
investment amounted to Rs. 97863 crores and US $ 21313 million as on March 31,
2009.
FIIs have been bullish on the Indian securities. Their net investment every
year was positive ever since they were allowed to invest in India except in 1998- 99
& 2008-09 as shown in Table-8 below:
Table – 3.8
Trends in FII Investment23
Year Gross
Purchases
Gross
Sales
(Rs.
Crore)
Net
Investment
(Rs. Crore)
Net
Investment
(US $ mn)
Cumulative
Net
Investment
(US $ mn)
1989-90 18 4 13 4 4
1990-91 5593 467 5127 1634 1638
1991-92 7631 2835 4796 1528 3167
1992-93 9694 2752 6942 2036 5202
1993-94 15554 6980 8575 2432 7635
1994-95 18695 12737 5958 1650 9285
1995-96 16116 17699 -1584 -386 8899
2001-02 56857 46735 10122 2474 11372
2002-03 74051 64118 9933 2160 13531
2003-04 50071 41308 8763 1839 15371
2004-05 47061 44372 2689 566 15936
2005-06 144855 99091 45764 10005 25942
2006-07 216951 171071 45880 10352 36293
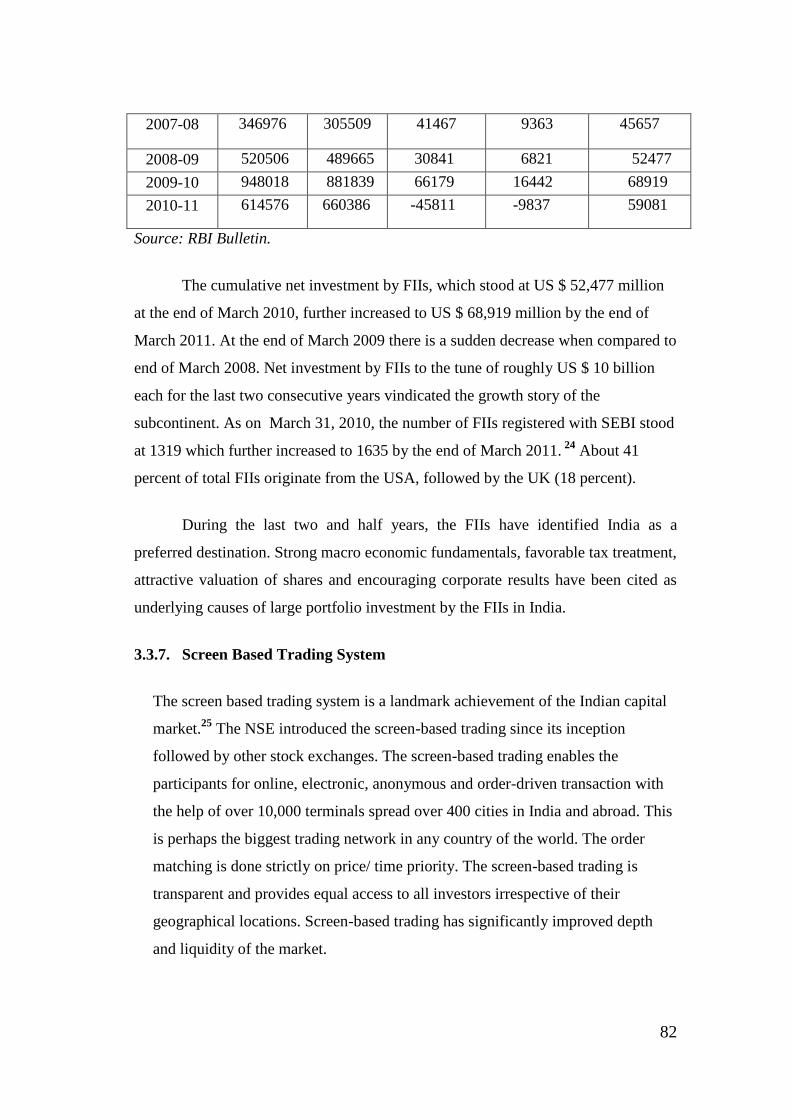
82
2007-08 346976 305509 41467 9363 45657
2008-09 520506 489665 30841 6821 52477
2009-10 948018 881839 66179 16442 68919
2010-11 614576 660386 -45811 -9837 59081
Source: RBI Bulletin.
The cumulative net investment by FIIs, which stood at US $ 52,477 million
at the end of March 2010, further increased to US $ 68,919 million by the end of
March 2011. At the end of March 2009 there is a sudden decrease when compared to
end of March 2008. Net investment by FIIs to the tune of roughly US $ 10 billion
each for the last two consecutive years vindicated the growth story of the
subcontinent. As on March 31, 2010, the number of FIIs registered with SEBI stood
at 1319 which further increased to 1635 by the end of March 2011. 24
About 41
percent of total FIIs originate from the USA, followed by the UK (18 percent).
During the last two and half years, the FIIs have identified India as a
preferred destination. Strong macro economic fundamentals, favorable tax treatment,
attractive valuation of shares and encouraging corporate results have been cited as
underlying causes of large portfolio investment by the FIIs in India.
3.3.7. Screen Based Trading System
The screen based trading system is a landmark achievement of the Indian capital
market.25
The NSE introduced the screen-based trading since its inception
followed by other stock exchanges. The screen-based trading enables the
participants for online, electronic, anonymous and order-driven transaction with
the help of over 10,000 terminals spread over 400 cities in India and abroad. This
is perhaps the biggest trading network in any country of the world. The order
matching is done strictly on price/ time priority. The screen-based trading is
transparent and provides equal access to all investors irrespective of their
geographical locations. Screen-based trading has significantly improved depth
and liquidity of the market.

83
3.3.8. Depositories
Depositories Act, 1996 was another landmark development in the history of
India’s capital market.26
Thereafter two depositories namely, Central Depository
Services Limited (CDSL) and National Securities Depository Limited (NSDL) were
set up. NSDL and CDSL have been successful in the dematerialisation of securities
to the extent of 99 percent of the total market capitalisation. Currently the transfer of
ownership is mostly done through book-entry form. This has tremendously
improved the speed, accuracy and security of the settlement system. About 99.9
percent of trades in BSE and 100 percent of trades in NSE as shown in Table-9
below are currently settled through delivery, which is possible only due to
dematerialisation of scrip by the two depositories.

84
Table – 3.9
Settlement Statistics for Cash Segment of BSE and NSE27
Year N
o. of
Tra
des
Tra
ded
Qu
an
tity
(Lak
hs)
Del
iver
ed
Qu
an
tity
(L
ak
hs)
% o
f D
eliv
ered
Qu
an
tity
To
Tra
ded
Qu
an
tity
Tu
rnover
(Rs
.cro
re)
Del
iver
ed V
alu
e
(Rs.
Cro
re)
% o
f D
eliv
ered
Valu
e to
Tota
l
Tu
rnover
Del
iver
ed Q
uan
tity
In D
emat
Mod
e (L
ak
h)
% o
f D
ema
t
Del
iver
ed
Qu
an
tity
to T
ota
l
Del
iver
ed Q
uan
tity
1 2 3 4 5 6 7 8 9 10
BSE
1992- 93 126 35031 - - 45696 - - -
1993-94 123 75834 - - 84536 15861 18.76 - -
1994-95 196 107248 44696 41.68 67749 26641 39.32 - -
1995-96 171 77185 26763 34.67 50064 11527 23.02 - -
1996-97 155 80926 21188 26.18 124190 10993 8.85 - -
1997-98 196 85877 24360 28.37 207113 22512 10.87 - -
1998-99 354 129272 50570 39.12 310750 85617 27.55 - -
1999-00 740 208635 94312 45.20 686428 174740 25.46 - -
2000-01 1428 258511 86684 33.53 1000032 1666941 16.69 - -
2001-02 1277 182196 57668 31.65 307292 59980 19.52 - -
2002-03 1413 221401 69893 31.57 314073 48741 15.52 - -
2003-04 2005 385806 133240 34.54 503053 107153 21.30 132941 99.78

85
2004-05 2374 477171 187519 39.30 518716 140056 27.00 187347 99.91
2005-06 2643 664467 300653 45.25 816074 271227 33.24 300497 99.95
2006-07 3462 560780 229685 40.96 956185 297660 31.13 229573 99.95
2007-08 5303 986009 361628 36.68 1578855 476196 30.16 361542 99.98
2008-09 5408 739601 196630 26.59 1100074 230332 20.94 196096 99.73
NSE
Nov 94 –
Mar- 95 3 1330 688 51.74 1728 898 51.98 - -
1995-96 64 39010 7264 18.62 65742 11775 17.91 - -
1996-97 262 134317 16453 12.25 292314 32640 11.17 - -
1997-98 383 135217 22051 16.31 370010 59775 16.15 - -
1998-99 550 165310 27991 16.93 413573 66204 16.01 6179 22.08
1999.00 958 238605 48713 20.42 803050 82607 10.29 26063 53.50
2000-01 1614 304196 50203 16.50 1263898 106277 8.41 47257 94.13
2001-02 1720 274695 59299 21.59 508121 71766 14.12 59169 99.78
2002-03 2403 365403 82305 22.52 621569 87895 14.14 82305 100.00
2003-04 3751 704539 174538 24.77 1090963 220341 20.20 174538 100.00
2004-05 4494 787996 201405 25.56 1140969 276120 24.20 201405 100.00
2005.06 6000 818438 226346 27.66 1516839 407976 26.90 226346 100.00
2006-07 7857 850515 238571 28.05 1940094 543533 28.02 238571 100.00
2007-08 11645 1481229 366974 24.77 3519919 970618 27.58 366974 100.00
2008-09 13639 1418928 303299 21.38 2749450 610498 22.20 303299 100.00
Source: BSE & NSE

86
3.3.9. Clearing, Processing and Settlement System
The setting of the Clearing Houses / Clearing Corporations (CCs) has been a
critical institutional arrangement to improve the market microstructure of the Indian stock
market. NSE has a dedicated subsidiary namely, National Securities Clearing Corporation
Limited (NSCCL) which performs the role of a central counterparty. The CCs provide
full innovation with multilateral netting. Trade and Settlement Guarantee Funds have
been set up to guarantee settlement in case of default by brokers. There is also a system
of security lending and borrowing to obviate settlement risk .As CCs provide guaranteed
settlement, there is no counterparty risk in India. Moreover, India is one of the few
countries of the world to implement full- fledged Straight Through Processing (STP). The
STP has been made mandatory for all institutional trades.28
Another notable achievement has been the short ending of the settlement cycle
and adoption of the rolling settlement. The settlement cycle was as high as 14 days for
specified scrips and 30days for others. The settlement risk was very high as many things
can happen between the transaction and the settlement. Initially, the settlement cycle was
reduced to a week. There after the settlement vehicle was further reduced to T+3 from
April 2002 and to T+2 from April 2003. Efforts are being made to reduce the settlement
cycle further to T+1 basis. India’s settlement cycle is one of the best in the world.29
3.3.10. Risk Management System
SEBI has put in place a comprehensive risk management system. The major
features of the dynamic risk management system include, interalia, capital adequacy
norms, trading and exposure limits, margin requirement based or mark to market and Var
based margins, market-wide circuit filters, on-line position monitoring and automatic
disablement of broker’s terminals.30
Indian capital market remained insulated against the
South-East Asian meltdown in the late 90s. The May 17, 2004, crash of the stock market
in India was short-lived due to comprehensive risk management system. The T+2 trading
cycle, settlement guarantee funds, guaranteed settlement by CCs together with risk
management system have significantly reduced the risk perception of the Indian stock
market.

87
3.3.11. Margin Trading Facility
SEBI has allowed the member brokers to provide margin trading facility to their
clients in the cash segment since April 1, 2004. Securities with mean impact cost of less
than or equal to one and traded at least 80 per cent of the days during the previous 18
months would be eligible for margin trading. Only corporate brokers with net-worth of at
least Rs. 3 crore would be eligible to offer this facility after obtaining prior permission
from the exchanges.31
3.3.12. Regulatory Framework for Investor Protection
Investors are the major stakeholders in the securities market. It is mandatory for
SEBI to protect the interests of the investors. As a matter of fact, protection of investors’
interest is pursued by the securities market regulators throughout the world. Although the
objective is more or less the same for most of the regulators, the means to achieve it
varies from one jurisdiction to another. In India, one of the major achievements has been
to shift from merit-based regime to disclosure-based regime. SEBI issued Disclosure and
Investor Protection (DIP) Guidelines in 2000 and amended the same from time to time
keeping in view the investors’ interest. The disclosure norms in India are considered as
one of the best in the world.32
Listed companies have to comply with the disclosure
norms on an initial as well as on a continuous basis. The major objectives of the
disclosure norms have been to ensure transparency and provide adequate protection to the
investors.
Pricing of the public issues has been deregulated since the early 1990s. In a
deregulated regime, disclosures play a crucial role for the investors to take informed
decisions about their investment. Nevertheless, many companies, which flooded the
primary market in the early 1990s, have vanished. Hence, the disclosure norms have been
tightened from time to time.
Disclosure ought to be done on the stock exchange in addition to filing of regular
returns to stock exchange where it is listed, as well as to the Registrar of Companies. Any
price sensitive information about the company disclosed elsewhere attracts penal action.

88
Moreover, unfair trade practices, including insider trading, is prohibited in India in order
to provide a level playing field to all investors. If any person indulges in fraudulent and
unfair practices, he shall be liable to a maximum penalty of Rs. 25 crore or three times
the amount of profits made out of such practices, whichever is higher. 33
There is a system of proportional allotment of public issues in India. In case of
fixed price public issues, 50 per cent shares are being allotted to the retail investors. In
case of book-built issues, the share of allotment for the retail investors has been raised
from 25 per cent to 35 per cent. Keeping in view the possible misuse, the discretionary
allotment to the Qualified Institutional Buyers (QIBs) has been withdrawn. In a move
towards providing a level playing field, QIBs have been asked to deposit 10 per cent of
the bid amount.34
SEBI has given in-principle approval for the introduction of IPO grading at the
option of the issuer.35
IPO grading would be done by credit rating agencies registered
with SEBI. The grading is intended to be an independent and unbiased opinion of the
concerned agency. It would be a one time exercise and would focus on assisting the
investor, particularly the retail investors, for taking informed investment decision, SEBI
will not certify the assessment made by the rating agency. An issuer, who has opted for
IPO grading, has to disclose all gradings in the offer document. Cost of IPO grading can
be met by stock exchanges or out of the corpus maintained for Investor Education and
Protection Funds.
It has been recognised the world over that investors’ protection can be
strengthened by adhering to high corporate governance standards. Corporate governance
standards prescribed in India are based on international best practices.36
Following
recommendations of the expert committees, SEBI prescribed several governance
standards to be achieved by the companies by December 31, 2005, under the revised
Clause 49 of the Listing Agreement with the stock exchanges. Violation of this would
now attract penalty under the Listing Agreement. Corporate governance needs to be seen
not as compliance, but as a way of life. In this context, the quality of compliance assumes
significance. High corporate governance standards are not only desirable within the
economy, but also helpful for companies accessing the international capital market. SEBI

89
gives utmost importance to the corporate governance including mandatory induction of
independent directors.
The governance standards of the stock exchanges are also being improved
through the process called Corporatisation and Demutualisation (C & D) of stock
exchanges.37
The stock exchanges world over have been generally formed as mutual
organisations. The ownership, trading rights and management are often vested with the
same set of persons. This leads to conflicting interest between ownership and
management. In order to segregate the management function from the ownership and
trading rights, there is a need for demutualisation of stock exchanges. Moreover, stock
exchanges should function as body corporate similar to any other ‘for-profit’ corporate
entity. In India, NSE has been a corporate entity while NSE and OTCEI have been
demutualised from their inception. Corporatisation and Demutualisation of stock
exchanges is a priority item in the SEBI agenda. The oldest stock exchange of the
country, namely, the Bombay Stock Exchange became a limited company on August 19,
2005. The Corporatisation and Demutualisation process has been notified for most of the
remaining Regional Stock Exchanges (RSEs). The future of the RSEs post-
demutualisation is being worked out so that the viable among them can actively
participate in the mainstream market, besides catering to the regional requirements. A
professionally managed stock exchange with at least 50 per cent non-broking share-
holders is expected to play an important role for investor protection.
Security Regulations in Force38
The various security regulations in force are:-
1. SEBI (Stock Broker and Sub Broker) Regulations, 1992.
2. SEBI (Prohibition of Insider Trading) Regulation, 1992.
3. SEBI (Merchant Bankers) Regulations, 1992.
4. SEBI (Portfolio Managers) Regulations, 1993.
5. SEBI (Registrars to an Issue and Share Transfer Agents) Regulations, 1993.
6. SEBI (Underwriters) Regulations, 1993.
7. SEBI (Debenture Trustees) Regulations, 1993.

90
8. SEBI (Bankers to an Issue) Regulations, 1994.
9. SEBI (Foreign Institutional Investors) Regulations, 1995.
10. SEBI (Custodian of Securities) Regulations, 1996.
11. SEBI (Depositories and Participants) Regulations, 1996.
12. SEBI (Venture Capital Funds) Regulations, 1996.
13. SEBI (Mutual Funds) Regulations, 1996.
14. SEBI (Substantial Acquisition of Shares and Takeovers) Regulations, 1997.
15. SEBI (Buy- Back of Securities) Regulations, 1998.
16. SEBI (Credit Rating Agencies) Regulations, 1999.
17. SEBI (Collective Investment Schemes) Regulations, 1999.
18. SEBI (Foreign Venture Capital Investors) Regulations, 2000.
19. SEBI (Procedure for Board Meeting) Regulations, 2001.
20. SEBI (Issues of Sweat Equity) Regulations, 2002.
21. SEBI (Procedure for Holding Enquiry by Enquiry Officer and Imposing Penalty)
Regulations, 2002.
22. SEBI (Prohibition of Fraudulent and Unfair Trade Practices relating to Securities
Markets) Regulations, 2003.
23. SEBI (Central Listing Authority) Regulations, 2003.
24. SEBI (Ombudsman) Regulations, 2003.
25. SEBI (Central Database of Market Participants) Regulations, 2003.
26. SEBI (Criteria for Fit and Proper Person) Regulations, 2004.
27. SEBI (Self – Regulatory Organisations) Regulations, 2004.
28. SEBI (Regulatory Fee on stock exchanges) Regulations, 2006.
29. SEBI (Certification of Associated persons in the securities market) Regulations,
2007.

91
30. SEBI (Issue and listing of debt securities) Regulations, 2008.
31. SEBI (Intermediaries) Regulations, 2008.
32. SEBI (Delisting of Equity Shares) Regulations, 2009.
33. SEBI (Issue of Capital and Disclosure Requirements), 2010.
Security Guidelines in Force
The various security guidelines in force are:
1. SEBI (Employee Stock Option Scheme and Employee Stock Purchase Scheme)
Guidelines, 1999.
2. Guidelines for Opening of Trading Terminals Abroad (Issued in 1999).
3. SEBI (Disclosure & Investor Protection) Guidelines, 2000.
4. SEBI (Delisting of Securities) Guidelines, 2003.
5. SEBI (STP Centralized Hub and STP Service Providers) Guidelines, 2004.
6. Comprehensive Guidelines for Investor Protection Fund / Customer protection
Fund at Stock Exchanges (Issued in 2004).
Security Schemes in Force
The various security schemes in force are:
1. Securities Lending Scheme, 1997
2. SEBI (Informal Guidance) Scheme, 2003)
3.3.13. Grievances Redressal Mechanism
There is a comprehensive investor grievances redressal mechanism at its head
office as well as at the regional offices of SEBI. The Office of Investor Assistance and
Education (OIAE) is the single window interface through which SEBI interacts with
investors. SEBI takes up investor complaints with companies and registered
intermediaries on a regular basis. In order to file complaints, there is a standardised
format which is available at all SEBI offices and on the SEBI website for the

92
convenience of investors. SEBI has a simple and efficient internet based response system
for investor complaints. A system generated acknowledgement letter is issued to the
investors as soon as a complaint is received electronically. Investors have the option of
filing the complaints online or submitting the same on plain paper. Investors who visit the
SEBI offices or access the investor helpline are guided regarding the appropriate
authority to lodge their complaints which are outside the jurisdiction of SEBI. An account
of receipt and redressal of investor grievances by SEBI is highlighted in Table-10 below:-
Table – 3.10
Receipt and Redressal of Investor Grievances39
Year Grievances Received Grievances Redressed Cumulative
Redressal
Rate (%) During the
period
Cumulative During the
period
Cumulative
1991-92 18794 18794 4061 4061 21.6
1992-93 110317 129111 22946 27007 20.9
1993-94 584662 713773 339517 366524 51.4
1994-95 516080 1229853 351842 718366 58.4
1995-96 376478 1606331 315652 1034018 64.4
1996-97 217394 1823725 431865 1465883 80.4
1997-98 511507 2335232 676555 2142438 91.7
1998-99 99132 2434364 127227 2269665 93.2
1999-00 98605 2532969 146553 2416218 95.4
2000-01 96913 2629882 85583 2501801 95.1
2001-02 81600 2711482 70328 2572129 94.9
2002.03 37434 2748916 38972 2611101 95.0
2003-04 36744 2785660 21531 2632632 94.5
2004-05 54435 2840095 53361 2685993 94.6
2005-06 40485 2880580 37067 2723060 94.5
2006-07 26473 2907053 17899 2740959 94.3
2007-08 54933 2961980 31676 2772577 93.6
2008-09 57580 3019560 75989 2848566 94.3
Source: SEBI

93
During the period 1991-92 to 2008-09, the SEBI received 30, 19,560 grievances
from the investors of which a total of 28, 48,566 grievances were redressed by the
respective entities, indicating a redressal rate of 94.3 per cent.
In case the companies fail to redress complaints in spite of repeated reminders by
SEBI, regulatory actions are initiated under section 11B (debarring companies form
accessing the capital markets) and 15C (imposing of monetary penalty) of the SEBI Act,
1992. Up to March 31, 2009, 33 companies have been referred for adjudication
proceedings under Section 15C of the SEBI Act, 1992. Prohibitory orders have also been
passed under Section 11B of the SEBI Act, 1992 against errant companies which did not
redress the investor grievances. Such orders have been passed against 12 companies and
62 directors till March 31, 2009.40
Moreover, SEBI also issues the status of investor
grievances every fortnight for public information and uploads the same on SEBI Website.
3.3.14. Investor Education41
Investor education plays a crucial role for the securities market awareness,
particularly for the retail investors. A major initiative in this regard during the recent past
has been launching of a comprehensive Securities Market Awareness Campaign (SMAC)
on January 17, 2003. The campaign includes workshops, audio-visual clippings, and
distribution of educative materials in English, Hindi and also in regional languages. There
is a dedicated investor website which archives the booklets / pamphlets / FAQs etc. SEBI,
in co-ordination with other agencies, conducted about 2188 workshops throughout the
country till date under the SMAC. (Tamilnadu-134)
SEBI recognises investor associations and extends financial support for
conducting investor education programmes. SEBI has recognised 24 investor associations
up to November 2010.
There has been a long-standing request from the financial journalists of the print
and electronic media to have an interface with SEBI on issues relating to the capital
market. As financial journalists play a critical role for investors’ education, SEBI decided

94
to conduct a one-day workshop on capital market for the financial journalists at different
centres. The objective of the programme is to provide adequate inputs to the financial
journalists for balanced reporting of financial events and shoulder the responsibility of
accurate dissemination of information on the developments that are taking place on a
day-to-day basis in the securities market. This programme was organised at New Delhi
and Chennai during 2005-06. At both the places, the programme was inaugurated by Shri
M. Damodaran, Chairman, SEBI. A few outside experts, including professors and
practitioners were invited for an interface with the participants in addition to
presentations given by the senior officers of SEBI. As the response was encouraging,
SEBI is contemplating to conduct the same programme in other centres during 2006-07.
3.4. RECENT INITIATIVES42
SEBI introduced the Application Supported by Blocked Amount (ASBA) as a new
mode of payment in public issue. In this kind of mechanism the application money
remains blocked in the bank account of the applicant till the allotment is finalized.
Direct Market Access facility was introduced for institutional investors in April
2008 by SEBI.
In an endeavour to strengthen the risk management framework, margining for
institutional trades was made mandatory by SEBI.
Reduction in time for Right Issues was reduced from 16 weeks to 6 weeks.
A change in Securities Lending and Borrowing (SLB) Scheme was introduced in
April 2008.
Currency Futures were launched on USD-INR pair in India in August 2008 by
NSE, and October 2008 by BSE and MCX.
Removal of Quantitative restrictions imposed on the Overseas Derivatives
Instruments (ODIs) for FII.

95
Exit Option to Regional Stock Exchanges (RSEs).
Listing of close-ended schemes launched on or after December 12, 2008 along with
daily computation of NAV was made compulsory.
SEBI permitted NSE to launch Interest Rate Futures on August 31, 2009.
3.5. INDIAN CAPITAL MARKET – FUTURE ROAD MAP43
SEBI may go in for fresh investor survey at the earliest to understand the
investment behaviour of the households during the more recent period.
Hon’ble Union Finance Minister has proposed to set up an investor protection
fund under the aegis of SEBI which would be funded by fines and penalties
recovered by SEBI.
SEBI would continue to nurture the Mutual Fund Industry and thereby attract
more and more household participation in the capital market.
Gold Exchange Traded Fund (GETF) has been introduced in India and in
addition, SEBI is also working for the introduction of the Real Estate Mutual
Fund, which is likely to mitigate the housing requirement of many households.
SEBI has been authorized to set up a National Institute of Securities Markets
(NISM) for teaching and training intermediaries in the securities market and
promoting research.
3.6. SUMMARY
Thus the Indian Capital Market is in transition. There has been a revolutionary
change over a period of time. In fact, on almost all the operational and systematic risk
management parameters, settlement system, disclosures, accounting standards, the Indian
Capital Market is at par with the global standards. The goal of SEBI is to make the
Indian Capital Market truly world class, competitive, transparent and efficient. A

96
perception is steadily growing about the Indian Capital Market, as a dynamic market,
among the international community. Let us dream to make our Indian Capital Market a
benchmark for the rest of the world.
REFERENCES
1. Levine, Ross and S. Zervos, “Stock Market Development and Economic Growth”,
The World Bank Economic Review, Vol.1012, PP.323-339, 2006.
2. Agarwal R.N, “Financial Liberalization in India: Banking system and stock
Markets”, Delhi: D.K. Publishers, 2007.
3. Bajpai G.N., “Developments of capital Markets in India”, cited at London
School of Economics on 2nd
October 2009, www.sebi.gov.in
4. Fama E, “Efficient Capital Markets: II”, Journal of Finance, Vol. XLVI(5),
PP.1575-1617
5. Shah. A and Thomas., S, “Developing the Indian Capital Markets” in J.A.
Hanson and S.Kasthuria, eds, “A Financial sector for the Twenty first century,
India,”: Oxford University Press, Chapter 71, PP.225 -265
6. Ibid., P.270
7. Shirin Rathore, Muneesh Kumar, Amitabh Gupta, “Indian Capital Market – An
Empirical Study”, New Delhi: Anmol publications Pvt. Ltd., Cover page.
8. NSE-Fact book: 2009, www.nseindia.com,p.1.
9. Damodharan.M, “Capital Market in India: A country Profile”, SEBI bulletin,
Vol.3, No.11, Nov2009,P 5.
10. SEBI, Handbook of Statistics on the Indian Securities Market: 2009,
www.sebi.gov.in, PP. 247-250.

97
11. Indian Securities Market – A Review: 2005, National Stock Exchange
publication, Vol.VIII, P.5.
12. SEBI, Handbook of Statistics on the Indian Securities Market: 2009,
www.sebi.gov.in PP.22-23.
13. Sachdeva, “Emerging Securities Market – Challenges and Prospects”, Chartered
Financial Analyst, Feb 2005, PP.53-56.
14. Ibid., pp.70-75
15. Indian Securities Market – A Review: 2011, National Stock Exchange
publication, PP.15.
16. Damodharan.M, “Capital Market in India: A country Profile”, SEBI bulletin,
PP.6.
17. SEBI, Handbook of Statistics on the Indian Securities Market:2009,
www.sebi.gov.in PP.3
18. Ibid., PP.52
19. NSE-Fact book: 2011, www.nseindia.com,p.1, PP.85
20. SEBI, Handbook of Statistics on the Indian Securities Market: 2009,
www.sebi.gov.in, PP.43.44.
21. Indian Securities Market – A Review: 2011, National Stock Exchange
publication, PP.85.
22. Ibid., PP.50.
23. Ibid., PP.51.
24. Ibid., PP.3.

98
25. Damodharan.M, “Capital Market in India: A country Profile”, SEBI bulletin,
Vol.3, No.11, Nov2010 PP.7.
26. Ibid., pp.10-12.
27. SEBI, Handbook of Statistics on the Indian Securities Market:2009,
www.sebi.gov.in, PP.40-43.
28. Damodharan.M, “Capital Market in India: A country Profile”, SEBI bulletin,
Vol.3, No.11, Nov2005
29. Ibid.,
30. Ibid., PP.8.
31. Indian Securities Market – A Review: 2005, National Stock Exchange
publication, Vol.VIII, PP:112-113.
32. Chopra V.K, “Investor Protection: An Indian Perspective”, SEBI bulletin, Nov
2006,
33. Chopra V.K. “Capital Market Reforms in India: Recent Initiatives”, SEBI bulletin
Nov 2011,
34. Ibid.,pp.5
35. Chopra V.K, “Investor Protection: An Indian Perspective”, SEBI bulletin, Nov
2010,
36. Ibid.,pp.6.
37. Chopra V.K. “Capital Market Reforms in India: Recent Initiatives”, SEBI bulletin
Nov 2006
38. Security Regulations, Guidelines, Schemes in Force, SEBI bulletin, Vol.3, No.11,
Nov 2010, PP.13

99
39. SEBI, Handbook of Statistics on the Indian Securities Market:2011,
www.sebi.gov.in PP.70.
40. Chopra V.K, “Investor Protection: An Indian Perspective”, SEBI bulletin, Nov
2009,
41. Ibid., pp. 20
42. Chopra V.K. “Capital Market Reforms in India: Recent Initiatives”, SEBI bulletin
Nov 2008
43. Chopra V.K, “Investor Protection: An Indian Perspective”, SEBI bulletin, Nov
2011.

100
CHAPTER - IV
INVESTMENT PREFERENCE AND DECISION
INTRODUCTION
This Chapter examines the investment pattern of the retail equity investors in
general and investment preferences, risk-return perceptions and investment objectives of
the retail equity investors based on the socio-economic variables and selective investment
profile factors.
An investment in equity shares is one of the welcoming trends in the investment
sector. These investments have been found in the primary market, secondary market,
changes in project details and financial parameters. The equity share is always dominated
by the primary market and secondary market and the investors select one of these to their
investment processes and lucrative approach. In this chapter, perception of investors on
primary and Details of present values are analysed with respect to their various
investment options and procedures. The ideas of financial parameters and changes of
project details contribute to the retail investment and their progress. So their elements and
consequences in the present scenario are ascertained through the opinions of respondents.
Several sophisticated and multivariate tools are exploited to obtain the torrent of results
useful for the study. The general impact of financial investments on the equity shares will
be analysed with the support of data collected by using appropriate statistical tools, of
course with necessary interpretations.
As already mentioned though the study related to financial investments and their
impact on the equity shares, the main concentration will be on the perception of the
investors, who are the part and parcel of the equity shares. Hence, the study of
demographic variables regarding the investors is necessary and let us book at them in the
following lines.

101
4.2 Age of the Investors
Investment factor often goes with age. Age factor distinguishes the investor
behaviour. Many investing options have carved out a place in the equity shares by
concentrating on a specific age segment. The age of the investors plays a crucial role to
identify the investment behaviour. It is considered as a useful demographic variable to
segment the investors based on their perception of the investment pattern. The
respondents have been divided into four groups, namely, less than 25, 26-40, 41-60 and
above 60. Table 4.1 shows the age of frequency distribution of the sample investors.
Table - 4.1 Age Frequency of Investors
Age Frequency Percentage
Below 25 29 5.7
26-40 278 54.9
41-60 169 33.3
Above 60 31 6.2
Total 507 100
Source: Primary Data
The above table clearly indicates that a maximum percentage of 54.9% of
investors are in the age group of 26 to 40 followed by the investors in the age group 41 to
60 which is 33.3%. It is also found that a less percent of 6.2% of the investors are in the
age group of above 60.

102
Figure – 4.1: Age of the Investors
4.3 Gender of the Investors
Gender is a useful variable for the equity shares investment because it seems to
reflect the attitudes, options and prudential motives of the investors. Gender is an
important factor to identify the behaviour of the investors. In general, most of the
investors in the equity shares are males. Females are not much exposed to the
effectiveness of retail investment and their consequences. Table - 4.2 shows the
distribution of male and female investors.
Table - 4.2: Gender of the Investors
Gender Frequency Percentage
Male 468 92.4
Female 39 7.6
Total 507 100

103
Source: Primary Data
From the above table, it is clear that 92.4% of the investors are males and 7.6%
are females. This profoundly reveals that males are more enthusiastic than females in
equity shares investment. These results are also shown in Figure – 4.2.
Figure – 4.2: Gender of the Investors
4.4 Marital Status of the Investors
Marital status affects the investment pattern of investors. The marital sentiments
force them to invest for their future prospects. This state makes the investor to think twice
before investment. The martial status is considered to be one of the major determinants
for investors. Due to various family commitments, the married investors are not able to
concentrate more on investment in the equity shares. Table - 4.3 indicates the marital
status of the investors.
Percentage

104
Table - 4.3: Marital Status of the Investors
Marital Status Frequency Percentage
Married 407 80.3
Unmarried 93 18.4
Separated 07 1.2
Total 507 100
Source: Primary Data
It is found from the above table that 80.3% investors are married and 18.4% are
unmarried and the remaining 1.2% is separated according to martial status. The married
investors view these investments for their prudential purpose. The graphic figure – 4.3
also supports the above interpretation.
Figure – 4.3: Marital Status of the Investors
4.5 Education of the Investors
Education completely expresses the values of investment, creates attitudinal
changes among investors, more broadly, it reflects a life style with many investment
options in the equity shares. Education is a powerful background for the investor’s
analysis about the pros and cons of investment in equity shares. Table - 4.4 presents
education wise distribution of the investors.
Percentage
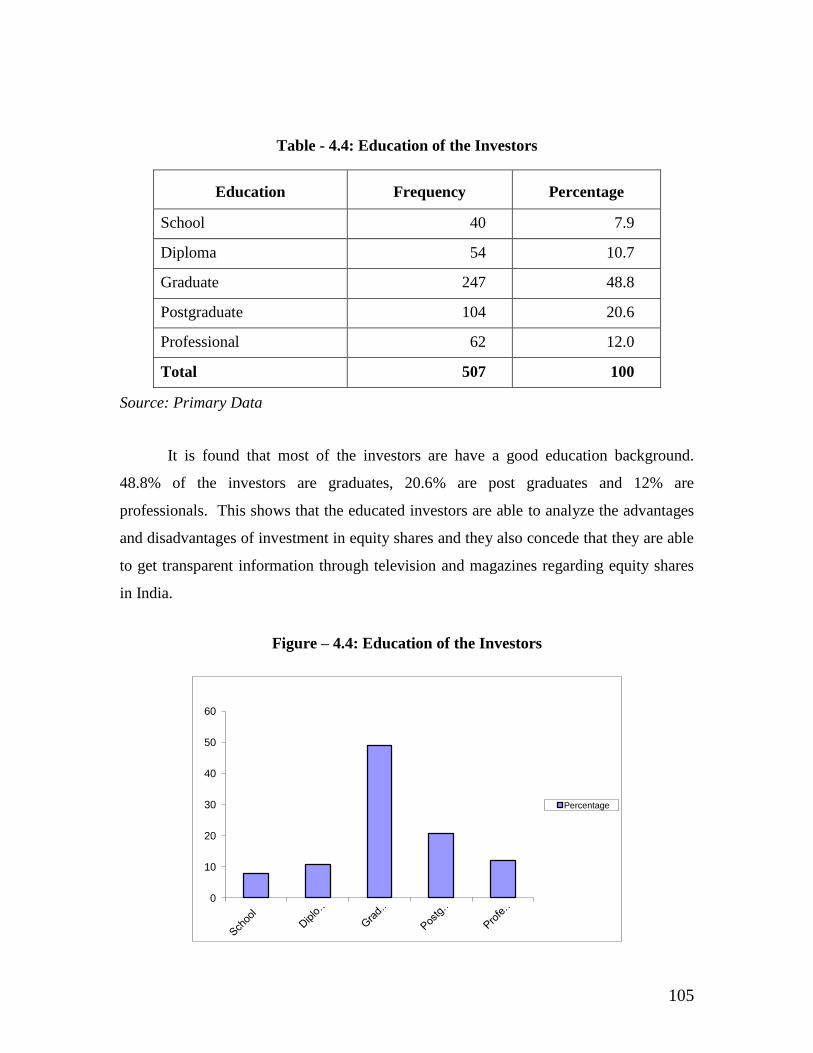
105
Table - 4.4: Education of the Investors
Education Frequency Percentage
School 40 7.9
Diploma 54 10.7
Graduate 247 48.8
Postgraduate 104 20.6
Professional 62 12.0
Total 507 100
Source: Primary Data
It is found that most of the investors are have a good education background.
48.8% of the investors are graduates, 20.6% are post graduates and 12% are
professionals. This shows that the educated investors are able to analyze the advantages
and disadvantages of investment in equity shares and they also concede that they are able
to get transparent information through television and magazines regarding equity shares
in India.
Figure – 4.4: Education of the Investors
0
10
20
30
40
50
60
Education of the investors
Percentage

106
4.6 Occupation of the Investors
Many investment companies and stock brokers have found that occupational
category can also be used to distinguish the investment pattern. Occupation of the
investors paves the way and also induces the investment pattern of the investors. Table -
4.5 depicts the occupation of investors surveyed, among five groups according to their
occupation.
Table - 4.5: Occupation of the Investors
Occupation Frequency Percentage
Government 70 13.8
Private 218 43.0
Self-employed 166 32.7
Agriculture 07 1.3
Retired 46 9.2
Total 507 100
Source: Primary Data
In this table, it is identified that most of the investors are working in private
concerns or running their own business, that is 43% and 32.7% of investors are employed
in private or in their business concerns. The Government employees are not enthusiastic
more in equity shares investment and retired people and agriculturalists also show the
least interest in investing their surplus in equity shares project details. The above facts
have been shown in Figure – 4.5 also.
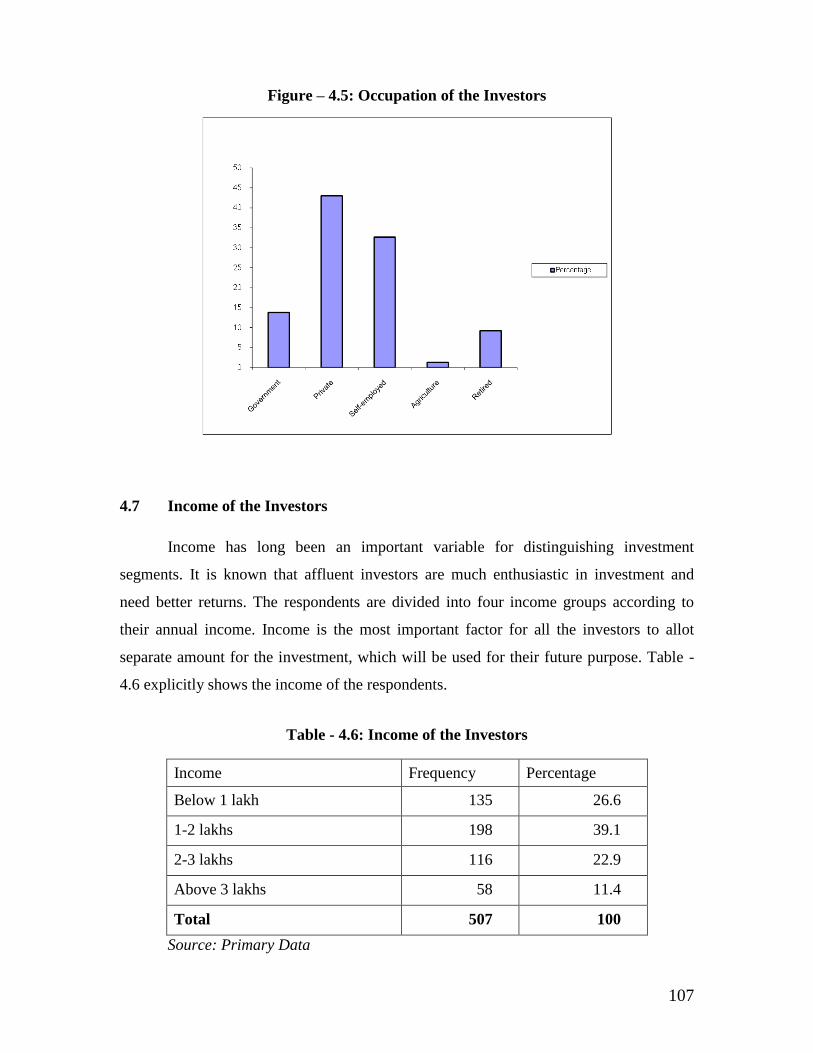
107
Figure – 4.5: Occupation of the Investors
4.7 Income of the Investors
Income has long been an important variable for distinguishing investment
segments. It is known that affluent investors are much enthusiastic in investment and
need better returns. The respondents are divided into four income groups according to
their annual income. Income is the most important factor for all the investors to allot
separate amount for the investment, which will be used for their future purpose. Table -
4.6 explicitly shows the income of the respondents.
Table - 4.6: Income of the Investors
Income Frequency Percentage
Below 1 lakh 135 26.6
1-2 lakhs 198 39.1
2-3 lakhs 116 22.9
Above 3 lakhs 58 11.4
Total 507 100
Source: Primary Data

108
It is found from the table that 39.1% investors belong to the income groups of Rs.
1 - 2 lakhs and 26.6% investors have the income less then Rs. 1 lakhs, 22.9% are in the
income of groups of Rs. 2 - 3 lakhs. The investors with more than Rs. 3 lakhs income do
not show more interest on investments in equity shares. Figure – 4.6 also illustrates the
above data.
Figure – 4.6: Income of the Investors
4.8 Nature of Family of the Investors
Nature of family is an important factor affecting the regular investment pattern.
Family nature is considered as one of the burdens affecting the investment behaviour of
investors. Family members of investors are classified into three groups as shown in the
table - 4.7.

109
Table - 4.7: Nature of Family of the Investors
Nature of family Frequency Percentage
Joint 194 38.3
Nuclear 313 61.7
Total 507 100
Source: Primary Data
From the above table, it is clear that the investors in the joint family are not much
enthusiastic in investment in the equity shares and the investors of nuclear family are able
to invest more amount of their income in equity shares. Figure – 4.7 also indicates the
above observation.
Figure – 4.7: Nature of the Family of Investors
4.9 Number of Dependents of the Investors
The number of dependents is playing a significant role in deciding the investment
amount of the investors and it is presented in table - 4.8.

110
Table - 4.8: Number of Dependents of the Investors
Number of Dependents Frequency Percentage
No dependents 70 13.8
1 dependent 49 9.7
2 dependents 121 23.9
3 dependents 138 27.2
4 dependents 60 11.9
More than 4 dependents 69 13.5
Total 507 100
Source: Primary Data
When the number of dependents is more in the family, their investment behaviour
pattern also changes significantly. The number of dependents and investment are
inversely proportional to each other. When the number of dependents is more in the
family, they do not have ample money for investment in this present economic situation.
Figure – 4.8 also indicates the same inference.
Figure – 4.8: Number of Dependents of the Investors

111
4.10 House Ownership of the Investors
Own house and rented house investors behave in a different manner during their
investment proceedings. Rented house exploits their income and hampers them from
investment. Table - 4.9 indicates two types of investors.
Table - 4.9: House Ownership of the Investors
House Ownership Frequency Percentage
Own 434 85.7
Rented 73 14.3
Total 507 100
Source: Primary Data
It is inferred from the table that most of the investors in equity shares have their
own house. If they have their own houses, they divert their income in the form of
investment in equity shares. It is also found that 85.7% of the investors have their own
houses and 14.3% are in rented house. Figure – 4.9 also supports the above facts.
Figure – 4.9: House Ownership of the Investors

112
4.11 Type of Investors
There are two types’ of investors in share market of India. The hereditary
investors develop the investment habit as their character and some investors are induced
by the liberalization and transparency of share market investment. The following
Frequency Distribution Table 4.10 reveals the response of investors about their type
towards share market investment:
Table -4.10: Type of investors
Type Frequency Percentage Valid
Percentage
Cumulative
Percentage
Options
New
generation 428 84.4 84.4 84.4
Hereditary 79 15.6 15.6 100.0
Total 507 100.0 100.0
From the above table it is found that 84.4% of the respondents in Chennai are new
generation investors who know about the risk and return in equities, whereas, 15.6% of
them are hereditary investors. This implies that maximum number of investors is new
generation and induced by policies of liberalization and transparency in Indian capital
market.
4.12 Category of investors
The investors differ in their category based on their long term investment pattern
and daily trading approach in Indian share market. The following frequency distribution
Table 4.11 presents two different categories of investors

113
Table – 4.11: Category of Investors
Category Frequency Valid Percent Cumulative Percent
Both 365 72 72
Daily traders 64 12.6 84.6
Long term 78 15.4 100
Total 507 100
From the above table it is found that 72% of the respondents establish
themselves as both long term investors and daily traders and 12.6%of them operate
equity investment daily. It is also found that 15.4% of the investors have the habit of long
term investment in equities.
From the above analysis it is inferred that maximum number of respondents are
interested towards long term investment and daily trading of shares.
4.13 Number of Years of Dealing with Securities Markets
Investment Behaviour of the investor can be easily analyzed through the number
of years of dealing with securities markets. In fact, the experience makes a man perfect
by dealing in the securities markets so that the investor may come to know the changes in
securities markets. It is believed that wisdom comes only form ones own experience. In
this study four classification have been considered namely below 5 years, 6 – 10 years,
11 - 15 years and above 15 years. The following frequency distribution Table 4.12
expresses the distribution of the samples according to the number of years dealing with
securities markets.
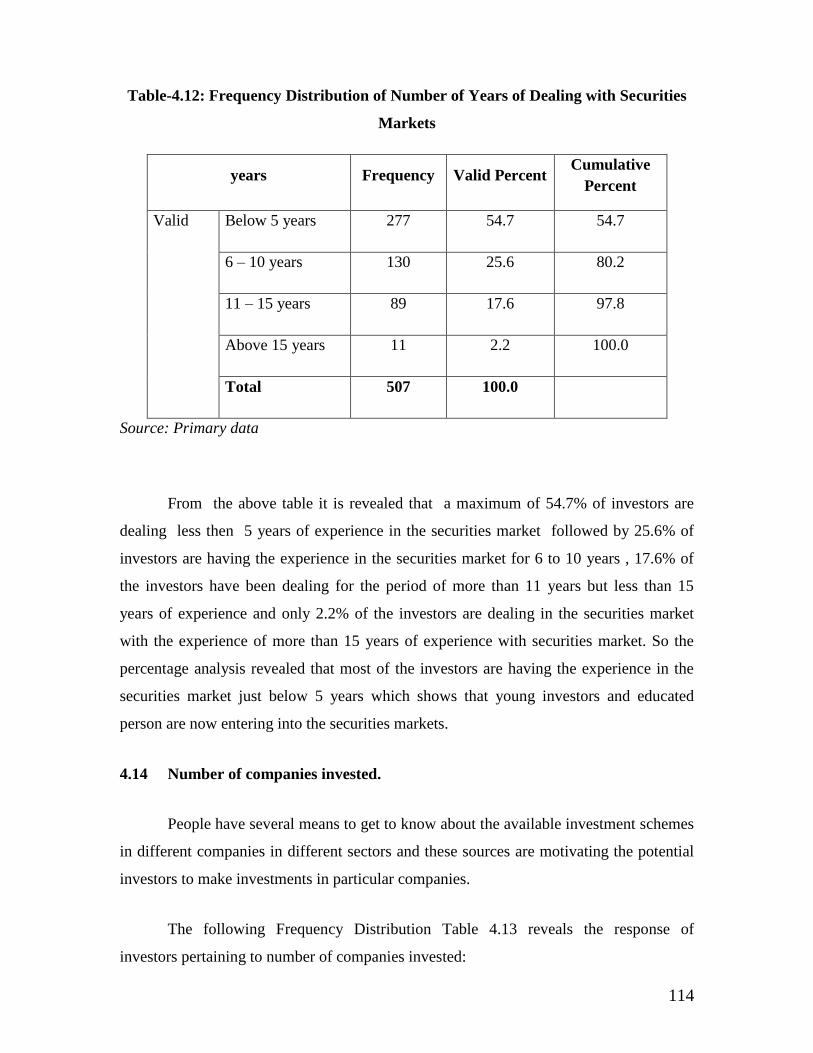
114
Table-4.12: Frequency Distribution of Number of Years of Dealing with Securities
Markets
years Frequency Valid Percent Cumulative
Percent
Valid
Below 5 years 277 54.7 54.7
6 – 10 years 130 25.6 80.2
11 – 15 years 89 17.6 97.8
Above 15 years 11 2.2 100.0
Total 507 100.0
Source: Primary data
From the above table it is revealed that a maximum of 54.7% of investors are
dealing less then 5 years of experience in the securities market followed by 25.6% of
investors are having the experience in the securities market for 6 to 10 years , 17.6% of
the investors have been dealing for the period of more than 11 years but less than 15
years of experience and only 2.2% of the investors are dealing in the securities market
with the experience of more than 15 years of experience with securities market. So the
percentage analysis revealed that most of the investors are having the experience in the
securities market just below 5 years which shows that young investors and educated
person are now entering into the securities markets.
4.14 Number of companies invested.
People have several means to get to know about the available investment schemes
in different companies in different sectors and these sources are motivating the potential
investors to make investments in particular companies.
The following Frequency Distribution Table 4.13 reveals the response of
investors pertaining to number of companies invested:

115
Table-4.13: Number of companies invested
Number of companies Frequency Percent Valid Percent Cumulative
Percent
Response Less than 10 376 74.1 74.1 74.1
More than 10 131 25.9 25.9 100.0
Total 507 100.0 100.0
From the above table it is found that 74.1% of the respondents in Chennai
invested in less than 10 companies and remaining 25.9% of them are attracted towards
more than 10 companies share market investment. This denotes that maximum number of
customers possess the updated knowledge about less than 10 companies for their
investment.
4.15 Size of Investment
The size of investment has an important bearing on the share market investment
of the individuals. The investment habits of the individuals will be highly influenced by
the size of investment in their hands. The following frequency distribution Table 4.14
expresses the distribution of the samples according Size of investment dealing with
securities markets.
Table-4.14 Distribution of Samples on the Basis of size of investment
Size of Investment Frequency Valid Percent Cumulative Percent
Less than Rs. 1,00,000 54 10.7 10.7
Rs. 1,00,000- Rs. 2,00,000 180 35.4 46.1

116
Rs. 2,00,000-Rs. 3,00,000 119 23.5 69.6
Rs. 3,00,000 and above 154 30.4 100.0
Total 507 100.0
From the above table it is found that 10.7 % of the respondents have an
investment of less than Rs. 1, 00,000. The investment level of 35.4 % of the respondents
is between Rs. 1, 00,000 and Rs. 2, 00,000. 23.5 % of them have an investment size
which ranges from Rs.2, 00,000 to Rs. 3, 00,000. The annual size of 30.4 % of the sample
ranges above Rs.3, 00,000. From the above analysis it is clear that large number of
respondents have an annual income ranging between Rs. 1, 00,000 and Rs.2, 00,000.
4.16 Source of Investment.
The investors enthusiastically invest their own funds or borrowed funds to derive
maximum return with in the short span of time.
The following Frequency Distribution Table 4.15 reveals the response of
investors about their source of funds to invest in equities:
Table-4.15 Source of Investment
Internet Banking Frequency Percent Valid
Percent
Cumulative
Percent
Response Own funds 489 90.6 90.6 90.6
Borrowed
funds 51 9.4 9.4 100.0
Total 540 100.0 100.0

117
From the above table it is found that 90.6% of the respondents in Chennai are able
to invest own funds in equities whereas, 9.4% of them borrow funds to invest in equities.
This indicates that maximum number of investors invest own funds to obtain better
returns.
4.17 Percentage of Savings Invested In Securities Markets
The Behaviour of investors can be easily analyzed through the percentage of
savings invested in the securities markets. In fact the surplus income induces the
investors to participate in the securities market in order to earn high returns. Propensity to
invest can be defined as the percentage of current income invested; it’s known that
investments are made out of surplus income. If the proportion of investment to income is
higher, then the propensity is said to be higher. In this study four classifications have
been considered namely below 25%, 26 – 50%, 51 – 75%, and 76 – 100 % of savings
invested in to the securities markets. The following frequency distribution Table 4.16
expresses the distribution of the sample according to the percentage of savings invested
in the securities markets.
Table-4.16 Frequency Distribution of Percentage of Savings Invested In Securities
Markets
Percentage of savings Frequency Valid
Percent
Cumulative
Percent
Valid
Below 25% 528 64.0 64.0
26% - 50% 188 22.8 86.8
51% – 75% 104 12.6 99.4
76% - 100% 5 0.6 100.0
Total 507 100.0
Source: Primary data

118
From the above table it is ascertained that a maximum of 64% of sample size are
investing their fund out of their savings below 25%, followed by 22.8% of sample size
are participating in the securities market out of their savings between 26 – 50%, on
sample size of 12.6% of the investors are investing their fund out of their saving between
51 – 75% and only 0.6% of the sample size are investing their saving between 76 –
100%. So the percentage analysis revealed that most of the investor are invest their
money out of their saving below 25% of the surplus money that they had.
4.18 Sources of Information
A successful investor in securities market must keep himself abreast of the latest
information, all the required information especially the one relating to specific companies
/ industries is not available at one place, so investors are able to get transparent
information about their dealings in securities market through various avenues like News
Paper, Journals and Magazines, Television Channels, Stock Brokers, Investment
Consultancy, Web sites and friends and Relatives. The following table 4.17 presents the
combined frequency distribution of various avenues of information.
Table 4.17 : Sources of Information
Sources Of Information No. Of Responded Percentage
News Papers
Television Channels
Stock Brokers
Journals & Magazines
Friends & Relatives
Investment Consultant
Web Sites
400
336
286
256
203
200
179
77.6
66.4
56.5
50.8
40
39.4
35.3
Source: Primary data

119
From the above combined frequency distribution table it is ascertained that a
maximum of 77.6% of investors get the information about the securities market through
news papers followed by 66.4% of investors get the information through television
media, 56.5% of investors receive the information through the stock brokers, 50.8% ,
40%, 39.4% and 35.3% of the investors obtain the information about the securities
through journals and magazines, friends and relatives, investment consultant and web
sites respectively. So the combined frequency distribution analysis revealed that a major
percentage of the investors are getting the information through news papers television
and stock brokers.
4.19 Criteria for Investments
Table 4.18: Criteria for Investments
Criteria Frequency Valid Percent Cumulative
Percent
Sector based 253 49.9 50.2
Financial performance 252 49.6 99.5
other 2 0.5 100
Total 507 100.0
Source: Primary data
From the above table 4.18 it is found that a maximum of 49.9 percent of investors
investing their investment after a careful analysis of company based on their sector in
which it belongs. Some 49.6 percent of investors are investing their money after
analyzing the financial performance of the companies and only 0.5 percent of investors
are considering some other factors like present market condition and new production
strategies. So it is highlighted from the above table that most of the investors are
channalised their investment after a careful analysis of the sector considered in which the
company belonging.

120
4.20 Member of investors’ forum
Investors’ awareness about criteria, forum, malpractices of intermediaries, and
mode of trading financial sector reforms are highlighted in the following discussion.
Table 4.19: Member of investors’ forum
Frequency Valid Percent Cumulative Percent
Yes 435 85.8 85.8
No 72 14.2 100.0
Total 507 100.0
Source: Primary data
From the above table 4.19 it is ascertained that a maximum of 85.8 percent of
investor are possessing experience in dealing their investment forums followed by 14.2
percent of investor doesn’t have any experience with the forum of investors So the
percentage analysis table reveals that most of the investors in securities market are having
much experience with forum of investors in dealing their investment affairs.
4.21 Awareness of Malpractice of Intermediaries
Table 4.20: Awareness of Malpractice of Intermediaries
Frequency Valid Percent Cumulative Percent
Yes 416 82.1 82.1
No 91 17.9 100.0
Total 507 100.0
Source: Primary data

121
From the above frequency table 4.20 it is ascertained that a maximum of 82.1
percent of investors in securities market are aware of the malpractice of intermediaries
followed by 17.9 percent of investors are not known the malpractices done by the
intermediaries. So the percentage analysis reveals that most of the investors in Indian
securities market are having the knowledge about the malpractices done by the
intermediaries like share brokers etc.
4.22 Mode of Trading
Table 4.21: Mode of trading
Frequency Valid Percent Cumulative Percent
Online 416 82.1 82.1
Off line 91 17.9 100.0
Total 507 100.0
Source: Primary data
From the above frequency table 4.21 it is ascertained that a maximum of 82.1
percent of investors in securities market are aware of the online trading and they buy and
sell their equities followed by 17.9 percent of investors deal with offline trading. So the
percentage analysis reveals that most of the investors in Indian securities market are
having the knowledge about the on line trading conveniently.
4.23 Awareness of Financial Sector Reforms in India
Table 4.22: Awareness of Financial Sector Reforms in India

122
Frequency Valid Percent Cumulative Percent
Yes 504 99.5 99.5
No 3 0.5 100.0
Total 507 100.0
Source: Primary data
From the above table 4.22 it is ascertained that a maximum of 99.5 percent of
investors in the Indian securities market are aware of the reforms made in the Indian
financial system, followed by only 0.5 percent of investors are don’t have the awareness
of financial sector reforms in India. So it is inferred by the percentage analysis that
majority of the investors in Indian securities market are aware of the financial sector
reforms made by the Government of India.
4.24 The Impact of Indices on investors
People have several means to get to know about the available investment schemes
and these sources are motivating the potential investors to make investments in a
particular investment avenue. Investment decision making is the process of identifying
various alternatives, evaluating each alternative and choosing the best alternative based
on the priorities, expectations and risk tolerance of the investor. Investors could make
decision on their own or can rely on the advice of another person. It is very important that
the investors do their home work whether they take independent decisions or rely on
others. In this study five classifications of indices have been considered namely sensex,
CNX nifty, CNX Nifty Junior, CNX midcap and CNX Midcap 200. The following
frequency distribution Table 4.23 expresses the distribution of the samples according to
the source of index about investment avenues.

123
Table 4.23: Frequency Distribution Of index
Influencers Frequency Valid
Percent
Cumulative
Percent
Valid
Sensex 217 42.9 42.9
CNX Nifty 47 9.2 52.1
CNX Nifty Junior 161 31.9 84.0
CNX Mid cap 62 12.1 96.1
CNX Midcap 200 20 3.9 100.0
Total 507 100.0
Source: Primary data
In can be seen that out of the sample size 42.9% of the investment decisions are
taken based on sensex index followed by 31.9% of the investors’ decisions are influenced
by the index of Nifty, 12.1% of the investors’ decisions are influenced by the index of
Nifty junior, 9.2% of the sample size of investors’ decisions are influenced by the index
of CNX Midcap and only 3.9% of the investors’ decisions are influenced by the CNX
madcap 200. So the percentage analysis revealed that most of the investor’s decisions are
influenced and taken by the observations of sensex index.
4.25 Association between Sources of Information and Preference of Industry
The non-parametric chi-square test is applied to find the association between
source of the information useful for the investors and their ranking preference of their
investment industry. Different sources of information stated in the questionnaire are
considered for the analysis.
a) News papers and Investment in Different Industries
The association between information through newspapers and different industry is
displayed in table – 4.24.

124
Table – 4.24: Chi-square Value for Sources of Information with
regard to Newspapers
Industry Chi-square value Sig Result
Banking 27.538 0.001 Association
Steel 27.654 0.001 Association
Cement 27.087 0.000 Association
IT 10.517 0.161 No association
Pharma 18.236 0.011 Association
Manufacturing 28.220 0.000 Association
Textile 16.320 0.022 Association
Automobile 29.118 0.000 Association
Source: Primary Data
From the above table, it is found that the information through Newspaper plays a
crucial role in identifying all the industries except IT industry.
b) Journals, Magazines and Investment in Different Industries
The association between information through Journals, magazines and different
industries is presented in table – 4.25.

125
Table – 4.25: Chi-square Value for Sources of Information with regard to Journals
and Magazines
Industry Chi-square value Sig Result
Banking 20.528 0.009 Association
Steel 10.748 0.150 No Association
Cement 12.742 0.079 No Association
IT 11.709 0.111 No association
Pharma 8.385 0.300 No Association
Manufacturing 24.560 0.001 Association
Textile 35.520 0.000 Association
Automobile 24.562 0.001 Association
Source: Primary Data
From the above table it is found that the information through Journals and
magazines is useful for investors to invest in banking, manufacturing, textile and
automobile industries.
c) TV channels and Investment in Different Industries
The association between information through TV channels and different industry
is presented in table – 4.26.
Table – 4.26: Chi-square Value for Sources of Information with
regard to TV
Industry Chi-square value Sig Result
Banking 31.851 0.001 Association
Steel 22.836 0.002 Association
Cement 20.851 0.004 Association

126
IT 10.659 0.154 No association
Pharma 8.391 0.299 No Association
Manufacturing 7.386 0.390 No Association
Textile 6.760 0.454 No Association
Automobile 12.086 0.098 No Association
Source: Primary Data
From the above table it is inferred that banking, steel and cement industry are
concentrated by the investors with the help of information through TV channels.
d) Stock Brokers and Investment in Different Industries
The association between information through stockbrokers and different industry
is presented in the table – 4.27.
Table – 4.27: Chi-square Value for Sources of Information with regard to Stock
Brokers
Industry Chi-square value Sig Result
Banking 35.153 0.000 Association
Steel 16.788 0.019 Association
Cement 31.592 0.000 Association
IT 36.211 0.000 Association
Pharma 21.012 0.004 Association
Manufacturing 46.884 0.000 Association
Textile 34.238 0.000 Association
Automobile 46.300 0.000 Association
Source: Primary Data

127
As far as the capital market investment and selection of industry is concerned, the
stockbrokers give more information to the investors in selecting the industry.
e) Investment Consultants and Investment in Different Industries
The association between information through investment consultants and different
industries is presented in the table – 4.28.
Table – 4.28: Chi-square Value for Sources of Information with regard to
Investment Consultant
Industry Chi-square value Sig Result
Banking 44.737 0.000 Association
Steel 27.701 0.003 Association
Cement 12.014 0.100 No Association
IT 34.831 0.000 Association
Pharma 12.318 0.091 No Association
Manufacturing 35.602 0.000 Association
Textile 14.770 0.039 Association
Automobile 38.860 0.000 Association
Source: Primary Data
From the above table, it is ascertained that the investment consultants
significantly guide the investors to invest in banking, steel, IT, manufacturing, textile and
automobile industries respectively.
f) On line Websites and Investment in Different Industries
The association between information through on line websites and different
industry is presented in table – 4.29.
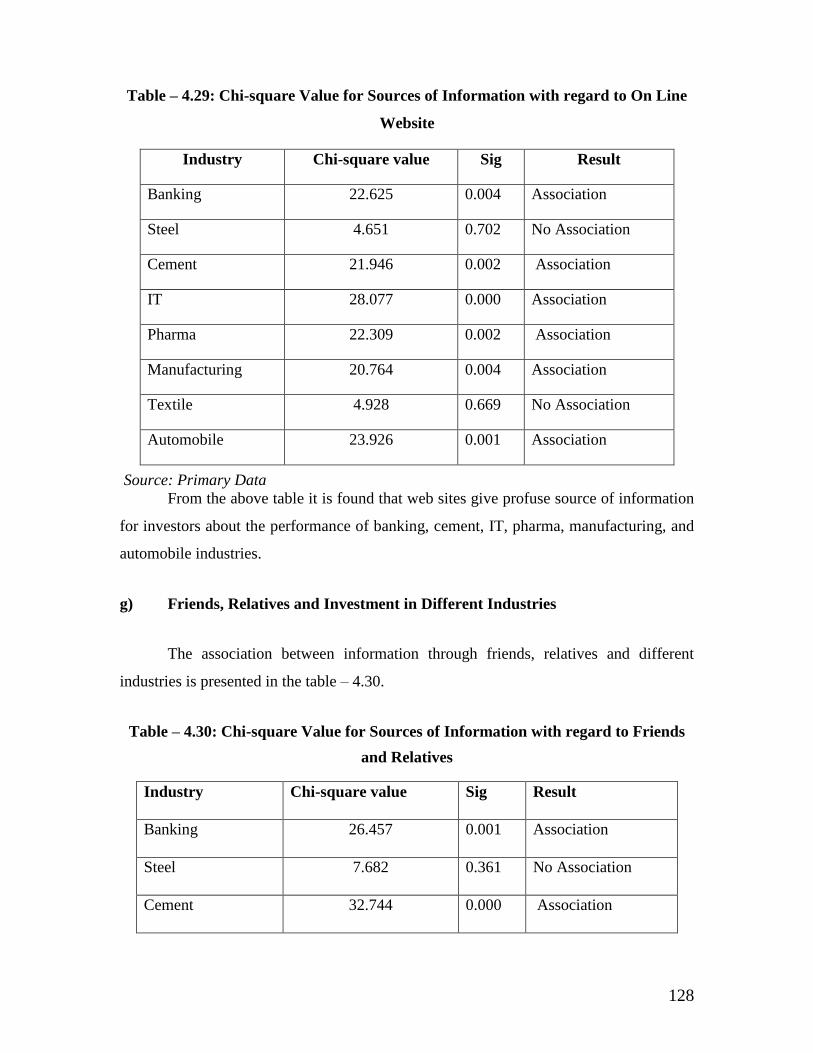
128
Table – 4.29: Chi-square Value for Sources of Information with regard to On Line
Website
Industry Chi-square value Sig Result
Banking 22.625 0.004 Association
Steel 4.651 0.702 No Association
Cement 21.946 0.002 Association
IT 28.077 0.000 Association
Pharma 22.309 0.002 Association
Manufacturing 20.764 0.004 Association
Textile 4.928 0.669 No Association
Automobile 23.926 0.001 Association
Source: Primary Data
From the above table it is found that web sites give profuse source of information
for investors about the performance of banking, cement, IT, pharma, manufacturing, and
automobile industries.
g) Friends, Relatives and Investment in Different Industries
The association between information through friends, relatives and different
industries is presented in the table – 4.30.
Table – 4.30: Chi-square Value for Sources of Information with regard to Friends
and Relatives
Industry Chi-square value Sig Result
Banking 26.457 0.001 Association
Steel 7.682 0.361 No Association
Cement 32.744 0.000 Association
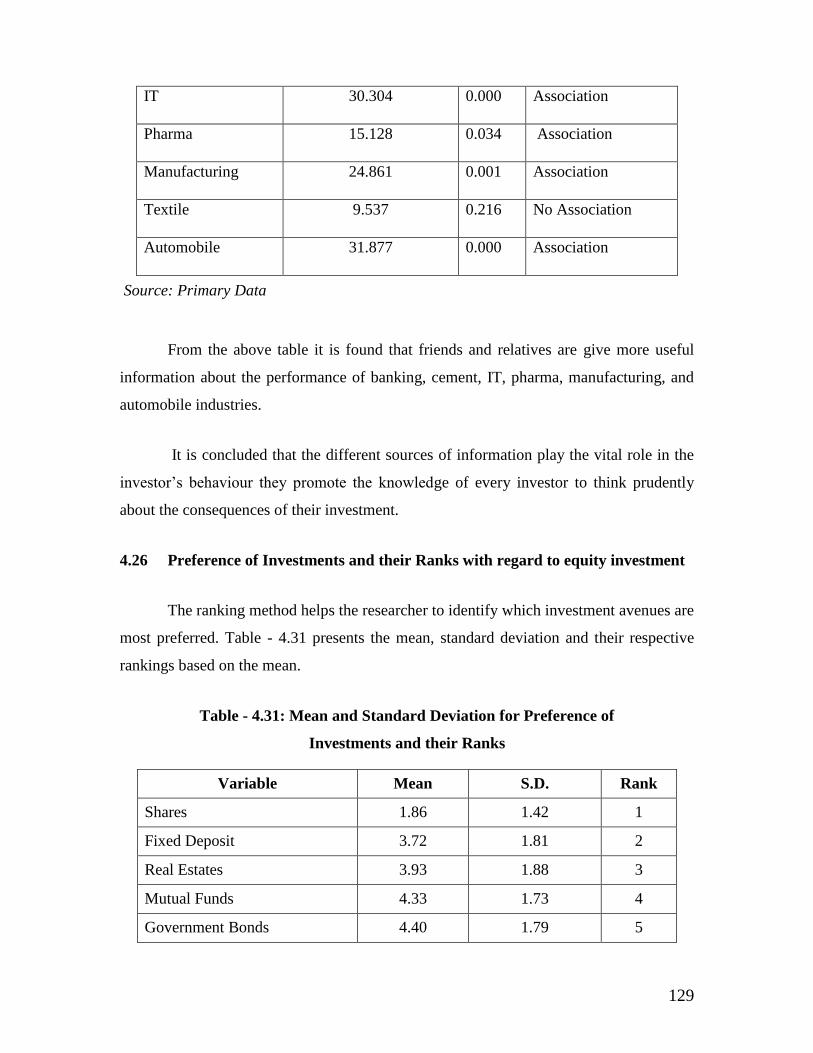
129
IT 30.304 0.000 Association
Pharma 15.128 0.034 Association
Manufacturing 24.861 0.001 Association
Textile 9.537 0.216 No Association
Automobile 31.877 0.000 Association
Source: Primary Data
From the above table it is found that friends and relatives are give more useful
information about the performance of banking, cement, IT, pharma, manufacturing, and
automobile industries.
It is concluded that the different sources of information play the vital role in the
investor’s behaviour they promote the knowledge of every investor to think prudently
about the consequences of their investment.
4.26 Preference of Investments and their Ranks with regard to equity investment
The ranking method helps the researcher to identify which investment avenues are
most preferred. Table - 4.31 presents the mean, standard deviation and their respective
rankings based on the mean.
Table - 4.31: Mean and Standard Deviation for Preference of
Investments and their Ranks
Variable Mean S.D. Rank
Shares 1.86 1.42 1
Fixed Deposit 3.72 1.81 2
Real Estates 3.93 1.88 3
Mutual Funds 4.33 1.73 4
Government Bonds 4.40 1.79 5

130
Gold 4.81 2.02 6
Debentures 4.99 1.62 7
Source: Primary Data
It is inferred from the above table that the mean is found according to the ranks
assigned to the variables by the investors. The most preferred investments are well
established and the investors strongly agree that the investment in capital market alone
gives more returns with minimum market risk. So they prefer share market as rank 1
followed by fixed deposit, real estate, mutual funds, government bonds, gold and
debentures in order. The first preference is due to appreciable returns besides the
maximum risk.
4.27 Ranking Analysis for Preference of Investments in Industry
The ranking analysis is executed for the different preference of investment in
industry such as banking industry, steel industry, cement industry, IT industry, Pharma
industry, manufacturing industries, textile industry and automobile industry and the
following preferences are arranged in order in table - 4.32.
Table - 4.32: Mean and Standard Deviation for Ranking of Industries
Variable Mean S.D. Rank
Banking Industry 3.17 2.20 1
IT Industry 3.45 2.43 2
Cement Industry 4.51 1.20 3
Pharma Industry 4.81 1.76 4
Automobile Industry 4.87 2.37 5
Manufacturing Industry 4.88 2.17 6
Textile Industry 6.02 2.07 7
Source: Primary Data
From the above table, it is found that according to the rank of preference, the
investors invest their money in the above mentioned industries. They invest their money
safely in banks in the form of deposits and give second preference to IT industry

131
followed by cement and pharma industry. This also shows that the investors concentrate
more on the safety of their investments in banks.
4.28 Reasons for Investments and their Ranks in equity Market.
Investments return, tax benefits and liquidity are preferred by investors for
different reasons. The result of the sample means, standard deviations and their ranks are
established below in table - 4.33.
Table - 4.33: Mean and Standard Deviation of Reasons for
Investments and their Ranks
Variable Mean S.D. Rank
Return 1.27 .550 1
Liquidity 2.18 .678 2
Tax benefits 2.54 .616 3
Source: Primary Data
From the above table, it is concluded that the investors give first preference to
better returns followed by liquidity and tax benefits. So, it can be concluded that all type
of investors demand more returns with no risk. So they prefer share market fabricated
with minimal risk.
4.29 Ranking Analysis for Investment Style in equity Market
Different style of investments like conservative, calculative, intuitive, impulsive,
risk taking are verified to identify the most popular investment style of the investors.
Table - 4.34 presents the mean and standard deviation and rank of preference of
investment style.
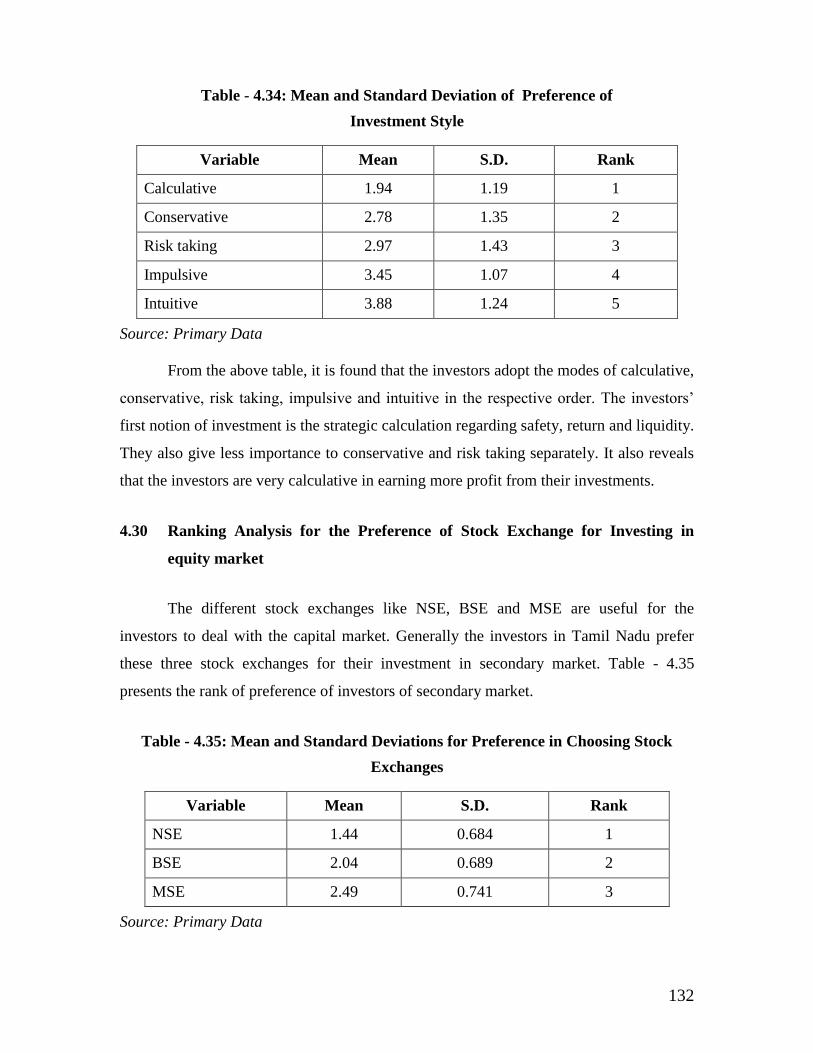
132
Table - 4.34: Mean and Standard Deviation of Preference of
Investment Style
Variable Mean S.D. Rank
Calculative 1.94 1.19 1
Conservative 2.78 1.35 2
Risk taking 2.97 1.43 3
Impulsive 3.45 1.07 4
Intuitive 3.88 1.24 5
Source: Primary Data
From the above table, it is found that the investors adopt the modes of calculative,
conservative, risk taking, impulsive and intuitive in the respective order. The investors’
first notion of investment is the strategic calculation regarding safety, return and liquidity.
They also give less importance to conservative and risk taking separately. It also reveals
that the investors are very calculative in earning more profit from their investments.
4.30 Ranking Analysis for the Preference of Stock Exchange for Investing in
equity market
The different stock exchanges like NSE, BSE and MSE are useful for the
investors to deal with the capital market. Generally the investors in Tamil Nadu prefer
these three stock exchanges for their investment in secondary market. Table - 4.35
presents the rank of preference of investors of secondary market.
Table - 4.35: Mean and Standard Deviations for Preference in Choosing Stock
Exchanges
Variable Mean S.D. Rank
NSE 1.44 0.684 1
BSE 2.04 0.689 2
MSE 2.49 0.741 3
Source: Primary Data

133
It is inferred from the above table that the investors investing in secondary
market, give their first preference to NSE followed by BSE and MSE respectively. The
NSE is the most popular among the investors of capital market.
Paired sample t-test is to identify the significant difference in the means among
the five factors of the risk and return in equity market. This tool is also useful to identify
the most popular factors of risk and return. The mean scores of each factor is presented in
the table - 4.36, which is useful to identify the popular factor among the investors
Table – 4.36: Paired Samples Statistics for the Factors of the
risk and return
Pair Factors Mean N Std.
Deviation
Std. Error
Mean
Pair 1
Shares 4.1576 507 .58216 .02028
Debentures 4.0445 507 .56689 .01975
Pair 2
Shares 4.1576 507 .58216 .02028
Mutual funds 4.1675 507 .58990 .02055
Pair 3
Shares 4.1576 507 .58216 .02028
Stock futures 4.2031 507 .58191 .02027
Pair 4
Shares 4.1576 507 .58216 .02028
Real estates 3.8706 507 .55730 .01941
Pair 5
Debentures 4.0445 507 .56689 .01975
Mutual funds 4.1675 507 .58990 .02055
Pair 6
Debentures 4.0445 507 .56689 .01975
Stock futures 4.2031 507 .58191 .02027
Pair 7
Debentures 4.0445 507 .56689 .01975
Real estates 3.8706 507 .55730 .01941
Pair 8
Mutual funds 4.1675 507 .58990 .02055
Stock futures 4.2031 507 .58191 .02027
Pair 9 Mutual funds 4.1675 507 .58990 .02055

134
Real estates 3.8706 507 .55730 .01941
Pair 10
Stock futures 4.2031 507 .58191 .02027
Real estates 3.8706 507 .55730 .01941
Source: Primary Data
The above table indicates the mean values of the factors of capital market
reforms. It ranges from the minimum mean value of 3.87 for real estates to the maximum
of 4.0 for stock futures.
The correlation table - 4.37 presents the relationship among all the factors which
are inter linked.
Table – 4.37: Paired Samples Correlations for the Factors of
the investment in equity Market
Pair Factors N Correlation Sig.
Pair 1 Shares & Debentures 507 .645 .000**
Pair 2 Shares & Mutual funds 507 .673 .000**
Pair 3 Shares & Stock futures 507 .550 .000**
Pair 4 Shares & Real estates 507 .467 .000**
Pair 5 Debentures & Mutual funds 507 .556 .000**
Pair 6 Debentures & Stock futures 507 .429 .000**
Pair 7 Debentures & Real estates 507 .533 .000**
Pair 8 Mutual funds & Stock
futures 507 .514 .000**
Pair 9 Mutual funds & Real estates 507 .449 .000**
Pair 10 Stock futures & Real estates 507 .323 .000**
Source: Primary Data; ** - Significant at 0.01 level
As observed from the above table, the five factors constitute the efficient capital
market reforms and the correlation co-efficient are highly significant. So, all reforms are

135
inter linked to accrue benefits to the investors. Paired sample t-test and their
consequences are established in table - 4.37.
Table – 4.38: Paired Samples Test Values for the Factors of the Latest
Reforms in Capital Market
Pair Factors t df Sig. (2-
tailed)
Pair 1 Shares - Debentures 6.707 506 .000**
Pair 2 Shares - Mutual funds -.598 506 .550
Pair 3 Shares - Stock futures -2.364 506 .018*
Pair 4 Shares - Real estates 14.000 506 .000**
Pair 5 Debentures - Mutual funds -6.471 506 .000**
Pair 6 Debentures - Stock futures -7.415 506 .000**
Pair 7 Debentures - Real estates 9.189 506 .000**
Pair 8 Mutual funds - Stock futures -1.769 506 .077
Pair 9 Mutual funds - Real estates 14.140 506 .000**
Pair 10 Stock futures - Real estates 14.390 506 .000**
Source: Primary Data; ** - Significant at 0.01 level; * Significant at 0.05 level
The paired sample statistical table – 4.38 clearly reveals that the investors are very
much attracted towards capital market with mean (4.20), followed by mutual funds (mean
= 4.17), shares (mean = 4.16), Debentures (mean = 4.04) and finally real estates (mean =
3.87). Though the means are different, paired sample t-test would check the statistically
significant differences among them. It is also found that shares and mutual funds are
equally treated (t = 0.598) by the investors for their risk and return. The mutual funds
and stock futures are also equally popular among the investors (t = 1.769) for both risk
and return. So it is inferred that the investors are very much attracted by capital market
after understanding the attractive financial sector reforms. The transparency about the
performance of the companies issuing the shares and continuous monitoring of central
government and the RBI raises the confidence among the investors besides the market

136
risk. It is also found that the investors are willing to invest their hard earned money to
have lucrative returns in the short span of time.
4.31 Rate of return
The investors expect different percentage of investment as their returns with
safety and security. Both the new companies and the existing ones can raise capital on the
new issue market. The prime function of the new issue market is to facilitate the transfer
of funds from the willing investors to the entrepreneurs setting up new corporate
enterprises or going in for expansion, diversification, growth or modernization. Besides,
helping corporate enterprises in securing their funds, the new issue market channelises
the savings of individuals and others into investment. In this study four classification
have been considered namely below 12%, 12-24%, 24-36%, and 36% and above as the
returns.
Table 4.39: Frequency Distribution of Percentage of expected return
Percentage of investment Frequency Valid
Percent
Cumulative
Percent
Valid
Below 12% 300 59.2 59.2
12% - 24% 82 16.2 75.4
24% – 36% 28 5.6 81.0
36% above 97 19.0 100.0
Total 507 100.0
Source: Primary data
From the above table 4.39 it is ascertained that a maximum of 59.2% of the
investors expect to get return below 12% of their investments followed by 19% of the

137
investors prefer to invest 36% and above of their investments, 16.2% of the investors
prefer only 24 – 36% of their investments to be returned only 5.6% of the investors prefer
to invest between 12 to 24% of their investments as returns. So the percentage analysis
revealed that most of the investors expect below 25% of their total investment from
equities market.
4.32 SUMMARY
In this chapter investment pattern, preferences, risk-return perceptions and
investment objectives of the retail equity investors have been identified.

138
CHAPTER – V
INVESTMENT SATISFACTION AND PORTFOLIO CHOICE
INTRODUCTION
This chapter examines the various factors that significantly influence equity
investors in the evaluation of equity share investments and makes an assessment of the
post – investment satisfaction of various classes of investors and investors’ confidence as
a whole. The study is based on various socio–economic and investment profile factors.
Investment evaluation and decision has become very crucial for any investor
today amidst an array of investment avenues with relative advantages and disadvantages.
Investment in equities is considered to be highly risky as compared to others, so investors
need to study several factors and information while making equity investment. Success of
equity issues is totally dependent on two parameters namely, post - investment
satisfaction and investors’ confidence. Post - investment satisfaction creates a lasting
impact on the investing habits of the investors and investors’ confidence decides the
quantum of investment in equities. The basic factor that generates investment satisfaction
and confidence is the high profitability prospects (rate of return) associated with equity
investments. If investors perceive high profitability prospects, they tend to invest; if not,
they look for other alternatives. The matching of the expected and derived rate of return
creates satisfaction and confidence in the minds of the investors. Hence the growth of
equity culture may be directly associated with the rate of return that builds investment
satisfaction and restores investors’ confidence.
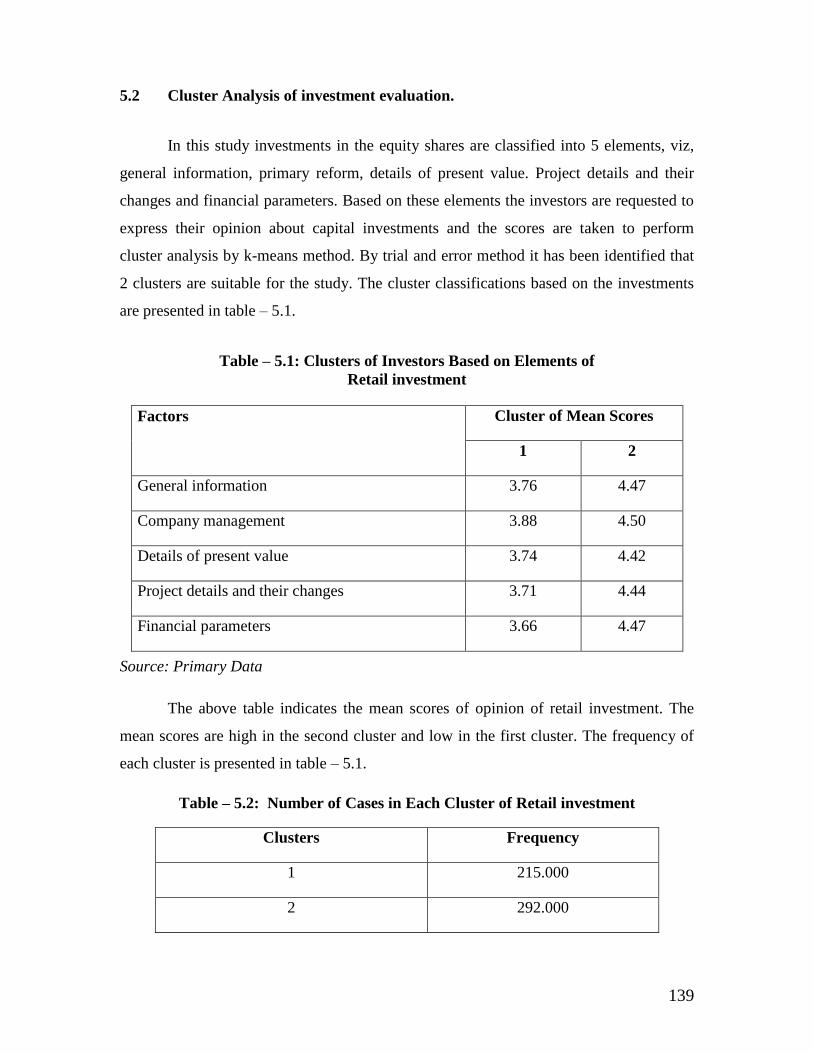
139
5.2 Cluster Analysis of investment evaluation.
In this study investments in the equity shares are classified into 5 elements, viz,
general information, primary reform, details of present value. Project details and their
changes and financial parameters. Based on these elements the investors are requested to
express their opinion about capital investments and the scores are taken to perform
cluster analysis by k-means method. By trial and error method it has been identified that
2 clusters are suitable for the study. The cluster classifications based on the investments
are presented in table – 5.1.
Table – 5.1: Clusters of Investors Based on Elements of
Retail investment
Factors
Cluster of Mean Scores
1 2
General information 3.76 4.47
Company management 3.88 4.50
Details of present value 3.74 4.42
Project details and their changes 3.71 4.44
Financial parameters 3.66 4.47
Source: Primary Data
The above table indicates the mean scores of opinion of retail investment. The
mean scores are high in the second cluster and low in the first cluster. The frequency of
each cluster is presented in table – 5.1.
Table – 5.2: Number of Cases in Each Cluster of Retail investment
Clusters Frequency
1 215.000
2 292.000

140
Valid 507.000
Missing .000
Source: Primary Data
The 507 samples of investors are classified into two clusters. The first cluster has
215 frequencies, in which all investors express the opinion that they moderately agree on
all the elements of capital investments. The second cluster has 292 frequencies, in which
the investors strongly agree with the investments in equity shares. No one expressed the
disagreements on retail investment. So, it is concluded that investors’ awareness ranges
from moderate to high.
5.3. Paired sample t-Test Carried out for the Elements of Retail investment
Paired t-test is exploited here to find the significant difference in the means of the
different elements of retail investment. The mean scores of the elements’ retail
investment for comparison are presented in table - 5.3.
Table - 5.3: Paired Samples Statistics for the Elements of
Retail investment
Pair Variables Mean N Std.
Deviation
Std. Error
Mean
Pair 1
General informations 4.1552 507 .48908 .01704
Company management 4.2266 507 .50512 .01760
Pair 2
General informations 4.1552 507 .48908 .01704
Details of present values 4.1210 507 .58644 .02043
Pair 3
General informations 4.1552 507 .48908 .01704
Project details 4.1141 507 .55972 .01950
Pair 4
General informations 4.1552 507 .48908 .01704
Financial parameters 4.1138 507 .54601 .01902
Pair 5
Company management 4.2266 507 .50512 .01760
Details of present values 4.1210 507 .58644 .02043
Pair 6
Company management 4.2266 507 .50512 .01760
project details 4.1141 507 .55972 .01950
Pair 7
Company management 4.2266 507 .50512 .01760
Financial parameters 4.1138 507 .54601 .01902
Pair 8 Details of present values 4.1210 507 .58644 .02043

141
Change and their project
details 4.1141 507 .55972 .01950
Pair 9
Details of present values 4.1210 507 .58644 .02043
Financial parameters 4.1138 507 .54601 .01902
Pair
10
Change and their project
details 4.1141 507 .55972 .01950
Financial parameters 4.1138 507 .54601 .01902
Source: Primary Data
The above table reveals that the mean scores of elements of retail investment
range from 4.11 to 4.23 with their respective standard errors. The relationships among the
elements of retail investment are presented in table - 5.3.
Table - 5.4: Paired Samples Correlations for the Elements of
Retail investment
Pair Variable N Correlat
ion Sig.
Pair 1 General informations & Company
management 507 .587 .000**
Pair 2 General informations & present value 507 .537 .000**
Pair 3 General informations & change and
their project details 507 .573 .000**
Pair 4 General informations & Financial
parameters 507 .657 .000**
Pair 5 & Details of present values 507 .431 .000**
Pair 6 Company management and their
project details 507 .479 .000**
Pair 7 Company management & financial
parameters 507 .528 .000**
Pair 8 Present values & changes and their
project details 507 .448 .000**
Pair 9 Secondary & financial parameters 507 .496 .000**
Pair 10 Project details and their changes
financial parameters 507 .519 .000**
Source: Primary Data; ** - Significant at 0.01 level

142
The above table indicates that all the correlation co-efficient are significant and
elements of retail investment are deeply related among themselves in the opinion of the
investors. The parametric paired sample significant t-test values are presented in table -
5.4.
Table - 5.5: Paired Samples Test Values for the Elements of
Retail investment
Pair Variables t df Sig. (2-
tailed)
Pair 1 General informations & Company
management -4.540 506 .000**
Pair 2 General informations & Details of
present values 1.874 506 .061
Pair 3 General informations & project
details and their changes 2.414 506 .016*
Pair 4 General informations & Financial
parameters 2.749 506 .006**
Pair 5 Company management & Details of
present values 5.176 506 .000**
Pair 6 Present values& project details and
their changes 5.922 506 .000**
Pair 7 Primary & financial parameters 6.325 506 .000**
Pair 8 present values & project details and
their changes .328 506 .743
Pair 9 Present values & financial parameters .359 506 .720
Pair
10
Project details and their changes &
Financial parameters .013 506 .990
Source: Primary Data; ** - Significant at 0.01 level; * Significant at 0.05 level
The paired sample t-test values clearly indicate that there is a significant
difference between general informations and Company management (t=4.54), and the
investors are confused with the company management (mean=4.23) and then the general
informations (mean=4.16). It is also found that there is no significant difference between
general informations and Details of present values (t = 1.874). This implies that the

143
investors have found equal awareness about general capital investments and Details of
present values.
It is revealed in the analysis that there is a significant difference between general
capital investments and change and their project details
(t=2.414) and the investors possess their ideas about general informations (mean=4.15)
and more changes and their project details. Similarly, it has been identified that the (mean
= 4.11) significant difference between general informations and financial parameters (t =
2.749). In this pair the investors are more aware of general informations (mean = 4.15)
than financial parameters (mean = 4.11).
The Company management are significantly different from Details of present
values (t = 5.176), because of change in project details (t = 5.922), and financial
parameters (t = 6.325). Among these urban investors are very much aware of company
management (mean = 4.22), than Details of present values (mean = 4.12), change of
project details (mean = 4.114) and financial parameters (mean = 4.113). It is also found
that the investors accept equally about the investments in secondary market, project
details and their changes, and financial parameters. It is concluded that all the
investments are important and they reflect the investments of equity shares.
5.4 Correlation Analysis Carried out for Number of Years Dealing with Equity
shares and Elements of Retail investment
Karl Pearson’s co-efficient of correlation is used to find out the relationship
between the variables i.e. the number of years dealing with equity shares and different
elements of retail investment.
The correlation co-efficient for number of years dealing with equity shares and
elements of capital investments is depicted in table - 5.6.

144
Table – 5.6: Correlation Matrix for Number of Year Dealing
Variables Co-efficient Sig.
General informations 0.048 0.165
Company management 0.006 0.854
Details of present values 0.018 0.608
Changes and their project details 0.005 0.888
Financial parameters 0.014 0.680
Source: Primary Data
The correlation table clearly shows that there is no significant relationship
between the number of years dealing with equity shares and investor’s opinion about
capital investments. This shows that the investors’ opinion on investments can not be
distinguished on their experiences with equity shares dealings. So the retail investments
are totally spread over all the investors equally independent of their number of years of
dealings.
5.5 Correlation Analysis carried out for Percentage of Savings in Share
Markets and Elements of Retail investment
The relationship between percentage of investment in share markets and different
elements of retail investment can be established by applying the statistical tool for Karl
Pearson’s co-efficient of correlation. The co-efficient values are presented in table - 5.7.

145
Table – 5.7: Correlation Co-efficient Table for Percentage of
Savings in Share Market
Variables Co-efficient Sig.
General informations -0.002 0.955
Company management -0.036 0.304
Details of present values 0.002 0.947
Changes and their project details 0.002 0.960
Financial parameters 0.026 0.449
Source: Primary Data
The correlation table clearly illustrates that the percentage of investment in share
market does not have any relationship with the investors’ opinion about the capital
investments. This also shows that the investors invest their money in share market to
accrue maximum benefits before and after investments. So the retail investment just
induces the investors to invest in share market, but the investors welcome any type of
investments of equity shares if it is really worthy of better returns with absolutely no risk.
5.6 Analysis of Variance Carried out for the Elements of Equity shares
Investments with respect to Preference of Investment
The different elements of retail investment are subject to the statistical treatment
using analysis of variance with regard to the grouping of variables preference of investors
for investment.
(a) Analysis of Variance for the Elements of Equity shares with Respect to
Investment in Shares
In this case the analysis of variance is carried out with respect to the investment in
shares and the following result is obtained from table - 5.8.
Table - 5.8: ANOVA for the Elements of Capital Investments with respect to
Investment in Shares

146
Variable Source Sum of
Squares df
Mean
Square F Sig.
General informations Between Groups 2.020 6 .337 1.411 .207
Within Groups 194.839 817 .238 -- --
Total 196.858 506 -- -- --
Company
management
Between Groups 2.514 6 .419 1.650 .131
Within Groups 207.474 817 .254 -- --
Total 209.988 506 -- -- --
Details of present
values
Between Groups 4.221 6 .704 2.061 .055
Within Groups 278.506 817 .341 -- --
Total 283.044 506 -- -- --
Changes and their
project details
Between Groups 3.108 6 .518 1.661 .128
Within Groups 254.729 817 .312 -- --
Total 257.837 506 -- -- --
Financial parameters Between Groups 3.375 6 .562 1.899 .078
Within Groups 241.988 817 .296 -- --
Total 245.362 506 -- -- --
Source: Primary Data
From the above table, it has been ascertained that the elements of retail
investment do not differ significantly with respect to investment in shares. So it is
inferred that all the investors are aware of retail investment immaterial by whether they
invest in shares or not. This also implies updated information to the investors could be a
more effective source of information.
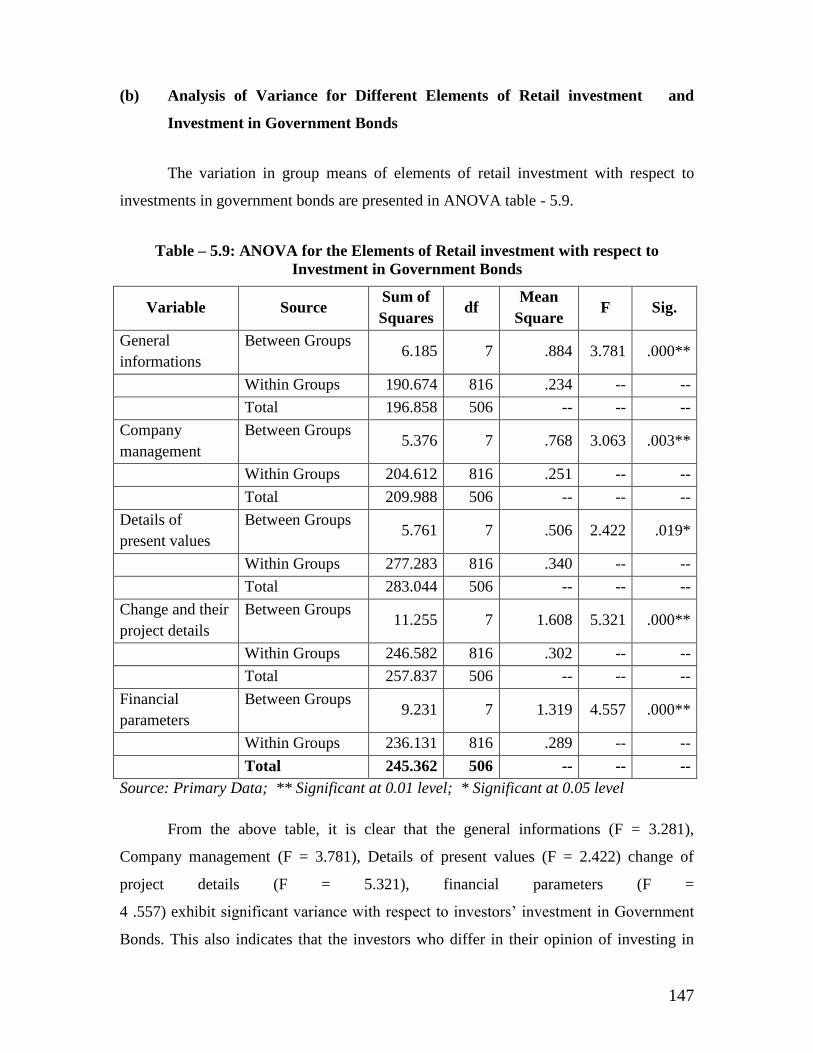
147
(b) Analysis of Variance for Different Elements of Retail investment and
Investment in Government Bonds
The variation in group means of elements of retail investment with respect to
investments in government bonds are presented in ANOVA table - 5.9.
Table – 5.9: ANOVA for the Elements of Retail investment with respect to
Investment in Government Bonds
Variable Source Sum of
Squares df
Mean
Square F Sig.
General
informations
Between Groups 6.185 7 .884 3.781 .000**
Within Groups 190.674 816 .234 -- --
Total 196.858 506 -- -- --
Company
management
Between Groups 5.376 7 .768 3.063 .003**
Within Groups 204.612 816 .251 -- --
Total 209.988 506 -- -- --
Details of
present values
Between Groups 5.761 7 .506 2.422 .019*
Within Groups 277.283 816 .340 -- --
Total 283.044 506 -- -- --
Change and their
project details
Between Groups 11.255 7 1.608 5.321 .000**
Within Groups 246.582 816 .302 -- --
Total 257.837 506 -- -- --
Financial
parameters
Between Groups 9.231 7 1.319 4.557 .000**
Within Groups 236.131 816 .289 -- --
Total 245.362 506 -- -- --
Source: Primary Data; ** Significant at 0.01 level; * Significant at 0.05 level
From the above table, it is clear that the general informations (F = 3.281),
Company management (F = 3.781), Details of present values (F = 2.422) change of
project details (F = 5.321), financial parameters (F =
4 .557) exhibit significant variance with respect to investors’ investment in Government
Bonds. This also indicates that the investors who differ in their opinion of investing in

148
Government Bonds also differ in identifying the investments in equity shares. The
investors are very much attracted by the primary and Details of present values, change of
project details investments and investments in financial parameters. So, the investors who
have turned their concentration towards government bonds investments are now rapidly
returning towards share market investments due to investments in their elements.
(c) Analysis of Variance for Different Elements of Retail investment
and Investment in Fixed Deposit
The variations in group means of elements of retail investment with respect to
investments in fixed deposits are presented in ANOVA table - 5.10.
Table - 5.10: ANOVA for the Elements of Retail investment with respect to
Investment in Fixed Deposits
Variable Source Sum of
Squares df
Mean
Square F Sig.
General
informations
Between Groups 1.587 7 .227 .947 .469
Within Groups 195.271 816 .239 -- --
Total 196.858 506 -- -- --
Company
management
Between Groups 1.514 7 .216 .846 .549
Within Groups 208.474 816 .255 -- --
Total 209.988 506 -- -- --
Details of
present values
Between Groups 1.436 7 .205 .595 .761
Within Groups 281.607 816 .345 -- --
Total 283.044 506 -- -- --
Changes and
their project
details
Between Groups 4.821 7 .689 2.221 .031*
Within Groups 253.015 816 .310 -- --
Total 257.837 506 -- --
Financial
parameters
Between Groups 2.507 7 .403 1.357 .220
Within Groups 242.538 816 .297 -- --
Total 245.362 506 -- --
Source: Primary Data; * Significant at 0.05 level
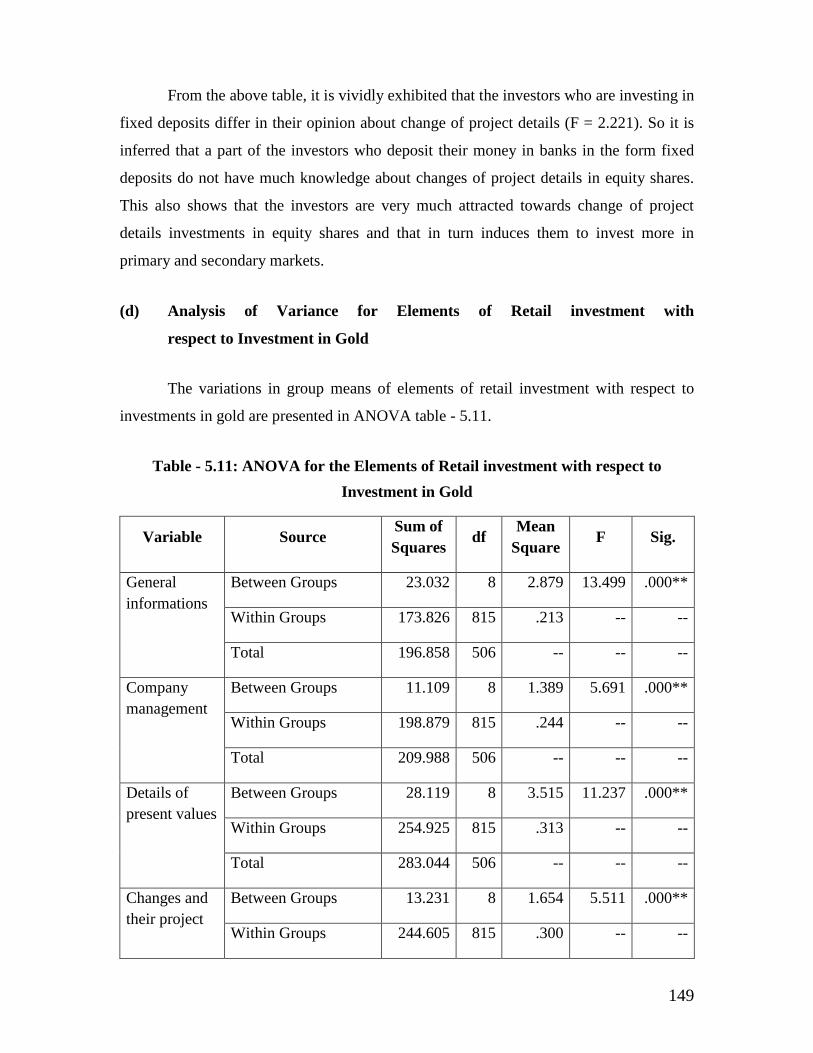
149
From the above table, it is vividly exhibited that the investors who are investing in
fixed deposits differ in their opinion about change of project details (F = 2.221). So it is
inferred that a part of the investors who deposit their money in banks in the form fixed
deposits do not have much knowledge about changes of project details in equity shares.
This also shows that the investors are very much attracted towards change of project
details investments in equity shares and that in turn induces them to invest more in
primary and secondary markets.
(d) Analysis of Variance for Elements of Retail investment with
respect to Investment in Gold
The variations in group means of elements of retail investment with respect to
investments in gold are presented in ANOVA table - 5.11.
Table - 5.11: ANOVA for the Elements of Retail investment with respect to
Investment in Gold
Variable Source Sum of
Squares df
Mean
Square F Sig.
General
informations
Between Groups 23.032 8 2.879 13.499 .000**
Within Groups 173.826 815 .213 -- --
Total 196.858 506 -- -- --
Company
management
Between Groups 11.109 8 1.389 5.691 .000**
Within Groups 198.879 815 .244 -- --
Total 209.988 506 -- -- --
Details of
present values
Between Groups 28.119 8 3.515 11.237 .000**
Within Groups 254.925 815 .313 -- --
Total 283.044 506 -- -- --
Changes and
their project
Between Groups 13.231 8 1.654 5.511 .000**
Within Groups 244.605 815 .300 -- --

150
details Total 257.837 506 -- -- --
Financial
parameters
Between Groups 14.472 8 1.809 6.386 .000**
Within Groups 230.890 815 .283 -- --
Total 245.362 506 -- -- --
Source: Primary Data; ** Significant at 0.01 level
From the above table, it is found that the investors can be distinguished on general
informations (F=13.499), Company management (F=5.691), Details of present values
(F=11.237), change of project details (F=5.511) and financial parameters (F=6.386) with
respect to investment in gold. This shows that when the investors invest their money in
gold they do not have more knowledge about retail investment. The investors who are
investing in gold are also turning their concentration towards equity shares due to the
tremendous developments in primary, details of present values, change of project details
and financial parameters.
(e) Analysis of Variance for Elements of Retail investment with respect to
Debentures
The variations in group means of elements of retail investment with respect to
investments in debentures are presented in ANOVA table - 5.12.
Table - 5.12: ANOVA for the Elements of Retail investment with respect to
Investment in Debentures
Variable Sources Sum of
Squares df
Mean
Square F Sig.
General
informations
Between Groups 6.238 7 .891 3.815 .000**
Within Groups 190.621 816 .234 -- --
Total 196.858 506 -- -- --
Company
management
Between Groups 3.464 7 .495 1.955 .058
Within Groups 206.524 816 .253 -- --
Total 209.988 506 -- -- --
Details of
present
Between Groups 7.373 7 1.053 3.118 .003**
Within Groups 275.670 816 .338 -- --

151
values Total 283.044 506 -- -- --
Changes and
their project
details
Between Groups 3.548 7 .507 1.626 .124
Within Groups 254.289 816 .312 -- --
Total 257.837 506 -- -- --
Financial
parameters
Between Groups 5.491 7 .784 2.668 .010**
Within Groups 239.872 816 .294 -- --
Total 245.362 506 -- -- --
Source: Primary Data; ** Significant at 0.01 level
From the above table it is inferred that the general informations (F=3.815), Details
of present values (F=3.118), and financial parameters (F=2.668) differ significantly with
respect to the investment in debentures. This shows that the investors’ option of investing
in debentures discriminate their ideas about general informations, Details of present
values and financial parameters. But they possess the same opinion of company
management and change of project details. The investors who concentrate on debentures
are very much attracted towards general informations, Details of present values and
financial parameters. They profoundly believe that retail investments of above elements
are really worthy of better returns.
(f) Analysis of Variance for the Elements of Retail investment and
Investment in Mutual Funds
The variations in group means of elements of retail investment with respect to
investments in mutual funds are presented in ANOVA table - 5.13.
Table - 5.13: ANOVA for the Elements of Retail investment with respect to
Investment in Mutual Funds
Variable Sources Sum of
Squares df
Mean
Square F Sig.
General
informations
Between
Groups 12.446 7 1.778 7.867 .000**
Within Groups 184.413 816 .226 -- --
Total 196.858 506 -- -- --
Company
management
Between
Groups 3.032 7 .433 1.708 .104
Within Groups 206.956 816 .254 -- --
Total 209.988 506 -- -- --

152
Details of
present
values
Between
Groups 5.325 7 .761 2.235 .030*
Within Groups 277.718 816 .340 -- --
Total 283.044 506 -- -- --
Project
details and
their Changes
Between
Groups 8.385 7 1.198 3.918 .000**
Within Groups 249.452 816 .306 -- --
Total 257.837 506 -- -- --
Financial
parameters
Between
Groups 11.364 7 1.623 5.661 .000**
Within Groups 233.998 816 .287 -- --
Total 245.362 506 -- -- --
Source: Primary Data; ** Significant at 0.01 level; * Significant at 0.05 level
From the above table, it is ascertained that the general informations (F=7.867),
Details of present values (F=2.235), change of project details (F=3.918), financial
parameters (F=5.661) significantly vary with respect to investors option of investing in
mutual funds, but in the case of Company management they express the same opinion. So
it is inferred that when the investors want to invest their money in mutual funds they
should possess thorough knowledge about capital investments. The investors of mutual
funds also possess a tendency to shift their investment pattern towards equity shares.
They feel that the same amount of risk is involved in mutual funds and equity shares but
in the case of returns the equity shares exceeds more than the mutual fund.
(g) Analysis of Variance for the Elements of Retail investment and
Investment in Real Estate
The variations in group means of elements of retail investment with respect to
investments in real estate are presented in ANOVA table - 5.14.
Table - 5.14 ANOVA for the Elements of Retail investment with respect to
Investment in Real Estate
Variable Sources Sum of
Squares df
Mean
Square F Sig.
General
informations
Between Groups 5.330 6 .888 3.790 .001**
Within Groups 191.528 817 .234 -- --

153
Total 196.858 506 -- -- --
Company
management
Between Groups 7.997 6 1.333 5.391 .000**
Within Groups 201.991 817 .247 -- --
Total 209.988 506 -- -- --
Details of
present values
Between Groups 15.669 6 2.611 7.980 .000**
Within Groups 267.375 817 .327 -- --
Total 283.044 506 -- -- --
Project details
and their
Changes
Between Groups 10.221 6 1.704 5.621 .000**
Within Groups 247.615 817 .303 -- --
Total 257.837 506 -- -- --
Financial
parameters
Between Groups 13.146 6 2.191 7.708 .000**
Within Groups 232.216 817 .284 -- --
Total 245.362 506 -- -- --
Source: Primary Data; ** Significant at 0.01 level; * Significant at 0.05 level
From the above table, it is found that the general informations (F=3.790),
Company management (F=5.391), Details of present values (F=7.980) change of project
details (F=5.621), financial parameters (F=7.708) differ significantly. This shows that
some of the investors who invest in real estate possess the ideas about capital investments
but others do not. Even though it is found that investing in real estate would give better
returns, the investors are shifting their concentration towards equity shares due to the
latest investments. They feel that they are able to get the same type of returns as that of
real estate within a short span of time.
5.7 Analysis of Variance for the Elements of Retail investment with
Respect to the Grouping of Variable Reasons for Investments
The elements of capital investments are subject to the analysis of variance
treatment to identify the significant variance among them with regard to various reasons
for investments return, tax benefits and liquidity.

154
(a) Analysis of Variance for the Elements of Retail investment with
respect to the Reason for Investment – return
The variation in group means of elements of retail investment with respect to
reason for investment namely, returns are presented in ANOVA table - 5.15.
Table - 5.15: ANOVA for the Elements of Retail investment with respect to
the Reason for Investment – Return
Variables Sources Sum of
Squares df
Mean
Square F Sig.
General
informations
Between Groups 1.482 2 .741 3.113 .045*
Within Groups 195.377 821 .238 -- --
Total 196.858 506 -- -- --
Company
management
Between Groups .330 2 .165 .646 .524
Within Groups 209.658 821 .255 -- --
Total 209.988 506 -- -- --
Details of
present values
Between Groups 2.554 2 1.277 3.737 .024*
Within Groups 280.490 821 .342 -- --
Total 283.044 506 -- -- --
Project details
and their
Changes
Between Groups 2.655 2 1.328 4.272 .014*
Within Groups 255.181 821 .311 -- --
Total 257.837 506 -- -- --
Financial
parameters
Between Groups .071 2 .036 .119 .888
Within Groups 245.291 821 .299 -- --
Total 245.362 506 -- -- --
Source: Primary Data; * Significant at 0.05 level
It is found from the above table that general informations (F=3.113), Details of
present values (F=3.737), and change of project details (F=4.272) differ significantly.

155
This shows that when the investors expect more returns, they differ in their views about
general informations, Details of present values and change of project details whereas they
have the same view on Company management and financial parameters.
(b) Analysis of Variance for the Elements of Retail investment with
Respect to the Reason for Investment - Liquidity
The variations in group means of elements of retail investment with respect to
reason for investment – liquidity are presented in ANOVA table - 5.16.
Table - 5.16: ANOVA for the Elements of Retail investment with respect to the
Reasons for Investment – Liquidity
Variable Sources Sum of
Squares df
Mean
Square F Sig.
General
informations
Between Groups 4.145 2 2.072 8.829 .000**
Within Groups 192.714 821 .235 -- --
Total 196.858 506 -- -- --
Company
management
Between Groups 1.812 2 .906 3.574 .028*
Within Groups 208.175 821 .254 -- --
Total 209.988 506 -- -- --
Details of
present
values
Between Groups 5.427 2 2.714 8.025 .000**
Within Groups 277.616 821 .338 -- --
Total 283.044 506 -- -- --
Project
details and
their
changes
Between Groups .506 2 .253 .807 .447
Within Groups 257.331 821 .313 -- --
Total 257.837 506 -- -- --
Financial
parameters
Between Groups 2.540 2 1.270 4.294 .014*
Within Groups 242.822 821 .296 -- --
Total 245.362 506 -- -- --
Source: Primary Data; ** Significant at 0.01 level; * Significant at 0.05 level
From the above table it is found that general informations (F=8.829), Company
management (F=3.574), Details of present values (F=8.025), and financial parameters
(F=4.294) differ significantly. So it is inferred that when the investors expect liquidity

156
from their investment some of them are highly aware of capital investments while some
others do not. But they possess the same view about changes of project details. The
investors identify liquidity due to investments in primary and secondary market and
financial parameters.
(c) Analysis of Variance for the Elements of Retail investment and
with respect to Reason for Investment – Tax Benefits
The variation in group means of elements of retail investment with respect to
reason for investment, namely tax benefits are presented in ANOVA table – 5.17.
Table - 5.17: ANOVA for the Elements of Retail investment with respect to the
Reason for Investment – Tax Benefits
Variable Sources Sum of
Squares df
Mean
Square F Sig.
General
informations
Between Groups .699 2 .349 1.463 .232
Within Groups 196.159 821 .239 -- --
Total 196.858 506 -- -- --
Company
management
Between Groups 1.957 2 .979 3.862 .021*
Within Groups 208.031 821 .253 -- --
Total 209.988 506 -- -- --
Details of
present values
Between Groups 1.708 2 .854 2.492 .083
Within Groups 281.336 821 .343 -- --
Total 283.044 506 -- -- --
Project details
and their
changes
Between Groups .503 2 .251 .802 .449
Within Groups 257.334 821 .313 -- --
Total 257.837 506 -- -- --
Financial
parameters
Between Groups 1.750 2 .875 2.949 .053
Within Groups 243.612 821 .297 -- --
Total 245.362 506 -- -- --
Source: Primary Data; * Significant at 0.05 level
The analysis of variance table clearly reveals that Company management
(F=3.862) differ significantly with respect to tax benefits. So it is concluded that the

157
investors who invest their money for tax benefits are well aware of general informations,
Details of present values, change of project details and financial parameters.
5.8 Analysis of Variance carried out for Different Elements of retail investments
and it’s Influence on Factors of Investment Decision
Analysis of variance is performed on the elements of capital investments, viz.,
general informations, company management, details of present values, change of project
details and financial parameters with respect to different influential factors of investment
decision – abridged prospectus, TV channels, consultant, and websites. This analysis
helps to identify which influential factor affects the investors in their investment decision
process in the light of retail investment.
(a) ANOVA for Elements of Retail investment with regard to
abridged prospectus
The variations in group means of elements of retail investment with respect to
decision of the abridged prospectus are presented in ANOVA table – 5.18.
Table - 5.18 ANOVA for the Elements of Retail investment with regard to the
Investment Decisions Influenced by abridged prospectus
Variables Sources Sum of
Squares df
Mean
Square F Sig.
General
informations
Between
Groups 2.533 5 .507 2.133 .060
Within Groups 194.325 818 .238 -- --
Total 196.858 506 -- -- --
Company
management
Between
Groups 6.621 5 1.324 5.326 .000**
Within Groups 203.367 818 .249 -- --
Total 209.988 506 -- -- --

158
Details of
present values
Between
Groups 1.275 5 .255 .740 .594
Within Groups 281.769 818 .344 -- --
Total 283.044 506 -- -- --
Project details
and their
changes
Between
Groups 3.686 5 .737 2.373 .038*
Within Groups 254.150 818 .311 -- --
Total 257.837 506 -- -- --
Financial
parameters
Between
Groups 2.519 5 .504 1.697 .133
Within Groups 242.843 818 .297 -- --
Total 245.362 506 -- -- --
Source: Primary Data; ** Significant at 0.01 level; * Significant at 0.05 level
From the table, it is ascertained that Company management (F=5.326), and
change of project details (F=2.373) differ significantly and other elements do not exhibit
any significance by variance. This forces to infer that when the abridged prospectus
influences the investment decision, the investors possess good awareness on general
informations, Details of present values and financial parameters. In the case of Company
management and change of project details the investors significantly vary in their
perception of capital investments.
(b) ANOVA for Different Elements of Retail investment with regard to
TV channels
The variations in group means of elements of retail investment with respect to TV
channels are presented in ANOVA table - 5.19.
Table - 5.19: ANOVA for the Elements of Retail investment with regard to the
Investment Decisions Influenced by TV channels
Variables Sources Sum of
Squares df
Mean
Square F Sig.
General
informations
Between Groups 3.546 5 .709 3.001 .011*
Within Groups 193.312 818 .236 -- --
Total 196.858 506 -- -- --

159
Company
management
Between Groups 5.487 5 1.097 4.390 .001**
Within Groups 204.501 818 .250 -- --
Total 209.988 506 -- -- --
Details of
present values
Between Groups 1.319 5 .264 .766 .574
Within Groups 281.725 818 .344 -- --
Total 283.044 506 -- -- --
Project details
and their
changes
Between Groups 7.516 5 1.503 4.913 .000**
Within Groups 250.320 818 .306 -- --
Total 257.837 506 -- -- --
Financial
parameters
Between Groups .953 5 .191 .638 .671
Within Groups 244.410 818 .299 -- --
Total 245.362 506 -- -- --
Source: Primary Data; ** Significant at 0.01 level; * Significant at 0.05 level
From the above table, it is seen that general informations (F=3.001), Company
management (F=4.390) and change of project details (F=4.913) differ significantly when
the investment decision is influenced by the project details. The investors who are
influenced by the TV channels have high awareness on Details of present values and
financial parameters.
(c) ANOVA for Different Elements of Retail investment with regard to
Consultants
The variations in group means of elements of retail investment with respect to
consultants are presented in ANOVA table - 5.20.
Table – 5.20: ANOVA for the Elements of Retail investment with regard to the
Investment Decisions Influenced by Consultant
Variables Sources Sum of
Squares df
Mean
Square F Sig.
General
informations
Between Groups 3.037 3 1.012 4.283 .005**
Within Groups 193.822 820 .236 -- --
Total 196.858 506 -- -- --
Company Between Groups 7.856 3 2.619 10.623 .000**

160
management
Within Groups 202.132 820 .247 -- --
Total 209.988 506 -- -- --
Details of
present
values
Between Groups 2.225 3 .742 2.166 .091
Within Groups 280.818 820 .342 -- --
Total 283.044 506 -- -- --
Project
details and
their changes
Between Groups 9.043 3 3.014 9.934 .000**
Within Groups 248.794 820 .303 -- --
Total 257.837 506 -- -- --
Financial
parameters
Between Groups 4.535 3 1.512 5.147 .002**
Within Groups 240.827 820 .294 -- --
Total 245.362 506 -- -- --
Source: Primary Data; ** Significant at 0.01 level; * Significant at 0.05 level
From the analysis of variance table, it is inferred that the investors who approach
consultants for investment in equity shares differ significantly in their knowledge about
general informations (F=4.283), Company management (F=10.623) change of project
details (F=9.934) and financial parameters (F=5.147). It is also found that in the case of
Details of present values all the investors are equally well aware and differ significantly
in other investments. So consultants are forcing them to have knowledge about details of
present values.
(d) ANOVA for Elements of Retail investment with regard to
web sites
The variations in group means of elements of retail investment with respect to
investment decision by web sites are presented in ANOVA table - 5.21.
Table - 5.21: ANOVA for the Elements of Retail investment with regard to the
Investment Decisions Influenced by websites
Variables Sources Sum of
Squares df
Mean
Square F Sig.
General
informations
Between Groups 3.264 2 1.632 6.921 .001**
Within Groups 193.594 821 .236 -- --

161
Total 196.858 506 -- -- --
Company
management
Between Groups 4.036 2 2.018 8.044 .000**
Within Groups 205.952 821 .251 -- --
Total 209.988 506 -- -- --
Details of
present
values
Between Groups .872 2 .436 1.268 .282
Within Groups 282.172 821 .344 -- --
Total 283.044 506 -- -- --
Project
details and
their changes
Between Groups 7.130 2 3.565 11.674 .000**
Within Groups 250.707 821 .305 -- --
Total 257.837 506 -- -- --
Financial
parameters
Between Groups 4.929 2 2.464 8.415 .000**
Within Groups 240.433 821 .293 -- --
Total 245.362 506 -- -- --
Source: Primary Data; ** Significant at 0.01 level; * Significant at 0.05 level
From the above table of analysis of variance, it is ascertained that the investors
consult their friends and relatives to invest in equity shares when they do not have much
knowledge about general informations (F=6.921), Company management (F=8.044),
change of project details (F=11.674), and financial parameters (F=8.415). In the case of
Details of present values, the investors cannot be distinguished in terms of their
awareness when their investment decision is influenced by web sites.
5.9 Association between Preference of Investment in Equity shares and
Clusters of Awareness on Retail investment
The preference of investment in equity shares viz. primary market and secondary
market and both are taken for the analysis. Some times the investors want to invest in
both the markets, so that option is also considered for the study. To find the association
between the above mentioned variables, the non-parametric chi-square test is applied.
Table - 5.22 presents the opinion of investment preference of investors in primary and
secondary markets.
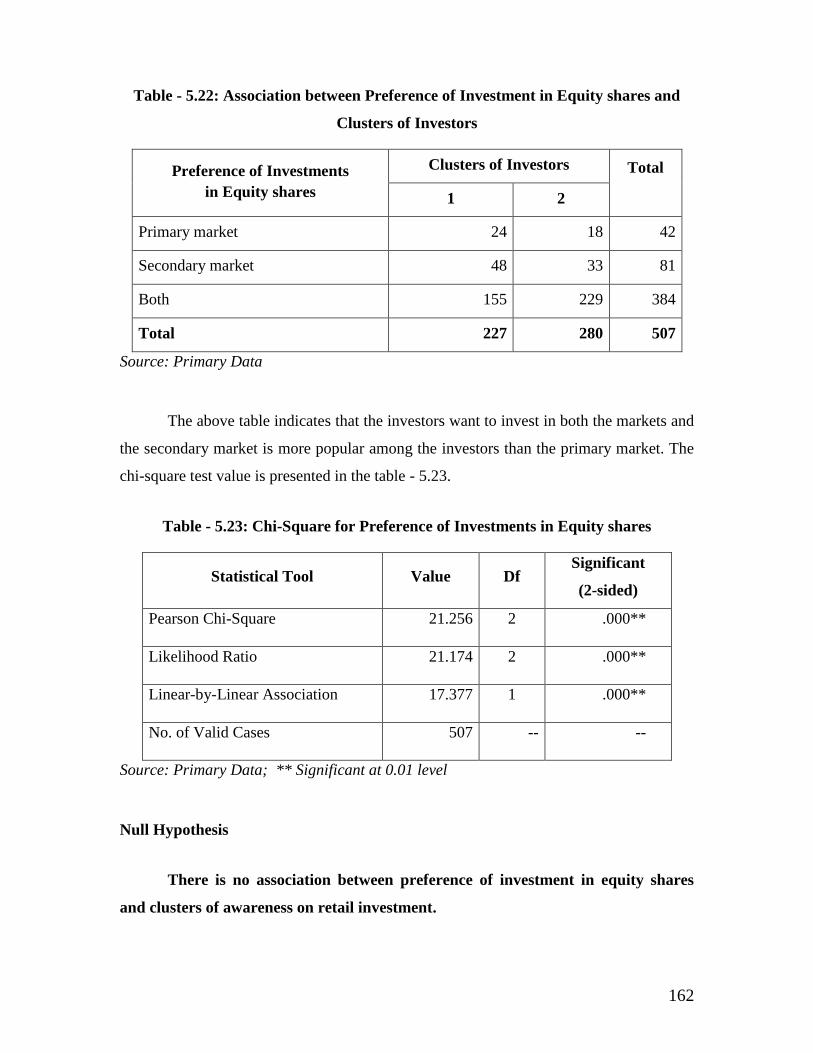
162
Table - 5.22: Association between Preference of Investment in Equity shares and
Clusters of Investors
Preference of Investments
in Equity shares
Clusters of Investors Total
1 2
Primary market 24 18 42
Secondary market 48 33 81
Both 155 229 384
Total 227 280 507
Source: Primary Data
The above table indicates that the investors want to invest in both the markets and
the secondary market is more popular among the investors than the primary market. The
chi-square test value is presented in the table - 5.23.
Table - 5.23: Chi-Square for Preference of Investments in Equity shares
Statistical Tool Value Df Significant
(2-sided)
Pearson Chi-Square 21.256 2 .000**
Likelihood Ratio 21.174 2 .000**
Linear-by-Linear Association 17.377 1 .000**
No. of Valid Cases 507 -- --
Source: Primary Data; ** Significant at 0.01 level
Null Hypothesis
There is no association between preference of investment in equity shares
and clusters of awareness on retail investment.

163
From the table of chi-square test it is found that the chi-square value as 21.256, p-
value = 0.000 for 2 degrees of freedom. So the null hypothesis is rejected at 5% level of
significance and it is concluded that there is a association between preference of
investment in equity shares and cluster of awareness on retail investment (i.e.) after
knowing the capital investments only the investors decide to invest in primary market and
secondary market.
5.10 General Linear Multivariate Model Analysis Carried out for Different
Elements of Retail investment and Percentage of Investment in Equity shares
In this analysis, the elements of capital investments are considered as independent
co-variants and the percentage of investment options in equity shares are considered as
dependent variables. This analysis of multivariate general linear model aims at finding
whether the percentage of investment in primary and secondary markets is affected by the
investments in equity shares. The individual impact of retail investment on percentage of
investment in primary and secondary markets is presented in table - 5.24.
Table - 5.24: Multivariate General Linear Model for
Percentage of Investments
Sources Dependent
Variables
Type III
Sum of
Squares
df Mean
Square F Sig.
Corrected
Model
Percent of
investment in
primary market
45473.254(a) 5 9094.651 12.403 .000**
Percent of
investment in
secondary market
21633.333(b) 5 4326.667 5.794 .000**
Intercept
Percent of
investment in
primary market
4028.996 1 4028.996 5.494 .019*
Percent of
investment in
secondary market
73508.593 1 73508.593 98.444 .000**
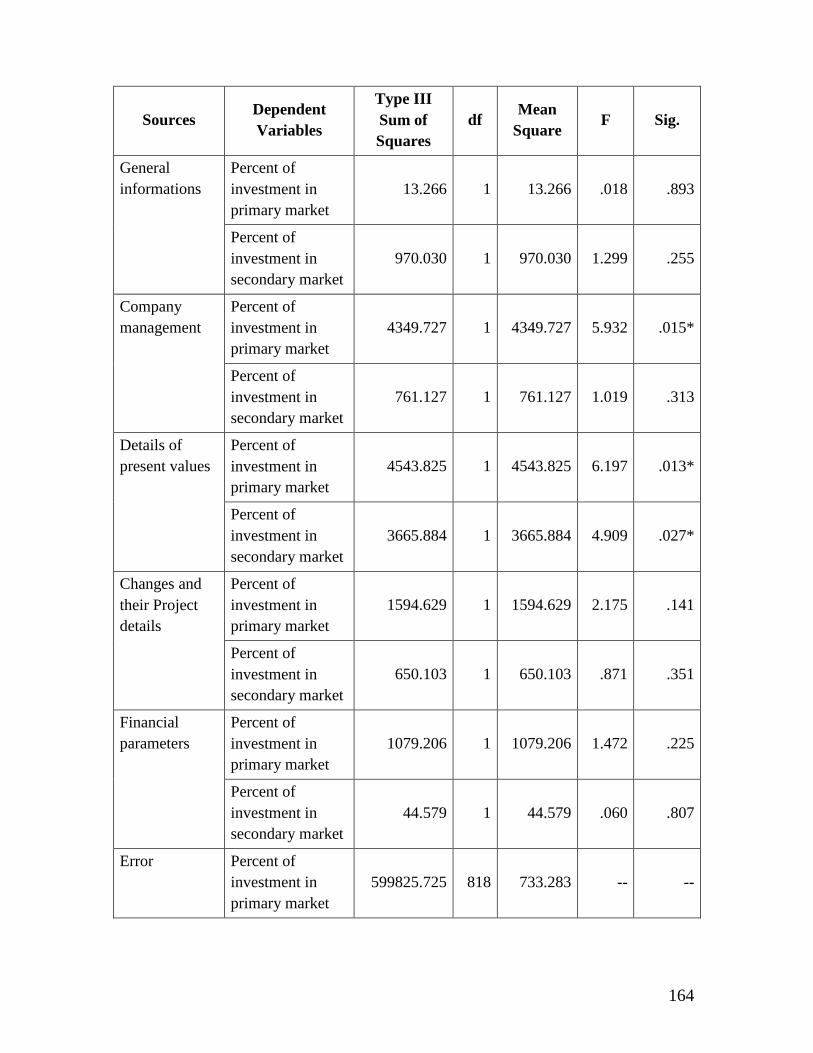
164
Sources Dependent
Variables
Type III
Sum of
Squares
df Mean
Square F Sig.
General
informations
Percent of
investment in
primary market
13.266 1 13.266 .018 .893
Percent of
investment in
secondary market
970.030 1 970.030 1.299 .255
Company
management
Percent of
investment in
primary market
4349.727 1 4349.727 5.932 .015*
Percent of
investment in
secondary market
761.127 1 761.127 1.019 .313
Details of
present values
Percent of
investment in
primary market
4543.825 1 4543.825 6.197 .013*
Percent of
investment in
secondary market
3665.884 1 3665.884 4.909 .027*
Changes and
their Project
details
Percent of
investment in
primary market
1594.629 1 1594.629 2.175 .141
Percent of
investment in
secondary market
650.103 1 650.103 .871 .351
Financial
parameters
Percent of
investment in
primary market
1079.206 1 1079.206 1.472 .225
Percent of
investment in
secondary market
44.579 1 44.579 .060 .807
Error
Percent of
investment in
primary market
599825.725 818 733.283 -- --

165
Sources Dependent
Variables
Type III
Sum of
Squares
df Mean
Square F Sig.
Percent of
investment in
secondary market
610801.714 818 746.701 -- --
Total
Percent of
investment in
primary market
2723037.000 507 -- -- --
Percent of
investment in
secondary market
2348437.000 507 -- -- --
Corrected
Total
Percent of
investment in
primary market
645298.979 506 -- -- --
Percent of
investment in
secondary market
632435.047 506 -- -- --
a. R Squared = .070 (Adjusted R Squared = .065); b. R Squared = .034 (Adjusted R
Squared = .028)
Source: Primary Data ** Significant at 0.01 level; * Significant at 0.05 level
It is inferred from the above table that the general informations in equity shares do
not have any impact on investors to invest certain percentage in primary and secondary
markets. Company management induce the investors to invest a considerable percentage
of their money in primary market (F=5.932). Details of present values make the investors
to invest a good percentage of money in both primary and secondary markets (F=4.909).
The change of project details and financial parameters do not have any impact on
investors to invest money in primary and secondary markets. So it is concluded that the
investments in primary and secondary markets make the investors to allot the required
percentage of investment.
5.11 Association between Criteria for Investment and Clusters of Awareness on
Retail investment

166
Non-parametric chi-square test is used to find the association between criteria for
investments in equity shares and clusters of awareness on equity shares. This helps to
know whether the retail investment highlight these criteria and pave the way to investors
to decide the prudential consequence of their investments. The opinion of the two groups
of equity shares investors about the criteria of investment is presented in table - 5.25.
Table - 5.25: Association Criteria for Investment and Clusters of wareness
Criteria for investments
Clusters of Investors Total
1 2
Sector to which the company belongs
to 89 169 258
Financial performance of the
company in recent past 138 111 249
Total 227 280 507
Source: Primary Data
The above table reveals that the criteria of investment are equally popular among
the investors. The chi-square test value is presented in table - 5.26.
Table - 5.26: Chi-Square Test and Criteria for Investments
Statistical Tools Value Df Asymp. Sig.
(2-sided)
Exact Sig.
(2-sided)
Exact Sig.
(1-sided)
Pearson Chi-
Square 36.381 1 .000** -- --
Continuity
Correction 35.538 1 .000** -- --
Likelihood Ratio 36.665 1 .000** -- --
Fisher's Exact -- -- -- .000** .000**

167
Test
Linear-by-Linear
Association 36.337 1 .000** -- --
No. of Valid
Cases 507 -- -- -- --
Source: Primary Data** Significant at 0.01 level
Null Hypothesis
There is no association between criteria for investments and clusters of
awareness of retail investment.
From the chi-square test it is found that the chi-square value is 36.381, when the
p-value=0.000. So the null hypothesis is rejected at 5% level of significance and it is
inferred that there is an association between criterion for investment and cluster of
awareness of capital investments. This also shows that the investors are all well aware
that the capital investments giving certain specific criteria for the investment procedure.
5.12 Cluster Analysis carried out for Identifying the Extent of Awareness of
Investors on equity investment
Cluster analysis is a statistical tool brought upon the problems of identifying the
heterogeneous groups prevailing in the sample. These heterogeneous groups are
homogeneous within them. Cluster analysis is carried out with the newly obtained 5
factors of capital market reforms in factor analysis. The formations of new three clusters
are shown in table - 5.27.
Table – 5.27: Final Cluster Centres for Awareness of the equity investment
Factor Clusters and Mean Scores
1 2 3
Investment objectives 2.92 3.73 4.48
Investment satisfaction 3.23 3.57 4.35
Facility satisfaction 2.80 3.84 4.45

168
Innovative measures 2.97 3.96 4.44
Problems 3.18 3.51 4.11
Source: Primary Data
The above table revealed the emergence of three groups of investors based on
their awareness of capital market reforms. The frequency distribution of each cluster is
presented in table - 5.28.
Table – 5.28: Frequency of Clusters for Awareness of the Latest
Reforms in Capital Market
Cluster Frequency
1 31.000
2 156.000
3 320.000
Valid 507.000
Missing .000
Source: Primary Data
The cluster analysis transparently reveals that the samples are classified into 3
heterogeneous groups with respect to investment objectives, investment satisfaction,
facility satisfaction, innovative measures and problems. The first cluster investors do not
possess more awareness with the equity market and the frequency of this cluster is 31.
The second cluster has the frequency of 156 and they are moderately aware of the equity
investment in capital market. The third clusters with the frequency of 320 are highly
aware of the equity investment. So the respondents in the study are classified into 3
groups based on their awareness on the equity investment pattern. This group
classification will be further used in the analysis. So it is concluded that the investors of
capital market are distributed into three types on the basis of investment pattern
prevailing in India

169
5.13 Analysis of Variance carried out for Different Elements of Equity shares
Investments and Preference of Investment in Industries
This analysis is aimed at ascertaining whether the capital investments awareness
varies with respect to different industries in equity shares. It also helps to find out the
relationship between retail investment and the most popular industries attracting the
investors.
(a) ANOVA for Different Elements of Retail investment with regard to
Preference of Investment in Banking Sector
The variations in group means of elements of retail investment with respect to
investment in banking sector are presented in ANOVA table - 5.29.
Table - 5.29: ANOVA for the Elements of Retail investment with regard to
Preference of Investment in Banking Sector
Variables Sources Sum of
Squares df
Mean
Square F Sig.
General
informations
Between
Groups 6.391 8 .799 3.418 .001**
Within
Groups 190.467 815 .234 -- --
Total 196.858 506 -- -- --
Company
management
Between
Groups 5.492 8 .687 2.736 .006**
Within
Groups 204.495 815 .251 -- --
Total 209.988 506 -- -- --
Details of
present values
Between
Groups 11.778 8 1.472 4.423 .000**
Within
Groups 271.265 815 .333 -- --

170
Total 283.044 506 -- -- --
Project details
and their
changes
Between
Groups 10.415 8 1.302 4.288 .000**
Within
Groups 247.422 815 .304 -- --
Total 257.837 506 -- -- --
Financial
parameters
Between
Groups 10.390 8 1.299 4.505 .000**
Within
Groups 234.972 815 .288 -- --
Total 245.362 506 -- -- --
Source: Primary Data; ** Significant at 0.01 level; * Significant at 0.05 level
From the above table, it is found that general informations (F=3.418), Company
management (F=2.736), Details of present values (F=4.423) change of project details
(F=4.288) and financial parameters (F=4.505) vary significantly with respect to
investment in banking sector. This shows that the capital investments have affected the
investment in the banking sector. More number of investors are enthusiastic in venturing
into equity shares.
(b) Analysis of Variance for Different Elements of Retail investment
with regard to Preference of Investment in FMCG Sector
The variations in group means of elements of retail investment with respect to
investment in FMCG sector are presented in ANOVA table - 5.30.
Table - 5.30: ANOVA for the Elements of Retail investment with regard to
Preference of Investment in FMCG Sector
Variables Sources Sum of
Squares df
Mean
Square F Sig.
General
informations
Between
Groups 2.969 7 .424 1.785 .087
Within Groups 193.889 816 .238 -- --
Total 196.858 506 -- -- --

171
Company
management
Between
Groups 4.861 7 .694 2.763 .008**
Within Groups 205.127 816 .251 -- --
Total 209.988 506 -- -- --
Details of
present
values
Between
Groups 3.528 7 .504 1.471 .174
Within Groups 279.516 816 .343 -- --
Total 283.044 506 -- -- --
Project
details and
their
changes
Between
Groups 1.021 7 .146 .463 .861
Within Groups 256.816 816 .315 -- --
Total 257.837 506 -- -- --
Financial
parameters
Between
Groups 2.818 7 .403 1.354 .222
Within Groups 242.544 816 .297 -- --
Total 245.362 506 -- -- --
Source: Primary Data** Significant at 0.01 level
From the above table, it becomes vividly clear that company management
(F=2.763) have affected the investments in FMCG sector. Other capital investments do
not make any impact on FMCG sector. So it shows that the investors have the knowledge
about company management before they invest in FMCG industries.
(c) Analysis of Variance for Different Elements of Retail investment
with regard to Preference of Investment in Pharma Sector
The variations in group means of elements of retail investment with respect to
investment in pharma sector are presented in ANOVA table - 5.31
Table - 5.31: ANOVA for the Elements of Retail investment with regard to
Preference of Investment in Pharma Sector
Variable Sources
Sum of
Square
s
df Mean
Square F Sig.
General
informations
Between
Groups 9.231 7 1.319 5.735 .000**

172
Within Groups 187.628 816 .230 -- --
Total 196.858 506 -- -- --
Company
management
Between
Groups 6.755 7 .965 3.874 .000**
Within Groups 203.233 816 .249 -- --
Total 209.988 506 -- -- --
Details of
present
values
Between
Groups 8.561 7 1.223 3.636 .001**
Within Groups 274.483 816 .336 -- --
Total 283.044 506 -- -- --
Project
details and
their changes
Between
Groups 10.396 7 1.485 4.898 .000**
Within Groups 247.441 816 .303 -- --
Total 257.837 506 -- -- --
Financial
parameters
Between
Groups 7.563 7 1.080 3.708 .001**
Within Groups 237.799 816 .291 -- --
Total 245.362 506 -- -- --
Source: Primary Data; ** Significant at 0.01 level
A cursory glance at the above table reveals that the general informations
(F=5.735), company management (F=3.874), details of present values (F=3.636), change
of project details (F=4.898), and financial parameters (F=3.708) very much affect the
investment in pharma sector. So it is inferred that the investors investing more in pharma
sector due to retail investment.
(d) Analysis of Variance for Elements of Retail investment with
regard to Preference of Investment in PSE Industries
The variations in group means of elements of retail investment with respect to
investment in PSE sector are presented in ANOVA table – 5.32.

173
Table - 5.32: ANOVA for the Elements of Retail investment with regard to
Preference of Investment in PSE Sector
Variable Sources Sum of
Squares df
Mean
Square F Sig.
General
informations
Between Groups 12.048 7 1.721 7.599 .000**
Within Groups 184.367 814 .226 -- --
Total 196.416 821 -- -- --
Company
management
Between Groups 10.982 7 1.569 6.456 .000**
Within Groups 197.806 814 .243 -- --
Total 208.789 821 -- -- --
Details of
present values
Between Groups 12.781 7 1.826 5.507 .000**
Within Groups 269.884 814 .332 -- --
Total 282.665 821 -- -- --
Project details
and their
changes
Between Groups 9.750 7 1.393 4.611 .000**
Within Groups 245.889 814 .302 -- --
Total 255.639 821 -- -- --
Financial
parameters
Between Groups 13.657 7 1.951 6.859 .000**
Within Groups 231.541 814 .284 -- --
Total 245.198 821 -- -- --
Source: Primary Data** Significant at 0.01 level
It is inferred from the above table that general informations (F=7.599), company
management (F=6.456), details of present values (F=5.507), change of project details
(F=4.611), and financial parameters (F=6.859) affecting the investment in PSE sector.
Hence it is clear that the capital investments direct the investors to invest more in PSE
sector.
(e) Analysis of Variance for Elements of Retail investment with regard
to Preference of Investment in MNC Sector
The variations in group means of elements of retail investment with respect to
investment in MNC sector are presented in ANOVA table - 5.33.

174
Table - 5.33: ANOVA for the Elements of Retail investment with regard to
Preference of Investment in MNC Sector
Variable Sources Sum of
Squares df
Mean
Square F Sig.
General
informations
Between Groups 6.557 7 .937 4.016 .000**
Within Groups 190.302 816 .233 -- --
Total 196.858 506 -- -- --
Company
management
Between Groups 9.248 7 1.321 5.371 .000**
Within Groups 200.739 816 .246 -- --
Total 209.988 506 -- -- --
Details of
present values
Between Groups 7.999 7 1.143 3.390 .001**
Within Groups 275.045 816 .337 -- --
Total 283.044 506 -- -- --
Project details
and their
changes
Between Groups 13.871 7 1.982 6.628 .000**
Within Groups 243.965 816 .299 -- --
Total 257.837 506 -- -- --
Financial
parameters
Between Groups 12.474 7 1.782 6.244 .000**
Within Groups 232.889 816 .285 -- --
Total 245.362 506 -- -- --
Source: Primary Data; ** Significant at 0.01 level
It is deduced from the above table that the general informations (F=4.016),
Company management (F=5.371), Details of present values (F=3.390), change of project
details (F=6.628), and financial parameters (F=6.244) affect the investment in MNC
sector. The degrees of awareness and knowledge about retail investment have enabled the
investors for making meaningful investment decisions in MNC sector.
(f) Analysis of Variance for Different Elements of Retail investment with regard
to Preference of Investment in IT Sector
The variations in group means of elements of retail investment with respect to
investment in IT sector are presented in ANOVA table - 5.34.

175
Table - 5.34: ANOVA for the Elements of Retail investment with regard to
Preference of Investment in IT Sector
Variable Sources Sum of
Squares df
Mean
Square F Sig.
General
informations
Between Groups 4.792 7 .685 2.908 .005**
Within Groups 192.067 816 .235 -- --
Total 196.858 506 -- -- --
Company
management
Between Groups 3.949 7 .564 2.234 .030*
Within Groups 206.039 816 .252 -- --
Total 209.988 506 -- -- --
Details of
present values
Between Groups 13.207 7 1.887 5.705 .000**
Within Groups 269.837 816 .331 -- --
Total 283.044 506 -- -- --
Project details
and their
changes
Between Groups 3.452 7 .493 1.582 .137
Within Groups 254.384 816 .312 -- --
Total 257.837 506 -- -- --
Financial
parameters
Between Groups 5.187 7 .741 2.518 .014*
Within Groups 240.175 816 .294 -- --
Total 245.362 506 -- -- --
Source: Primary Data; ** Significant at 0.01 level; * Significant at 0.05 level
From the above table, it is inferred that general informations (F=2.908), Company
management (F=2.234), Details of present values (F=5.705), and financial parameters
have affected the investment in IT sector. The above mentioned investments induce the
investors to invest in IT sector. It is also found that change of project details does not
have any impact on investment in IT sector.

176
(g) Analysis of Variance for Different Elements of Retail investment
with regard to Preference of Investment in Manufacturing Sector
The variations in group means of elements of retail investment with respect to
investment in manufacturing sector are presented in ANOVA table - 5.35.
Table - 5.35: ANOVA for the Elements of Retail investment with regard to
Preference of Investment in Manufacturing Sector
Variable Sources Sum of
Squares df
Mean
Square F Sig.
General
informations
Between Groups 4.620 7 .660 2.801 .007**
Within Groups 192.239 816 .236 -- --
Total 196.858 506 -- -- --
Company
management
Between Groups 1.680 7 .240 .940 .474
Within Groups 208.307 816 .255 -- --
Total 209.988 506 -- -- --
Details of
present values
Between Groups 3.116 7 .445 1.297 .248
Within Groups 279.928 816 .343 -- --
Total 283.044 506 -- -- --
Project details
and their
changes
Between Groups 3.869 7 .553 1.776 .089
Within Groups 253.968 816 .311 -- --
Total 257.837 506 -- -- --
Financial
parameters
Between Groups 3.894 7 .556 1.880 .070
Within Groups 241.468 816 .296 -- --
Total 245.362 506 -- -- --
Source: Primary Data; ** Significant at 0.01 level
The above table is useful in deciding that the general informations (F=2.801)
affect the investment in manufacturing sector. This also shows that the investors find a
scope for their investment in manufacturing sector after general capital investments.
Other investments do not have any role to play with manufacturing sector.
(h) Analysis of Variance for Different Elements of Retail investment
with regard to Preference of Investment in Service Sector

177
The variations in group means of elements of retail investment with respect to
investment in service sector are presented in ANOVA table - 5.36.
Table - 5.36: ANOVA for the Elements of Retail investment with regard to
Preference of Investment in Service Sector
Variable Sources Sum of
Squares df
Mean
Square F Sig.
General
informations
Between Groups 6.951 7 .993 4.267 .000**
Within Groups 189.907 816 .233 -- --
Total 196.858 506 -- -- --
Company
management
Between Groups 8.400 7 1.200 4.857 .000**
Within Groups 201.588 816 .247 -- --
Total 209.988 506 -- -- --
Details of
present values
Between Groups 13.342 7 1.906 5.767 .000**
Within Groups 269.702 816 .331 -- --
Total 283.044 506 -- -- --
Project details
and their
changes
Between Groups 6.085 7 .869 2.818 .007**
Within Groups 251.752 816 .309 -- --
Total 257.837 506 -- -- --
Financial
parameters
Between Groups 8.541 7 1.220 4.204 .000**
Within Groups 236.821 816 .290 -- --
Total 245.362 506 -- -- --
Source: Primary Data; ** Significant at 0.01 level
The above table clearly reveals that the general informations (F=4.267), Company
management (F=4.857), Details of present values (F=5.767), change of project details
(F=2.818) and financial parameters (F=4.204) affect the investment in service sector.
This also shows that the investors are drifting towards service sector after capital
investments.
5.14 Association between Investment in Equity shares with Higher Risk and
Clusters of Awareness on Retail investment
This analysis is aimed at verifying the retail investment made every procedure of
investment transparent and free from risks. The non- parametric chi-square test is applied

178
to achieve this objective. The opinion of the group of investors about the risk involved in
retail investment is presented in the table - 5.37.
Table - 5.37: Investment in Equity shares is Higher Risk and Clusters of Awareness
on Retail investment
Investment in
Equity shares is
Higher Risk
Clusters of
Investors Total
1 2
Yes 318 415 733
No 48 43 91
Total 366 458 824
Source: Primary Data
The above table indicates that a maximum number of both the clusters confessed
that the risk in equity shares investments is higher. The chi-square test value is presented
in the table - 5.38.
Table – 5.38: Chi-square Test Statistics for Investment in
Equity shares is Higher Risk
Statistical Tool Value df Asymp. Sig.
(2-sided)
Exact Sig.
(2-sided)
Exact Sig.
(1-sided)
Pearson Chi-
Square 2.875 1 .090 -- --
Continuity
Correction 2.508 1 .113 -- --
Likelihood Ratio 2.856 1 .091 -- --
Fisher's Exact
Test -- -- -- .094 .057
Linear-by-Linear
Association 2.872 1 .090 -- --
N of Valid Cases 507 -- -- --
Source: Primary Data

179
Null Hypothesis
There is no association between extension of risk in equity shares and
awareness on retail investment.
From the chi-square table, it is inferred that the null hypothesis is accepted at 5%
level of significance and that there is no association between extensive of risk and
awareness of retail investment. It clearly shows that the investors are very much aware of
risks involved in investing in equity shares, because it depends upon the performance of
firms upon which their money is invested.
5.15 Analysis of Variance Carried out for Different Elements of Capital
Market Investments with regard to Preference of Stock Exchange
The analysis of variance is applied on the elements of capital investments with
respect to different stock exchanges like NSE, BSE and MSE. This would help the
researcher to analyse the impact of retail investment in different stock exchanges.
(a) Analysis of Variance for Elements of Retail investment with regard to
Preference of sensex
The variations in group means of elements of retail investment with respect to
preference to sensex are presented in ANOVA table - 5.39.
Table - 5.39: ANOVA for the Elements of Retail investment with regard to
Preference of stock exchanges - sensex
Variable Sources Sum of
Squares df
Mean
Square F Sig.
General
informations
Between Groups 14.540 3 4.847 21.798 .000**
Within Groups 182.319 820 .222 -- --
Total 196.858 506 -- -- --
Company
management
Between Groups 8.217 3 2.739 11.131 .000**
Within Groups 201.771 820 .246 -- --
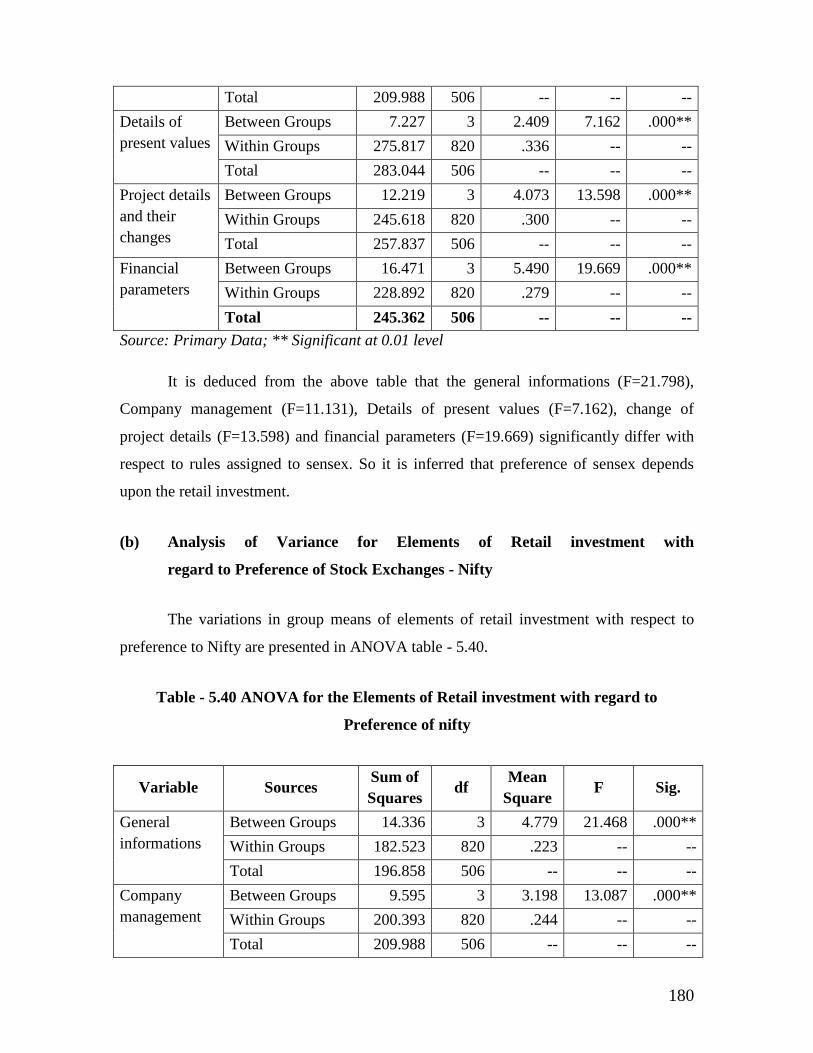
180
Total 209.988 506 -- -- --
Details of
present values
Between Groups 7.227 3 2.409 7.162 .000**
Within Groups 275.817 820 .336 -- --
Total 283.044 506 -- -- --
Project details
and their
changes
Between Groups 12.219 3 4.073 13.598 .000**
Within Groups 245.618 820 .300 -- --
Total 257.837 506 -- -- --
Financial
parameters
Between Groups 16.471 3 5.490 19.669 .000**
Within Groups 228.892 820 .279 -- --
Total 245.362 506 -- -- --
Source: Primary Data; ** Significant at 0.01 level
It is deduced from the above table that the general informations (F=21.798),
Company management (F=11.131), Details of present values (F=7.162), change of
project details (F=13.598) and financial parameters (F=19.669) significantly differ with
respect to rules assigned to sensex. So it is inferred that preference of sensex depends
upon the retail investment.
(b) Analysis of Variance for Elements of Retail investment with
regard to Preference of Stock Exchanges - Nifty
The variations in group means of elements of retail investment with respect to
preference to Nifty are presented in ANOVA table - 5.40.
Table - 5.40 ANOVA for the Elements of Retail investment with regard to
Preference of nifty
Variable Sources Sum of
Squares df
Mean
Square F Sig.
General
informations
Between Groups 14.336 3 4.779 21.468 .000**
Within Groups 182.523 820 .223 -- --
Total 196.858 506 -- -- --
Company
management
Between Groups 9.595 3 3.198 13.087 .000**
Within Groups 200.393 820 .244 -- --
Total 209.988 506 -- -- --

181
Details of
present values
Between Groups 11.305 3 3.768 11.371 .000**
Within Groups 271.739 820 .331 -- --
Total 283.044 506 -- -- --
Project details
and their
changes
Between Groups 7.793 3 2.598 8.519 .000**
Within Groups 250.043 820 .305 -- --
Total 257.837 506 -- -- --
Financial
parameters
Between Groups 15.892 3 5.297 18.930 .000**
Within Groups 229.470 820 .280 -- --
Total 245.362 506 -- -- --
Source: Primary Data; ** Significant at 0.01 level
From the above table it is noted that the general informations (F=21.468),
Company management (F=13.087), Details of present values (F=11.371), change of
project details (F=8.519) and financial parameters (F=18.930) differ significantly with
respect to Nifty. This shows that the investors are able to set information about Nifty
through the investments of elements of equity shares.
(c) Analysis of Variance for Elements of Retail investment with regard
to Preference of Stock Exchanges - MSE
The variations in group means of elements of retail investment with respect to
preference to CNX 100 are presented in ANOVA table - 5.41
Table - 5.41: ANOVA for the Elements of Capital Investments with regard to
Preference of CNX 100
Variable Sources Sum of
Squares df
Mean
Square F Sig.
General
informations
Between Groups 2.279 3 .760 3.201 .023*
Within Groups 194.580 820 .237 -- --
Total 196.858 506 -- -- --
Company
management
Between Groups .560 3 .187 .731 .534
Within Groups 209.428 820 .255 -- --
Total 209.988 506 -- -- --
Details of
present values
Between Groups 2.344 3 .781 2.282 .078
Within Groups 280.700 820 .342 -- --
Total 283.044 506 -- -- --

182
Project details
and their
changes
Between Groups 2.659 3 .886 2.848 .037*
Within Groups 255.178 820 .311 -- --
Total 257.837 506 -- -- --
Financial
parameters
Between Groups 1.586 3 .529 1.779 .150
Within Groups 243.776 820 .297 -- --
Total 245.362 506 -- -- --
Source: Primary Data; * Significant at 0.05 level
It is ascertained from the above table that general informations (F=3.201), and
change of project details (F=2.848) induce the investors to give preference to CNX 100.
Other elements of equity shares do not have any impact on investors to choose CNX 100.
So the investors in CNX 100possess the same opinion about primary and secondary
markets as well as financial parameters.
5.16 Association between Reason for Preference Given to Stock
Exchange Dealings and Clusters of Awareness of retail investment
The non-parametric chi-square test is applied between the two variables-reason
for stock exchange dealings and clusters of awareness of capital investments. This also
helps to ascertain the retail investment and its relationship with different stock exchanges
in India. The different groups of investors possess different opinion about reasons for
stock exchange dealings and they are presented in table - 5.42
Table - 5.42: Reason for Preference Given to Stock Exchange Dealing and Clusters
of Awareness on Retail investment
Reasons for Preference given to Stock
Exchange Dealing
Clusters of Investors Total
1 2
Reputation 120 213 333
No. of stocks listed 130 93 223
Transparency and updated information 116 152 268
Total 366 458 824
Source: Primary Data

183
The above table clearly expresses that the reputation of stock exchanges plays a
very important role for the groups of investors followed by number of stocks and
transparency in the proceedings. Table - 5.43 presents the chi-square test value.
Table - 5.43: Chi-Square Tests for Reason of
Preference Given to Stock Exchanges
Statistical Tool Value df Asymp. Sig. (2-
sided)
Pearson Chi-Square 27.146 2 .000**
Likelihood Ratio 27.163 2 .000**
Linear-by-Linear Association 3.821 1 .051
No. of Valid Cases 507 -- --
Source: Primary Data; ** Significant at 0.01 level
Null Hypothesis
There is no association between reasons for preference of stock exchange and
clusters of awareness of equity shares.
From the table of chi-square it is found that the null hypothesis is rejected,
because the chi-square value = 27.146 and p = 0.000. It is further inferred that different
reasons for preference of stock exchange arise due to retail investment.
5.17 Association between Experience in Dealing with Shares in Electronic Mode
(demat) and Elements of Retail investment
A non-parametric test is brought upon the problem of finding the association
between retail investment and investors dealing with electronic shares. The different
groups of investors possess different opinions about dealing with electronic shares are
presented in table - 5.44.

184
Table - 5.44: Experience in Dealing Shares through Electronic Mode (demat) and
Cluster of Awareness on Elements of Retail investment
Experience in Dealing Shares through
Electronic Mode (demat)
Clusters of Investors Total
1 2
Yes 313 394 707
No 53 64 117
Total 366 458 824
Source: Primary Data
The above table indicates the maximum number investors are dealing shares
through electronic mode and only a few investors do not deal shares through this mode.
Table - 5.45 indicates the chi-square test value.
Table - 5.45: Chi-Square Tests Statistic Showing Experience in Dealing Shares with
Electronic Mode (demat) and Cluster of Awareness on Elements of Retail
investment
Statistical Tool Value df Asymp. Sig.
(2-sided)
Exact Sig.
(2-sided)
Exact Sig.
(1-sided)
Pearson Chi-
Square .043 1 .836 -- --
Continuity of
Correction .011 1 .915 -- --
Likelihood Ratio .043 1 .836 -- --
Fisher's Exact
Test -- -- -- .841 .456
Linear-by-Linear
Association .043 1 .836 -- --
No. of Valid
Cases 507 -- -- -- --
Source: Primary Data

185
Null Hypothesis
There is no association between dealing with electronic shares and elements
of retail investment.
From the table of chi-square test it is found that the chi-square value = 0.043 and
p-value = -0.836. So the null hypothesis is accepted and it is concluded that there is no
association between dealing with electronic shares and elements of retail investment. This
shows that the investors feel that the electronic share is a convenient mode because it is
introduced in equity shares by electronic advertisement in the scientific world and the
economic use of the investments in equity shares which do not have any role to play with
technological electronic advancement.
5.18 Sources of Information Available to Know about Retail investment
The different sources of information are useful to the investors to obtain updated
information about retail investment and stock exchanges. They are able to set the
information through newspapers, journals, TV channels, stock brokers, consultants,
websites and friends and relatives. This analysis is aimed at finding which the most
useful source of information is. The percentage of different sources information useful
for the investors to deal with equity shares is presented in table - 5.46.
Table – 5.46 Percentage of Different Sources of Information to Know About
Retail investment
Source
Preferred by
investors
(in %)
Not preferred by
investors
(in %)
1. News papers 77.5 22.5

186
2. Journals 56.6 43.4
3. TV channels 66.5 33.5
4. Stock brokers 50.8 49.2
5. Consultants 39.4 60.6
6. Websites 35.3 64.7
7.company announcements 40.0 60.0
Source: Primary Data
The above table clearly ascertains that the investors are able to get proper
information through newspapers (77.5%). So it is the most preferred source of
information to know about retail investment. The next source of information is TV
through which 66.5% investors are able to get more information about equity shares,
followed by journals 56.6% and stock brokers 50.8%. Other sources are not that much
significant. So it is concluded that the investors are able to get perfect information about
equity shares through newspapers and TV.
5.19 Paired sample t-Test Carried out for the Factors of the equity investment.
Paired sample t-test is to identify the significant difference in the means among
the five factors of the equity investment. This tool is also useful to identify the most
popular factors of capital market reforms. The mean scores of each factor is presented in
the table - 5.47, which is useful to identify the popular factor among the investors
Table – 5.47: Paired Samples Statistics for the Factors of the equity investment
Pair Factors Mean N Std.
Deviation
Std. Error
Mean
Pair 1
Investment
objectives 4.1576 824 .58216 .02028
Investment
satisfaction 4.0445 824 .56689 .01975
Pair 2
Investment
objectives 4.1576 824 .58216 .02028
Facility satisfaction 4.1675 824 .58990 .02055
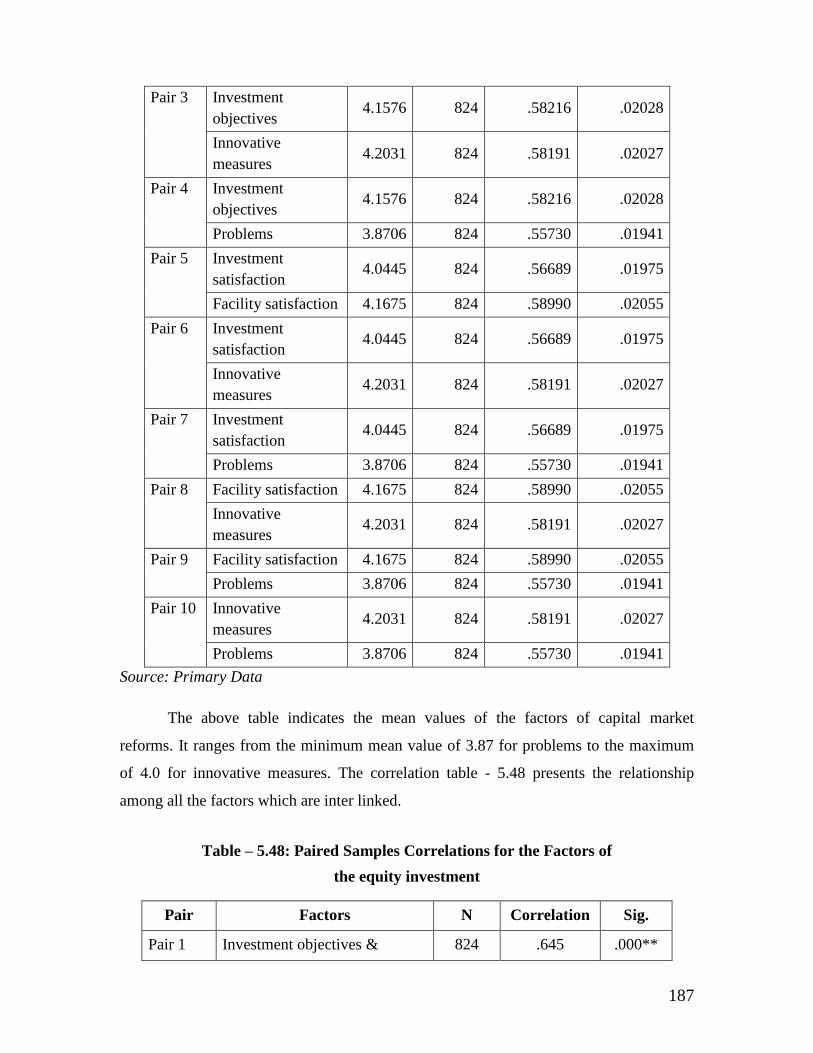
187
Pair 3
Investment
objectives 4.1576 824 .58216 .02028
Innovative
measures 4.2031 824 .58191 .02027
Pair 4
Investment
objectives 4.1576 824 .58216 .02028
Problems 3.8706 824 .55730 .01941
Pair 5
Investment
satisfaction 4.0445 824 .56689 .01975
Facility satisfaction 4.1675 824 .58990 .02055
Pair 6
Investment
satisfaction 4.0445 824 .56689 .01975
Innovative
measures 4.2031 824 .58191 .02027
Pair 7
Investment
satisfaction 4.0445 824 .56689 .01975
Problems 3.8706 824 .55730 .01941
Pair 8
Facility satisfaction 4.1675 824 .58990 .02055
Innovative
measures 4.2031 824 .58191 .02027
Pair 9
Facility satisfaction 4.1675 824 .58990 .02055
Problems 3.8706 824 .55730 .01941
Pair 10
Innovative
measures 4.2031 824 .58191 .02027
Problems 3.8706 824 .55730 .01941
Source: Primary Data
The above table indicates the mean values of the factors of capital market
reforms. It ranges from the minimum mean value of 3.87 for problems to the maximum
of 4.0 for innovative measures. The correlation table - 5.48 presents the relationship
among all the factors which are inter linked.
Table – 5.48: Paired Samples Correlations for the Factors of
the equity investment
Pair Factors N Correlation Sig.
Pair 1 Investment objectives & 824 .645 .000**

188
Investment satisfaction
Pair 2 Investment objectives &
Facility satisfaction 824 .673 .000**
Pair 3 Investment objectives &
Innovative measures 824 .550 .000**
Pair 4 Investment objectives &
Problems 824 .467 .000**
Pair 5 Investment satisfaction &
Facility satisfaction 824 .556 .000**
Pair 6 Investment satisfaction &
Innovative measures 824 .429 .000**
Pair 7 Investment satisfaction &
Problems 824 .533 .000**
Pair 8 Facility satisfaction &
Innovative measures 824 .514 .000**
Pair 9 Facility satisfaction &
Problems 824 .449 .000**
Pair 10 Innovative measures &
Problems 824 .323 .000**
Source: Primary Data; ** - Significant at 0.01 level
As observed from the above table, the five factors constitute the efficient capital
market reforms and the correlation co-efficient are highly significant. So, all reforms are
inter linked to accrue benefits to the investors. Paired sample t-test and their
consequences are established in table - 5.49.
Table – 5.49: Paired Samples Test Values for the Factors of the equity investment
Pair Factors t df Sig. (2-tailed)
Pair 1 Investment objectives -
Investment satisfaction 6.707 823 .000**
Pair 2 Investment objectives -
Facility satisfaction -.598 823 .550

189
Pair 3 Investment objectives -
Innovative measures -2.364 823 .018*
Pair 4 Investment objectives -
Problems 14.000 823 .000**
Pair 5 Investment satisfaction -
Facility satisfaction -6.471 823 .000**
Pair 6 Investment satisfaction -
Innovative measures -7.415 823 .000**
Pair 7 Investment satisfaction -
Problems 9.189 823 .000**
Pair 8 Facility satisfaction -
Innovative measures -1.769 823 .077
Pair 9 Facility satisfaction - Problems 14.140 823 .000**
Pair 10 Innovative measures -
Problems 14.390 823 .000**
Source: Primary Data; ** - Significant at 0.01 level; * Significant at 0.05 level
The paired sample statistical table – 4.99 clearly reveals that the investors are very
much attracted towards capital market with mean (4.20), followed by facility satisfaction
(mean = 4.17), investment objectives (mean = 4.16), investment satisfaction (mean =
4.04) and finally problems (mean = 3.87). Though the means are different, paired sample
t-test would check the statistically significant differences among them. It is also found
that investment objectives and facility satisfaction are equally treated (t = 0.598) by the
investors for their awareness. The educative and innovative measures are also equally
popular among the investors (t = 1.769). So it is inferred that the investors are very much
attracted by capital market after understanding the attractive financial sector reforms. The
transparency about the performance of the companies issuing the shares and continuous
monitoring of central government and the RBI raises the confidence among the investors
besides the market risk. It is also found that the investors are willing to invest their hard
earned money to have lucrative returns in the short span of time.

190
5.20 General Linear Multivariate Model Utilized to find out the Impact of the
Equity investment and Various Elements of Capital Market Reforms
The general linear multivariate model provides a regression analysis and analysis
of variance for multiple dependent variables. The independent variables are considerable
as co-variants. In this study, the various elements of capital market reforms, general
information in capital market, primary market reforms, secondary market reforms,
reforms in instruments and their changes and finally reforms in financial parameters are
considered as multiple dependent variables and the equity investments are considered as
independent variables. The effect of independent variables on the dependent variables is
depicted in table - 5.50.
Table – 5.50: Multivariate Tests (b) for the Impact of the Latest
Reforms in Capital Market
Factor Source Value F Hypothesis
df Error df Sig.
Intercept Pillai's Trace .224 46.864(a) 5.000 814.000 .000**
Wilks' Lambda .776 46.864(a) 5.000 814.000 .000**
Hotelling's Trace .288 46.864(a) 5.000 814.000 .000**
Roy's Largest
Root .288 46.864(a) 5.000 814.000 .000**
Investment
objectives
Pillai's Trace .151 28.889(a) 5.000 814.000 .000**
Wilks' Lambda .849 28.889(a) 5.000 814.000 .000**
Hotelling's Trace .177 28.889(a) 5.000 814.000 .000**
Roy's Largest
Root .177 28.889(a) 5.000 814.000 .000**
Investment
satisfaction
Pillai's Trace .179 35.537(a) 5.000 814.000 .000**
Wilks' Lambda .821 35.537(a) 5.000 814.000 .000**
Hotelling's Trace .218 35.537(a) 5.000 814.000 .000**
Roy's Largest
Root .218 35.537(a) 5.000 814.000 .000**
Facility
satisfaction
Pillai's Trace .051 8.823(a) 5.000 814.000 .000**
Wilks' Lambda .949 8.823(a) 5.000 814.000 .000**

191
Hotelling's Trace .054 8.823(a) 5.000 814.000 .000**
Roy's Largest
Root .054 8.823(a) 5.000 814.000 .000**
Innovative
measures
Pillai's Trace .063 10.938(a) 5.000 814.000 .000**
Wilks' Lambda .937 10.938(a) 5.000 814.000 .000**
Hotelling's Trace .067 10.938(a) 5.000 814.000 .000**
Roy's Largest
Root .067 10.938(a) 5.000 814.000 .000**
Problems Pillai's Trace .042 7.210(a) 5.000 814.000 .000**
Wilks' Lambda .958 7.210(a) 5.000 814.000 .000**
Hotelling's Trace .044 7.210(a) 5.000 814.000 .000**
Roy's Largest
Root .044 7.210(a) 5.000 814.000 .000**
a Exact statistics
b Design: Intercept+ Investment objectives+ Investment satisfaction+ Facility
satisfaction+ Innovative measures + Problems
Source: Primary Data; ** - Significant at 0.01 level; * Significant at 0.05 level
The above table reveals the existence of significant multivariate test for the
dependent variables and the factors of capital market reforms. It is clear from the table
that the F-values are significant in identifying the impact of independent variables.
The individual impact of five factors of capital market reforms on the dependent
variables and probable significance are presented in the table - 5.51.
Table – 5.51: Impact of the equity investment objectives on the Element of
investment decision Tests of Between-Subjects Effects
Independent
Variable
Dependent
Variable
Type III
Sum of
Squares
df Mean
Square F Sig.
Corrected
Model
General
information 107.477(a) 5 21.495 196.723 .000**
Company
management 82.097(b) 5 16.419 105.020 .000**
Details of the
present value 111.103(c) 5 22.221 105.713 .000**
Project details 111.547(d) 5 22.309 124.745 .000**

192
Independent
Variable
Dependent
Variable
Type III
Sum of
Squares
df Mean
Square F Sig.
Financial
parameters 109.080(e) 5 21.816 130.945 .000**
Intercept General
information 11.698 1 11.698 107.056 .000**
Company
management 21.894 1 21.894 140.037 .000**
Details of the
present value 7.009 1 7.009 33.344 .000**
Project details 9.421 1 9.421 52.681 .000**
Financial
parameters 11.025 1 11.025 66.176 .000**
Investment
objectives
General
information 5.641 1 5.641 51.629 .000**
Company
management 8.786 1 8.786 56.194 .000**
Details of the
present value 2.395 1 2.395 11.393 .001**
Project details 14.654 1 14.654 81.942 .000**
Financial
parameters 5.840 1 5.840 35.053 .000**
Investment
satisfaction
General
information 9.418 1 9.418 86.192 .000**
Company
management .617 1 .617 3.944 .047*
Details of the
present value 11.218 1 11.218 53.371 .000**
Project details 5.703 1 5.703 31.888 .000**
Financial
parameters 16.841 1 16.841 101.083 .000**
Facility
satisfaction
General
information 2.812 1 2.812 25.733 .000**
Company
management 3.612 1 3.612 23.104 .000**
Details of the
present value 2.368 1 2.368 11.266 .001**
Project details .216 1 .216 1.206 .272

193
Independent
Variable
Dependent
Variable
Type III
Sum of
Squares
df Mean
Square F Sig.
Financial
parameters 1.016 1 1.016 6.101 .014*
Innovative
measures
General
information 4.709 1 4.709 43.097 .000**
Company
management .913 1 .913 5.837 .016*
Details of the
present value 3.618 1 3.618 17.212 .000**
Project details .598 1 .598 3.344 .068
Financial
parameters .372 1 .372 2.236 .135
Problems General
information .574 1 .574 5.257 .022*
Company
management 1.123 1 1.123 7.185 .008**
Details of the
present value 1.403 1 1.403 6.675 .010**
Project details 1.683 1 1.683 9.411 .002**
Financial
parameters .135 1 .135 .809 .369
Error General
information 89.381 818 .109 -- --
Company
management 127.891 818 .156 -- --
Details of the
present value 171.941 818 .210 -- --
Project details 146.290 818 .179 -- --
Financial
parameters 136.282 818 .167 -- --
Total General
information 14423.703 824 -- -- --
Company
management 14930.313 824 -- -- --
Details of the
present value 14276.432 824 -- -- --
Project details 14204.560 824 -- -- --

194
Independent
Variable
Dependent
Variable
Type III
Sum of
Squares
df Mean
Square F Sig.
Financial
parameters 14190.440 824 -- -- --
Corrected
Total
General
information 196.858 823 -- -- --
Company
management 209.988 823 -- -- --
Details of the
present value 283.044 823 -- -- --
Project details 257.837 823 -- -- --
Financial
parameters 245.362 823 -- -- --
a R Squared = .546 (Adjusted R Squared = .543)
b R Squared = .391 (Adjusted R Squared = .387)
c R Squared = .393 (Adjusted R Squared = .389)
d R Squared = .433 (Adjusted R Squared = .429)
e R Squared = .445 (Adjusted R Squared = .441)
Source: Primary Data; ** - Significant at 0.01 level; * Significant at 0.05 level
The following observations have been made from the above table. The
independent variables of the equity investment explain the total variance of 54.6%,
39.1%, 39.3%, 43.3% and 44.5% respectively. These variances are statistically
significant to state that the equity investment increases the number of investors in
primary market and secondary market.
The table of tests of between – subtest effects clearly reveals that the investment
objectives and the latest developments have impact on general information (F = 51.629),
company management (F = 56.194), details of the present value (F = 11.393), project
details (F = 81.942) and financial parameters (F = 35.053). Similarly the investment
satisfaction has an impact on all the elements of reforms in capital market.
Facility satisfaction does not create an impact on instruments and their changes.
Innovative measures have good impact on all elements of capital reforms, except
financial parameters. Problems create deep impact on capital market reforms, primary

195
market reforms secondary market reforms, instruments and their changes, but it does not
predict financial parameters. So, it is summarised that the equity investment have
predicted good impact on reforms in capital market. Collectively the equity investments
aim at reforming primary and secondary market. Positive changes in the instrument and
better returns to the investors prevail in the equity market.
5.21 Analysis of Variance carried out for Investors Preference of Investment
when better return is received
Analysis of variance is a useful tool to identify the variance among the variables.
In this study, the preference to investments, shares, real estate, gold, deposit in bank,
government bonds and purchasing of agricultural lands are considered for their
significant difference in variance and the grouping variables for the analysis in the cluster
of investors. Table - 5.52 presents the variance in group means of factors of capital
market reforms with respect to clusters of investors and exhibits the significant variance
in group means of various investment options.
Table – 5.52: ANOVA for Group Means of Investment Options
Dependent
Variable Group
Sum of
Squares df
Mean
Square F Sig.
Investment in
Share and
Debentures
Between
Groups 374.254 2 187.127 .699 .497
Within
Groups 219775.397 821 267.692 -- --
Total 220149.650 823 -- -- --
Investment in
Real Estate
Between
Groups 2441.163 2 1220.582 5.845 .003**
Within
Groups 171434.196 821 208.811 -- --
Total 173875.359 823 -- -- --
Investment in
Gold
Between
Groups 2461.048 2 1230.524 8.558 .000**

196
Within
Groups 118043.568 821 143.780 -- --
Total 120504.617 823 -- -- --
Investment in
Bank
Between
Groups 111.702 2 55.851 .325 .723
Within
Groups 141021.793 821 171.768 -- --
Total 141133.495 823 -- -- --
Investment in
Government
Bonds
Between
Groups 5596.028 2 2798.014 20.266 .000**
Within
Groups 113350.058 821 138.063 -- --
Total 118946.086 823 -- -- --
Investment in
Purchasing of
Agricultural
Lands
Between
Groups 989.789 2 494.894 8.894 .000**
Within
Groups 45682.366 821 55.642 -- --
Total 46672.154 823 -- -- --
Source: Primary Data; ** - Significant at 0.01 level; * Significant at 0.05 level
It is found from the above table that there is a significant variance in investment
in real estate (F = 5.845), investment in gold (F = 8.558), investment in Government
bonds (F = 20.27), and finally investment in of agricultural lands (F = 8.894).
On the whole it is concluded that the investors’ behaviour changes with regard to
clusters of equity investment. As the clusters of investors are based on their interest and
awareness of capital market, it can be profoundly stated that the investors are also explore
the avenues like real estate, gold investment and government bonds to get more returns
with less risk.
5.22 Correlation Analysis Carried out for the Number of Years in Dealing with
equity market investment

197
Karl Pearson’s co-efficient of correlation is a statistical tool used to establish the
relationship between the two variables. There are two types of correlations, one is
positive correlation and the other one is negative correlation.
Table – 5.53 establishes the co-efficient of correlation between the factors of the
equity investment and the number of years in dealing with capital market.
Table - 5.53: Coefficient of Correlations for Number of Years
Dealing in Capital Market
Variables Co-efficient Significance
1. Investment objectives .008 0.816
2. Investment satisfaction -.004 0.911
3. Facility satisfaction -.064 0.068
4. Innovative measures -.027 0.439
5. Problems -.050 0.153
Source: Primary Data
After a close scrutiny of the above table, it is concluded that there is no significant
relationship between the number of years in dealing with capital market and variably of
the equity investment, i.e., some investors are continuously investing in capital markets
with their perception about the developments in capital market. They feel it is an
advantage for their investment.
5.23 Percentage of Savings in Capital Market with regard to equity investment
The group means and their significant difference between them with respect to
percentage of savings is presented in table - 5.54.
Table – 5.54: ANOVA for the Latest Reforms Based on Percentage of Savings
Independent
Variable Group
Sum of
Squares Df
Mean
Square F Sig.
Investment
objectives
Between Groups 11.380 3 3.793 11.627 .000**
Within Groups 267.540 820 .326 -- --
Total 278.920 823 -- -- --
Investment Between Groups .464 3 .155 .481 .696

198
satisfaction Within Groups 264.015 820 .322 -- --
Total 264.480 823 -- -- --
Facility
satisfaction
Between Groups 7.836 3 2.612 7.689 .000**
Within Groups 278.552 820 .340 -- --
Total 286.388 823 -- -- --
Innovative
measures
Between Groups 1.545 3 .515 1.523 .207
Within Groups 277.141 820 .338 -- --
Total 278.686 823 -- -- --
Problems
Between Groups 1.860 3 .620 2.003 .112
Within Groups 253.749 820 .309 -- --
Total 255.609 823 -- -- --
Source: Primary Data; ** - Significant at 0.01 level; *Significant at 0.05level
The above table clearly reveals that the latest investment objectives (F=11.627)
and facility satisfaction (F=7.689) differ in their means significantly. So, it can be
inferred that investment objectives and facility satisfaction severely affect the investor’s
decision to decide the percentage of investment in share market.
5.24 Linear Multiple Regression Analysis carried out on Elements of
Retail investment
Linear multiple regression analysis is a multivariate statistical tool used to
identify the impact of independent variables on dependent variables. It also explores the
percentage of variance of independent variables on dependent variable. The ANOVA
table exhibited in this analysis explains fitness of regression using independent variables
and the co-efficient table elaborates about the individual impact on every independent
variable in the study. The demographic variables of investors’ viz. Age, Gender, Marital
Status, Education, Occupation, Income, Nature of Family, Number of Dependents, House
Ownership and percentage of investment are considered as independent variables. Each
element of capital investments is taken as a dependent variable. This analysis is going to
be performed cluster wise, using the clusters of awareness on retail investment.

199
(a) Cluster wise Linear Multiple Regression Analysis for General informations
In cluster, 1 the explanation of independent demographic variables about
dependent variable general informations is presented in table - 5.55.
Table - 5.55: Variance of Independent Variable on General informations and
Cluster 1 (b)
Model R R Square Adjusted R
Square
Std. Error of
the Estimate
1 .341(a) .116 .091 .38026
a. Predictors: (Constant), Vehicle Ownership, Occupation, House Ownership Gender,
Marital Status, Dependents, Qualification, Nature of the Family Annual Income, Age.
b. Clusters of investments 1
Source: Primary Data
As seen in the above table in the case of moderate cluster the independent
variables explain 11.6% variance of dependent variables.
The significance of the regression model is presented in the
table - 5.56.
Table – 5.56: ANOVA (b, c) for General informations and Cluster 1
Model Source Sum of
Squares df
Mean
Square F Sig.
1
Regression 6.588 10 .659 4.556 .000(a)**
Residual 50.176 347 .145 -- --
Total 56.763 357 -- -- --
a. Predictors: (Constant), Vehicle Ownership, Occupation, House Ownership Gender,
Marital Status, Dependents, Qualification, Nature of the Family Annual Income, Age.
b. Dependent Variable: General informations
c. Clusters of investments 1

200
Source: Primary Data; ** Significant at 0.01 level
From the above table it is found that the regression significantly fits
(F=4.556).The individual explanations of each demographic variable and its respective t-
values are presented in table - 5.57.
Table - 5.57: Coefficients (a, b) of General informations and Cluster 1
Model
Independent
Variables
Un-
standardized
Coefficients
Standardized
Coefficients t
Sig.
B Std.
Error Beta
1
(Constant) 3.240 .190 -- 17.037 .000**
Age .124 .032 .234 3.927 .000**
Gender .307 .082 .193 3.720 .000**
Martial Status .036 .047 .042 .765 .445
Educational
Qualification .022 .020 .063 1.098 .273
Occupation -.025 .020 -.074 -1.249 .213
Annual
Income .069 .026 .155 2.654 .008**
Family -.030 .045 -.037 -.669 .504
Dependents -.008 .011 -.038 -.704 .482
House
Ownership -.065 .054 -.064 -1.192 .234
Percentage of
investment -.109 .045 -.135 -2.440 .015*
a. Dependent Variable: General informations; b . Clusters of investments 1
Source: Primary Data; ** Significant at 0.01 level; * Significant at 0.05 level
In this moderate awareness cluster age (t=3.927), gender (t=3.720), annual
income (t=2.654), and vehicle ownership (t=2.440) of investors pave the way to know
about general capital investments. So on the whole it is concluded that the demographic
variables of investors are useful for them to identify the general retail investment.

201
Table - 5.58: Variance of Independent Variable on General informations and
Cluster 2 (b)
Model R R. Square Adjusted
R. Square
Std. Error of
the Estimate
1 .298(a) .089 .068 .26307
a. Predictors: (Constant), Vehicle Ownership, Occupation, House Ownership Gender,
Marital Status, Dependents, Qualification, Nature of the Family Annual Income, Age.
b. Clusters of investments 2
Source: Primary Data
In the case of high awareness cluster the independent variables explain 8.9%
variation of dependent variable. It is found in the above table. The significant fit of the
regression model is presented in the table - 5.58.
Table - 5.59: ANOVA (b, c) for General informations and Cluster 2
Model Sources Sum of
Squares df
Mean
Square F Sig.
1
Regression 3.000 10 .300 4.335 .000(a)**
Residual 30.796 445 .069 -- --
Total 33.796 455 -- -- --
a. Predictors: (Constant), Vehicle Ownership, Occupation, House Ownership
Gender, Marital Status, Dependents, Qualification, Nature of the Family
Annual Income, Age.
b. Dependent Variable: General informations
c. Clusters of investments 2
Source: Primary Data; ** Significant at 0.01 level
From the table – 5.59 it is identified that the regression fits significantly
(F=4.335). The individual explanations of each demographic variable and their respective
t- values are presented in table - 4.67.
In cluster 2 the explanation of independent demographic variables about
dependent variable general informations is presented in the table - 5.60.

202
Table – 5.60: Coefficients (a, b) of General informations and Cluster 2
Model Independent
Variable
Un-standardized
Coefficients
Standardized
Coefficients t Sig.
B Std.
Error Beta
1
(Constant) 4.606 .142 -- 32.518 .000**
Age .079 .024 .183 3.360 .001**
Gender -.054 .047 -.054 -1.166 .244
Martial Status .084 .034 .125 2.463 .014*
Educational
Qualification -.022 .014 -.076 -1.577 .116
Occupation -.038 .013 -.137 -2.830 .005**
Annual
Income -.001 .016 -.004 -.082 .935
Family .016 .027 .028 .574 .566
Dependents -.028 .007 -.181 -3.507 .000**
House
Ownership -.073 .041 -.083 -1.763 .079
Percentage of
investment -.052 .025 -.106 -2.071 .039*
a. Dependent Variable: General informations
b. Clusters of investments 2
Source: Primary Data; ** Significant at 0.01 level; * Significant at 0.05 level
From the co-efficient table it is found that the high awareness of investors is
achieved through their age (t=3.360) marital status (t=2.463) occupation (t=2.83) no. of
dependents and percentage of investment. In cluster 2 the demographic variables
distinguish the investors from high awareness on retail investment.

203
(b) Cluster-wise Linear Multiple Regression Analysis for Company management
In cluster 1, the explanation of independent demographic variables about
dependent variable Company management is presented in table - 5.61.
Table - 5.61: Variance of Independent Variable for Company management and
Cluster 1 (b)
Model R R Square Adjusted R
Square
Std. Error of the
Estimate
1 .252(a) .064 .037 .41747
a. Predictors: (Constant), Vehicle Ownership, Occupation, House Ownership Gender,
Marital Status, Dependents, Qualification, Nature of the Family, Annual Income, Age.
b Clusters of investments 1
Source: Primary Data
As seen from the above table the demographic variables of investors with
moderate awareness on equity shares explains 6.4% variance of the dependent variable.
The significant fit of the regression model is presented in table - 5.62.
Table - 5.62: ANOVA (b, c) for Company management and Cluster 1
Model Source Sum of
Squares df
Mean
Square F Sig.
1
Regression 4.118 10 .412 2.363 .010(a)*
Residual 60.475 347 .174 -- --
Total 64.594 357 -- -- --
a. Predictors: (Constant), Vehicle Ownership, Occupation, House Ownership
Gender, Marital Status, Dependents, Qualification, Nature of the Family
Annual Income, Age.
b. Dependent Variable: Company management
c. Clusters of investments 1
Source: Primary Data; * Significant at 0.05 level

204
From the above table, the significant regression fit is evident (F=2.363). The
individual impact of each variable is presented in table - 5.63.
Table - 5.63: Coefficients (a, b) of Company management and Cluster 1
Model Independent
Variable
Unstandardized
Coefficients
Standardized
Coefficients t Sig.
B Std.
Error Beta
1
(Constant) 3.356 .209 -- 16.075 .000**
Age -.013 .035 -.022 -.366 .715
Gender .086 .091 .051 .950 .343
Martial Status .025 .052 .028 .488 .626
Educational
Qualification -.005 .022 -.012 -.211 .833
Occupation -.016 .022 -.043 -.707 .480
Annual Income .052 .029 .109 1.809 .071
Family .097 .049 .113 1.979 .049*
Dependents .009 .012 .042 .757 .450
House
Ownership .038 .059 .035 .633 .527
Percentage of
investment .127 .049 .149 2.602 .010**
a. Dependent Variable: Company management; b. Clusters of investments 1
Source: Primary Data; ** Significant at 0.01 level; * Significant at 0.05 level
As observed from the above table the demographic variables of investors with
moderate awareness on equity shares explain 6.4% variance of the dependent variable
with good regression fit (F=2.363). In this moderate awareness group of investors, nature
of family (t=1.979) and vehicle ownership help them to acquire knowledge about
company management. It is concluded that the nature of family decides the investor’s
awareness on the company management in cluster 1.
In cluster 2 the explanation of independent demographic variables about
dependent variable company management is presented in table - 5.64.

205
Table - 5.64: Variance of Independent Variable for Company management and
Cluster 2 (b)
Model R R Square Adjusted
R Square
Std. Error of
the Estimate
1 .269(a) .072 .051 .36060
a. Predictors: (Constant), Vehicle Ownership, Occupation, House Ownership Gender,
Marital Status, Dependents, Qualification, Nature of the Family Annual Income, Age.
b Clusters of investments 2
Source: Primary Data
It is clear from the above table that in the high awareness on equity shares reform
clusters, the demographic variables of investors explain 7.2% of total variation on
company management. The significant fit of the regression model is presented in the
table - 5.65.
Table - 5.65: ANOVA (b, c) for Company management and Cluster 2
Model Source Sum of
Squares df
Mean
Square F Sig.
1
Regression 4.498 10 .450 3.460 .000(a)**
Residual 57.863 445 .130 -- --
Total 62.361 455 -- -- --
a. Predictors: (Constant), Vehicle Ownership, Occupation, House Ownership
Gender, Marital Status, Dependents, Qualification, Nature of the Family
Annual Income, Age.
b. Dependent Variable: Company management; c Clusters of investments 2
Source: Primary Data; ** Significant at 0.01 level
From the above table, it is found that the regression fits significantly with
F=3.460. The individual explanations of each demographic variable and its respective t-
value are indicated in table - 5.66.

206
Table - 5.66: Coefficients (a, b) for Company management and Cluster 2
Model Independent
Variable
Un-standardized Coefficients
Standardized Coefficients t
Sig.
B
Std. Error
Beta
1
(Constant) 4.757 .194 -- 24.500 .000**
Age .021 .032 .036 .663 .508
Gender -.032 .064 -.024 -.502 .616
Martial Status .034 .047 .037 .724 .469
Educational Qualification
-.001 .019 -.004 -.073 .942
Occupation -.035 .018 -.094 -1.912 .057
Annual Income .055 .021 .138 2.556 .011*
Family -.045 .038 -.058 -1.191 .234
Dependents -.033 .010 -.157 -3.290 .001**
House Ownership
.017 .057 .014 .301 .764
Percentage of investment
-.143 .034 -.215 -4.159 .000**
a. Dependent Variable: Company management; b. Clusters of investments2;
Source: Primary Data; ** Significant at 0.01 level; * Significant at 0.05level
It is understood from the above table that annual income (t=2.556), no of
dependents (t=3.290), and vehicle ownership (t=4.159) are useful for the investors to
know the company management. In cluster 2, it is concluded that income, vehicle
ownership and number of dependents explain the awareness of investors on company
management.
c) Cluster-wise Linear Multiple Regression Analysis for Details of present
values
In cluster 1, the explanation of independent demographic variables about dependent
variable Details of present values is presented in table - 5.67.

207
Table - 5.67: Variance of Independent Variable on Details of present values Cluster
1 (b)
Model R R Square Adjusted
R Square
Std. Error of
the Estimate
1 .297(a) .088 .062 .53165
a. Predictors: (Constant), Vehicle Ownership, Occupation, House Ownership Gender,
Marital Status, Dependents, Qualification, Nature of the Family Annual Income, Age.
b Clusters of investments 1
Source: Primary Data
It is deduced from the above table that in the case of moderate awareness on
capital reform clusters, the independent variables explain 8.8% variance of details of
present values. The significant fit of the regression model is presented in table - 5.68.
Table - 5.68: ANOVA (b, c) for Details of present values and Cluster 1
Model Source Sum of
Squares df
Mean
Square F Sig.
1
Regression 9.505 10 .951 3.363 .000(a)**
Residual 98.081 347 .283 -- --
Total 107.587 357 -- -- --
a. Predictors: (Constant), Vehicle Ownership, Occupation, House Ownership
Gender, Marital Status, Dependents, Qualification, Nature of the Family
Annual Income, Age.
b. Dependent Variable: Details of present values; c. Clusters of investments 1
Source: Primary Data; ** Significant at 0.01 level
From the above table, it is found that the regression fits significantly with
F=3.363. The individual explanations of each demographic variable and its respective t-
value are presented in table - 5.69.
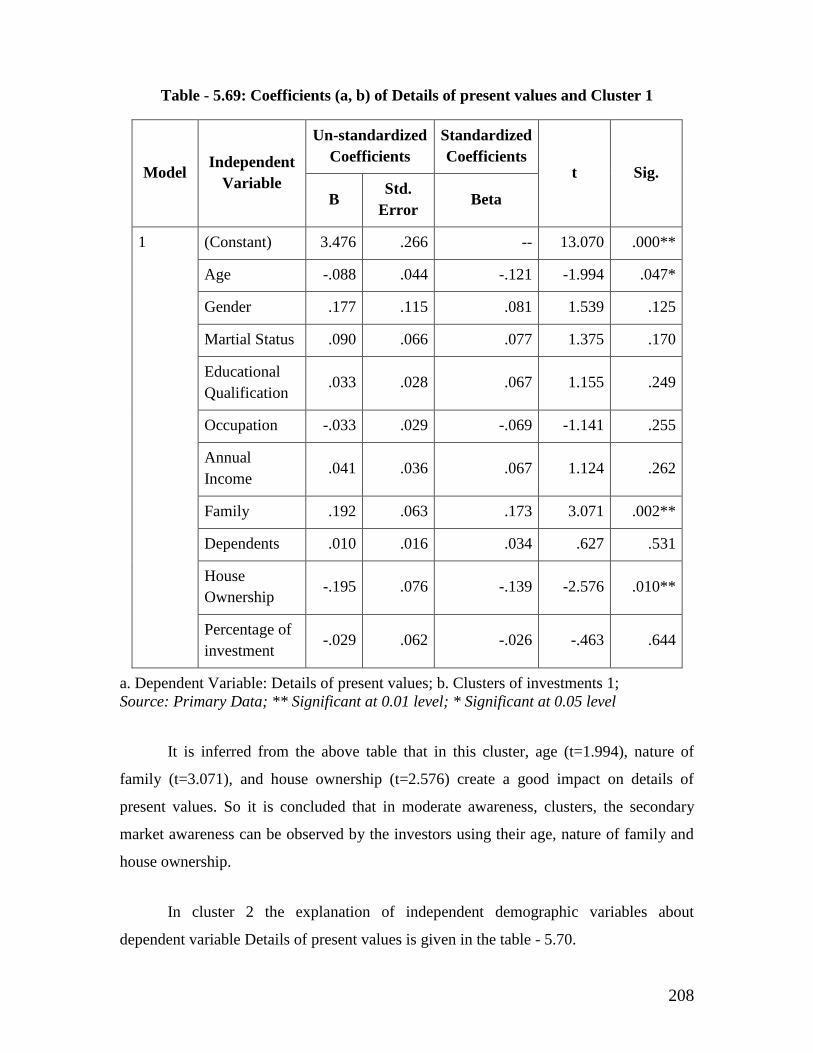
208
Table - 5.69: Coefficients (a, b) of Details of present values and Cluster 1
Model Independent
Variable
Un-standardized
Coefficients
Standardized
Coefficients t Sig.
B Std.
Error Beta
1
(Constant) 3.476 .266 -- 13.070 .000**
Age -.088 .044 -.121 -1.994 .047*
Gender .177 .115 .081 1.539 .125
Martial Status .090 .066 .077 1.375 .170
Educational
Qualification .033 .028 .067 1.155 .249
Occupation -.033 .029 -.069 -1.141 .255
Annual
Income .041 .036 .067 1.124 .262
Family .192 .063 .173 3.071 .002**
Dependents .010 .016 .034 .627 .531
House
Ownership -.195 .076 -.139 -2.576 .010**
Percentage of
investment -.029 .062 -.026 -.463 .644
a. Dependent Variable: Details of present values; b. Clusters of investments 1;
Source: Primary Data; ** Significant at 0.01 level; * Significant at 0.05 level
It is inferred from the above table that in this cluster, age (t=1.994), nature of
family (t=3.071), and house ownership (t=2.576) create a good impact on details of
present values. So it is concluded that in moderate awareness, clusters, the secondary
market awareness can be observed by the investors using their age, nature of family and
house ownership.
In cluster 2 the explanation of independent demographic variables about
dependent variable Details of present values is given in the table - 5.70.

209
Table - 5.70: Variance of Independent Variable on Details of present values and
Cluster 2 (b)
Model R R Square Adjusted R
Square
Std. Error of the
Estimate
1 .157(a) .025 .003 .41696
a. Predictors: (Constant), Vehicle Ownership, Occupation, House Ownership Gender,
Marital Status, Dependents, Qualification, Nature of the Family Annual Income, Age.
b. Clusters of investments 2
Source: Primary Data
As per the above table the demographic variables explain 2.5% of the total
variance. The significant fit of the regression model is presented in table - 5.71.
Table - 5.71: ANOVA (b, c) for Details of present values and Cluster 2
Model Source Sum of
Squares df
Mean
Square F Sig.
1
Regression 1.956 10 .196 1.125 .341(a)
Residual 77.365 445 .174 -- --
Total 79.321 455 -- -- --
a. Predictors: (Constant), Vehicle Ownership, Occupation, House Ownership
Gender, Marital Status, Dependents, Qualification, Nature of the Family Annual
Income, Age.
b. Dependent Variable: Details of present values; c. Clusters of investments 2 Source:
Primary Data
The above table clearly reveals that the regression is not significant. The
individual explanations of each demographic variable and its respective t-value are
presented in table - 5.72.
Table - 5.72: Coefficients (a, b) for Details of present values and Cluster 2
Model
Independent
Variable
Un-standardized
Coefficients
Standardized
Coefficients t
Sig.
B
Std.
Error Beta

210
1
(Constant) 4.219 .224 -- 18.793 .000**
Age .076 .037 .114 2.017 .044*
Gender -.029 .074 -.019 -.390 .697
Martial Status .017 .054 .017 .320 .749
Educational
Qualification .007 .022 .017 .340 .734
Occupation -.003 .021 -.007 -.130 .897
Annual Income -.013 .025 -.028 -.506 .613
Family .056 .043 .064 1.282 .201
Dependents -.008 .012 -.034 -.691 .490
House
Ownership -.069 .066 -.051 -1.045 .296
Percentage of
investment .030 .040 .040 .757 .449
a Dependent Variable: Details of present values
b Clusters of investments 2
Source: Primary Data; ** Significant at 0.01 level; * Significant at 0.05 level
The investors with high awareness on retail investment are able to initiate more
ideas of details of present values through age (t=2.017), alone. The regression does not fit
significantly and the variance percentage is 2.5 only. It is found that in order to have high
awareness age alone helps the investors. All these have been observed from table - 5.72.
(d) Cluster-wise Linear Multiple Regression Analysis for Project details and
their Changes
In cluster 1 the explanation of independent demographic variables about
dependent variable change of project details is presented in table - 5.73.

211
Table - 5.73 Variance of Independent Variable on Project details and their Changes
and Cluster 1 (b)
Model R R Square Adjusted
R Square
Std. Error of
the Estimate
1 .268(a) .072 .045 .47031
a. Predictors: (Constant), Vehicle Ownership, Occupation, House Ownership Gender,
Marital Status, Dependents, Qualification, Nature of the Family Annual Income, Age.
b Clusters of investments 1
Source: Primary Data
According to the above table in moderate awareness cluster, the demographic
variables of investors explain 7.2% variance on dependent variables. The significant fit of
the regression model is presented in table - 5.74.
Table - 5.74: ANOVA (b, c) for Project details and their Changes and Cluster 1
Model Source Sum of
Squares Df
Mean
Square F Sig.
1
Regression 5.933 10 .593 2.682
.004(a)*
*
Residual 76.753 347 .221 -- --
Total 82.686 357 -- -- --
a. Predictors: (Constant), Vehicle Ownership, Occupation, House Ownership Gender,
Marital Status, Dependents, Qualification, Nature of the Family Annual Income, Age.
b. Dependent Variable: Change of project details
c. Clusters of investments 1
Source: Primary Data; ** Significant at 0.01 level
From the above table it is found that the regression fits significantly with
F=2.682.The individual explanations of each demographic variable and its respective t-
value are presented in table - 5.75.

212
Table – 5.75: Coefficients (a, b) for Project details and their Changes and Cluster 1
Model
Independent
Variable
Un-standardized
Coefficients
Standardize
d
Coefficients t
Sig.
B Std.
Error Beta
1
(Constant) 3.658 .235 -- 15.549 .000**
Age -.072 .039 -.113 -1.849 .065
Gender .269 .102 .140 2.641 .009**
Martial Status -.022 .058 -.021 -.375 .708
Educational
Qualification -.027 .025 -.064 -1.083 .279
Occupation -.004 .025 -.009 -.151 .880
Annual Income .097 .032 .179 2.998 .003**
Family .062 .055 .064 1.127 .260
Dependents -.007 .014 -.028 -.504 .615
House
Ownership -.133 .067 -.108 -1.981 .048*
Percentage of
investment -.036 .055 -.037 -.658 .511
a Dependent Variable: Change of project details
b Clusters of investments 1
Source: Primary Data; ** Significant at 0.01 level; * Significant at 0.05 level
It is understood from the table that in this cluster, gender (t=2.641), income
(t=2.998) ownership of the house (t=1.981) explain the awareness of investors on

213
changes of project details. So it is concluded that gender, income and ownership of the
house decide their high awareness on details of present values.
In cluster 2 the explanation of independent demographic variables about
dependent variable change of project details is presented in the table - 5.76.
Table - 5.76: Variance of Independent Variable on Project details and their
Changes and Cluster 2 (b)
Model R R Square Adjusted R
Square
Std. Error of the
Estimate
1 .191(a) .037 .015 .37355
a. Predictors: (Constant), Vehicle Ownership, Occupation, House Ownership Gender,
Marital Status, Dependents, Qualification, Nature of the Family Annual Income, Age.
b Clusters of investments 2
Source: Primary Data
As exhibited in the above table for high awareness cluster, the regression does not
fit significantly (f=1.690) and very poor 3.7% variance is explained by independent
variables on dependent variables The significant fit of the regression model is presented
in table - 5.77.
Table - 5.77: ANOVA (b, c) for Project details and their Changes and Cluster 2
Model Source Sum of
Squares df
Mean
Square F Sig.
1
Regression 2.358 10 .236 1.690 .080(a)
Residual 62.095 445 .140 -- --
Total 64.453 455 -- -- --
a. Predictors: (Constant), Vehicle Ownership, Occupation, House Ownership Gender,
Marital Status, Dependents, Qualification, Nature of the Family Annual Income, Age.
b Dependent Variable: Change of project details
c Clusters of investments 2
Source: Primary Data

214
The above table clearly reveals that the regression is not significant. The
individual explanations of each demographic variable and its respective t-value are
presented in table - 5.78.
Table - 5.78 Coefficients (a, b) for Project details and their Changes Cluster 2
Model Independent
Variable
Un-standardized Coefficients
Standardized Coefficients
t Sig.
B Std.
Error Beta
1
(Constant) 4.100 .201 -- 20.388 .000**
Age .054 .034 .090 1.599 .111
Gender .028 .066 .020 .421 .674
Martial Status .099 .048 .106 2.037 .042*
Educational
Qualification -.020 .020 -.052 -1.044 .297
Occupation -.024 .019 -.063 -1.257 .209
Annual Income .047 .022 .116 2.110 .035*
Family .071 .039 .091 1.836 .067
Dependents -.013 .010 -.061 -1.248 .213
House Ownership .052 .059 .043 .893 .372
Percentage of
investment -.052 .036 -.077 -1.450 .148
a Dependent Variable: Change of project details
b Clusters of investments 2

215
Source: Primary Data; ** Significant at 0.01 level; * Significant at 0.05 level
It is inferred from the above table that in this cluster, the marital status (t=2.037)
and income (t=2.110) create an impact of dependent variables. The marital status and
income of the investors decide them to possess moderate awareness on change of project
details
(e) Cluster-wise Linear Multiple Regression Analysis for Financial parameters
In cluster 1 the explanation of independent demographic variables about
dependent variable financial parameters is presented in the table – 5.79.
Table - 5.79: Variance of Independent Variable on Financial parameters and
Cluster 1 (b)
Model R R Square Adjusted R
Square
Std. Error of the
Estimate
1 .412(a) .170 .146 .39757
a. Predictors: (Constant), Vehicle Ownership, Occupation, House Ownership Gender,
Marital Status, Dependents, Qualification, Nature of the Family Annual Income, Age.
b. Clusters of investments 1
Source: Primary Data
It is clear from the above table that in the case of moderate awareness on capital
reform with 17% variance in financial parameters. The significant fit of the regression
model is presented in table - 5.80.
Table - 5.80: ANOVA (b, c) for Financial parameters for Cluster 1
Model Source Sum of
Squares Df
Mean
Square F Sig.
1
Regression 11.241 10 1.124 7.112 .000(a)**
Residual 54.847 347 .158 -- --
Total 66.088 357 -- -- --
a. Predictors: (Constant), Vehicle Ownership, Occupation, House Ownership Gender,
Marital Status, Dependents, Qualification, Nature of the Family Annual Income, Age.
b. Dependent Variable: financial parameters
c. Clusters of investments 1
Source: Primary Data; ** Significant at 0.01 level

216
From the above table it is found that the regression fits significantly with
F=7.112. The individual explanation of each demographic variable and its respective t-
value are presented in table - 5.81.
Table - 5.81: Coefficients (a, b) for Financial parameters and Cluster 1
Model
Independent
Variable
Unstandardized
Coefficients
Standardized
Coefficients t
Sig.
B
Std.
Error Beta
1
(Constant) 3.995 .199 -- 20.091 .000**
Age .039 .033 .068 1.177 .240
Gender -.025 .086 -.015 -.295 .768
Martial Status .202 .049 .219 4.106 .000**
Educational
Qualification .032 .021 .085 1.532 .126
Occupation -.063 .021 -.171 -2.965 .003**
Annual
Income -.078 .027 -.161 -2.846 .005**
Family -.085 .047 -.097 -1.810 .071
Dependents -.015 .012 -.069 -1.311 .191
House
Ownership -.262 .057 -.239 -4.624 .000**
Percentage of
investment .038 .047 .044 .822 .412
a Dependent Variable: financial parameters
b Clusters of investments 1
Source: Primary Data; ** Significant at 0.01 level
It is found from the above table that in this cluster the marital status (t=4.106),
occupation (t=2.965), income (t=2.846) and house ownership (t=4.624) of investors pave
the way for them to understand the financial parameters. The moderate awareness on
financial parameters can be obtained through the marital status, occupation, income and
house ownership of the investors.
In cluster 2, the explanation of independent demographic variables about
dependent variable financial parameters is presented in table - 5.82.

217
Table - 5.82: Variance of Independent Variable on Financial parameters and
Cluster 2 (b)
Model R R Square Adjusted
R Square
Std. Error of
the Estimate
1 .200(a) .040 .018 .30988
a. Predictors: (Constant), Vehicle Ownership, Occupation, House Ownership
Gender, Marital Status, Dependents, Qualification, Nature of the Family
Annual Income, Age.
b. Clusters of investments 2
Source: Primary Data
The significant fit of the regression model is presented in table - 5.83.
Table - 5.83: ANOVA (b, c) for Financial parameters for Cluster 2
Model Source Sum of
Squares df
Mean
Square F Sig.
1
Regression 1.783 10 .178 1.856 .049(a)*
Residual 42.732 445 .096 -- --
Total 44.515 455 -- -- --
a. Predictors: (Constant), Vehicle Ownership, Occupation, House Ownership
Gender, Marital Status, Dependents, Qualification, Nature of the Family
Annual Income, Age.
b. Dependent Variable: financial parameters
c. Clusters of investments 2
Source: Primary Data; * Significant at 0.05 level
Tables 5.82 and 5.83 clearly reveals that in the highly awareness on capital reform
cluster, 4% of the variance of dependent variables is explained by the independent
variables. The individual explanation of each demographic variable and its respective t-
value are presented in table - 5.84.

218
Table - 5.84: Coefficients (a, b) for Financial parameters and Cluster 2
Model Independent
Variables
Un-standardized
Coefficients
Standardized
Coefficients t Sig.
B Std.
Error Beta
1
(Constant) 4.487 .167 -- 26.896 .000**
Age -.002 .028 -.003 -.057 .955
Gender .087 .055 .076 1.586 .113
Martial Status .003 .040 .004 .083 .934
Educational
Qualification -.017 .016 -.052 -1.057 .291
Occupation -.032 .016 -.101 -2.020 .044*
Annual Income .031 .018 .091 1.660 .098
Family .009 .032 .013 .274 .785
Dependents -.023 .009 -.131 -2.693 .007**
House
Ownership .005 .049 .005 .099 .922
Percentage of
investment -.005 .030 -.009 -.176 .860
a. Dependent Variable: return in investment
b. Clusters of investments 2
Source: Primary Data; ** Significant at 0.01 level; * Significant at 0.05 level
It is found from the above table that the occupation (t=2.020), and no of
dependents (t=2.693) are the two demographic variables of investors creating a good
impact on return in investment. The high awareness on financial parameters of investors
is decided by their occupation and the number of dependents in the family.

219
5.25 The Multivariate General Linear Analysis for returns Received and
Preference of Investment
In this analysis the retail investment and its impact on different avenues of
investment are explored using multivariate general linear model. The elements of retail
investment are taken as independent variables and the percentage of investment in
different avenues are considered as dependent variables. The individual impact of retail
investment on the investment options is explained in the table - 5.85.
Table - 5.85: Impact of Retail investment Preference of returns Amount Received
and Tests of Between-Subjects Effects
Source Dependent
Variable
Type III
Sum of
Squares
df Mean
Square F Sig.
Corrected
Model
Investment in
shares 5735.221(a) 5 1147.044 4.376 .001**
Investment in
real estate 5598.794(b) 5 1119.759 5.443 .000**
Investment in
Gold 6797.038(c) 5 1359.408 9.779 .000**
Investment in
bank 3116.403(d) 5 623.281 3.694 .003**
Investment in
Govt bonds 2023.126(e) 5 404.625 2.831 .015*
Investment in
lands 2741.143(f) 5 548.229 10.208 .000**
Intercept Investment in
shares 1241.456 1 1241.456 4.736 .030*
Investment in
real estate 2.489 1 2.489 .012 .912
Investment in
Gold 10447.977 1 10447.977 75.162 .000**

220
Source Dependent
Variable
Type III
Sum of
Squares
df Mean
Square F Sig.
Investment in
bank 10893.213 1 10893.213 64.562 .000**
Investment in
Govt bonds 21.241 1 21.241 .149 .700
Investment in
lands 1514.569 1 1514.569 28.201 .000**
General
informations
Investment in
shares 2322.564 1 2322.564 8.861 .003**
Investment in
real estate 2844.654 1 2844.654 13.828 .000**
Investment in
Gold 2342.439 1 2342.439 16.851 .000**
Investment in
bank 1011.898 1 1011.898 5.997 .015*
Investment in
Govt bonds 107.061 1 107.061 .749 .387
Investment in
lands 293.177 1 293.177 5.459 .020*
Company
management
Investment in
shares 13.601 1 13.601 .052 .820
Investment in
real estate 101.959 1 101.959 .496 .482
Investment in
Gold 291.202 1 291.202 2.095 .148
Investment in
bank 337.034 1 337.034 1.998 .158
Investment in
Govt bonds 692.267 1 692.267 4.843 .028*
Investment in
lands 26.321 1 26.321 .490 .484

221
Source Dependent
Variable
Type III
Sum of
Squares
df Mean
Square F Sig.
Details of
present values
Investment in
shares 77.867 1 77.867 .297 .586
Investment in
real estate 158.547 1 158.547 .771 .380
Investment in
Gold 864.583 1 864.583 6.220 .013*
Investment in
bank 8.884 1 8.884 .053 .819
Investment in
Govt bonds 180.865 1 180.865 1.265 .261
Investment in
lands 1047.146 1 1047.146 19.498 .000**
Project details
and their
Changes
Investment in
shares 1.543 1 1.543 .006 .939
Investment in
real estate 492.994 1 492.994 2.396 .122
Investment in
Gold 28.536 1 28.536 .205 .651
Investment in
bank 7.476 1 7.476 .044 .833
Investment in
Govt bonds 261.607 1 261.607 1.830 .176
Investment in
lands 403.619 1 403.619 7.515 .006**
Financial
parameters
Investment in
shares 89.543 1 89.543 .342 .559
Investment in
real estate 16.320 1 16.320 .079 .778
Investment in
Gold 1.353 1 1.353 .010 .921

222
Source Dependent
Variable
Type III
Sum of
Squares
df Mean
Square F Sig.
Investment in
bank 43.005 1 43.005 .255 .614
Investment in
Govt bonds 114.515 1 114.515 .801 .371
Investment in
lands 383.380 1 383.380 7.139 .008**
Error Investment in
shares 214414.429 818 262.120 -- --
Investment in
real estate 168276.565 818 205.717 -- --
Investment in
Gold 113707.579 818 139.007 -- --
Investment in
bank 138017.093 818 168.725 -- --
Investment in
Govt bonds 116922.960 818 142.938 -- --
Investment in
lands 43931.011 818 53.705 -- --
Total Investment in
shares 1169704.000 507 -- -- --
Investment in
real estate 434980.000 507 -- -- --
Investment in
Gold 268580.000 507 -- -- --
Investment in
bank 446400.000 507 -- -- --
Investment in
Govt bonds 206525.000 507 -- -- --
Investment in
lands 57969.000 507 -- -- --
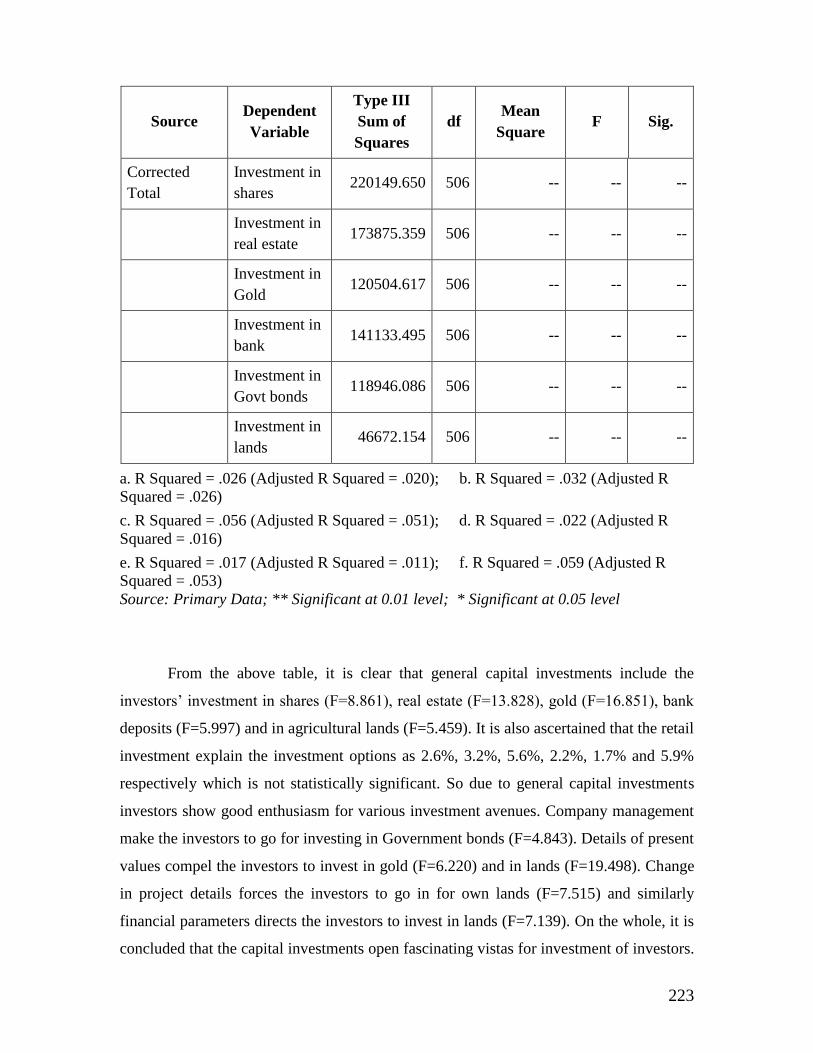
223
Source Dependent
Variable
Type III
Sum of
Squares
df Mean
Square F Sig.
Corrected
Total
Investment in
shares 220149.650 506 -- -- --
Investment in
real estate 173875.359 506 -- -- --
Investment in
Gold 120504.617 506 -- -- --
Investment in
bank 141133.495 506 -- -- --
Investment in
Govt bonds 118946.086 506 -- -- --
Investment in
lands 46672.154 506 -- -- --
a. R Squared = .026 (Adjusted R Squared = .020); b. R Squared = .032 (Adjusted R
Squared = .026)
c. R Squared = .056 (Adjusted R Squared = .051); d. R Squared = .022 (Adjusted R
Squared = .016)
e. R Squared = .017 (Adjusted R Squared = .011); f. R Squared = .059 (Adjusted R
Squared = .053)
Source: Primary Data; ** Significant at 0.01 level; * Significant at 0.05 level
From the above table, it is clear that general capital investments include the
investors’ investment in shares (F=8.861), real estate (F=13.828), gold (F=16.851), bank
deposits (F=5.997) and in agricultural lands (F=5.459). It is also ascertained that the retail
investment explain the investment options as 2.6%, 3.2%, 5.6%, 2.2%, 1.7% and 5.9%
respectively which is not statistically significant. So due to general capital investments
investors show good enthusiasm for various investment avenues. Company management
make the investors to go for investing in Government bonds (F=4.843). Details of present
values compel the investors to invest in gold (F=6.220) and in lands (F=19.498). Change
in project details forces the investors to go in for own lands (F=7.515) and similarly
financial parameters directs the investors to invest in lands (F=7.139). On the whole, it is
concluded that the capital investments open fascinating vistas for investment of investors.

224
The demographic variables of investors in some way affect their awareness of retail
investment.
5.26 Impact of Demographic Variables on the investment objectives, decision and
satisfaction.
The general multivariate linear model is used to find the impact of independent
demographic variables such as age, gender, marital status, educational qualification,
occupation, annual income, family members, dependents, house ownership and vehicle
ownership on the dependent variables factors of latest developments in capital market.
The individual impacts of all type of the demographic variables are presented in table -
5.86.
Table – 5.86: Impact of Demographic Variables on the investment objectives,
decision and satisfaction-Tests of Between-Subjects Effects
Independent
Variable
Dependent
Variable
Type III
Sum of
Squares
df Mean
Square F Sig.
Corrected
Model
Investment
objectives 2703.389(a) 10 270.339 14.383 .000**
Investment
satisfaction 688.234(b) 10 68.823 6.372 .000**
Facility
satisfaction 559.123(c) 10 55.912 11.229 .000**
Innovative
measures 208.500(d) 10 20.850 7.377 .000**
Problems 411.062(e) 10 41.106 5.610 .000**
Intercept
Investment
objectives 5784.901 1 5784.901 307.774 .000**
Investment
satisfaction 3855.162 1 3855.162 356.921 .000**
Facility
satisfaction 1572.120 1 1572.120 315.737 .000**
Innovative
measures 900.553 1 900.553 318.632 .000**

225
Independent
Variable
Dependent
Variable
Type III
Sum of
Squares
df Mean
Square F Sig.
Problems 2404.229 1 2404.229 328.118 .000**
Age
Investment
objectives 89.200 1 89.200 4.746 .030*
Investment
satisfaction 11.592 1 11.592 1.073 .301
Facility
satisfaction 34.923 1 34.923 7.014 .008**
Innovative
measures 14.130 1 14.130 5.000 .026*
Problems 7.022 1 7.022 .958 .328
Gender
Investment
objectives 22.322 1 22.322 1.188 .276
Investment
satisfaction 33.234 1 33.234 3.077 .080
Facility
satisfaction .762 1 .762 .153 .696
Innovative
measures 7.843 1 7.843 2.775 .096
Problems 35.445 1 35.445 4.837 .028*
Martial Status
Investment
objectives 28.386 1 28.386 1.510 .219
Investment
satisfaction .045 1 .045 .004 .949
Facility
satisfaction 26.692 1 26.692 5.361 .021*
Innovative
measures .364 1 .364 .129 .720
Problems 18.983 1 18.983 2.591 .108
Educational
Qualifications
Investment
objectives 23.534 1 23.534 1.252 .263
Investment
satisfaction 3.125 1 3.125 .289 .591
Facility
satisfaction 5.357 1 5.357 1.076 .300

226
Independent
Variable
Dependent
Variable
Type III
Sum of
Squares
df Mean
Square F Sig.
Innovative
measures 4.891 1 4.891 1.730 .189
Problems 84.528 1 84.528 11.536 .001**
Occupation
Investment
objectives 116.999 1 116.999 6.225 .013*
Investment
satisfaction 25.933 1 25.933 2.401 .122
Facility
satisfaction 29.747 1 29.747 5.974 .015*
Innovative
measures .362 1 .362 .128 .720
Problems 2.946 1 2.946 .402 .526
Annual
Income
Investment
objectives 1014.005 1 1014.005 53.948 .000**
Investment
satisfaction 82.041 1 82.041 7.596 .006**
Facility
satisfaction 257.483 1 257.483 51.712 .000**
Innovative
measures 25.697 1 25.697 9.092 .003**
Problems 38.907 1 38.907 5.310 .021*
Nature of
Family
Investment
objectives 168.022 1 168.022 8.939 .003**
Investment
satisfaction 160.850 1 160.850 14.892 .000**
Facility
satisfaction 52.974 1 52.974 10.639 .001**
Innovative
measures .301 1 .301 .107 .744
Problems 170.968 1 170.968 23.333 .000**
No. of
dependents
Investment
objectives 191.904 1 191.904 10.210 .001**
Investment
satisfaction 52.536 1 52.536 4.864 .028*

227
Independent
Variable
Dependent
Variable
Type III
Sum of
Squares
df Mean
Square F Sig.
Facility
satisfaction 27.323 1 27.323 5.488 .019*
Innovative
measures 13.845 1 13.845 4.899 .027*
Problems 26.191 1 26.191 3.574 .059
House
Ownership
Investment
objectives 16.594 1 16.594 .883 .348
Investment
satisfaction 139.010 1 139.010 12.870 .000**
Facility
satisfaction 26.083 1 26.083 5.238 .022*
Innovative
measures 1.338 1 1.338 .473 .492
Problems 61.304 1 61.304 8.367 .004**
Vehicle
Ownership
Investment
objectives 173.975 1 173.975 9.256 .002**
Investment
satisfaction 26.966 1 26.966 2.497 .114
Facility
satisfaction .108 1 .108 .022 .883
Innovative
measures 35.237 1 35.237 12.468 .000**
Problems 12.569 1 12.569 1.715 .191
Error
Investment
objectives 15093.152 803 18.796
Investment
satisfaction 8673.343 803 10.801
Facility
satisfaction 3998.298 803 4.979
Innovative
measures 2269.526 803 2.826
Problems 5883.842 803 7.327

228
Independent
Variable
Dependent
Variable
Type III
Sum of
Squares
df Mean
Square F Sig.
Total
Investment
objectives 918822.000 814
Investment
satisfaction 489622.000 814
Facility
satisfaction 230813.000 814
Innovative
measures 131623.000 814
Problems 311582.000 814
Corrected
Total
Investment
objectives 17796.541 813
Investment
satisfaction 9361.577 813
Facility
satisfaction 4557.421 813
Innovative
measures 2478.026 813
Problems 6294.904 813
a. R Squared = .152 (Adjusted R Squared = .141); b. R Squared = .074 (Adjusted R
Squared = .062)
c. R Squared = .123 (Adjusted R Squared = .112); d R Squared = .084 (Adjusted R
Squared = .073)
e R Squared = .065 (Adjusted R Squared = .054); Source: Primary Data
** - Significant at 0.01 level; * Significant at 0.05 level
The demographic variables of investors explain the dependent variables
investment objectives, investment satisfaction, facility satisfaction, innovative measures
and problems with the total variance of 15.2%, 7.4%, 12.3%, 8.4% and 6.5%
respectively.
It is found that the age of the investors predicts investment objectives
(F = 4.746), Facility satisfaction, (F = 7.014) and Innovative measures (F = 5.00). In

229
investment objectives the investors in the age group of 41-60 years (mean = 4.295) are
highly aware of investment objectives. Similarly the age group 41-60 are aware of facility
satisfaction and innovative measures.
Gender has its impact on problems (F = 4.837), especially the female investors are
aware of problems in capital market (mean = 4.03) than male investors (mean = 3.86).
The marital status of the investors explains facility satisfaction (F = 5.361). It is found
that the separated investors status concentrate more on facility satisfaction (mean = 4.23)
followed by married (mean = 4 .17) and unmarried (mean = 4.15).
Educational qualification predicts problems (F = 6.225). The graduate investors
(mean = 3.90) and diploma investors (mean = 3.92) are aware of innovative
developments in capital market.
Occupation of investors predicts investment objectives (F = 6.225) and facility
satisfaction (F = 5.974). Among these, occupation of the investors who are working as
government employees (mean = 4.28) followed by private employees (mean = 4.17)
concentrate more on these reforms. Income predicts all the latest development investment
objectives (F = 53.948), investment satisfaction (F = 7.596) and innovative measures (F =
9.092). In the case of investment objectives, the income group of 3 lakhs and above
investors alone (mean = 4.40) are aware of it. The investors with the annual income 2-3
lakhs (mean = 4.16) are aware of investment satisfaction; those with annual income of
above 3 lakhs are very much aware of facility satisfaction (mean = 4.39), innovative
measures (mean = 4.43) and finally the income group of 2-3 lakhs are aware of problems
(mean = 3.91).
The nature of family predicts investment objectives (F = 8.939), investment
satisfaction (F = 14.892) facility satisfaction (F = 10.639) and problems (F = 10.639). It is
also found that the investors in the nuclear family are aware of investment objectives
(mean = 4.20) than joint families. Similarly, the nuclear family investors are aware of
investment satisfaction (mean = 4.10), facility satisfaction (mean = 4.21) and problems
(mean = 3.93).

230
It is inferred that the number of dependents is considered as a very important
factor for investors to deal with the capital market the ownership of the house explains
the investors’ interest on investment satisfaction (F = 12.87) facility satisfaction (F =
5.238) and problems (F = 8.367). The investors with own house are showing special
enthusiasm on investment satisfaction (mean = 4.07), facility satisfaction (mean = 4.19),
and problems (mean = 3.89).
The ownership of vehicles predicts investment objectives (F = 9.26), and
innovative measures (F = 12.47). The investors with four wheelers are aware of
investment objectives (mean = 4.38) and those who do not possess the vehicles are drawn
by innovative measures (mean = 4.47). So, it is concluded that that all the demographic
variables of investors are related to investors in understanding the latest developments of
capital market. All the above observations have been explored in table - 5.86.
5.27 A MODEL OF INVESTMENT PATTERN IN STOCK MARKET
The present research ventured in identifying investment pattern of investors in
stock market. It ascertained through analysis of primary data of investors and under
pinned the exact the pattern of investment in stock market with regard to Chennai
geographical base. The primary data is analysed through the various statistical tools
factor analysis, cluster analysis, multiple regression analysis, analysis of variances, Karl
Pearson’s co-efficient of correlation and non-parametric chi-square analysis.
The analysis revealed socio-economic profile of investors is a basis for
ascertaining the investment profile. The multiple regression analysis is followed by
analysis of variance significantly identified that the investor’s socio-economic profile
desires their type, category, and type of market they invest.
The sequential analysis further revealed the investment profile reveals a
characteristics feature of investors through their investment preferences and objectives.
The analysis of variance with suitable ‘F’ value clearly proved the relationship between
investment profile, investment preferences and investment objectives. The inter

231
correlation between investment preferences and investment objectives identified their
existence of positive relationship between preferences and objectives.
The factor analysis found that investment decision is a composition of five pre-
dominant factors general information, company management, details of present issue,
project details and financial parameters. The overall relationship between the factors of
investment decision with preferences and objectives are established through significant
correlation co-efficient.
The factors of investment decision act as a basis for the formation of
heterogeneous groups of investors, similarly investment satisfaction and problems of
investors classify them into various heterogeneous groups. The mutual association among
investment decision, investment satisfaction and problems are significantly associated
through non-parametric chi-square analysis. This model profoundly concludes that the
research instrument used in the study is highly reliable is ascertained through this model.
This investment pattern of Chennai investors is identified through this model.
5.28 SUMMARY
In this chapter, factors influencing equity investors, investment satisfaction and
investors’ confidence of the retail equity investors have been assessed.

232
CHAPTER – VI
SUMMARY OF FINDINGS SUGGESTION AND CONCLUSION
INTRODUCTION
This chapter is intended to present the findings of the research and suitable
suggestions, profound conclusions and scope for further research.
The microscopic cross examinations of the primary and secondary data reveal the
following results. Primary and secondary data are explored completely to ascertain the
important factors of the study, to identify the reasons of investors for investing in retail
investment, impact of investment decision, relationship between financial sector reforms
and equity retail investment. The changes in the attitude of investors were noticed after
the latest developments in capital market in 1991. Now the investors possess greater
awareness through TV, newspaper and other sources of information. The transparency in
capital market is considered as one of the vital reforms that magnetically attracted the
investors and increased their number in retail investment. The classification of markets
paved way to the investors to select their own lucrative choice and make them to employ
various strategies to overcome the impediments in investment procedures.
6.2 MAJOR FINDINGS OF THE STUDY
6.2.1 OBJECTIVE ONE
To study the investment pattern of retail equity investors in Chennai.
A maximum percentage of 54.9% of investors are in the age group of 26 to 40
followed by the investors in the age group 41 to 60 which is 33.3%. Male investors are
more enthusiastic than females in equity shares investment.
It is identified that most of the investors are working in private concerns or
running their own business, that is 43% and 32.7% of investors are employed in private
or in their business concerns. The Government employees are not enthusiastic more in
equity shares.
It is found that 39.1% investors belong to the income groups of Rs. 1 - 2 lakhs and
26.6% investors have the income less then Rs. 1 lakh, 22.9% are in the income of groups
of Rs. 2 - 3 lakhs. The number of dependents and investment are inversely proportional to

233
each other. When the number of dependents is more in the family, they do not have
ample money for investment in this present economic situation.
It is found that 72% of the respondents establish themselves as both long term
investors and daily traders and 12.6%of them operate equity investment daily. Most of
the investors are having the experience in the securities market just below 5 years. The
young investors and educated persons now enter into the securities markets.
It is found that 74.1% of the respondents in Chennai invested in less than 10
companies and remaining 25.9% of them are attracted towards more than 10 companies
share market investment. 10.7 % of the respondents have an investment of less than Rs.
1, 00,000. The investment level of 35.4 % of the respondents is between Rs. 1, 00,000
and Rs. 2, 00,000. 23.5 % of them have an investment size which ranges from Rs.2,
00,000 to Rs. 3, 00,000.
The maximum number of investors invest own funds to obtain better returns. A
maximum of 64% of sample size are investing their fund out of their savings below 25%,
most of the investor are invest their money out of their saving below 25% of the surplus
money that they had.
6.2.2 OBJECTIVE TWO
To analyse the information search and investment option of retail investors.
A maximum of 77.6% of investors get the information about the securities market
through news papers followed by 66.4% of investors get the information through
television media, 56.5% of investors receive the information through the stock brokers.
A major percentage of the investors are getting the information through news
papers television and stock brokers. 49.6 percent of investors are investing their money
after analyzing the financial performance of the companies and only 0.5 percent of
investors are considering some other factors like present market condition and new
production strategies.

234
A maximum of 85.8 percent of investor are possessing experience in dealing their
investment forums followed by 14.2 percent of investor doesn’t have any experience with
the forum of investors. Most of the investors in Indian securities market are having the
knowledge about the malpractices done by the intermediaries and share brokers.
It is ascertained that a maximum of 82.1 percent of investors in securities market
are aware of the online trading and they buy and sell their equities followed by 17.9
percent of investors deal with offline trading. Majority of the investors in Indian
securities market are aware of the financial sector reforms made by the Government of
India.
42.9% of the investment decisions are taken based on sensex index and 31.9% of
the investors’ decisions are influenced by the index of Nifty. Most of the investor’s
decisions are influenced and taken by the observations of sensex index.
Newspaper plays a crucial role in identifying all the industries except IT industry.
It is found that the information through Journals and magazines is useful for investors to
invest in banking, manufacturing, textile and automobile industries. Banking, steel and
cement industry are concentrated by the investors with the help of information through
TV channels.
The stockbrokers give more information to the investors in selecting the industry.
The investment consultants significantly guide the investors to invest in banking, steel,
IT, manufacturing, textile and automobile industries. Web sites give profuse source of
information for investors about the performance of banking, cement, IT, pharma,
manufacturing, and automobile industries
6.2.3 OBJECTIVE THREE
To identify the various investment preferences and investors perception on
risk and return.
The most preferred investments are well established and the investors strongly
agree that the investment in capital market alone gives more returns with minimum

235
market risk. The investors prefer share market as most preferred investment followed by
fixed deposit, real estate, mutual funds, government bonds, gold and debentures in order
The investors invest their money safely in banks in the form of deposits and give
second preference to IT industry followed by cement and pharma industry. The investors
also concentrate more on the safety of their investments in banking sector.
All type of investors demand more returns with no risk. So they prefer share
market fabricated with minimal risk. It is found that the investors adopt the modes of
calculative, conservative, risk taking, impulsive and intuitive in the respective order.
The investors investing in secondary market give their first preference to NSE
followed by BSE and MSE respectively. The transparency about the performance of the
companies issuing the shares and continuous monitoring of central government and the
RBI raises the confidence among the investors besides the market risk. It is also found
that the investors are willing to invest their hard earned money to have lucrative returns
in the short span of time.
It is ascertained that a maximum of 59.2% of the investors expect to get return
below 12% of their investments followed by 19% of the investors prefer to invest 36 %
and above of their investments in equities.
6.2.4 OBJECTIVE FOUR
To examine factors influencing investment evaluation and decision of
investors.
The cluster analysis revealed that 42.16 percent investors express the opinion that
they moderately agree on all the elements of capital investments and remaining 57.54
percent investors strongly agree with the investments in equity shares

236
The investors accept equally about the investments in secondary market, project
details and their changes, and financial parameters. It is concluded that all the
investments are important and they reflect the investments of equity shares Investors’
opinion on investments can not be distinguished on their experiences with equity shares
dealings. The retail investments are totally spread over all the investors equally
independent of their number of years of dealings.
The investors invest their money in share market to accrue maximum benefits
before and after investments. The retail investment just induces the investors to invest in
share market, but the investors welcome any type of investments of equity shares with
better returns and absolutely no risk.
All the investors are aware of retail investment immaterial whether they invest in
shares or not. The updated information to the investors could be a more effective source
of information.
The investors who differ in their opinion of investing in Government Bonds also
differ in identifying the investments in equity shares. The investors are very much
attracted towards the primary and Details of present values, change of project details
investments and investments in financial parameters.
The investors are very much attracted towards change of project details
investments in equity shares and that in turn induces them to invest more in primary and
secondary markets. When the investors invest their money in gold they do not have more
knowledge about retail investment. The investors who are investing in gold are also
turning their concentration towards equity shares
Investors who concentrate on debentures are very much attracted towards general
information, Details of present values and financial parameters. They profoundly believe
that retail investments of above elements are really worthy of better returns.
The investors of mutual funds also possess a tendency to shift their investment
pattern towards equity shares. They feel that the same amount of risk is involved in

237
mutual funds and equity shares but in the case of returns the equity shares exceeds more
than the mutual fund.
The investors shift their concentration towards equity shares due to the latest
developments in Indian equity shares. They feel that they are able to get the same type of
returns as that of real estate within a short span of time.
The investors expect more returns, they differ in their views about general
informations, Details of present values and change of project details whereas they have
the same view on Company management and financial parameters.
It is inferred that when the investors expect liquidity from their investment, some
of them are highly aware of capital investments while some others do not. The investors
who invest their money for tax benefits are well aware of general information, Details of
present values, change of project details and financial parameters.
Company management and change of project details differ the investors
significantly in their perception of capital investments. The investors who are influenced
by the TV channels have high awareness on Details of present values and financial
parameters.
The investors want to invest in both the markets and the secondary market is more
popular among the investors than the primary market. There is a association between
preference of investment in equity shares and cluster of awareness on retail investment.
The investors decide to invest in primary market and secondary market after knowing the
capital investments only the investors
The general information in equity shares does not have any impact on investors to
invest certain percentage in primary and secondary markets. Company management
induce the investors to invest a considerable percentage of their money in share market.
The change of project details and financial parameters do not have any impact on
investors to invest funds in share market.

238
It is inferred that there is an association between criterion for investment and
cluster of awareness of capital investments. The investors are all well aware that the
capital investments giving certain specific criteria for the investment procedure.
6.2.5 OBJECTIVE FIVE
To evaluate investors level of satisfaction and their futuristic perceptions
towards retail equity investment.
It is found that the investors of equity market are distributed into three groups on
the basis of investment pattern prevailing in India. The first group consists of 6.11
percent investors with minimum awareness on equities and 63.12 percent with high
awareness on equity investments.
Equity investments have affected the investment in the banking sector. More
number of investors is enthusiastic in venturing into equity shares pertaining to banking
sector. The investors have the knowledge about company management before they invest
in FMCG sector.
General information, company management, and details of present values, change
of project details and financial parameters significantly affect the investment in pharma
sector and PSE sector retail investment.
The degree of awareness and knowledge about retail investment has enabled the
investors for making meaningful investment decisions in MNC sector. It is also found
that change of project details does not have any impact on investment in IT sector
The general information affects the investment in manufacturing sector. The
investors find a scope for their investment in manufacturing sector after general capital
investments. Other details do not have any role to play with manufacturing sector.
General information, Company management, Details of present values, change of
project details and financial parameters affect the investment in service sector. The
investors are drifting towards service sector after obtaining the details of investment.

239
There is no association between extensive of risk and awareness of retail
investment. The investors are very much aware of risks involved in investing in equity
shares, because it depends upon the performance of firms.
It is inferred that different reasons for preference of stock exchange arise due to
retail investment. There is no association between dealing with electronic shares and
elements of retail investment.
The investors are very much attracted by share market after understanding the
attractive financial sector reforms. The transparency about the performance of the
companies issuing the shares.
Facility satisfaction does not create an impact on instruments and their changes.
Innovative measures have good impact on all elements of capital reforms, except
financial parameters. Problems create deep impact on capital market reforms, primary
market reforms secondary market reforms, instruments and their changes, but it does not
predict financial parameters.
The equity investment has predicted good impact on reforms in capital market.
Collectively the equity investments aim at reforming primary and secondary market.
Positive changes in the instrument and better returns to the investors prevail in the equity
market.
The investors are also exploring the avenues like real estate, gold investment and
government bonds to get more returns with less risk. There is no significant relationship
between the number of years in dealing with capital market and equity investment, some
investors are continuously investing in capital markets with their perception about the
developments in capital market. They feel it is an advantage for their investment.
Investment objectives and facility satisfaction severely affect the investor’s decision to
decide the percentage of investment in share market.

240
6.2.6 OBJECTIVE SIX
To find the relationship between demographic variables of investors and
their investment objectives, decision and satisfaction.
In this moderate awareness cluster age, gender, annual income and vehicle
ownership of investors pave the way to know about general capital investments. The high
awareness of investors is achieved through their age, marital status occupation, no. of
dependents and percentage of investment.
In this moderate awareness group of investors, nature of family and vehicle
ownership help them to acquire knowledge about company management. It is concluded
that the nature of family decides the investor’s awareness on the company management.
The annual income, no of dependents and vehicle ownership are useful for the
investors to know the company management. It is concluded that income, vehicle
ownership and number of dependents explain the awareness of investors on company
management.
Age, nature of family, and house ownership create a good impact on details of
present values. In moderate awareness, clusters, the equity market awareness can be
observed by the investors using their age, nature of family and house ownership.
The investors with high awareness on retail investment are able to initiate more
ideas of details of present values through age alone. Genders, income, ownership of the
house explain the awareness of investors on changes of project details. The gender,
income and ownership of the house decide their high awareness on details of present
values.
The marital status and income of the investors decide them to possess moderate
awareness on change of project details. The marital status, occupation, income and house
ownership of investors pave the way for them to understand the financial parameters. The
moderate awareness on financial parameters can be obtained through the marital status,
occupation, income and house ownership of the investors.

241
The high awareness on financial parameters of investors is decided by their
occupation and the number of dependents in the family. The investors show good
enthusiasm for various investment avenues. Company management makes the investors
to go for investing in Government bonds. Details of present values compel the investors
to invest in gold and in lands. Change in project details forces the investors to go in for
own lands and similarly financial parameters direct the investors to invest in lands.
It is found that the age of the investors predicts investment objectives,
Facility satisfaction, and Innovative measures. In investment objectives the investors in
the age group of 41-60 years are highly aware of investment objectives. Similarly the age
group 41-60 are aware of facility satisfaction and innovative measures.
Gender has its impact on problems, especially the female investors are aware of
problems in capital market than male investors. The marital status of the investors
explains facility satisfaction. It is found that the separated investors status concentrate
more on facility satisfaction followed by married and unmarried.
Educational qualification predicts problems. The graduate investors and diploma
investors are aware of innovative developments in capital market.
Occupation of investors predicts investment objectives and facility satisfaction.
Among these, occupations of the investors who are working as government employees
followed by private employees concentrate more on these reforms. In the case of
investment objectives, the income group of 3 lakhs and above investors alone are aware
of it. The investors with the annual income 2-3 lakhs are aware of investment
satisfaction; those with annual income of above 3 lakhs are very much aware of facility
satisfaction, innovative measures and finally the income group of 2-3 lakhs are aware of
problems.
The investors in the nuclear family are aware of investment objectives than joint
families. Similarly, the nuclear family investors are aware of investment satisfaction,
facility satisfaction and problems.

242
It is inferred that the number of dependents is considered as a very important
factor for investors to deal with the capital market. The investors with own house are
showing special enthusiasm on investment satisfaction, facility satisfaction, and
problems. The investors with four wheelers are aware of investment objectives and those
who do not possess the vehicles are drawn by innovative measures.
6.3 SUGGESTIONS
Based on the study, the following suggestions have been made.
The transparency must be made about the companies and their performance so
that the investors can decide their investment on suitable shares.
Corporate governance has to be implemented in all stock exchanges.
Innovative technologies like integration of stock exchanges, demat, online
trading, creation of development of web pages must be brought in capital markets
for its growth and to attract the educated investors.
Strategies like hedging, index futures must emerge in capital market to reduce the
market risk, provisions must be made to return at least the principal amount of
investors.
Strategies must be employed to encourage women investors. Awareness
programmes has to conduct in all places.
The competitions of capital market have come from instructional investors like
mutual funds and real estate. So the companies must be careful enough in issuing
their shares.
Transparency must be made both in primary market and secondary market equally
to help the investors to get their capital.

243
Shares, Debentures and bonds are familiar to urban investors. But their
counterparts in rural areas do not know anything about them.
Investors are the hub of the capital market. Their satisfaction is the most
important. So it should be done by providing safety, return and liquidity for their
investments.
Capital market should create a higher level critical factors involved for making
investment decisions.
Companies should provide information/education to investors at large with
detailed data including the role of SEBI to make them smart.
Regarding capital market more journals, newspapers and TV media have to reach
the investors.
The investors should be allowed an opportunity to trade in International Stock
Exchanges.
As far as the capital market is concerned research carried out is very less. So,
SEBI and other agencies should provide assistance to carryout advance research
in this area.
Credit rating agencies should rate the equities and mutual funds for the benefit of
the investors.
SEBI and other intermediaries should tap the rural investors by conducting
awareness programme exclusively for them.
6.4 IMPLICATION OF THE STUDY
This study would be of immense help to managers, particularly, financial
managers who take decisions regarding investment and investors’ attitude towards share
market. The study will help investment consultants in identifying the investment avenues.
The credit rating agencies can use the information for their investment rating. Investor’s

244
preference for equity retail investment will help policy makers in formulating strategies.
The study helps for timing and type of instruments for new issues in retail investment.
Stock exchanges can introduce technological advancement in trading. In short, this piece
of research work has become quite friendly to all the three groups of players in the capital
market viz. the investors, issuers and the intermediaries.
6.5 SCOPE FOR FURTHER RESEARCH
Based on the study done by the researcher, the following suggestions are identified
for further research.
Since the present study is at a regional level, it could be extended to state and
national level.
The impact of retail investment in capital market may be studied in view of rural
investors.
The study may further be carried out to analyse the impact of reforms on the
functioning of stock exchanges.
A study on the awareness of women investors about retail investment pattern
could be attempted.
Implications of internet stock trading in India can be taken up for study.
Impact of technological innovation in capital markets can be studied.
6.6 CONCLUSION
Indian retail investment in share market has now grown into a great material
market with a lot of qualitative inputs and emphasis on investors’ protections and
disclosure norms laid down. The market has become automated, transparent and self-
driven. It has integrated with global markets with Indian companies seeking listing on
foreign stock exchange, off shore investments coming to India and foreign mutual funds
floating their schemes and thus bringing expertise in to our markets. India has achieved
the distinction of possessing the largest population of investors next to the U.K. Perhaps
ours is the country to have the largest number of listed companies with around 19
Regional Stock Exchanges and National Stock Exchanges most of them automated. India

245
now has world class regulatory system in place. Thus at the dawn of the new millennium,
stock market increased the wealth of Indian companies and investors. No doubt strong
economic recovery, upturn in demand, improved market structure, etc. have been the
driving forces.
Further, financial services sector is considered to be the nuclear of the growth
model designed for the economic development of our vast country. Financial services and
markets constitute significant components of the financial system. Development and
reforms in this field are inevitable for the growth of our developing economy.
Accordingly, a lot of financial reforms have been made as and when required for the
welfare of the investors and the institutions.
The investors of to-day are more rapidly informed than their predecessors of
yesterday. So they are better informed and better treated. They want to be secure when
they aspire to become rich, wanted to save while they are tempted to spend, want to feel
the joy of pride and avoid the pain of regret. However every agency in the capital market
should plan their strategies for profit to investors on a long term basis. The potential
investor must be properly educated and guided in a manner that more idle resources or
invested in other avenues will be diverted to capital market. Increase in GDP (9%) raising
of sensex around 20,000 more participation of MNCS with their FDI results in the
progress of Indian economy and awareness of the prudent Indian investors. If and when
all financial reforms are inflated, the Indian capital market will not only be on par with
developed capital markets of the world, but also will become the paradise for investors.
Conclusively the quantum of retail investment increased rapidly as well as enormously,
liberalization continues to blow retail market investment by adapting itself to new
procedures practices and patterns with the entry of various players in the market; it is
poised to achieve unprecedented levels of growth in the near future.

246
REFERENCES
I. BOOKS
1. Ackoff, Russell L.,“The design of Social Research,” Chicago: University of
Chicago Press, 2010.
2. Agarwal R.N, “Financial Liberalization in India: Banking system and stock
Markets”, Delhi: D.K. Publishers, 2010.
3. Amling Frederick., Investments:“An introduction to Analysis and Management”
Englewood Cliffs, N.J: Prentice Hall, Inc., 2011.
4. Anderson, H.H., and Anderson, G.L., “An Introduction to Projective Techniques
and Other Devices for Understanding the Dynamics of Human Behaviour,” New
York: Prentice Hall, 2006.
5. Anderson, T.W., “An Introduction to Multivariate Analysis,” New York: John
Wiley & Sons, 2007.
6. Avadhani V.A., “Investment and Securities Markets in India: Investment
Management” Bombay: Himalaya Publishing House, 2008.
7. Babson T.E and Balson D.L., “Investing for Successful Future” New York: The
Macmillan Company, 2009.
8. Badger R.E., and Coffman P.B., “The Complete Guide to Investment Analysis”
New York: McGraw – Hill Book company, 2010.
9. Bailey, R. (2005), “The Economics of Financial Markets”, Cambridge
University Paris.
10. Ball R.E., “Readings in Investments” Baston: Allyn & Bacon, Inc.2005.

247
11. Batra G.S and Chawla A.S., “Indian Capital Markets in Transition” New Delhi :
Deep and Deep Publications, 2008.
12. Berdie, Douglas R., and Anderson, John F., “Questionnaires: Design and Use,”
Metuchen N.J. : The Scarecrow Press, Inc., 2007.
13. Berelson, Bernard, “Content Analysis in Communication Research,” New York :
Free Press, 2006.
14. Berenson, Conard, and Colton, Raymond, “Research and Report Writing for
Business and Economics,” New York : Random House, 2011.
15. Bhalla.V.K., “Investment Management”, New Delhi : S.Chand & Company Ltd,
2008.
16. Bhattacharya, Srinibas, “Psychometrics & Behavioural Research”, New Delhi :
Sterling Publishers Pvt. Ltd., 2010.
17. Boot, John C.G., and Cox, Edwin B., “Statistical Analysis for Managerial
Decisions,” New Delhi : Mc Graw – Hill Publishing Co. Ltd., (International
Student Edition), 2008.
18. Borland C.C., “The common stock theory of Investment” New York : The Ronald
Press company, 2010.
19. Boyer J.N., “Investment Analysis and Management” Homewood : Richard &
Irwin, Inc, 2008.
20. Brealey R.A., “An Introduction to Risk and Return on Common Stocks”
Cambridge, Mass: M.I.T. Press, 2009.
21. Chance, William A., “Statistical Methods for Decision Making,” Bombay: D.B.
Taraporevala Sons & Co. Pvt. Ltd., 2005.

248
22. Chandra, Prasanna., “The Investment Game”, New Delhi: Tata McGraw Hill
Publishing Company Ltd, 2010.
23. Clendenin J.C., “Introduction to Investments” New York : McGraw Hill Book
company, Inc. 2011.
24. Cohen J.B., and Zinbarg E.D., “Investment Analysis and Portfolio Management”
Homewood, III : Richard D. Irwin, Inc.2010.
25. Cooley, William W., and Lohnes, Paul R., “Multivariate Data Analysis,” New
York : John Wiley & Sons., 2008.
26. Deming, W. Edwards., “Sample Design in Business Research,” New York : John
Wiley & Sons., Inc., 2006.
27. Dennis, Child, “The Essentials of Factor analysis,” New York : Holt, Rinehart
and Winston, 2007.
28. Donald E. Fischer and Ronald J. Jordan., “Security Analysis and Portfolio
Management” Englewood Cliffs, Prentice – Hall, Inc.2008.
29. Dougalll H.E., “ Investments” Englewood cliffs, Prentice Hall, Inc.2009.
30. Festinger, Leon and Katz, Daniel (Eds.), “Research Methods in the Behavioral
sciences”, New Delhi : Amerind Publishing Co. Pvt. Ltd., Fourth Indian Reprint,
2006.
31. Fredrikson E.B., “Frontiers of Investment Analysis” Scranton: International Text
book company, 2005.
32. Fruchter, Benjamin, “Introduction to Factor Analysis,” Princeton, N.J.: D. Van
Nostrand, 2005.
33. Gatner, Elliot S.M., and Cordasco, Francesco, “Research and Report Writing,”
New York: Barnes & Noble, Inc., 2006.

249
34. Glock, Charles Y., “Survey Research in the Social Sciences,” New York: Russell
Sage Foundation, 2007.
35. Gopal, M.H., “An Introduction to Research Procedure in Social Sciences”,
Bombay: Asia Publishing House, 2004.
36. Gordon E. and Natarajan.K., “Capital Market in India”, Mumbai: Himalaya
Publishing House, 2000.
37. Graham Benjamin., “The Intelligent Investor” New York: Harper & Row,
Pulishers,2005.
38. Hayes, D.A. “Investments Analysis and Management” New York : The
Macmillan Company, 2006.
39. Hyman, Herbert H., et al., “Interviewing in Social Research,” Chicago:
University of Chicago Press, 2005.
40. Kahn, Robert L. and Cannell, Charles F., “The Dynamics of Interviewing,” New
York : John Wiley & sons, 2007.
41. Kerlinger, Fred N., “Foundations of Behavioral Research,” 2 nd ed., New York :
Holt, Rinehart and Winston, 2008.
42. Lazersfeld, Paul F., “Evidence and Inference in social Research,” in David
Lerher, “Evidence and Inference,” Glencoe : The Free Press, 2009.
43. Levin, Richard I., “Statistics for Management,” New Delhi : Prentice – Hall of
India Pvt. Ltd., 2009.
44. Loeb G.R., “Checklist for Buying Stock” New York : Simon & Schuster Inc.,
2010.
45. Nie. N.H., Bent, D.H., and Hull, C.H., “Statistical Package for the Social
Sciences,” New York : McGraw – Hill, 2008.

250
46. Payne, Stanley, “The Art of Asking Questions,” Princeton: Princeton University
Press,2011
47. Pickett R.R., and Ketchum M.D., “Investment Priciples & Policy” New York :
Hoper and Row Publishers, 2005.
48. Prime J.H., “Investment Analysis” Englewood cliffs, N.J. Prentice Hall,
Inc.,2006.
49. Rajkapila and Mahesh Duliani., “Manual of SEBI ( ed),” New Delhi: Bharat Law
House Pvt. Ltd, 2007.
50. Ralph E. Badger, Harold Torgerson and Harry G. Guthmann “Investment
Principles and Practice” Englewood Cliffs N.J. Prentice Hall, Inc.,2008.
51. Roscoe, John T., “Fundamental Research Statistics for the Behavioral Sciences,”
New York : Holt, Rinehart and Winston, Inc., 2009.
52. Sadhu, A.N., and Singh, Amarjit, “Research Methodology in Social Sciences,”
Bombay: Himalalya Publishing House, 2010.
53. Saroja.S.,(Ed), “Emerging Trends in the Capital Market in India” New Delhi :
Global Business press, 2000.
54. Shah. A and Thomas. S, “Developing the Indian Capital Markets” in J.A.
Hanson and S.Kasthuria, eds, “A Financial sector for the Twenty first century”,
India: Oxford University Press, Chapter 71, PP.2025 –265
55. Shanbhag A.N., “In the Wonder Land of Investment”, ‘Bombay’ Popular
Prakashan, 2011.
56. Sharma, B.A.V., et al ., “Research Methods in Social Sciences,” New Delhi :
Sterling Publishers Pvt. Ltd ., 2008.

251
57. Shirin Rathore, Muneesh Kumar, Amitabh Gupta, “Indian Capital Market – An
Empirical Study”, New Delhi: Anmol publications Pvt. Ltd., Cover page.
58. Siegel, S., “Nonparametric Statistics for the Behavioral Sciences,” New York :
McGraw – Hill Publishing Co., Inc., 1956.
59. T.P.Madusoodanan., “Indian Capital Markets – Theories and Empirical
Evidence” (ed), Mumbai : Quest Publications, 2000.
60. Tandon, B.C., “Research Methodology in Social Sciences,” Allahabad :
Chaitanya Publishing House, 2009.
61. Torgerson. W., “Theory and Methods of Scaling,” New York : University of
Chicago Press,2009.
62. Tushar Waghmare., “The Future of Indian stock Market”, (ed), New Delhi: Tata
McGraw – Hill Publishing Company, 2000.
63. Uma & Arumugam., “Indian Capital Market – Trends & Dimension” (ed), New
Delhi: Tata McGraw Hill Publishing Company, 2008.
64. Vanchorne, James C., “Financial Management and Policy”, New Delhi: Prentice
Hall of India Private Ltd, 2004.
65. Wilkinson, T.S. and Bhandarkar, P.L., “Methodology and Techniques of social
Research,” Bombay: Himalaya Publishing House, 2009.
66. Willemsen, Eleanor Walker, “Understanding Statistical Reasoning,” San
Francisco: W.H. Freeman and Company, 2004.
67. William F.Sharpe and Gardon J.Alexander, “Investments” Englewood Cliffs,
Prentice Hall, Inc. 2010.
68. Wu, H.K and Zakon A.J., “Elements of Investments” New York: Holt, Rinehart &
Wiaston, Inc. 2008.

252
II. JOURNALS AND PERIODICALS
1. Agarwal R.N, “Financial Liberalization in India: Banking system and stock
Markets”, Delhi: D.K. Publishers, 2006.
2. Ai Jun Hou, “EMU Equity markets’ return variance and spill over effects from
short-term interest rates,” Department of Economics, Lund university, Sweden,
working paper 2009 PP: 1-35.
3. Alexander L Jungquist and Matthew Richardson, “The investment Behaviour of
Private Equity Fund managers,” Nyvistern, New York University, Leonard N.
Stern School of Business, Department of Finance, Working paper series, 2008,
PP: 1-38.
4. Alexandra Dawson, “Investigating Decision-making criteria of private Equity
investors in family firms,” Bocconi University, working paper, 2010, PP: 1-12.
5. Alok Kumar, “Who Gambles In the Stock Market? University of Notre Dame,
Mendoza college of Business, IN 46556, PP: 1-53.
6. Andreas Kemmerer and Tom Weidig, “Reporting value to the private Equity
Fund investor,” University of Frankfurt, working paper, 2006, PP: 1-49.
7. Arvid OI Hoffmann and wander Jager, “The effect of Different needs, Decision-
making processes and Network-Structures on investor Behavior and stock market
Dynamics: A simulation Approach”, The ICFAI Journal of Behavioral Finance,
June 2008 PP: 49-64.
8. Bajpai G.N, “Indian Securities Markets – New Bench Marks”, SEBI Bulletin,
Vol.1, No.8, August 2010, pp: 5-14.
9. Bajpai G.N., “Developments of capital Markets in India”, cited at London School
of Economics on 2nd October 2006, www.sebi.gov.in

253
10. Bandgar, P.K, “A study of Middle Class Investor’s Preferences for Financial
Instruments in Greater Bombay”, Finance India, Vol. XIV. No.2, 2010, pp: 574-
576.
11. Batni Raghavendra Rao, “Exchange Traded Funds – the cardinal investment
option in turbulent times,” The Management Accountant ICWAI Journal, Vol.44
No. 6, June 2009, PP: 464-467.
12. Bloomfield, Robert J, Libby, Robert and Nelson, Mark W., “Confidence and the
Welfare of less Informed Investors”, Social Science Research Network, 2008.
13. Brimberg J., P. Hansen, G. Laporte, N. Mladenovic and D. Urosevil, “ The
Maximum return-on- investment plant location problem with market share,”
Journal of the operational Research society Vol. 59 No. 3 2008 PP: 399-406.
14. Charles Lee, M.C and Balakrishna Radhakrishna, “Inferring Investor Behaviours:
Evidence from TORQ data”, Journal of Financial Markets, Vol. XVI, 2010, pp: 83-
111.
15. Chattopadhyay P. “Retail investors in IPO subscription”, The Management
Accountant ICWAI Journal Vol.45, No. 3, March 2010, PP: 194- 198.
16. Chopra V. K, “Investor Protection: An Indian Perspective”, SEBI Bulletin, Vol.4,
No.11,Nov 2008, pp: 11-15.
17. Chopra V.K, “Capital Market Reforms in India: Recent Initiatives”, SEBI
Bulletin, Vol.4, No. 11, Nov 2008, pp: 7-11.
18. Costanza Consolandi, Ameeta Jaiswal-Dale, Elisa Poggiani and Alessandro
Vercelli,
19. Damodharan.M, “Capital Market in India: A country Profile”, SEBI bulletin,
Vol.3, No.11, Nov2005,P 5

254
20. Dan Palmon and Fred Sudit,”Shareholders’ defensive security Shares”,
International Journal of Disclosure and Governance Vol.4, 3, Palgrave Macmillan
Ltd, 2007 PP: 195-203.
21. David R. Gallagher, “Investment manager characteristics, strategy, top
management changes and fund performance”, Research paper School of banking
and finance, The university of new south wales, Sydney N.S.W. 2052, Australia
(2011) PP 1-52.
22. Deborah Tan and Julia Henker,”Idiosyncratic volatility and Retail Investor
Preferences in the Australian Market,” The Australian School of Business,
University of New South Wales working paper 2010, PP: 1-55.
23. Dechow, Patricia, Hutton, Amy and Sloan, Richard part 5, “Mastering Finance”,
Business standard’s 12 part series on corporate finance Financial Markets and
Investment Management, New Delhi, 2011.
24. Diptendu simlai,” An Inquiry into the origion and Growth of the modern capital
market in India,” The Management Accountant ICWAI Journal Vol.44.No.3
March 2009 PP: 205-209.
25. Eva Hofmann, Erik Hoelzl and Erich Kirchler, “A comparison of models
describing the impact of moral decision making on investment decision”, Journal
of Business Ethics, Vol. 82, 2008, PP: 171-187.
26. Fama E, “Efficient Capital Markets: II”, Journal of Finance, Vol. XLVI(5),
PP.1575-1617
27. Feldstein, Martin S., Yitzhaki, Shlomo, “Are high income individuals better stock
market investors?” nber w0948, 2000.
28. Gangadhar V. and G. Naresh Reddy, “The Impact of Foreign Institutional
Investment on Stock Market Liquidity and Volatility in India”, The Management
Accountant ICWAI Journal Vol. 43, No. 3, March 2008, PP: 179-84.

255
29. Gerben de zwart, Brian Frieser and Dick van Dijk, “A recommitment strategy for
long term private equity fund investor,” ERIM report series research in
management, ERS – 2007-097 – F&A, 2007, PP: 1-46.
30. Global standards and ethical stock indexes: The case of the Dow Jones
sustainability Stoxx Index”, Journal of Business Ethicks Vol.87. 2008, PP: 185-
197.
31. Gnana Desigan C, Kalai Selvi S, Anusya L, “Women Investors Perception
Towards Investment – An Empirical study”, Indian Journal of Marketing, Vol.
XXXVI, No. 4. April 2006, pp: 14-37.
32. Gupta L.C, Naveen Jain and Team, “Indian Household Investors Survey-2004”,
Society for Capital Market Research and Development”, (2004), Delhi.
33. Hall, John.H., “Do brokers buy, hold and sell recommendations of value to
individual investors ?”, University of Pretoria, working paper series, 2002.
34. Henry L. Petersen and Harrie Vreden burg, “Morals or Economics? Institutional
Investor Preferences for Corporate Social Responsibility,” Journal of Business
Ethics Vol. 90, 2009, PP: 1-14.
35. Hong Kong Exchanges and clearing Ltd (HKEx), (2001-02), “Derivatives Retail
Investor Survey (DRIS)”.
36. HorstRaff and Michael J.Ryan, “Firm-Specific Characteristics and the Timing of
Foreign Direct Investment Projects”, Review of world Economics Vol. 144 (1)
2008, PP: 1-32.
37. Ibid.,
38. Indian Securities Market – A Review: 2005, National Stock Exchange
publication, Vol.VIII, P.5.

256
39. Indian Securities Market – A Review: 2009, National Stock Exchange
publication, PP.15.
40. Iran Peacock and Stuart Cooper, “Private equity: implications for financial
efficiency and Stability,” Bank of England quarterly Bulletin, February 2000, PP:
69-76.
41. Jaspal singh and subhash chander, “Investors’ preference for Investment in mutual
Funds: An Empirical Evidence,” The ICFAI Journal of Behavioral Finance,
March 2006 PP: 7-17.
42. John R. Graham, Alokkumar, “Do Dividend Clienteles Exist? Evidence on
Dividend Preferences of Retail Investors”, The Journal of Finance, Vol. 61,
Issues 3, June 2006, pp: 1305-1336.
43. Jones Nilsson, “Investment with a Conscience: Examining the Impact of Pro-
Social Attitudes and Perceived Financial Performance on Socially Responsible
Investment Behavior,” Journal of Business Ethics, Vol. 83, 2007, PP: 307-325.
44. Julan Du, “heterogeneity in investor confidence and asset market under-and
overreaction”, The ICFAI Journal of Behavioral Finance, June 2004, PP: 55-85.
45. Kameswari, “Foreign Direct Investment and its role in Developing Indian
Economy,” The Management Accountant ICWAI Journal Vol. 43 No.7 July 2008
PP: 510-517.
46. Kavitha Ranganathan, “A study of fund selection behavior of individual investors
towards mutual funds: With reference to Mumbai city”, The ICFAI University
Journal of Behavioral Finance,Vol. III, No. 2, 2008, PP: 63-88.
47. Kenneth A.Froot and Tarun Ramadorai, “Institutional portfolio Flows and
international investments,” The Review of Financial studies Vol. 21 No.2, 2008
PP: 1-36.

257
48. Kuntluru S. and Md. Akbar Ali khan, “Financing pattern of foreign and Domestic
owned Pharmaceutical companies in India”, The management Accountant ICWAI
Journal Vol. 44 No.12 December 2009 PP: 984 – 991.
49. Larry D. Wall, “On investing in the Equity of small firms”, Journal of small
Business management 2007 45 (1) PP: 89-93.
50. Levine, Ross and S. Zervos, “Stock Market Development and Economic Growth”,
The World Bank Economic Review, Vol.1012, PP.323-339, 2008.
51. Lieven Baele,” Olivier De Jonghe and Rudi vander Vennet, “Does the Stock
Market value bank diversification? “ Federal public planning service science
policy, inter university Attraction 2005 PP: 1-27.
52. M.Raja and J.Clement sudhahar,” An Empirical test of Indian Stock Market
Efficiency in Respect of Bonus Announcement”, Asia pacific Journal of Finance
and Banking Research Vol.4 No.4, 2010 PP: 1-14.
53. Mahabaleswara Bhatta H.S. “Behavioral Finance- A discussion his individual
investor biases”, The Management Accountant ICWAI Journal Vol.44, No. 2,
February2009, PP: 138-141.
54. Malcolm Baker and Jeffrey Wurgler, “A Catering Theory of Dividends,” The
ICFAI Journal of Behavioral Finance, Vol.59, Issue 3, 2008 PP: 32-60.
55. Mamunur Rashid1 and Md. Ainun Nishat, “satisfaction of retail investors on the
structural efficiency of the market: Evidence from a developing country context,”
Asian Academy of management Journal, Vol. 14, No. 2 , July 2009, PP: 41-64.
56. Manish Mittal and R K Vyas, “personality type and investment choice: An
empirical study”, The ICFAI University Journal of Behavioral Finance, Vol. V,
No. 3, 2008, PP: 6-22.

258
57. Marcela Meirelles Aurelio, “Going Global: The changing pattern of U.S.
Investment Abroad,” Economic – Federal Reserve Bank of Kansas city Vol.93
No.3, Third quarter 2006 PP: 5-33.
58. Maria May seitanidi, “Intangible economy: how can investors deliver change in
business? Lessons from non profit business partnerships”, Management Decision
Journal, Emerald Group publishing limited Vol.45 No.5 2007 PP: 853-865.
59. Mark Grinblatt, Matti Keloharju, “The Investment Behaviour and Performance of
Various Investor Types: Study of Finland’s unique Data set”, Journal of Financial
Economics, Vol. 55, 2010, pp: 43-67.
60. Maruthu Pandian P, Benjamin Christopher S, “A study on Equity Investor
Awareness”, Doctoral Dissertation at Bharathiar University, 2011.
61. Masashi Toshino and Megumi suto,” Cognitive biases of Japanese institutional
investor’s consistency with behavioral finance,’ The ICFAI Journal of Behavioral
Finance, March 2008 PP: 7-18.
62. Meenu Verma, “Wealth management and behavioral finance: The effect of
demographics and personality on investment choice among Indian investors”, The
ICFAI University Journal of Behavioral Finance, Vol. V, No. 4, 2008, PP: 31-57.
63. Meir Statman, Steven Thorley and Keith Vorkink, “Investor overconfidence and
Trading volume,” The Review of Financial studies Vol.19, No. 4 , 2006, PP:
1531- 1565.
64. Michael J. Robinson and Thomas J. Cottrell, “Investment patterns of informal
investors in the Alberta private Equity Market,” Journal of small Business
Management Vol. 45, No. 1 PP: 47-67.
65. Michael Kaestner, “investors’ Misreaction to unexpected earnings: evidence of
simultaneous overreaction and under reaction,” The ICFAI Journal of Behavioral
Finance, March 2008, PP: 32-42.

259
66. Ming Dong, Chris Robinson and Chris veld, “Why individual investors want
dividends,” The ICFAI Journal of Behavioral Finance, Vol. III, No. 2, 2007, PP:
27-62.
67. Minh Quang Dao, “The impact of investment climate indicators on Gross capital
formation in developing countries,” Eastern Illinois university, USA, working
paper, 2007, PP: 1-10.
68. Mohammad Salahuddin and Md. Rabiul Islam,” Factors affecting investment in
developing countries: A panel data study,” South east university Bangladesh,
working paper, 2009, PP: 21-37.
69. Mohanty B.K. “Market capitalization: A suitable growth approach for share
holders’ value creation”, The Management Accountant ICWAI Journal Vol.43,
No. 8, August 2008, PP: 398-401.
70. Nagarajan R.“Green shoe option in IPO”, The Management Accountant ICWAI
Journal Vol.40, No. 5, May 2008, PP: 398-401.
71. Narendra Jadhav, “Development of Securities Market – The Indian Experience”,
Association for Financial Professionals (AFP), Annual conference, session: 30
2009, PP: 1-34.
72. Nissim Ben David, “An indicator for internalization of analyst’s
recommendations by investors, “The ICFAI University Journal of Behavioral
Finance Vol. V, No. 3, 2008, PP: 23-35.
73. NSE-Fact book: 2006, www.nseindia.com,p.1, PP.85.
74. Panda K, Tapan N.P and Tripathi, “Recent Trends in Marketing of Public Issues:
An Empirical Study of Investors Perception”, Journal of Applied Finance, Vol. 7,
No.1, 2010, pp: 1-6.
75. Qiang Cheng and Terry D. Warfield,” Equity incentives and earnings
management,” The Accounting Review Vol.80, No. 2, PP: 441-476.

260
76. Rajarajan V, “Investors Life Styles and Investment Characteristics”, Finance
India, Vol. XIV, No. 2, 2010, pp: 465-478.
77. Ramesh Gupta, “Retail Investor – A lost Species”, IIM Working paper series, E
15378, p:1.
78. Retail Investments into Equity”, IIM Working paper series, E27119, p:4.
79. Roopam Kothari and Narendra Sharma,” Testing the Beta Stability of Banking
Sector over various Phases in Indian Stock market,” The Management Accountant
ICWAI Journal Vol.45 No.7 July 2010 PP: 591-595.
80. Sachdeva, “Emerging Securities Market – Challenges and Prospects”, Chartered
Financial Analyst, Feb 2005, PP.53-56.
81. Sadhan Kumar Chattopadhyay and Samir Ranjan Behera, “Financial Integration
for Indian Stock Market”, Department of Economic Analysis and policy of the
RBI, Working paper, 2006, PP: 1-29.
82. Sakthivel N. “EVA – MVA: Shareholders’ value measure”, The Management
Accountant ICWAI Journal Vol.45, No. 1, January 2010, PP: 10-14 &18.
83. Santi Swarup K, “Measures for Improving Common Investor Confidence in
Indian Primary Market: A Survey”, Research Publication, 2008, nseindia.com.
84. Santi Swarup K, “Role of Mutual Funds in Developing Investor confidence in
Indian Capital Markets”, Sajosps, Vol. 2, No. 2, June 2009, pp: 58-60.
85. SEBI, Handbook of Statistics on the Indian Securities Market: 2009,
www.sebi.gov.in, PP. 247-250..
86. Securities and Exchange Board of India-National council of Applied Economic
Research (SEBI – NCAER), “Survey of Indian investors”, Chartered Secretary,
Vol. XXX, No.9, 2009, pp: 1201-1207.

261
87. Security Regulations, Guidelines, Schemes in Force, SEBI bulletin, Vol.3, No.11,
Nov 2005, PP.13
88. Selvam M, Rajagopalan V, Vanitha S, Babu M, “Equity culture in Indian Capital
Market”, Sajosps, Vol. 4, No. 1, July-Dec 2003, pp: 66-78.
89. Sen S.S. and S.K. Ghosh, “Stock Market Liquidity of BSE and NSE: A
comparative study (1999-2005),” Management Accountant ICWAI Journal
Vol.43 No.2 February 2008 PP: 55-60.
90. Sen S.S. B.K. Ghosh and Santanu Kumar Ghosh, “ Stock market liquidity and
Exchange Rate –A case study on BSE & NSE”, The Management Accountant
ICWAI Journal Vol.42, No.10 October 2007 PP: 820-821 & 830.
91. Shah. A and Thomas., S, “Developing the Indian Capital Markets” in J.A.
Hanson and S.Kasthuria, eds, “A Financial sector for the Twenty first century,
India,”: Oxford University Press, Chapter 71, PP.2025 -265
92. Shirin Rathore, Muneesh Kumar, Amitabh Gupta, “Indian Capital Market – An
Empirical Study”, New Delhi: Anmol publications Pvt. Ltd., Cover page.
93. Shivkumar Deene, Madari D.M and Gangashetty, “Capital market Reforms: some
issues”, working paper, 2008 PP: 1-12.
94. Shobana V.K. and Jayalakshmi J, “Investor Awareness and Preferences”,
Organisational Management, Vol. XXII, No. 3, Oct-Dec 2009, pp: 16-18.
95. Shollapur M.R. and A B Kuchanur, “Identifying perceptions and perceptual
Gaps: A study on individual investors in selected investment avenues”, The
ICFAI University Journal of Behavioral Finance, Vol. V, No. 2, 2008, PP: 47-61.
96. Statman, Meir. “A century of investors”, Santa Clara university–Department of
Finance, working paper no. 02-01, 2002.

262
97. Stephanie Desrosiers, Jean-Francois L Her and Jean-Francois Plante,”Style
management in Equity country Allocation”, Financial Analysts Journal, CFA
institute, Vol.60, No.6, 2006, PP: 40-54.
98. Stout, Lynn.A, “The investor game”, UCLA School of law, Research paper no.
02-18, 2009.
99. Subha M.V, “Indian Capital Markets-A Road Ahead”, Indian Journal of
Marketing, Vol. XXXVI, No. 12, March 2006, pp: 21-22.
100. Tarapore wala, Russi Jai, “The Union Budget 1994 -95 and the Capital Market”,
BMA Review, Vol. III, No.26, March 14-278, 2008.
101. Vibha Mahajan and Dr. Poonam Aggarwal, “Foreign investment – need for a
more competitive and open policy”, The Management Accountant ICWAI Journal
Vol.40, No. 6, June 2009, PP: 475-480.
102. Viswambharan A.M, “Indian Primary Market–Opportunities and Challenges”,
Facts for You, March 2008, p: 31.
103. William A. Birdthistle and M.Todd Henderson, “One Hat Too many? Investment
Desegregation in private Equity”, The university of Chicago law Review 2010
PP: 45- 82.
104. Xuewu wang, “Sentiment strategies,” The ICFAI Journal of Behavioral Finance
December 2009, PP: 60-72.
105. Yadagiri M. and P.Rajender, “Analysis of investment portfolio of scheduled
commercial banks”, The Management Accountant ICWAI Journal Vol. 44, No.
10, October 2009, PP: 780-788.

263
III. REPORTS
Annual Reports of RBI (2000 – 2010)
Annual Reports of SEBI (2000 – 2011)
Gupta L.C, “Indian share owner–A survey”, Society for Capital Market Research and
Development, (2011), New Delhi.
Gupta L.C, Naveen Jain and Team, “Indian Household Investors Survey-2004”, Society
for Capital Market Research and Development”, (2006), Delhi.
Hong Kong Exchanges and clearing Ltd (HKEx), (2001-02), Derivatives Retail Investor
Survey (DRIS).
Santi Swarup K, “Measures for Improving Common Investor Confidence in Indian
Primary Market: A Survey”, Research Publication, 2008, nseindia.com.
Securities and Exchange Board of India-National council of Applied Economic Research
(SEBI – NCAER), “Survey of Indian investors”, Chartered Secretary, Vol. XXX, No.9,
2010, pp: 1201-1207.
IV. WEBSITES
www.nse-india.com
www.bseindia.com
www.sebi.gov.in
www.moneycontrol.com
www.watchoutinvestors.com

264
www.rbi.org.in
www.nyse.com
www.nsadag.com
www.epwrf.res.in
INTERVIEW SCHEDULE
PART 1: SOCIO ECONOMIC PROFILE
1. Age : Below 25 years 25 - 35 years
: 35 - 45 years 45 - 55 years
: 55 & above
2. Gender : Male Female
3. Marital Status : Married Unmarried
4. Educational Level : School Education
: College Education
: Professional
: Others, Specify___________________
5. Occupation : Salaried
: Professional

265
: Business
: Retired
: Others, specify ___________________
6. No. of Members in the Family :
7. No of Earning Members
in the Family :
8. Monthly Family Income : Below Rs. 10,000
: Rs. 10,000 – Rs. 20,000
: Rs. 20,000 – Rs. 30,000
: Rs. 30,000 – Rs. 40,000
: Rs. 40,000 & above

266
PART 2: INVESTMENT PROFILE AND PATTERN
2.1 Type of investor
Hereditary investor New generation investor
2.2 Category of investor
Long term investor Day trader both
2.3 Type of market Operated
Primary market Secondary market both
2.4 Experience in the market
Less than 1 year 1-3 years 3 years & above
2.5 Number of companies in which investment is made
Less than 10 10-20 20 & above
2.6 State the approximate size of investment in shares as on date
Below Rs. 1 Lakh
Rs. 1 lakh – Rs. 2 lakhs
Rs. 2 lakhs & above
2.7 State the source of investment
Own savings Borrowings Both

267
2.8 State the Percentage of your savings invested in shares
Less than 15 % 15% - 30 % 30% and above
2.9 Rank the following sources of investment information based on usage and
reliability
(1 to 10)
S. No Sources of Investment Information Rank
a Abridged Prospectus
b Newspaper Journals & Magazines
c TV Channels
d Investments Related Websites
e Brokers / Analysts Forecast
f Investor Forum
g Technical Analysis
h Company Announcements
i Stock Exchange Announcements
j Others (Friends , Relatives etc)
2.10 Mode of trading
Online Offline Both
2.11 State the trading volume per month
a. Long-term investor
Less than Rs. 1 lakh
Rs. 1 Lakh – Rs. 2 lakhs
Rs. 2 lakhs & above

268
b. Day trader
Less than Rs. 50 Lakhs
Rs. 50 Lakhs – Rs 1 Crore
Rs. 1 Crore & above
2.12 State the indices you frequently refer
S. No Indices Tick ( )
a Sensex
b S&P CNX Nifty
c CNX Nifty Junior
d CNX 100
e S& CNX 500
f CNX Mid-cap
g CNX Mid-cap 200
2.13 Are you a member of any investor forum?
Yes No
If yes, specify the period
Less than 1 year 1- 3 years 3 years & above

269
PART 3: INVESTMENT PREFERENCES & RISK RETURN PERCEPTIONS
3.1 Rank your Investment preferences (1 to 10)
S. No Investments Ranks
a Shares
b Debentures / Bonds
c Stock Futures and Options
d Mutual Funds
e *NSC/PPF/PF
f Fixed Deposits
g Insurance Policies
h Real Estate
i Gold / Silver
j Others
*NSC – National Saving Certificate, PPF – Public Provident Fund, PF – Provident Fund
3.2 Rank your Sectoral preferences for stocks (1 to 10)
S. No Sectoral Stocks Ranks
a IT Sector
b Bank Sector
c *FMCG sector
d *PSE Sector

270
e *MNC Sector
f Service Sector
g Energy Sector
h Pharma Sector
i Infrastructure & Capital Goods
Sector
*FMCG – Fast Moving Consumer Goods, PSE – Public Sector Enterprises MNC –
Multinational Company.
3.3 State the level of risk and return associated with the following investments.
Level of risk Level of Return
Very High
High Moderate Low
Very
Low Investments
Very High
High Moderate Low
Very
Low
Shares
Debentures / Bonds
Stock Futures and Options
Mutual Funds
NSC/PPF/PF
Fixed Deposits
Insurance Policies
Real Estate
Gold / Silver
Others
*NSC – National Saving Certificate, PPF – Public Provident Fund, PF – Provident Fund

271
Kindly answer the following questions with regard to Equity Shares (Part 4, 5 &6)
PART 4: INVESTMENT OBJECTIVES
4.1 State the level of importance of the following investment objectives
S.
No Investment Objectives
Very
High
High Moderate Low Very
low
a Dividends
b Capital Appreciation
c Quick Gain
d Safety
e Liquidity
f Tax Benefits
g Diversification of Asset
Holding
h Rights / Bonus issues & Stock
splits
i Hedge against Inflation
4.2 State the expected rate of return (ROR) per annum.
Less than 12%
12% - 24%
24% - 36%
36% & above

272
PART 5: FACTORS INVOLVED IN INVESTMENT EVALUATION AND
DECISION
5.1 State the level of influence of the following factors in investment evaluation and
decision
S. No
Investment Factors
Level of importance
Very high
High Moderate
Low Very Low
5.1.1 General Information
a. Stock Exchange information
b Risk factors
c Lead managers image
d Credit rating
e Brokers advice/ Analysts forecast/Advertisement impact
5.1.2 Company Management
a Company history
b Promoters background & contribution
c Board of directors
d Company’s present policies
e Companies under the same management & their performance
5.1.3 Details of Present issue
a Authorized and Paid up capital
b Size of present issue
c Objectives of present issue
d Terms of issue
e Minimum & Maximum subscription
f Institutional investments
5.1.4 Project Details
a Cost of the project & Means of financing
b Location /Process/ Infrastructure
c Product strength
d Existing & Future demand
e Future prospects & Profitability
5.1.5 Financial parameters
a EPS/PE Ratio
b Dividend payment trend

273
c Book value, Market value per share & Price trends
d Market volume traded
e Bonus/ Rights issues & Stock splits
f Performance of related companies
PART 6: INVESTMENT SATISFACTION
6.1 State the level of satisfaction achieved, in the following investment objectives
S.
No
Investment
objectives
Level of importance
Highly
Satisfied Satisfied
Neutral /
undecided
Dissatisfied Highly
Dissatisfied
a Dividends
b Capital
Appreciation
c Quick Gain
d Safety
e Liquidity
f Tax Benefits
g Diversification
of Asset
holding
h Rights / Bonus
issues & Stock
splits
i Hedge Against
Inflation
6.2 State the derived rate of return
Less than 12% 12% - 24%
24% - 36% 36% & above

274
6.3 State the level of satisfaction with respect to the following other aspects of share investment
S.
No
Others
Aspects
Level of importance
Highly
Satisfied Satisfied
Neutral /
undecided Dissatisfied
Highly
Dissatisfied
a
Nation wide
trading
facility
b
Equal access
to all
investors
c
Fairness,
efficiency and
transparency
of security
trading
d Settlement
cycle
e
Prompt
service from
company
Such as
transfers,
subdivision
etc
f
Functioning
of Stock
Exchange
g Functioning
of SEBI
h
Quality of
advice and
services of
brokers
i
Information
availability &
reliability
j Market
regulation

275
k
Transparency
& disclosure
norms
l
Share holders
rights &
equitable
treatment
m
Investor
awareness &
education
measures
n
Investor
protection
measures
o
Speedy
redressal of
grievances
p
Functioning
of investor
forum
6.4 State your level of agreeability regarding enhancing or introduction of the
following measures, to increase investor confidence and to attract more
investments in shares.
S.
No Measures
Level of Agreeability
Strongly
agree
Agree Neutral /
undecided
Disagree Strongly
Disagree
a Information related measures
b Scandal control measures
c
Investor awareness and education
Measures

276
d Grievance handling and Investor protection measures
e Regulating intermediary and rating measures
f Market regulation measures
g Return related measures
h Government measures
i Transparency in Promoter’s activities
j Rating of equity scripts
k Insurance coverage for stock losses
If any other, Please specify____________________________________________
___________________________________________________________________

277
6.5 How much you are affected by the following problems
S.
No Problems Faced
Very
High
High Moderate Low Very
low
a No proper advise by Brokers
b Too many channel giving too
many opinion about the
market
c Difficulty in operating online
trading
d Change of transaction
password frequently
e Unauthorized transaction by
brokers