analysis of library systems, sturgis library...
TRANSCRIPT

CAMPUS CULTURE AND CLIMATE ASSESSMENT
ANALYSIS OF LIBRARY SYSTEMS, STURGIS LIBRARY
REPORT

1
TABLE OF CONTENTS
INTRODUCTION: ANALYSIS OF CLIMATE FOR OFFICE OF UNIVERSITY ADVANCEMENT AND
DEVELOPMENT ...................................................................................................................... 2
SECTION I: COMPARISON OF RESPONSES FROM Sturgis Library STAFF TO ALL OTHER
RESPONDENTS AND TO BENCHMARKS ................................................................................... 3
Findings for Sturgis Library Staff Compared to Other KSU Staff ........................................................4 Section 1.1: Sturgis Library Staff to KSU Staff Comparisons ................................................................................. 5 Section 1.2: Sturgis Library Staff to Benchmark Comparisons .............................................................................. 6
SECTION II: ANALYSIS OF GENERAL CLIMATE SCALES .............................................................. 9
Section 2.1: Comparisons of General Climate Scale Dimensions .......................................................................... 9
ACKNOWLEDGMENTS .......................................................................................................... 10

2
INTRODUCTION: ANALYSIS OF CLIMATE FOR LIBRARY SYSTEM, STURGIS LIBRARY
This report expands upon the work of the Campus Climate and Culture Task Force on the Assessment of
Climate for Learning, Kennesaw Campus.1 Background information, a campus-wide executive summary,
and details about the consulting firm that assisted with the study can be viewed on the Campus Culture
and Climate Assessment home page at http://diversity.kennesaw.edu/kennesawccca/
In order to guide the diversity action planning process, responses have been analyzed within each
college and division. This report provides findings for respondents affiliated with the Library System,
Sturgis Library (herein after referred to as Sturgis Library). There are two sections in this report; they are
described in detail below. General response items are included while follow-up questions are excluded.
Items with very small response numbers were excluded from all comparisons to protect confidentiality.
In Section I, responses from Sturgis Library staff are compared to those of all other Kennesaw Campus
staff. Chi square tests were used for these comparisons to identify statistically significant differences.2
This comparison provides important information to measure the strengths and challenges evident
within Sturgis Library when compared against the Kennesaw Campus as a whole. Comparisons are also
made to established benchmarks.3
Section II presents an analysis of items with numeric scale ratings on various dimensions of the campus
climate. This analysis compares responses of Sturgis Library staff to those of all other Kennesaw Campus
staff.
There were insufficient numbers of Sturgis Library staff in various demographic categories to provide an
analysis of responses by demographics.
1 The Kennesaw Campus is also referred to as KSU in this report, because the climate assessment was conducted prior to consolidation. 2 It should be noted that no differences were found that were statistically significant and met reporting criteria. Meaningful differences are reported here. 3 See Appendix I: Methodology for more details and rationale for this method of comparison.

3
SECTION I: COMPARISON OF RESPONSES FROM STURGIS LIBRARY STAFF TO ALL
OTHER RESPONDENTS AND TO BENCHMARKS
Chi square tests determined statistically significant differences between responses from Sturgis Library
staff and all other KSU staff.4 In analyses of other administrative units, statistically significant and
favorable results were labeled significant strengths while those that were statistically significant and
unfavorable were labeled significant challenges. However, there were no statistically significant results
within Sturgis Library that met the criteria for reporting.
Results that were informative but not statistically significant were labeled meaningful strengths and
meaningful challenges. Only items with differences of ten percentage points or more were included in
the report narrative. All items with differences of less than ten percentage points can be found in
Appendix II.5 Data tables in this appendix provide information on additional items that may be
considered potential strengths and challenges for Sturgis Library.
Comparisons were also conducted of responses from Sturgis Library staff to established benchmarks.6
Established benchmarks enabled comparisons of a group to a predetermined goal as opposed to a group
to a group. Items that did meet or went beyond benchmarks (either above or below depending on
whether an item is stated positively or negatively) were labeled strengths. Those that did not meet or
fell below benchmarks were labeled challenges. Only items with differences of six percentage points or
more were included. All items with differences of less than six percentage points can be found in
Appendix II. Data tables in this appendix provide information on additional items that may be
considered potential strengths and challenges for Sturgis Library.
4 See Appendix I: Methodology for more details of this analysis. 5 Items where the difference between the comparison group response average and the average for all other groups was less than four percentage points were excluded from analysis. The result is that some group comparisons will have more items in the analysis than others. Groups with more items in the analysis may warrant priority attention because of more overall group differences in experiences and perceptions of climate. 6 See Appendix I: Methodology for more details and rationale for this method of comparison.

4
Findings for Sturgis Library Staff Compared to Other KSU Staff
OVERVIEW
Table 1 shows the items that were identified as top strengths and challenges. Items in each cell are
ranked by greatest differences from the comparison. Underlined items appear as top strengths or
challenges in both comparisons. Items that appear in more than one comparison should be considered
as having been emphasized in terms of their importance.
Table 1: Top Challenges for Sturgis Library Staff
STURGIS LIBRARY STAFF
Comparison to All Other KSU Staff Comparison to Benchmarks
Top Strengths
Higher agreement that
the way salaries are determined is clear7
KSU is supportive of flexible work schedules
they have supervisors who give career guidance when needed
Lower percentage who have observed unjust employment-related disciplinary actions at KSU
Higher agreement that
KSU is supportive of flexible work schedules
they have supervisors who give career guidance when needed8
they have colleagues who give career guidance when needed
Top Challenges
There were no areas of challenge with a difference of 10 percentage points or greater for this comparison.
Lower agreement that the way salaries are determined is clear7
Lower comfort levels with the climate in their departments7
7 This item was a strength when compared to all other KSU staff and a challenge when compared to the benchmark. The greatest difference was for the benchmark comparison. 8 These two items are the same distance from the benchmark and therefore have the same rank.

5
Section 1.1: Sturgis Library Staff to KSU Staff Comparisons9
Chart 1: Top Three Strengths, Sturgis Library Staff Compared to All Other KSU Staff
Significant Strengths
No items met the criteria for significant strengths.
Meaningful Strengths
A higher percentage of Sturgis Library staff agreed or strongly agreed that
the way salaries are determined is clear (55%, n=6) compared to all other KSU staff (34%,
n=227),
KSU is supportive of flexible work schedules (91%, n=10) compared to all other KSU staff (75%,
n=503), and
they have supervisors who give career guidance when needed (90%, n=9) compared to all other
KSU staff (75%, n=495).
In addition,
a lower percentage of Sturgis Library staff have observed unjust employment-related
disciplinary actions at KSU (0%, n=0) compared to all other KSU staff (13%, n=80).
See Table 1 of Appendix II for further information.
Significant/Meaningful Challenges
No items met the criteria for significant or meaningful challenges. See Table 1 of Appendix II for further
information.
9 See Appendix I: Methodology for more details and rationale for this method of comparison.
6
Section 1.2: Sturgis Library Staff to Benchmark Comparisons10
The results of benchmark comparisons for Sturgis Library staff responses are presented here, arranged
by item type.11 Items that were less than six percentage points from the benchmark were not included
in the analysis. As a result, there will be no findings to report for some item types.
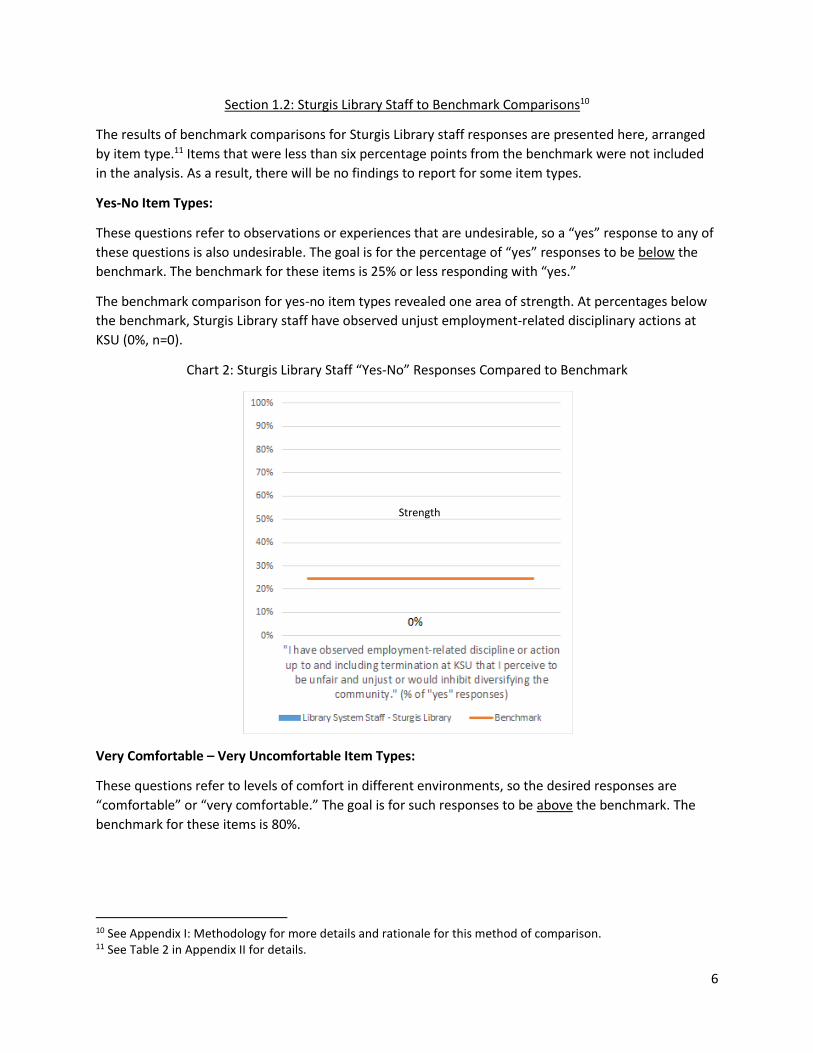
Yes-No Item Types:
These questions refer to observations or experiences that are undesirable, so a “yes” response to any of
these questions is also undesirable. The goal is for the percentage of “yes” responses to be below the
benchmark. The benchmark for these items is 25% or less responding with “yes.”
The benchmark comparison for yes-no item types revealed one area of strength. At percentages below
the benchmark, Sturgis Library staff have observed unjust employment-related disciplinary actions at
KSU (0%, n=0).
Chart 2: Sturgis Library Staff “Yes-No” Responses Compared to Benchmark
Very Comfortable – Very Uncomfortable Item Types:
These questions refer to levels of comfort in different environments, so the desired responses are
“comfortable” or “very comfortable.” The goal is for such responses to be above the benchmark. The
benchmark for these items is 80%.
10 See Appendix I: Methodology for more details and rationale for this method of comparison. 11 See Table 2 in Appendix II for details.
Strength

7
The benchmark comparison for comfortable-uncomfortable items revealed one area of challenge. At
percentages below the benchmark, Sturgis Library staff were comfortable or very comfortable with the
climate in their departments (73%, n=8).
Chart 2.1: Sturgis Library Staff Comfort Responses Compared to Benchmark
Strongly Agree – Strongly Disagree Item Types (staff, positive statements):
These questions refer to levels of agreement with a series of positively worded statements about work-
life for staff, so the desired responses are “agree” or “strongly agree.” The goal is for such responses to
be above the benchmark. The benchmark for these item types is 80% or more responding with “agree”
or “strongly agree.”
Challenge

8
The benchmark comparison for agree-disagree item types revealed three areas of strength. At
percentages above the benchmark, Sturgis Library staff agreed that
KSU is supportive of flexible work schedules (91%, n=10),
they have supervisors who give career guidance when needed (90%, n=9), and
they have colleagues who give career guidance when needed (90%, n=9).
The analysis also disclosed one area of challenge. At percentages below the benchmark, Sturgis Library
staff agreed that the way salaries are determined is clear (55%, n=6).
Chart 2.2: Sturgis Library Staff Work-Life Agreement Responses Compared to Benchmark
Strongly Agree – Strongly Disagree Item Types (staff, negative statements):
No items met the criteria for this item type.
Greatest
Strength
Challenge

9
SECTION II: ANALYSIS OF GENERAL CLIMATE SCALES
The Campus Culture and Climate Assessment included a section where respondents were asked to rate the
climate at KSU on a scale of 1 to 5 along a number of different dimensions. Many of these dimensions were
specific to identity groups, such as “positive for persons with disabilities – negative for persons with
disabilities.” This section presents the results of the five scales that are general in nature as follows: “friendly
– hostile,” “cooperative – uncooperative,” “improving – regressing,” “welcoming – not welcoming”, and
“respectful – disrespectful,” where 1 is the most positive rating and 5 is the most negative rating. Results are
presented for staff for each scale. Keep in mind that a lower numerical rating is more positive than a higher
numerical rating.
Section 2.1: Comparisons of General Climate Scale Dimensions
Chart 1: Comparison of Climate Ratings for Sturgis Library Staff vs. All Other KSU Staff
Sturgis Library staff had ratings on each dimension that were less favorable than all other KSU staff.
The dimension with the greatest unfavorable rating from Sturgis Library staff compared to all other
KSU staff was “respectful – disrespectful.”

10
ACKNOWLEDGMENTS
The Office of Diversity and Inclusion (ODI) would like to acknowledge the invaluable contributions of a
number of KSU community members to the Campus Culture and Climate Assessment (CCCA) process.
President Papp charged the Office of Diversity and Inclusion to carry out an assessment of the perceptions
and experiences of students, instructors, and staff relating to the culture and climate at KSU.
The CCCA Task Force, led by Drs. Val Whittlesey and Chris Zeigler, laid the groundwork for developing and
administering the CCCA questionnaire. Task force members conducted focus groups, identified key concerns,
created a marketing plan to encourage participation in the assessment, and recommended strategies to
immediately address common areas of concern based on assessment findings.
Special thanks go to the CCCA Task Force members for their leadership:
Val Whittlesey, Ph.D., Co-Chair Chris Zeigler, Ph.D., Co-Chair Ken Harmon, Ph.D. Jake Gross, Ph.D. Chris Archambeault Lisa Schulte Corrie Davis, Ph.D. Patricia McHatton, Ph.D. Lynn Stallings, Ph.D. Kathy Schwaig, Ph.D. Sandra Cobb Judith Hold Griselda Thomas, Ph.D. Kevin Gwaltney, Ph.D.
Marina Koether, Ph.D. Jane Barnette, Ph.D. Julio Espana Sabbaye McGriff Yanghee Kim, Ph.D. Lynda Johnson Molenda Elem Tamara Livingston, Ph.D. Debbie Chimeno Beth Tindel Percy Ivey Jessica Baker Debbie Smith Cheryl Evans
Patrick Sheehan Trudi Vaughan Vanessa Biggers Beth Tindel Ana Baida David Baugher RC Paul, Ph.D. Frank Wills Yen Rodriguez Gaius Augustus J’nell Hubbard Carole Hill Kathy Alday Linda Lyons, Ph.D.
The work of the CCCA Task Force was guided by Dr. Sue Rankin of Rankin & Associates. The final report of
findings for the Kennesaw Campus as a whole, and the executive summary of findings, were prepared and
presented by Dr. Rankin. Her expertise and experience was vital to carrying out a successful assessment
yielding actionable information.
For their pledge to use the Kennesaw Campus CCCA findings at the college level to engage in diversity action
planning, acknowledgement goes to the Kennesaw Campus academic deans and their diversity action
committee members.
Bagwell College of Education, Dean Arlinda Eaton, Ph.D.
Coles College of Business, Dean Kathy Schwaig, Ph.D.
College of Humanities and Social Sciences, Dean Robin Dorff, Ph.D.
College of Science and Mathematics, Dean Mark Anderson, Ph.D.
College of the Arts, Dean Patty Poulter, Ed.D.
University College, Dean Keisha Hoerrner, Ph.D.
Wellstar College of Health and Human Services, Interim Dean Monica Nandan, Ph.D.

440 Bartow Avenue NW, MD #2702English Bldg., Suite 202
Kennesaw, GA 30144-5591470-578-2614
diversity.kennesaw.edu
WE ARE stronger together.