analysis of lithic artefact microdebitage for
TRANSCRIPT

University of Wollongong Thesis Collections
University of Wollongong Thesis Collection
University of Wollongong Year
Analysis of lithic artefact microdebitage
for chronological determination of
archaeological sites
George J. SusinoUniversity of Wollongong
Susino, George J, Analysis of lithic artefact microdebitage for chronological determinationof archaeological sites, PhD thesis, School of Earth Environmental Sciences, University ofWollongong, 2004. http://ro.uow.edu.au/theses/768
This paper is posted at Research Online.
http://ro.uow.edu.au/theses/768

NOTE
This online version of the thesis may have different page formatting and pagination from the paper copy held in the University of Wollongong Library.
UNIVERSITY OF WOLLONGONG
COPYRIGHT WARNING
You may print or download ONE copy of this document for the purpose of your own research or study. The University does not authorise you to copy, communicate or otherwise make available electronically to any other person any copyright material contained on this site. You are reminded of the following: Copyright owners are entitled to take legal action against persons who infringe their copyright. A reproduction of material that is protected by copyright may be a copyright infringement. A court may impose penalties and award damages in relation to offences and infringements relating to copyright material. Higher penalties may apply, and higher damages may be awarded, for offences and infringements involving the conversion of material into digital or electronic form.

Chapter four In the remote Northern Territory of Australia, a huge sandstone boulder marks the spot where, according to aboriginal lore, a spirit named Jinmium turned herself to stone to escape her pursuer. This rock shelter has long been a magical place where ancient people camped, painted ochre figures, and carved holes in the walls. Archaeologists have been eager to know how far back its history extends, and last year, they got an answer that even the leader of the dating team called ‘pretty outrageous’: between 116,000 and 176,000 years (Gibbons, 1997: 220).
Case study 1, Jinmium, Keep River, Northern Territory
Jinmium rockshelter is one of the most famous archaeological sites in Australia. It was
selected as a test case in this research because of the extensive age determination work
that has been completed on the sedimentary material from its archaeological deposit.
Regardless of the critiques (Gibbons, 1997; Goldie, 1998; Spooner, 1998) of the original
TL age determination (Fullagar et al., 1996), and subsequent re-dating with the OSL
technique (Galbraith et al., 1999; Roberts et al., 1998a; 1999), Jinmium rockshelter
remains an important archaeological site in northern Australia. The study of
archaeological sites in the Kimberley region has produced valuable knowledge and
understanding into the histories of indigenous peoples of Northern Australia.
This region is important within the study of human migration into Greater Australia
as the possible gateway to the continent in the Pleistocene.
The Jinmium rockshelter is of Holocene age (Roberts et al., 1999). Climatic changes
have occurred in the region during that time, making this site important for the
understanding of both the cultural and physical landscapes (Fullagar et al., 1999) of
the continent.
The site was excavated as part of a broader project to examine human-environment
interactions in the region, which span the study of rock art to the investigation of the
indigenous environment and landscapes (Atchison and Fullagar, 1998; Atchison, 2000;
Fullagar and Head, 1999; Fullagar et al., 1999; Head and Fullagar, 1992; Head, 1996,
1997, 1999; Mulvaney, 1996; Taçon et al., 1997, 2003).
96

Recent age determination by Watchman et al. (2000) has revealed that the age of rock
art (cupules) on the surface of the rockshelter is ~10,000 years old. The archaeological
deposit containing a sandstone slab with cupules pecked on the surface was dated at
around 10,000 years old (Roberts et al., 1999). Although the method used by
Watchman et al. (2000) uses the radiocarbon dating technique, the age of the cupules
on the surface and on the sandstone slab found in the deposit have comparable ages.
In this case study, the focus is to apply the methods and techniques developed in
Chapters 2 and 3 of this thesis. Thus, the questions central to the research for this case
study are:
1. Is it possible to isolate quartz microdebitage from the sediment?
2. Is it possible to determine the age of microdebitage independently from that of the sediment in which it was found?
3. Is it possible to apply SEM to microdebitage and to then the same material for OSL age determination?
4. What are the archaeological implications of knowing the age of microdebitage?
To answer these questions, the sedimentary material from two samples previously
excavated from the archaeological deposit of Jinmium rockshelter was used. The
material was analysed according to the steps devised in Chapter 3 (Figure 3.1), where
the basic principles and procedures are set out. Each section of chapter 4 has a flow
chart describing the techniques and model used for analysis.
4.1 General description of the archaeological site
Jinmium rockshelter is located in the East Kimberley region of northern Australia, 50
km south of the mouth of the Keep River (129.2oE, 15.4oS) (Figure 4.1). Atchison and
Fullagar (1998: 111-112), describe the Jinmium (C1) rockshelter as being:
…formed by a sloping sandstone boulder embedded in the sand at the western end of an extensive escarpment which rises about 250 m and is dominated by Devonian, Cambrian and pre-Cambrian sandstones with conglomerates of shale and siltstones. Warping and faulting of the escarpment has induced heavy dissections by intermittent streams across an extensive floodplain covered with many small depressions, which form lakes and billabongs. The sandstone regions yield red and yellow earths and some lateritic podzolics. The vegetation of the Keep River area is diverse due to the range of different landforms and lithologies.
97
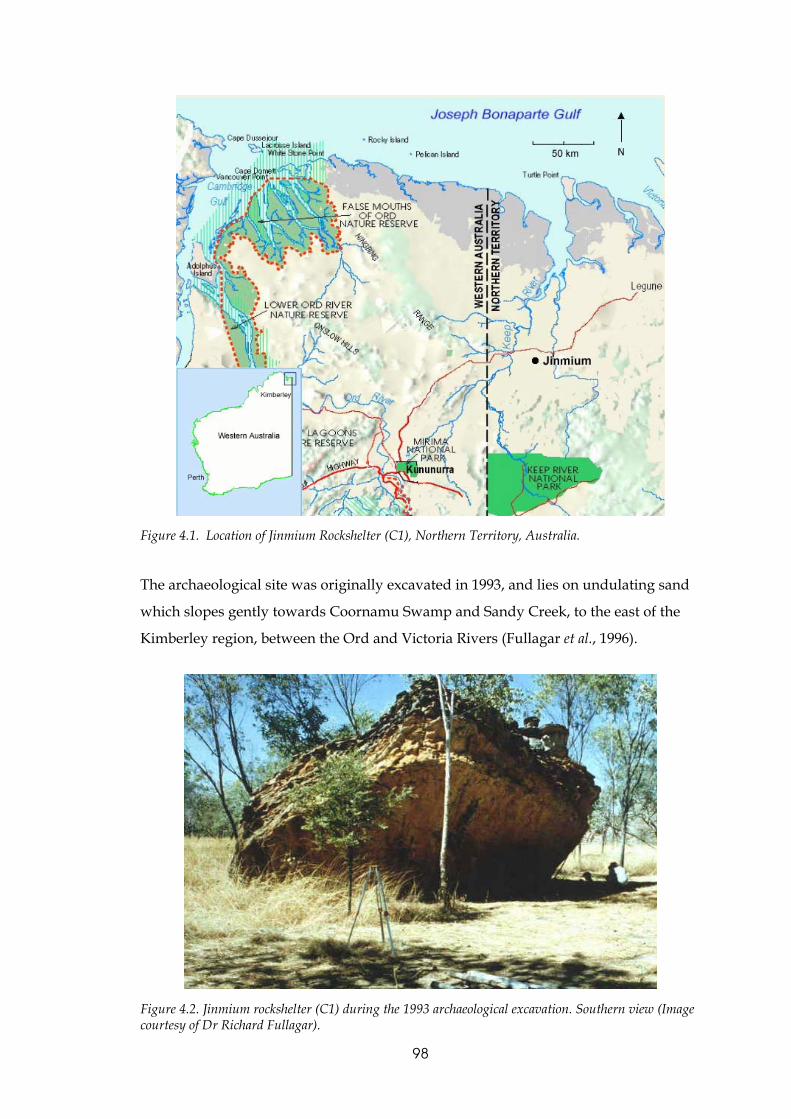
Figure 4.1. Location of Jinmium Rockshelter (C1), Northern Territory, Australia.
The archaeological site was originally excavated in 1993, and lies on undulating sand
which slopes gently towards Coornamu Swamp and Sandy Creek, to the east of the
Kimberley region, between the Ord and Victoria Rivers (Fullagar et al., 1996).
Figure 4.2. Jinmium rockshelter (C1) during the 1993 archaeological excavation. Southern view (Image courtesy of Dr Richard Fullagar).
98

In 1993, the deposit was excavated to a maximum depth of ~2 m. The archaeological
deposit is composed of unconsolidated sandy sediments, grey in colour near the
surface and grading to light pink towards the base of the excavation. The deposit
contained sandstone boulders and weathered sandstone rubble below a depth of ~55
cm, increasing in concentration towards the base of the deposit (Figure 4.4) (Fullagar
et al., 1996).
In 1995, the floor deposit of C1 rockshelter was re-excavated by Richard Roberts, Rhys
Jones and Richard Fullagar, cleared of all infill, the faces re-exposed, and cleaned to
undisturbed and unexposed deposit. Samples were taken in locations within the
archaeological deposit that were comparable with the locations of the original TL
samples collected in 1993.
The OSL samples were extracted by inserting horizontally into the face 18 mm
diameter stainless-steel tubes to extract sedimentary material without exposure to
light (Galbraith et al., 1999). Material surrounding the resultant hole was extracted for
gamma spectrometry.
Figure 4.3. Jinmium archaeological site plan. Inset box shows the location of the C1 rockshelter excavation (image from Fullagar et al., 1996: 754).
99

The age determination of the C1 rockshelter at Jinmium can be generally divided into
three studies: the 1993 excavations, where TL and radiocarbon determinations were
undertaken (Fullagar et al., 1996); the 1995 re-excavation of the deposit, where the site
was dated using the OSL and AMS 14C techniques (Galbraith et al., 1999; Roberts et al.,
1998a, 1999); the 2000 age determination of pecked marks on the surface of the
sandstone using radiocarbon techniques on oxalate crusts overlying the art
(Watchman et al., 2000).
4.1.1. Jinmium rockshelter age determination
In previous research at this site (Fullagar et al., 1996; Roberts et al., 1998a), the
geomorphology of the sediments in relation to the archaeological deposit is described
(Figure 4.4). Fullagar et al. (1996) derived sedimentation rates by taking a series of
core samples 10 m northwest from the C1 rockshelter. The stratigraphy of Jinmium
rockshelter was divided into 8 distinct units, identified by changes in sediment colour.
Fullagar et al. (1996: 770) interpreted the archaeological deposit as having had minimal
disturbance after sedimentation:
It is unlikely that the sediments have been disturbed because materials of different density (ochre, stone of both >4-mm and 2-4-mm size classes, and starch grains) have similar distributions. If loose sand is thought to enhance the likelihood of downward movements of artefacts, the sandstone rubble, particularly in trenches C1/I and C1/II, arguably provides a stable matrix with less chance of disturbance. A section through the east wall in trench C1/III at levels between dates of about 75,000 and 116,000 years revealed a pit with a pounding stone/hammerstone at its base together with several quartzite flakes; the pit is sealed below the level with a date of about 75,000 years. With very few attempts it has been possible to refit several artefacts from the same levels. This, of course, is no guarantee of minimal disturbance, but together with the evidence of organic residue survival on artefacts and the distribution of starch through the sediments, it does suggest that movements of artefacts are likely to be small compared with the depth of deposit.
Most of the critiques of the original Jinmium rockshelter age determination are based
on discerning insufficient exposure to sunlight at the time of deposition or post-
depositional sediment mixing, since the sediment was generally composed of
unconsolidated sand (Roberts, 1997; Roberts et al., 1998a, 1999; Spooner, 1998).
The TL technique could not discern sediment mixing, since the multiple aliquots
technique returns a single palaeodose for the aliquot, making it impossible to discern
100

if the sample had grains with different palaeodoses. This allows for the possibility
that the TL aliquots contained partially bleached grains or grains of greater antiquity,
possibly from quartz grains derived from decaying sandstone within the sediment
(Roberts, 1997; Roberts et al., 1998a; Spooner, 1998).
Table 4.1. Previous age determinations of the Jinmium rockshelter (C1/III) sediments.
Table 4.1 includes the TL, OSL and radiocarbon age determinations from previous
dating programmes. It is important to note that the radiocarbon samples have yielded
ages that are consistently younger than those obtained from the OSL central age
model palaeodoses. The radiocarbon ages do not follow an age-depth curve, and are
significantly younger than the TL ages.
The single-grain technique developed by Roberts et al. (1998a) and Murray and
Roberts (1997) was designed to detect partially bleached grains and sediment mixing
within archaeological deposits.
101

Figure 4.4. Stratigraphic sections of the archaeological deposit at Jinmium, C1 rockshelter. Location of the TL (W crosses), OSL and radiocarbon samples (COOR black circles) (Roberts et al., 1999). a) North face, and b) South face of the excavation. The red arrows show the locations of the samples used in this research for age determination of microdebitage.
4.2 Methods applied to this case study
Two samples for optical stereomicroscopy were used (location of the samples are the
red arrows in Figure 4.4) from material derived from ~50 g of bulk sedimentary
material exposed to unfiltered white ambient light (unused portion of samples
previously collected for high-resolution gamma spectrometry) for each sample. These
two samples of sediment were cleaned in the same manner as the material for OSL age
determination, and were sieved into two sizes: 500-1000 µm and 250-500 µm in
diameter, to determine if quartz microdebitage particles were present in the samples.
The samples used for OSL age determination were derived from the unused portion of
cleaned (with HCl and H2O2) but unused OSL laboratory samples from previous
research undertaken at the site. The samples were always kept in a dark room, and
only exposed to dim red illumination when under analysis. The bulk samples of
102

sediment were cleaned with HCl and H2O2, sieved to a diameter of over 63 µm to
remove the clays, but not etched with HF. For these samples, the grains of 90-125 µm
in diameter were removed during the previous research. The 250-500 µm samples
proved to be the most abundant in weight, and included sufficient microdebitage for
analysis. The OSL age determinations of all the samples from Jinmium were derived
by using single grains (one grain on each OSL disc) and the application of the SAR
protocol. The original sample numbers and designations used by Roberts et al. (1998a)
and Fullagar et al. (1996) are retained in this thesis.
The white light exposed material was, in the first instance, sorted for microdebitage
analysis under stereomicroscopy in ambient light. The angular quartz grains with
conchoidal fractures were then observed under SEM to determine if the material was
actually microdebitage. At the same time, composite SEM images of the sedimentary
material were taken for roundness index analysis. This would determine the average
roundness index of the natural sediment as opposed to the index of microdebitage
(angular to very angular).
The age determination protocols used in this research are partly comparable with
those used by Roberts et al. (1998a) and subsequent papers (Galbraith et al., 1999;
Roberts et al., 1999). Some changes were applied to reflect the nature and size of the
particles used for analysis. For determination of the OSL age of the samples, the total
dose rates used are close to those published using data for radionuclide activities of 238U, 226Ra, 210Pb, 228Ra, 228Th, and 40K by Roberts et al. (1998a), as it is assumed that
quartz microdebitage will absorb ionising radiation at the same rate as any other
quartz grains in the deposit (Table 4.2).
Table 4.2. Radionuclide activities and dose rates (Roberts et al. 1998a: 361).
Radionuclide activities (Bq kg-1) Sample code
(Pit sq.)
Depth (cm) 238U 226Ra 210Pb 228Ra 228Th 40K
Total dose rate
(Gy ka-1)
COOR 1/3 (C1/III) N 68 9.5 ± 0.9 15.4 ± 0.2 11.7 ± 1.0 18.1 ± 0.4 18.4 ± 0.3 38.3 ± 1.5 0.8 ± 0.04
COOR 7/1 (C1/III) S 115 9.5 ± 1.6 7.7 ± 0.3 12.2 ± 2.0 8.3 ± 0.6 9.2 ± 0.3 13 ± 3.0 0.6 ± 0.03
However, one difference to the original research of Roberts et al. (1998a) is the
attenuation factors for the beta-dose rates. The beta-dose rates for microdebitage were
103

calculated based on Fain et al. (1999) (Table 4.3), using attenuation factors that reflects
the geometry of microdebitage. The sedimentary material used the beta-dose
attenuation factors published by Mejdahl (1979).
Table 4.3. Beta-dose attenuation factors (after Fain et al., 1999: 233).
Further, for palaeodose calculations, the beta–source dose rate of the OSL reader has
been calibrated for particle sizes of 400 and 800 µm (see Chapter 2, section 2.6)
Table 4.4. Previously published OSL ages for the two samples from Jinmium rockshelter.
Source: Roberts et al. (1998a: 361). MA= multiple aliquot. SA= single aliquot. SG= single grain. Central= central age model. Minimum= minimum age model.
Table 4.4 outlines the protocols used, and the OSL ages derived by Galbraith et al.
(1999) and Roberts et al. (1998, 1999). The details provided below pertain to the two
samples of sediment investigated in this research.
Since the palaeodose of the sediments was known from previous work (i.e. up to ~ 20
Gy), it was initially assumed that the microdebitage would have a similar palaeodose
to the sedimentary material.
Each grain was placed on a 1 cm diameter stainless-steel disc by spraying a 1 mm
central spot with silicone oil. The 48 prepared discs were placed on the reader’s
carousel. The first part of a SAR protocol sequence was run to record the natural
signal of each grain and in the corresponding test dose OSL signal.
104
Each disc was heated to 240oC at 5oC/s and then held at this temperature for 10 s. The
disc was then allowed to cool, and the OSL reader then bleaches the sample using 100 s
of blue LED light at a temperature of 125oC, and 250 channels of data (the natural
signal) were recorded with the blue diodes at 50% intensity. A test dose of 10 Gy of
beta irradiation was also given afterwards.
The sample was then heated to 160oC at 5oC per second and immediately cooled to
125oC followed by 100 s of blue light from the LEDs while the reader recorded 250
channels of test dose data (Table 4.5 outlines the first run). The natural dose (and test
dose) of quartz grains and microdebitage were recorded in a separate first run of the
OSL reader prior to a full SAR sequence. This technique was used to minimise
instrument time by reviewing the data recorded by the OSL reader. In the first
instance, those grains that did not have any luminescence recorded in the test dose (no
decay curve) were rejected.
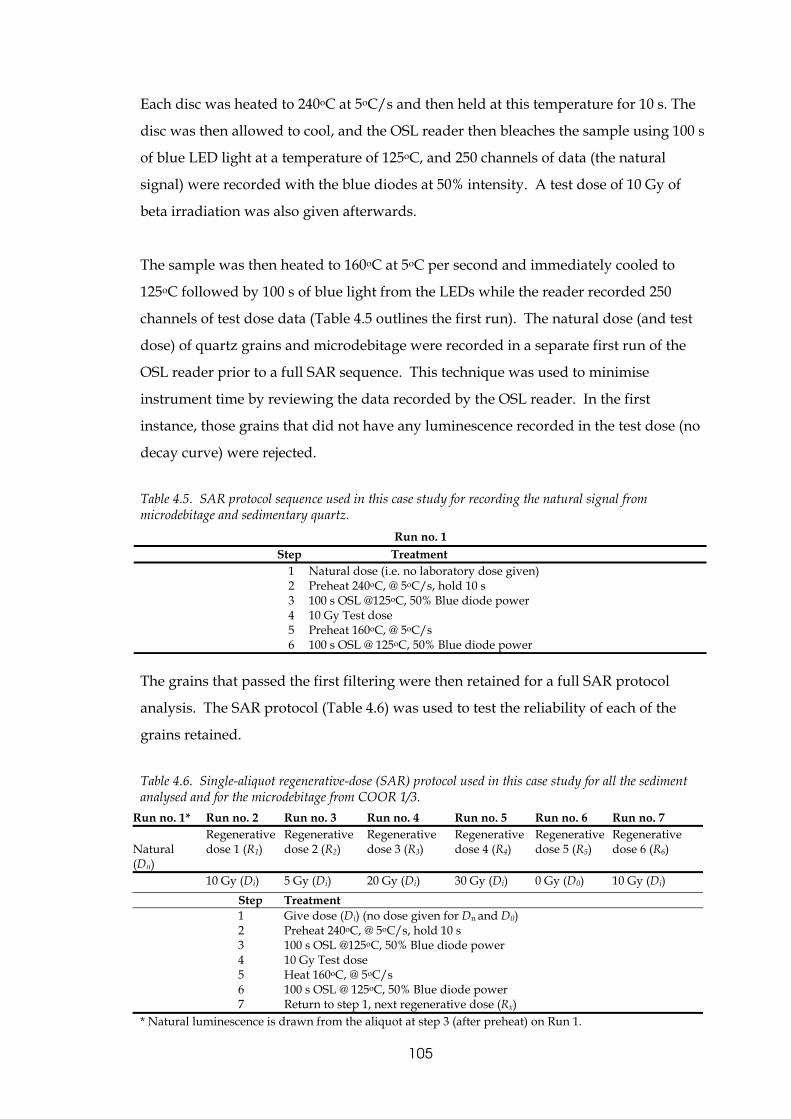
Table 4.5. SAR protocol sequence used in this case study for recording the natural signal from microdebitage and sedimentary quartz.
Run no. 1 Step Treatment
1 2 3 4 5 6
Natural dose (i.e. no laboratory dose given) Preheat 240oC, @ 5oC/s, hold 10 s 100 s OSL @125oC, 50% Blue diode power 10 Gy Test dose Preheat 160oC, @ 5oC/s 100 s OSL @ 125oC, 50% Blue diode power
The grains that passed the first filtering were then retained for a full SAR protocol
analysis. The SAR protocol (Table 4.6) was used to test the reliability of each of the
grains retained.
Table 4.6. Single-aliquot regenerative-dose (SAR) protocol used in this case study for all the sediment analysed and for the microdebitage from COOR 1/3.
Run no. 1* Run no. 2 Run no. 3 Run no. 4 Run no. 5 Run no. 6 Run no. 7 Natural (Dn)
Regenerative dose 1 (R1)
Regenerative dose 2 (R2)
Regenerative dose 3 (R3)
Regenerative dose 4 (R4)
Regenerative dose 5 (R5)
Regenerative dose 6 (R6)
10 Gy (Di) 5 Gy (Di) 20 Gy (Di) 30 Gy (Di) 0 Gy (D0) 10 Gy (Di) Step Treatment 1
2 3 4 5 6 7
Give dose (Di) (no dose given for Dn and D0) Preheat 240oC, @ 5oC/s, hold 10 s 100 s OSL @125oC, 50% Blue diode power 10 Gy Test dose Heat 160oC, @ 5oC/s 100 s OSL @ 125oC, 50% Blue diode power Return to step 1, next regenerative dose (Rx)
* Natural luminescence is drawn from the aliquot at step 3 (after preheat) on Run 1.
105

The next part was to repeat the same sequence as for run no.1, adding different beta
doses (as opposed to the natural dose) at the beginning of each run, starting from the
second run. The repeat regenerative doses (runs 2 and 7), R1 and R6, are designed to
check that there are no uncorrected sensitivity changes to the signal during the
procedure (agreement between these two regenerations suggests that the sensitivity
correction works). Run 6 was used to estimate the recuperation signal, by not giving a
dose (zero-dose) after the preheat (step 2), and measuring any recuperated signal in
step 3 of the treatment. This recuperation is used to check for thermal transfer
(Murray and Wintle, 2000) (negligible signal from zero-dose suggests that there is little
thermal transfer within the grain).
Once the sequence has ended, the data recorded was firstly checked with Analyst, the
OSL reader’s analysis software, where the data from the two separate parts (the
natural and the regeneration sequence) were joined.
The palaeodoses were estimated for each aliquot by interpolating the natural OSL
signal onto the dose response curves using 100 Monte Carlo simulations for each of
the signals (Yoshida et al., 2003). The palaeodoses, errors, recycling ratios and test
dose errors were then analysed to filter out the data from particles that did not pass
the following criterion: recycling ratio (i.e. R6/R1) more than 2σ away from unity (the
recycling ratio is calculated from the data recovered on the second and the last runs)
(Table 4.6).
All of the single-grain palaeodoses and their standard errors were displayed in radial
plots. The data were also analysed using the ‘central age model’ and the ‘minimum
age model’ developed by Galbraith et al. (1999: 359-360), where a series of palaeodoses
and standard errors are used to estimate a ‘central’ or ‘minimum’ estimate of each
sample palaeodose. The samples were also checked for over-dispersion of the
palaeodose estimates to ascertain if the spread could be accounted for solely on the
basis of photon counting statistics (Galbraith et al., in press; Olley et al., 2004a, 2004b).
Microdebitage particles may not be subject to over-dispersion due to partial bleaching.
The mode of production of microdebitage (manufactured by the deliberate striking of
106
stone-on-stone) in daylight would likely prevent any partially bleached particles being
produced and incorporated into the archaeological deposit.
However, the particles will be subject to the possibility of being part of a disturbed
deposit, where intrusion of particles from underlying or overlying sediments may
provide over-dispersion values of over 20%. Any proximity of the grains to
radioactive heavy minerals (e.g. zircons) would result in an increase of the palaeodose
resulting from beta dose heterogeneity (Olley et al., 2004a, 2004b; Roberts et al., 1999).
Further, proximity to large non-radioactive minerals would result in the particles
receiving a lower-than-average beta dose (Olley et al., 1997). Sedimentary quartz
grains could be subjected to all three possible causes described above, giving rise to
over-dispersion of the palaeodose.
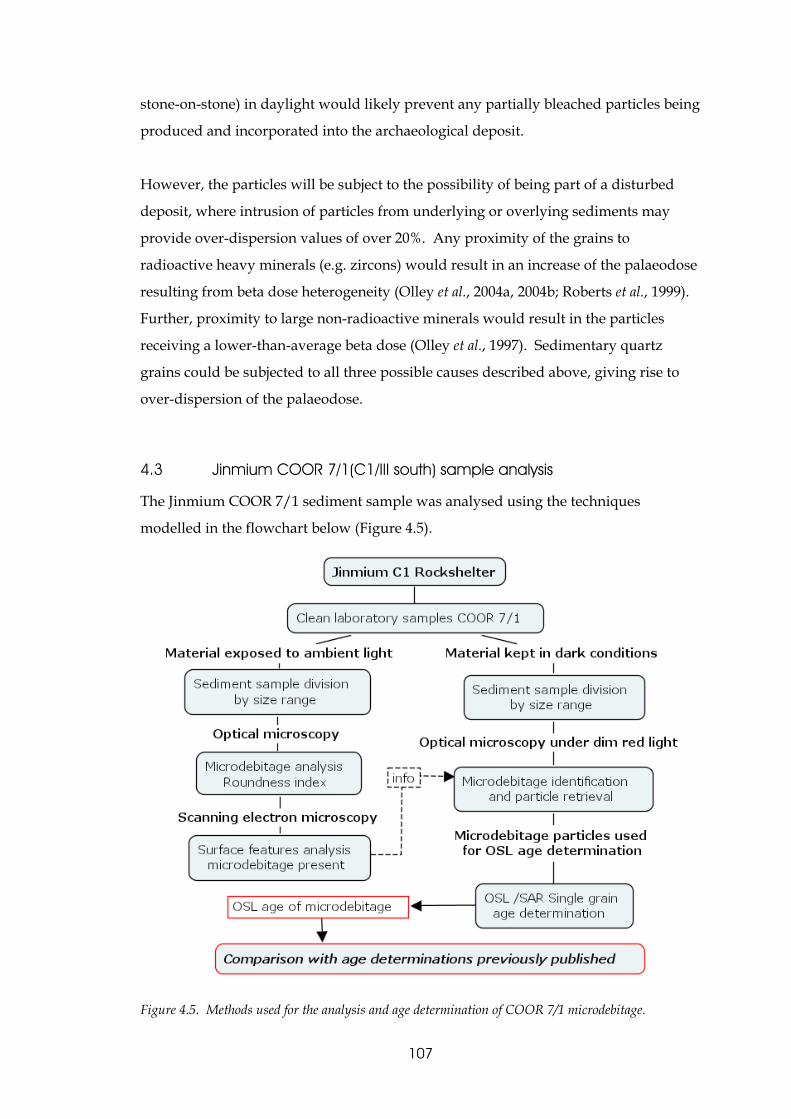
4.3 Jinmium COOR 7/1(C1/III south) sample analysis
The Jinmium COOR 7/1 sediment sample was analysed using the techniques
modelled in the flowchart below (Figure 4.5).
Figure 4.5. Methods used for the analysis and age determination of COOR 7/1 microdebitage.
107

The first part of the analysis entails the assessment of the existence of microdebitage in
the sedimentary sample (Figure 4.5 left). This light exposed material is used to
determine the difference between microdebitage and sediment by imaging over 100
grains under SEM, and determining the general roundness of the sediment (Figure
4.6). Once it is known that the roundness index for the sediment is much higher than
that of microdebitage, the material is sorted under optical stereomicroscopy.
The light exposed sedimentary material in the 500-1000 µm size range provided a
roundness index of 0.46, with Powers’ index scale (using the visual comparison chart
from Figure 2.3 in Chapter 2) categorising the sediment sample as sub-rounded.
Microdebitage has a roundness index of between 0.12-0.25 (very angular to angular),
making microdebitage easily discernable within this sample of sediment.
Figure 4.6. Jinmium COOR 7/1 sediment. Composite SEM micrograph used for roundness index analysis.
The sedimentary material is analysed under stereomicroscopy, and material
resembling microdebitage is removed for a more detailed analysis under SEM. Under
SEM/EDAX, the material that is microdebitage is counted to determine amounts of
microdebitage and the material composition (Figure 4.7).
108

If quartz microdebitage is found and quantified in the exposed sample, the sample not
exposed to white ambient light is used for optical stereomicroscopy, and the
microdebitage found is used for optical dating.
Figure 4.7. Jinmium COOR 7/1 quartz microdebitage and surface conchoidal fractures.
For this sample, 25 g of sedimentary material was cleaned, which produced 0.41 g of
material in the 500-1000 µm range, and 2.75 g in the 250-500 µm size. The 500-1000 µm
size range was used to find microdebitage. Five particles were found under
stereomicroscopy to be consistent with microdebitage.
Figure 4.8. Jinmium COOR 7/1, natural sedimentary particle. Surface features consistent with environmental diagenesis. The enlargement on the right shows solution and etching striations.
After the particles were analysed under SEM, out of five particles, two were found to
be quartz microdebitage (Figure 4.7), two particles were quartzite microdebitage, and
one was discarded as being a naturally broken grain (Figure 4.8).
109

Considering that four microdebitage particles were found in 0.41g of material, this
was sufficient to proceed with the material of 250-500 µm in diameter, retained under
red-filtered illumination, for OSL dating.
4.3.1 Optical age of microdebitage particles
From the sedimentary material kept under red filtered illumination (Figure 4.5 right),
129 particles of microdebitage were found in 23.1 g of sediment using optical
stereomicroscopy in a darkroom with a red-filtered light source.
The samples of microdebitage were etched with HF for 40 minutes, and then loaded
into the OSL reader as single grains on separate discs.
Three carousels were used for all the microdebitage particles (48 particles per
carousel). The microdebitage was given a first run as outlined in Table 4.5 and these
data were analysed.
Table 4.7. Single-aliquot regenerative-dose (SAR) protocol used for analysis of microdebitage. Run 1* Run 2 Run 3 Run 4 Run 5 Run 6 Run 7 Run 8 Run 9 Run 10 Natural (Dn)
Regen. dose 1 (R1)
Regen. dose 2 (R2)
Regen. dose 3 (R3)
Regen. dose 4 (R4)
Regen. dose 5 (R5)
Regen. dose 6 (R6)
Regen. dose 7 (R7)
Regen. dose 8 (R8)
Regen. dose 9 (R9)
25 Gy (Di)
15 Gy (Di)
35 Gy (Di)
50 Gy (Di)
0 Gy (D0)
25 Gy (Di)
2 Gy (Di)
5 Gy (Di)
10 Gy (Di)
Step Treatment 1
2 3 4 5 6 7
Give dose (Di) (no dose given for Dn and D0) Preheat 240oC, @ 5oC/s, hold 10 s 100 s OSL @125oC, 50% Blue diode power 10 Gy Test dose Heat 160oC, @ 5oC/s 100 s OSL @ 125oC, 50% Blue diode power Return to step 1, next regenerative dose (Rx)
* Natural luminescence is drawn from the aliquot at step 3 (after preheat) on Run 1.
This is the only sample analysed from the Jinmium rockshelter to which nine
regeneration doses were given. The original regeneration doses given to the particles
were Runs 2-7; later another 3 runs (run 8-10, regeneration doses 7, 8 and 9) were
added to the sequence in an attempt to target the sample’s natural dose with a closer
matching given dose.
110
The data analysis was done in the manner described in Chapter Two (section 2.5.2),
and the beta-source dose rate was corrected for grains of 400 µm in diameter.
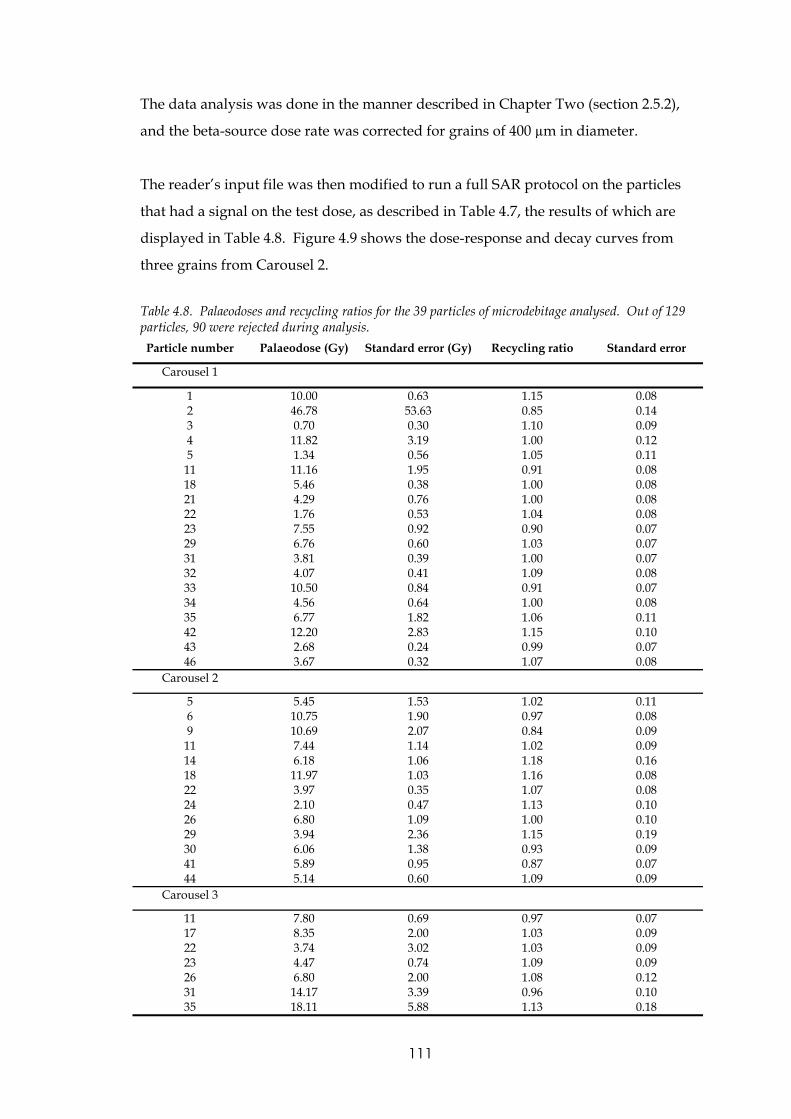
The reader’s input file was then modified to run a full SAR protocol on the particles
that had a signal on the test dose, as described in Table 4.7, the results of which are
displayed in Table 4.8. Figure 4.9 shows the dose-response and decay curves from
three grains from Carousel 2.
Table 4.8. Palaeodoses and recycling ratios for the 39 particles of microdebitage analysed. Out of 129 particles, 90 were rejected during analysis. Particle number Palaeodose (Gy) Standard error (Gy) Recycling ratio Standard error
Carousel 1
1 10.00 0.63 1.15 0.08 2 46.78 53.63 0.85 0.14 3 0.70 0.30 1.10 0.09 4 11.82 3.19 1.00 0.12 5 1.34 0.56 1.05 0.11 11 11.16 1.95 0.91 0.08 18 5.46 0.38 1.00 0.08 21 4.29 0.76 1.00 0.08 22 1.76 0.53 1.04 0.08 23 7.55 0.92 0.90 0.07 29 6.76 0.60 1.03 0.07 31 3.81 0.39 1.00 0.07 32 4.07 0.41 1.09 0.08 33 10.50 0.84 0.91 0.07 34 4.56 0.64 1.00 0.08 35 6.77 1.82 1.06 0.11 42 12.20 2.83 1.15 0.10 43 2.68 0.24 0.99 0.07 46 3.67 0.32 1.07 0.08
Carousel 2
5 5.45 1.53 1.02 0.11 6 10.75 1.90 0.97 0.08 9 10.69 2.07 0.84 0.09 11 7.44 1.14 1.02 0.09 14 6.18 1.06 1.18 0.16 18 11.97 1.03 1.16 0.08 22 3.97 0.35 1.07 0.08 24 2.10 0.47 1.13 0.10 26 6.80 1.09 1.00 0.10 29 3.94 2.36 1.15 0.19 30 6.06 1.38 0.93 0.09 41 5.89 0.95 0.87 0.07 44 5.14 0.60 1.09 0.09
Carousel 3
11 7.80 0.69 0.97 0.07 17 8.35 2.00 1.03 0.09 22 3.74 3.02 1.03 0.09 23 4.47 0.74 1.09 0.09 26 6.80 2.00 1.08 0.12 31 14.17 3.39 0.96 0.10 35 18.11 5.88 1.13 0.18
111

Figure 4.9. Dose-response (above) and decay curves (below) for 3 microdebitage particles analysed (Carousel 2) from sample COOR 7/1.
The radial plot (Figure 4.10 left) is derived from the data in Table 4.8, showing a
dashed line pointing to a dose of ~6 Gy, and the 2σ confidence interval is shown by
the grey shaded band.
Figure 4.10. Radial plots showing the palaeodoses and recycling ratios for sample COOR 7/1 microdebitage.
The central age model palaeodose for all the microdebitage particles is 5.94 ± 0.59 Gy.
The minimum age model value for this sample of microdebitage is 2.63 ± 0.34 Gy. The
plot of the recycling ratios for the first and last regeneration doses (R9/R1) shows that
112

tall but one of the microdebitage particles lie within 2σ of the value of 1 (Figure 4.10
right).
Figure 4.11. Frequency distribution of the COOR 7/1 microdebitage palaeodoses.
The histogram in Figure 4.11 shows the palaeodose distribution from the data in Table
4.8 and Figure 4.10. The sample exhibits a large variation in dose, which is also noted
in the radial plot (Figure 4.10 left). Roberts et al. (1999) described the sedimentary
material at this level of the deposit (115 cm from the surface) as containing grains of
different ages.
Table 4.9. Palaeodose, dose-rate and OSL age of Jinmium COOR 7/1 microdebitage.
Total dose rate differs from previous data (Roberts et al., 1998a). The dose rate is calculated assuming larger grains and non-spherical shapes (Fain et al., 1999). Optical age is calculated for 400 µm grain size. Number in brackets is the total amount of particles loaded into the OSL reader.
The age obtained using the central age model for microdebitage is of 10,200 ± 1100
years, and the minimum age model is 4500 ± 600 years (Table 4.9).
The age of the sediment, based on Roberts et al. (1999), is 14,000 ± 2000 years, using a
multiple-aliquot additive dose approach. Since the over-dispersion on the palaeodose
of COOR 7/1 microdebitage is 56% (well over the cut-off of 20% described for samples
of sedimentary quartz that has been well bleached), it is assumed that the sample is
composed of particles bleached at different times.
113

The conventional radiocarbon age derived from the area from where this sediment
sample was extracted is 860 ± 40 years BP (Roberts et al., 1999).
4.3.2 Discussion of sample COOR 7/1
The microdebitage from COOR 7/1 has an age that differs only slightly from that
determined by Roberts et al. (1998a, 1999) for the sedimentary quartz. The difference
in the age of microdebitage, and the age of the sediment, as published by Roberts et al.
(1998a, 1999), can be attributed to the methods used.
Figure 4.12. Palaeodose comparison of sample COOR 7/1 sediment. Left: multiple-aliquot additive dose data (Roberts et al., 1999: 370, Figure 2e). Right: radial plot showing the central age model (dotted line) and the minimum age model (grey band) palaeodoses for microdebitage.
Roberts et al. (1999) determined the palaeodose for COOR 7/1 using a standard
multiple-aliquot additive dose approach (Aitken, 1998), by using 48 aliquots to obtain
a single estimate of the palaeodose (8.1 ± 1.3 Gy).
The SAR single-grain method used here shows that there is a wide distribution of
doses from individual microdebitage particles, which is not apparent from the original
work for this sample (Figure 4.12). The resulting data of Roberts et al. (1999) are
114

plotted in Figure 4.12 left. The OSL age of the sediment is 14 ± 2 ka (Roberts et al.,
1999), while the microdebitage has a central age of 10.2 ± 1.1 ka (5.94 ± 0.59 Gy), and a
minimum age of 4.5 ± 0.6 ka (2.63 ± 0.34 Gy) (Figure 4.12 right).
The radial plot and the histogram show that the variation in palaeodose cannot be
contained within a 2σ band (grey band in Figure 4.10 left). This may be indicative of
sediment mixing, where grains of younger and older ages have intruded into this
level.
The radiocarbon age at 115 cm is 860 ± 40 years, a lower age than the microdebitage
and the sediment. The chronologically-closest upper and lower samples of
radiocarbon-derived ages are 2890 ± 90 years at 110 cm; and 3870 ± 70 years at 130 cm
in depth. The next sample down in the deposit has a radiocarbon age of 1100 ± 60
years at 142 cm in depth.
There is no correlation between the age of the microdebitage and the radiocarbon age
for this sample (142 cm depth). However, the 14C chronology is consistently younger
than the OSL chronology throughout the deposit. Further, the radiocarbon
chronology does not follow an age-depth line, where younger ages lie above older
ones. This is an indication of possible sedimentary disturbance, where the charcoal
has also been subjected to mixing.
Taking in consideration the tool manufacturing origin of microdebitage, the particles
should be bleached at the time of deposition; this should preclude the OSL sample of
microdebitage from being contaminated by partially bleached particles. However,
sediment mixing is possible as the microdebitage may move within the deposit with
other sedimentary material of comparable size and shape. Mixing is suggested from
the over-dispersion value of 56% for this sample.
The minimum age model is advocated by Olley et al. (2004b) for samples with over-
dispersion values in excess of 20%, and this yields an age of 4500 ± 600 years for the
microdebitage. However, the central age model of 10.2 ± 1.1 ka for the microdebitage
is closer to the age derived by Roberts et al. (1999) for the sedimentary quartz (14 ± 2
ka).
115

For both case studies in this research (Jinmium and Mushroom Rock), OSL age
estimation for microdebitage is based on the assumption that microdebitage does not
suffer from incomplete bleaching. However, both microdebitage and sedimentary
material may suffer from post-depositional mixing, by allowing intrusion of recently
bleached grains in to older sections of the deposit, and vice versa. Sediment mixing
will give rise to grains of differing ages contaminating the original sample, returning
higher and lower palaeodose estimates.
The two age models are used in this thesis: the central age model and the minimum
age model (Galbraith et al., 1999). Large microdebitage (500-1000 µm diameter) can be
easily recognised under optical microscopy, and would not be confused with naturally
broken sedimentary material, so the use of the central age model is appropriate for
large microdebitage, provided the individual palaeodoses are not over-dispersed by
more than 20%.
This threshold value accords with the observations of Olley et al. (2004b) and
Galbraith et al. (2005) that even well-bleached samples can have over-dispersion
values of up to 20%. Olley et al. (2004b) took this value to represent the approximate
threshold between well-bleached and incompletely bleached samples, and their
application of the minimum age model to the latter, and the central age model to the
former, produced OSL ages in accord with independent age control.
Smaller microdebitage (250-500 µm diameter), however, can suffer from
misidentification problems, with the surface features of naturally broken grains being
misidentified as microdebitage under optical microscopy. These misidentified natural
grains are part of the sediment and, therefore, may be subject to incomplete bleaching,
or they may be intrusive grains that have been bleached recently. These naturally
broken grains may return higher or lower palaeodose estimates than the
microdebitage, giving rise to over-dispersion values of more than 20%.
At Jinmium, it has been shown previously (Roberts et al., 1998a, 1999) that recently
bleached, intrusive grains are far fewer in number than incompletely bleached grains,
and unpublished data for Mushroom Rock (R. Roberts, personal communication)
indicates that the same is true at Mushroom Rock.
116

In such instances, the central age model will greatly overestimate the sample
palaeodose of the microdebitage component, and a closer approximation will be
obtained from the minimum age model. It is acknowledged, however, that the latter
may produce a slight age underestimation if naturally broken grains are abundant in
the data set. On the other hand, if no misidentification of microdebitage has occurred
and the sample over-dispersion is greater than 20%, then the minimum age model will
estimate the palaeodose associated with the youngest archaeological (mixing) event.
A variant on the minimum age model is the maximum age model, which provides an
estimate of maximum sample palaeodose (R. Roberts, personal communication). Such
a model may be appropriate in certain instances, but its application requires that post-
depositional intrusion of older microdebitage from the underlying levels can be
discounted, and that incompletely bleached, naturally broken grains have not been
inadvertently misidentified as smaller microdebitage.
Assurances cannot be given that these requirements are met at either Jinmium or
Mushroom Rock, so we have not used the maximum age model in this thesis.
The samples of microdebitage used for OSL dating were not examined under SEM. It
was observed (Chapter 3, section 3.2.1) that operator error in discerning between
microdebitage and natural quartz grains with an optical stereomicroscope, under red
incident light in a darkroom, might be as high as 40%. However, the application of
SEM, prior to the using the particles for OSL age determination, eliminated this error,
as demonstrated in the next sample analysed (COOR 1/3).
The COOR 7/1 analysis shows that microdebitage has a measurable OSL signal, and
that the palaeodoses and ages are consistent with those of the sediment derived by
Roberts et al. (1998a, 1999).
117

4.4 Jinmium COOR 1/3 (C1/III north) sample analysis
The techniques used to analyse sample COOR 1/3 differ from the previous sample. In
this study, the microdebitage used for OSL age determination was identified by SEM
prior to dating (Figure 4.13).
Figure 4.13. Methods used for the analysis and age determination of COOR 1/3 microdebitage and sediment.
For the analysis of sample COOR 1/3 (from 68 cm depth in the archaeological
deposit), the investigation was divided into two parts: the first part using material
exposed to light and the second on laboratory material kept under dim red
illumination. In the second part, the microdebitage was investigated with the aid of a
SEM prior to use of the particles for age determination (Figure 4.13). This sample was
thoroughly investigated by Roberts et al. (1998a), to test new OSL protocols (see Table
4.6 above). In this research, the sedimentary component of sample COOR 1/3 was
determined as having a roundness index of 0.454 for the material in the 500-1000 µm
diameter range (based on Powers’ roundness index). This makes the grains just
within the rounded category, which is substantially different from microdebitage that
118

usually is categorised as being very angular (Figure 4.14). Roundness index analysis is
applied to all samples also to determine roundness of the sedimentary material, to
ascertain if there are environmental changes in the sediment.
Figure 4.14. Jinmium COOR 1/3 sediment, composite image used for roundness index analysis.
As in the previous sample, this sample was firstly examined using material exposed to
ambient light. Both the preliminary analysis to find microdebitage, and the roundness
index, was conducted on sediments exposed to ambient light. The preliminary
analysis yielded two pieces of quartzite microdebitage in 0.53 g of material in the 500-
1000µm size range, from an original sample of ~50 g.
4.4.1 Optical age of sedimentary quartz grains
The sample used for OSL age determination was cleaned and treated under red-
filtered illumination in the same manner as the COOR 7/1 sample. Sedimentary
quartz of 250-500 µm in diameter was chosen for age determination. The total weight
of sample kept under red illumination in the laboratory was 34.46 g. The 250-500 µm
size range weight was 24.46 g. The sedimentary grains used for OSL age
determination were chosen after microdebitage particles had been removed from the
sample. Three OSL reader carousels containing 144 quartz grains (randomly chosen
from the sample) mounted on individual stainless-steel discs were used for age
determination of the sediment.
119

Table 4.10. Palaeodoses and recycling ratios for the 33 grains of sediment analysed. Out of 144 particles, 111 were rejected during analysis.
Grain number Palaeodose (Gy) Standard error Gy) Recycling ratio Standard error 40 6.54 1.80 1.10 0.12 45 6.44 0.75 0.89 0.10 2 3.46 1.10 1.04 0.11 4 6.53 0.49 1.00 0.07 5 4.83 1.16 1.17 0.16 8 2.52 0.33 1.00 0.08 9 11.36 0.87 0.94 0.07 11 3.88 1.04 1.00 0.08 12 6.21 0.56 1.01 0.07 14 8.08 2.68 1.18 0.18 20 2.83 0.34 1.04 0.08 29 2.64 1.50 0.94 0.13 31 1.89 0.57 1.06 0.13 32 2.58 0.47 1.14 0.11 35 3.60 0.36 1.00 0.07 36 3.90 0.45 0.86 0.08 39 3.28 0.47 0.94 0.08 40 10.71 0.87 1.06 0.08 45 4.65 0.47 1.03 0.08 2 1.57 0.43 1.11 0.09 4 4.25 2.42 1.08 0.13 5 1.71 0.21 1.14 0.08 10 3.60 0.38 1.17 0.09 14 0.73 0.11 0.93 0.07 18 24.15 5.16 1.10 0.11 19 0.74 0.46 0.97 0.07 22 1.11 0.33 1.04 0.08 23 2.95 0.39 1.00 0.09 25 11.61 2.63 1.06 0.12 26 16.55 4.82 1.11 0.11 41 2.61 0.45 1.10 0.10 42 3.73 0.70 0.98 0.08 44 0.70 0.25 1.07 0.12
Figure 4.15. Dose-response and decay curves for 3 sedimentary quartz grains analysed
120

Figure 4.16. COOR 1/3 sediment; palaeodoses (left) and recycling ratios (right). The grey bands represent the 2σ confidence intervals.
The SAR protocol and all the analyses were completed using the same settings as
described in Table 4.7, with a repeat regeneration dose of 10 Gy (R1 and R6) (Figure
4.15 shows the dose-response and decay curves of 3 selected grains). Table 4.10 lists
the palaeodoses of the 33 quartz grains remaining out of 144 grains inserted into the
OSL reader; the other 111 grains were rejected by the selection criteria used.
Figure 4.17. Frequency distribution of the palaeodoses for COOR 1/3 sediment.
Sediment from COOR 1/3 was determined to have a central age model palaeodose of
3.78 ± 0.54 Gy, with an over-dispersion of 78%. The corresponding age of the sample
121

(based on the central age model) is 5300 ± 800 years, and the minimum age is 1400 ±
300 years, which is comparable to the radiocarbon age of 1080 ± 90 years reported by
Roberts et al. (1999). The radial plot shows a wide distribution of palaeodoses (Figure
4.16 left), similar to that reported by Roberts et al. (1998a), which revealed that there is
evidence of sediment mixing and/or partial bleaching (Figure 4.18 right).
Table 4.11. Palaeodose and OSL age of the Jinmium COOR 1/3 sediment at 68cm.
Figure 4.18. Radial plots comparing COOR 1/3 palaeodoses with previously published data. Left, central age model (dotted line) and minimum age model (grey band) for sample COOR 1/3 sediment, analysed here. Right, central and minimum age model palaeodoses (upper and lower dotted lines) reported by Roberts et al. (1999), as derived from the SAR protocol.
Roberts et al. (1998a) reported an age of 4300 ± 600 years based on the multiple-aliquot
additive-dose technique; an age of 4500 ± 300 years (Figure 4.19) with a single-aliquot
regenerative-dose technique; and a central model age of 2200 ± 300 years and a
122

minimum model age of 300 ± 40 years for single grains. The radiocarbon age at a
depth of 68 cm in the archaeological deposit was 1080 ± 90 years.
Based on the palaeodose distribution and the dose rate, the central age for the
sediment of COOR 1/3 is within the range of ages reported by Roberts et al. (1998a)
(Table 4.11). However, the over-dispersion of 78% for the palaeodose of the sediment
reported here may indicate that the sample is mixed. The minimum age model
returned an age of 1400 ± 300 years for the most recently bleached grains in this
sample. It is possible that for the sample of sediment analysed, there are insufficient
grains (n=33) for accurate analysis; it is also possible that the over-dispersion value
may be more sensitive to outliers when using small data sets. The application of at
least 100 grains that passed the SAR criteria tests should be used.
Figure 4.19. Multiple-aliquot additive-dose results for COOR 1/3 reported by Roberts et al. (1999: 370), showing a palaeodose of 3.5 ± 0.5 Gy (OSL age of 4.3 ± 0.6 ka).
In this research, the sample of sediment from COOR 1/3 also has a wide distribution
of palaeodoses, similar to that reported by Roberts et al. (1998a, 1999). It is probable
that the sediments are mixed and that a portion of the quartz grains are partially
bleached or are derived from decaying sandstone in the vicinity of where the sample
was extracted.
123

4.4.2 Optical age of microdebitage particles
In the second part of this case study, microdebitage from COOR 1/3 was analysed.
The sample of microdebitage was firstly isolated from the sedimentary material by
optical stereomicroscopy under dim red illumination. In the darkroom, 63 particles
exhibiting microdebitage features were isolated and retained separately from 30.4 g of
sedimentary material.
The microdebitage particles were mounted in lines of 10 particles on a 2.5 cm diameter
SEM stub under red illumination. The stub was then coated with 10 nm of Pt in an
Edwards sputter coater. The stub was then placed in a Phillips XL 30 SEM for surface
analysis with a maximum beam intensity of 10 keV. At all times, the sample was kept
in dark conditions or exposed to dim red illumination.
Figure 4.20. COOR 1/3 quartzite microdebitage, SEM micrographs. The image on the right shows conchoidal fractures of quartz grains embedded in the matrix.
Figure 4.21. COOR 1/3, quartz microdebitage SEM micrographs. The image on the right shows conchoidal fractures on the particle surface.
124

The 63 particles were analysed using SEM. Figures 4.21 and 4.22 show quartz
microdebitage used for OSL age determination, and Figure 4.20 shows quartzite
microdebitage, also used for OSL age determination. Twenty-five particles (~40%)
were rejected as being naturally broken quartz grains, and 38 particles (~60%) were
confirmed as being microdebitage.
Figure 4.22. COOR 1/3 quartz microdebitage, SEM micrographs. The image on the right shows conchoidal fractures on the surface.
The SEM stub was returned to the OSL laboratory, where each particle’s position was
located on the stub, and those deemed to be naturally occurring grains were isolated
from the microdebitage using stereomicroscopy under dim red illumination.
The stub with the remaining 38 particles of microdebitage was cleaned with aqua
regia to remove the Pt coating, and the particles were then etched with HF as per
standard OSL sample preparation procedures. Four particles were lost during the
etching process. The remaining 34 particles were then mounted on stainless-steel
discs and the same, full SAR protocol applied as for the sedimentary material. The
results are displayed in Table 4.12 and Figures 4.23, 4.24 and 4.25.
Table 4.12. Palaeodoses and recycling ratios for the 5 particles of microdebitage analysed. Out of 34 particles, 29 were rejected during analysis.
Particle number Palaeodose (Gy) Standard error Gy) Recycling ratio Standard error 3 24.00 2.90 1.00 0.10 9 6.08 1.45 1.20 0.16
15 14.11 4.33 0.75 0.15 18 2.73 0.38 0.88 0.09 22 8.87 1.31 1.11 0.12
125

Only five particles of quartz microdebitage produced reliable data after the
application of the SAR protocol (Figure 4.23). Too few grains were retained to
produce a reliable age, but this analysis did show that the technique of using SEM to
distinguish microdebitage prior to OSL age determination works; in this instance,
revealing that ~40% of particles identified under optical stereomicroscopy were, in
fact, naturally occurring grains.
The microdebitage central age model palaeodose (8.7 ± 2.9 Gy) did not fall within the
central age model palaeodose range for the sediment. However, the minimum age
model for the palaeodose (2.8 ± 0.6 Gy) yields an age that is virtually the same as for
the sediment.
Figure 4.23. Dose-response and decay curves for the five microdebitage particles analysed.
126

The dose distribution for the microdebitage sample shows 3 particles that have
concordant palaeodoses at 2σ, and two with significantly higher and lower
palaeodoses.
The two palaeodoses falling outside the 2σ band are also the most precise estimates
(Figure 4.24). If the lowest palaeodose, 2.7 ± 0.4 Gy, and the highest, 24 ± 3.0 Gy are
eliminated, the remaining 3 particles have a central age model value of 8.7 ± 1.0 Gy. If
the highest and lowest palaeodoses are averaged alone, the central age model value is
8.1 ± 6.2 Gy. However, neither of these two grains could possibly fall within a 2σ
standardised estimate (Figure 4.24).
It is not known at this stage if the luminescence (and palaeodose) from quartzite is
different from that of quartz. Studies by Norbert Mercier (personal communication,
2002) on the TL signal from heated quartzite stones revealed that the amorphous silica
binder surrounding quartz grains does not produce any detectable anomalous results.
Figure 4.24. COOR 1/3 microdebitage, palaeodoses and recycling ratios.
Microdebitage from COOR 1/3 was determined to have a central age of 12 ± 4 ka,
derived from the central age model palaeodose of 8.7 ± 2.9 Gy, with an over-
dispersion value of 73%.
127

The minimum age model palaeodose is 2.8 ± 0.6 Gy, which corresponds to an age of
4.1 ± 0.9 ka, which is well within the age range for the sediment (Figure 4.24 and Table
4.13).
Figure 4.25. Frequency distribution of the palaeodoses for COOR 1/3 microdebitage particles.
Five palaeodoses are insufficient to reliably attribute an age to the sample (Figure 4.25
emphasises the spread in palaeodose from 3 to 24 Gy). In terms of palaeodose
reliability, each particle has passed all the SAR acceptance criteria, so each palaeodose
are considered valid; three out of the five particles fall within the 2σ standardised
estimate.
Table 4.13. Palaeodose and OSL age of the Jinmium COOR 1/3 microdebitage.
Total dose rate differs from previous data (Roberts et al., 1998a). The dose rate is calculated assuming larger grains (modified from Aitken, 1998) and non-rounded shapes (Fain et al., 1999). The size range of the grains is 250-500 µm. Number in brackets is the total of particles loaded into the OSL reader.
The sample’s palaeodose over-dispersion is 73%, showing different bleaching histories
for the microdebitage. The minimum age model is applied to determine the age of
this sample, given its large over-dispersion value, resulting in an OSL age for the
microdebitage of 4100 ± 900 years.
128

4.4.3 Discussion of sample COOR 1/3
When the COOR 1/3 microdebitage and the sediment palaeodoses are plotted
together (Figure 4.26), the result shows that the distribution of the palaeodoses from
the microdebitage falls within the palaeodose distribution of the sediment.
In the left plot (Figure 4.26), the 2σ grey band is centred on the central age model
palaeodose derived from the COOR 1/3 sediment grains. The right plot represents
the palaeodose distribution centred on the central age model palaeodose derived from
the COOR 1/3 microdebitage. All but one of the microdebitage particles have
palaeodoses consistent with those of the sediment grains (the exception is the top red
circle in the radial plots, Figure 4.26).
Figure 4.26. Radial plots of the palaeodoses for COOR 1/3. Black triangles are the sediment palaeodoses; red circles represent the microdebitage palaeodoses. Left, centreline at 3.5 Gy dose. Right, centreline at 8.6 Gy.
The lack of sufficient data for the microdebitage makes this sample unreliable as
regards estimating the sample’s ‘average’ age. However, the individual
microdebitage palaeodoses are considered valid and may show the existence of
several archaeological events mixed in one area of the deposit. Roberts et al. (1998a)
concluded that the presence of high-dose grains (e.g. zircons), and beta-
microdosimetry heterogeneity, more generally, are insufficient to explain the spread
in palaeodose. They considered that the more likely cause of palaeodose variation
129

was the insufficient bleaching of quartz grains before burial, therefore, dismissing the
beta-dosimetry complications as the major, or sole, cause of palaeodose over-
dispersion. With the over-dispersion of microdebitage and sediment samples being
well over 20% the minimum age model is used here, giving an OSL age of 1400 ± 300
years for the sediment, and 4100 ± 900 years for the quartz microdebitage. The latter
represents the age of the youngest microdebitage at this level, into which it may have
intruded from the overlying levels. The age determination on this sample undertaken
by Roberts et al. (1998a) was more thorough that those explored above, which are to be
seen as experimental testing and not a definitive argument towards age determination
of the Jinmium site. However, the technique used and the models presented are
comparable to those previously published (Galbraith et al., 1999; Roberts et al., 1998a,
1999).
To compare the OSL ages of COOR 1/3 with those obtained by an independent dating
technique, the charcoal samples collected during the 1995 excavation gave an AMS
radiocarbon age for COOR 1/3 of 1080 ± 90 years (Roberts et al., 1998a). This age is
comparable with the age obtained using the minimum age model for the sediment
analysed in this research. However, the radiocarbon age is lower than the central age
model OSL age determinations undertaken on sediments from sample COOR 1/3,
either by Roberts et al. (1998a) or by this research. It is possible that the sample of
charcoal, similarly to the sedimentary material (having an over-dispersion of over
20%), is composed of mixed age particles (Bird et al., 2002).
4.5 Synthesis and discussion of the Jinmium case study
This case study has investigated the questions outlined at the beginning of the
Chapter. It is possible to isolate microdebitage from other sedimentary material, and
it is possible to determine the age of microdebitage independently from the sediments,
by OSL. The microdebitage age can be related to that of the sediment, but it may not
necessarily be the same. The dynamics of the sediment, movement and bioturbation
may cause sedimentary grains to move around in the deposit. This will also be so for
the microdebitage (and the charcoal, too).
The integration of the various methods has been partially successful, with the
exception of the optical microscopy under dim red illumination for sedimentary
130

material under 500 µm in diameter. The integration of SEM and OSL has been studied
and applied to COOR 1/3 microdebitage.
Microdebitage surface morphology was difficult to discern for material of 250-500 µm
in diameter when examined under red illumination by optical stereomicroscopy alone
(as for the COOR 7/1 sample of microdebitage). While microdebitage of 500-1000 µm
in diameter is easily recognisable under dim red lighting conditions, it was noted that
the smaller microdebitage size (250-500 µm in diameter) was more difficult to discern
from the Jinmium sedimentary background. This prompted the application of SEM to
the quartz particles prior to OSL dating.
All due care has been taken in the identification of microdebitage with optical
microscopy under dim red illumination. However, the possibility remains that some
naturally occurring broken grains have been misidentified as microdebitage.
The use of SEM, with the restriction to a maximum of 10 keV beam intensity and
maintaining the samples under red illumination (the only exception being during
coating, when the sample is exposed to a very dim blue light produced by the argon
arc), has produced no discernible effects upon the OSL traps in quartz. OSL age
determination on microdebitage and sediment has produced some interesting and
comparable results.
The OSL samples reviewed in this chapter have all been noted previously in the
literature as containing grains with a mix of ages. This research has also found that
there is a high likelihood of sedimentary mixing in the samples, shown by the large
intra-sample palaeodose variations (far too large to explain solely as the result of beta-
dosimetry complications).
In this case study, the emphasis has been on comparability of methods and results.
The results indicate that some similarity exists with the original work (Fullagar et al.,
1996). The OSL protocols used by Roberts et al. (1998a) are directly comparable with
those used in this research. For COOR 1/3 and COOR 7/1, the age determinations of
the microdebitage compared favourably with the results published by Roberts et al.
(1998a) for the sedimentary quartz (Table 4.14).
131

Table 4.14. OSL ages obtained in this research compared with those published previously. Roberts et al. (1998a)
Palaeodose protocol
Age (ka)
Sample depth
This study
Palaeodose protocol
Age (ka)
COOR 1/3 Sediment
MA SA
4.3 ± 0.6 4.5 ± 0.3
COOR 1/3 Microdebitage
SG central SG minimum
12 ± 4 4.1 ± 0.9
SG central SG minimum
2.2 ± 0.3 0.3 ± 0.04
68 cm COOR 1/3 Sediment
SG central SG minimum
5.3 ± 0.8 1.9 ± 0.4
COOR 7/1 Sediment MA 14 ± 2 115 cm COOR 7/1
Microdebitage SG central SG minimum
10.2 ± 1.1 4.5 ± 0.6
MA= multiple aliquot. SA= single aliquot. SG= single grain. Central= central age model. Minimum= minimum age model.
The analysis of the microdebitage in COOR 1/3 has produced some unexpected
results, given the lack of any anomalous process in the application of SEM prior to
OSL analysis.
The over-dispersion for the sample of microdebitage was 73% for the 5 particles
analysed, while the over-dispersion for the sample of sediment is 78%, as shown in
Figure 4.24. The over-dispersion on both samples is rather high, so the likelihood that
the sample contains a mixture of sedimentary material from overlying (younger) and
underlying (older) levels is similarly high.
It has been assumed that microdebitage is not subject to partial bleaching; so post-
depositional mixing may be the sole or major cause of the high over-dispersion, with
partial bleaching being of only minor importance. However, beta-dose heterogeneity
cannot be entirely rule out as a potential contributor to over-dispersion.
Application of the minimum age model to the COOR 1/3 microdebitage produced an
age that is comparable to that obtained using the central age model for the sediment
(Roberts et al., 1998a) (Table 4.14, this study). The central age model result of 12,000 ±
4000 years for the microdebitage does not have any comparable parallel in the
published literature, except for a similarity with the TL age-depth curve for the C1/III
excavation (i.e. not an actual determined age for that level) shown as a blue circle in
Figure 4.28.
Considering that the five particles analysed have palaeodoses that differ widely from
each other and that all but one fall within the range of palaeodoses for the sediment
(Figure 4.26), further data are required to give a reliable central age model palaeodose.
132

There may also be some ambiguity arising from multiple OSL signals in the COOR
1/3 microdebitage sample, in which quartzite particles were used. The palaeodose for
the quartzite particles is derived from small quartz grains embedded in the matrix, so
the OSL signal is derived from multiple grains of smaller size, rather than from one
particle of quartz per se.
Figure 4.27. SEM micrograph of quartzite microdebitage from Jinmium COOR 1/3 sample.
According to research undertaken by Dr Norbert Mercier (CNRS Laboratoire des
Sciences du Climat et de l’Environnement, Gif-sur-Yvette, France, personal
communication) on the TL signal from heated quartzite stones, there is no detectable
signal from the amorphous silica binding in the matrix.
However, at high magnification under SEM (1000x), quartzite microdebitage presents
crystal growth within the matrix (Figure 4.27). There may be little or no differences in
OSL behaviour between quartz and quartzite, but it would be advisable to test these
assumptions further.
As an observation, the minimum age model palaeodose for the microdebitage
approximates that of the central age model palaeodose for the sediment analysed in
133

this case study (Table 4.14). The COOR 1/3 sediment sample was analysed using the
same basic technique applied by Roberts et al. (1998a), and it has a comparable age
with the published data (Table 4.14 and 4.15). However, this observation is not
justification for accepting the minimum age model result for the microdebitage.
Table 4.15. Previous age determinations of the Jinmium rockshelter (C1/III) archaeological deposit in comparison with the results of this research.
OSL (M), mean palaeodose from multiple aliquots. OSL (S), single aliquots composed of multiple grains. OSL SG central, single grain central age model. OSL SG minimum, single-grain minimum age model. TL, thermoluminescence. 14C, radiocarbon (AMS or conventional). In bold, samples analysed in this research. In red, minimum age model. O-D = Palaeodose over-dispersion.
The COOR 7/1 microdebitage sample analysis is not comparable with the method
used by Roberts et al. (1999). The multiple-aliquot additive-dose method used by the
latter gives a palaeodose based on the average of all aliquots used. So if the sample
incorporates grains of mixed ages, including partially bleached grains, then the
analysis will overestimate the palaeodose, as seen for sample COOR 2/2 at 110cm in
depth (Table 4.16). When the age of the microdebitage from 115 cm depth is
134

compared with the age of sample COOR 2/2 (from 5 cm above COOR 7/1, on the
opposite face of the excavation), the single-grain OSL ages for the sediment are
comparable with those of COOR 7/1 microdebitage (Table 4.15). When the ages of the
microdebitage and sediment are plotted against the original results of the TL dating
programme (Fullagar et al., 1996), the ages for the sedimentary quartz obtained in this
analysis are consistent with the TL ages from the auger samples taken in 1996 from the
sand sheet outside the rockshelter (Table 4.16 and Figure 4.28).
Table 4.16. Comparison of results from this case study with TL, OSL and radiocarbon ages in other areas of the Jinmium archaeological site. Auger holes 4 and 5 compared with C1/IV and C1/III microdebitage and sediment ages.
Sample Excavation Depth (cm) Method Age (years BP) W1573 Auger 4 35-50 TL 3900 ± 500.
Beta 83636 C1/IV 65 14C 2920 ± 70 OZC539 C1/III 68 14C 1130 ± 110
COOR1/3 M C1/III 68 OSL SG central 12,000 ± 4000 COOR1/3 M C1/III 68 OSL SG minimum 4100 ± 900 COOR1/3 S C1/III 68 OSL SG central 5300 ± 800 COOR1/3 S C1/III 68 OSL SG minimum 1900 ± 400
W1574 Auger 4 75-85 TL 5200 ± 600 W1749 Auger 5 100 TL 7200 ± 900
OZA305 C1/III 115 14C 860 ± 40 COOR 7/1 M C1/III 115 OSL SG central 10,200 ± 1100 COOR 7/1 M C1/III 115 OSL SG minimum 4500 ± 600
W1575 Auger 4 120-135 TL 10,300 ± 1000 W1576 Auger 4 155-157 TL 10,500 ± 1300 W1750 Auger 5 200 TL 16,700 ± 1600
M = microdebitage. S = sediment. OSL SG = Single grain SAR protocol. Central = central age model. Minimum = minimum age model. In bold, samples analysed in this case study. In red, minimum age model.
Figure 4.28. Age-depth graph of the TL age determinations and the results of this case study (graph modified from the original published in Fullagar et al., 1996: 762).
135

A demonstration of minimum and maximum ages from OSL dating can be seen in the
two examples below (Figures 4.29 and 4.30), where the sensitivity of the central age
model to individual data points is shown. This demonstration is concerned with the
issue of what constitutes a valid OSL central age model palaeodose (with acceptable
data), and what are the minimum requirements for a reliable age.
Figure 4.29 shows the radial plot for COOR 1/3 sediment on the left; the red arrow
points to the highest palaeodose with the smallest relative error. On the right, the
radial plot shows the spread of data points without the highest palaeodose.
Figure 4.29. Radial plots. Left, COOR 1/3 sediment palaeodoses. Right, same but without the highest and most precise palaeodose estimate (red arrow in the left plot). The black arrow indicates that the central age model palaeodose estimate has decreased by 0.14 Gy.
The difference in the central age model estimate of the sample palaeodose (and age) is
minimal. The full data set (left plot) gives a central age model palaeodose of 3.78 ±
0.54 Gy. With the one point removed (red arrow), the resulting data (plotted on the
right) gives a central age model palaeodose of 3.64 ± 0.52 Gy, which is only marginally
smaller than the original. Both palaeodoses overlap at 1σ, showing that the central
age model estimate of the palaeodose is not sensitive to the inclusion or exclusion of
individual, high-precision values in this sample.
136

If the same approach is taken for the microdebitage sample from COOR 1/3, then
when the highest palaeodose with the smallest relative error is removed from the
analysis (Figure 4.30, red arrow), the central age model palaeodose falls to 6.5 ± 1.1
Gy. This is statistically indistinguishable at the 1σ level from the original palaeodose
of 8.7 ± 2.9 Gy.
Figure 4.30. Radial plots. Left, COOR 1/3 microdebitage palaeodoses. Right, same but with the highest and most precise palaeodose point removed (red arrow in the left plot). The black arrow indicates that the central age model palaeodose estimate has decreased by 2.2 Gy.
More data points with smaller relative errors, and a majority of palaeodoses lying
within a 2σ grey band, would make the OSL age determination more precise. The less
spread outside the 2σ band, the more likely also that the central age model estimate is
an accurate reflection of the true sample palaeodose.
In reply to the questions posed in the opening paragraphs of this Chapter, this case
study has shown that the model of operation (based on Figure 3.1 in Chapter 3), and
its modifications can be applied successfully.
1. It is possible to isolate quartz microdebitage from the sediment. The use of SEM
and optical stereomicroscopy, in the first part of the methodology (using material
137

from the deposit exposed to white ambient light), has helped in identifying and
isolating microdebitage. With the information received from this first analysis, it was
easier to distinguish between microdebitage and sedimentary quartz in the 500-1000
µm size range under dim red illumination. However, when the smaller size range
(250-500 µm in diameter) was analysed, it was difficult to accurately differentiate
microdebitage from naturally broken grains. The error in misidentification can be as
high as ~40%. This problem was eliminated by the application of SEM prior to
extracting the OSL signal from the particles. It is possible to isolate quartz
microdebitage from the sediment with optical stereomicroscopy alone for samples of
sediment 500-1000 µm in diameter (COOR 1/3). For samples of 250-500 µm in
diameter, the use of SEM becomes increasingly important when the roundness index
for the sediment becomes close to that of the microdebitage, and when there are many
naturally broken grains in the sediment. From previous tests (Chapter 3) and the
application of SEM to the microdebitage from COOR 1/3, it appears feasible and
practicable to apply SEM to microdebitage and use the same material for OSL age
determination.
2. It is possible to determine the age of microdebitage independently from that of the
sediment in which it was found. By applying the OSL SAR technique to quartz
microdebitage, this case study has shown that microdebitage is viable for use in OSL
age determination. The ambiguities in the OSL ages obtained are mainly due to the
small amount of material used. In this research the samples were restricted to the
amount of material available for analysis, and in many cases it may have been
insufficient for a comfortably valid age determination. It is suggested that when
applying the OSL single grain technique to microdebitage, the data for at least 100
particles that passed the SAR rejection criteria be used for OSL age determination.
The application of the minimum age model is also problematic. If the over-dispersion
on the palaeodose is caused by sediment mixing, and older and younger
microdebitage has intruded within the sample, the central age model may be more
appropriate. If only older microdebitage has intruded, then the minimum age model
can be applied.
3. It is possible to apply SEM to microdebitage and to then use the same material for
OSL age determination. Although not proven, microdebitage may not be subject to
partial bleaching because of its very mode of production; hence, it is the age of
138

139
artefacts (and archaeological events) within the deposit that is direct the source of
information. Using OSL to determine the age of sediments and artefacts separately
should lead to a better understanding of the nature of movement of artefacts within an
archaeological deposit. Microdebitage may interlock with sand grains, therefore being
subjected to the same turbation as the rest of the sediment, or it may move separately
because it has a different shape and surface morphology to that of the surrounding
sand grains. Although outside the scope of this research, this problem needs to be
studied further, as the need for detailed geomorphological and chronological
information is imperative. It is envisaged that detailed microdebitage and sediment
age determination be applied to the entire deposit, allowing for detailed resolution of
the processes occurring within.
4. Knowing the age of microdebitage has archaeological implications. The
archaeological implications of knowing the age of microdebitage are important as a
source of information for understanding the nature of site formation and post-
depositional processes. For the Jinmium site, OSL dating of microdebitage has
provided sediment-independent OSL ages for the two samples analysed. The
analyses showed that both samples had palaeodose over-dispersions of well over 20%,
which may be interpreted as the result of sediment mixing. The use of the minimum
or central age models is sometimes predicated on the basis of the percentage of over-
dispersion (i.e. over 20%: minimum age model; under 20%: central age model) (Olley
et al. 2004b). In this case, the OSL techniques applied here to microdebitage from the
Jinmium deposit encountered difficulties comparable to those reported in the existing
literature on sedimentary quartz from this site (Roberts et al., 1998a, 1999).
________________________________________________
The raw OSL data from the reader, the OSL data analyses (including decay curves dose-
response curves) and SEM micrographs of microdebitage and sediments can be viewed
in the CD-ROM attached to the inside back cover of this thesis (see Appendix E).
In the next Chapter, the case study of Mushroom Rock West archaeological site is
examined based on the analysis of microdebitage and OSL age determination without
the complete aid of scanning electron microscopy.