analysis of open innovation communities from the
TRANSCRIPT

Analysis of Open Innovation Communities from the perspective of
Social Network Analysis
Open Innovation is an emergent paradigm by which organizations make use of
their internal and external resources to perform their innovation processes. The
growth of information and communication technologies has facilitated the spread
of online open innovation communities, where users can share ideas as well as
commenting and evaluating ideas posted by other community members. In this
work, the behaviour of community members is analyzed from the perspective of
social network analysis. The final aim is twofold: first, to measure to what extent
the different forms of participation are correlated to each other; and, second, how
the collective intelligence evaluation schemes can be useful to identify those
users posting ideas which are potentially applicable by the organization. Obtained
results can help community managers and organizations to improve the efficiency
of the evaluation process when hundreds or thousands of ideas are shared through
the online community.
Keywords: Open Innovation communities; online communities; social network
analysis; zero inflated problems.
Introduction
Open Innovation refers to the use of external resources and partners to improve
the innovation capacity of the organization, and relies on the idea that invention and
innovation can emerge both inside and outside the company’s walls (Chesbrough et al.,
2006; Banerjee et al. 2010). Consequently, open innovation processes involve a wide
range of internal and external technology sources, and a wide range of internal and
external technology commercialization channels (Galbraith & McAdam, 2011). As a
difference to the traditional innovation model, this paradigm also assumes that the risks
derived from opening the innovation, such as the access to valuable information by
competitors or the loss of control over the innovation process, can be compensated by a
richer number of innovative ideas. The active integration of customers contributes to

reduce uncertainty about the market. This integration means that customers become an
active designer in the process of innovation.
Open innovation communities have emerged as a popular mechanisms to
integrate customers as part of the innovation process. This trend is explained because
Internet offers global accessibility and facilitates communication and interaction
between contributors for a comparatively low cost. The most viable approach for using
the crowd as a resource is through open innovation platforms on the Internet, which
have exponentially grow during the last years (Jeppesen & Lakhani, 2010; Mahr &
Lievens, 2012). Through these virtual environments, users or experts can share ideas
with the rest of the community, which can be geographically distributed all over the
world. In this sense, they are connected with communities of practice, which are
communities of users organized around circumscribed sets of activities, and their
members develop their own routines, formal and informal rules, and practices evolve as
a result of learning (Wenger, 1998).
Although open innovation communities constitute a form of virtual community
based on crowdsourcing, they exhibit important differences with respect to other type of
communities based on mass collaboration like open source software communities or
collaborative research communities. While in open innovation communities the focus is
on the firm or the product, and users are usually allowed to participate by posting,
commenting or evaluating ideas, the mass collaboration takes the form of self-
organizing bottom-up driven movements, where the idea is the carrier and focus of the
organization (Elmquist et al., 2009; Martinez-Torres & Diaz-Fernandez, 2013). This is
the case of open source communities, which exhibit a clear onion-like structure, with a
central core of highly active individuals, surrounded by other layers of progressively
less active individuals (Martinez-Torres et al., 2012). Open source communities don't

implement a collective evaluation system. Posting innovations requires a certain level of
expertise and modifications are decided by a reduced group of experts that constitutes
the core of the community. As a difference, open innovation communities are open to
all registered customers and users. They don't require a high level of expertise and users
are free to comment and score other users ideas. The final decision about the suitability
of ideas is carried out by the company, considering their own experts opinions and their
innovation strategic policies.
One of the most important challenges of open innovation paradigm is its
effectiveness in terms of performance. Prior studies have found a non-linear relationship
between open innovation and performance (Laursen & Salter, 2006). The main problem
is that the huge amount of generated information saturates company’s absorptive
capacity (Clausen, 2013). Posted ideas should be evaluated one by one by the
innovation department, even with the help of experts of the organization in some
specific topics. Ideas evaluation consists of reading the idea, assessing its applicability
attending to the strategic innovation policies of the organization and planning their
possible implementation in case they were finally accepted.
Some authors have tried to solve this problem by introducing a special group of
users, called lead users (von Hippel, 1986; 1988). They are characterized because they
can foresee innovations much earlier than the rest of users. Lead users have also the
ability to develop a fully functional solution for their needs (Morrison et al., 2004; Mahr
and Lievens, 2012). Therefore, they can be used to foresee future trends. According to
several authors (Morrison et al., 2004; Urban and von Hippel, 1988), lead users are
more active in the community than the rest of users of the community. That is, this
specific group of users can be identified by their characteristics of participation inside
the community.

This paper follows this approach and analyses the patterns of behaviour of the
community users by modelling the community as a social network, where nodes
represent the community users and arcs represent their interactions. Social network
analysis has been frequently used to analyze the key users in open source communities
(Toral et al., 2010) or the key players in mobile ecosystem (Basole, 2009). Both of them
corresponds to a micro structural analysis based on the topological properties of nodes.
In the case of open innovation communities there is a clear partition consisting of those
nodes whose ideas have been finally implemented by the company, as opposed to the
rest of users. Information about ideas implemented by the company is publicly shown,
as a general recognition to those users who post interesting ideas, and to encourage the
participation of the rest of users. The main contribution of this paper consists of
obtaining the features of participation which are more relevant to identify innovative
users, defined as those users whose ideas are finally implemented by the company. The
concept of influencer is specific to those communities open to a wide audience, like
open innovation communities or consumer communities. They don't need a certain level
of expertise or to became an expert through a learning process, as it is typical in more
specialized virtual communities, where the profile of brokers of knowledge is more
extended (Sowe et al., 2006). Additionally, their identification can save a lot of effort
and human resources in the process of evaluating ideas with potential applicability.
The rest of the paper is organized as follows: next section details the research
framework. Section 3 introduces the case study and the definition of variables. Section 4
explains the proposed methodology, and section 5 shows the obtained results, which are
discussed in section 6 as well as the main implications and limitations of this work.
Finally, the paper is concluded in section 7.

Research framework
Open innovation communities are organized around the possible innovations
that could be implemented over the products and services of an organization, and they
have proliferated from the emergence of Web 2.0 sites. They are different to other
online communities that works as digital repositories of information where users post
information at will, and contributions do not respond to any specific request for
information (Martinez-Torres & Diaz-Fernandez, 2013).
Open innovation communities allow each registered user to participate sharing
ideas, posting comments or evaluating ideas posted by other users. Previous works
show that users of an open innovation community tend to participate in all the allowed
modalities through the open innovation websites (Toral et al., 2011). The most typical
form of participation consists of posting ideas. However, community users can also
refine, improve or criticize a previously posted idea by posting comments associated to
this idea. According to previous research about participation in open innovation
communities, the user’s motivation to post ideas or comments depends on factors like
learning, cooperation and entertainment (Antikainen et al., 2010). Following the social
learning theory of Wenger (1998), learning implies a participation in a social
environment, as knowledge is acquired in the context in which it is generated. That
means that the users’ interactions through shared ideas and comments promote learning
from the community. Cooperation is achieved with the flow of resources in the
community, which facilitates the generation of new ideas (Faraj et al., 2011). Finally,
entertainment is stimulated when users feel engaged with the community, which in turn
is a consequence of the successful interactions with other users commenting or scoring
ideas. As a result, activity of users is encouraged when the posted ideas or comments
grow up the interest of other users, or generate a debate or discussion. Sometimes the

company participates in the discussion through some specific user to clarify some
aspects of the posted ideas.
The modality of participation scoring other users ideas provides a measurement
about user reputation. The received feedback in the form of a rating gives an idea of the
confidence one can have on the ideas posted by a specific user (Pujol et al., 2002).
Companies make use of this kind of community-based idea evaluation to facilitate the
process of identifying the best ideas (Berg-Jensen et al. 2010). Using the scoring
system, the community performs a collective judgment task improving the knowledge
transmission between the community and the company (Leimeister, 2010; Blohm et al.,
2011). Furthermore, selecting the most popular ideas has the advantage of transmitting
the message that the company is committed to users’ necessities. However, the
disadvantage is that this system requires the explicit and frequent involvement of users
that issue ratings, and the fact that most popular ideas are not always aligned with the
company innovation strategic policies.
This paper analyzes the participation of community users by modelling their
interactions as social networks. Using those users whose posted ideas were finally
implemented as the dependent variable, this paper demonstrates that community-based
evaluation fails in finding those ideas that will finally be implemented by the company.
Moreover, this paper identifies the features or variables which are more appropriate for
the identification of innovative users.
Case study and definition of variables
Dell IdeaStorm is a user innovation community where end users freely reveal
innovative ideas with the community members and Dell to improve its products and
services (Di Gangi & Wasko, 2009). This website represents a new way to listen to

customers on how to build the best products and services. Through IdeaStorm,
customers can post their ideas about existing and/or new Dell products, services and
operations. They have also the option of commenting other users' posted ideas,
suggesting improvements or criticizing them. As a result, a debate is generated around
those posted ideas which attracts the interest of the community. Moreover, users have
the option of scoring ideas following a collective evaluation system, through which
users can promote or demote ideas. Promoting an idea adds ten points to its current
rating, while demoting an idea subtracts ten points. Users are free to decide which ideas
they want to comment, promote or demote, and they can also choose doing any of the
three possible actions. Users have to register with an alias to be allowed to participate in
the community. This alias is unique and identify users whenever they post an idea, a
comment or a rating. Each user can participate as long as they are registered. From the
researcher point of view, one of the most attractive characteristics of open innovation
communities is the fact that historic information is publicly available.
A total of 1482 ideas shared were collected and processed. For each idea, the
information listed in Table 1 was extracted.
Table 1. Data extracted for each shared idea.
Title of posted idea Alias of the user that posted the ideas Comments
o Number of comments received o Alias of users commenting the idea
Promotions o Number of promotions received o Alias of users promoting the idea
Demotions o Number of demotions received o Alias of users demoting the idea
The community can be modelled as a social network, considering users as nodes
and arcs as interactions among users. Taking into account the mentioned modalities of

participation, three different social networks can be extracted: a comments network, a
promotions network and a demotions network.
A. Comments network
The comments network was built by processing the authors of comments
generated by the considered 1482 shared ideas. The total size of this network is 1381,
which includes those users who have contributed to the community posting ideas or
comments. The resulting network is a valued directed graph, which means that several
interactions between the same users can take place, and that the arcs are directed from
users commenting ideas to the user who originally posted the idea. Figure 1 and Figure
2 display the comments network. The area of nodes has been drawn proportional to their
in-degree value in the case of Figure 1, and to their out-degree value in the case of
Figure 2.
Figure 1. In-degree values of the Comments network
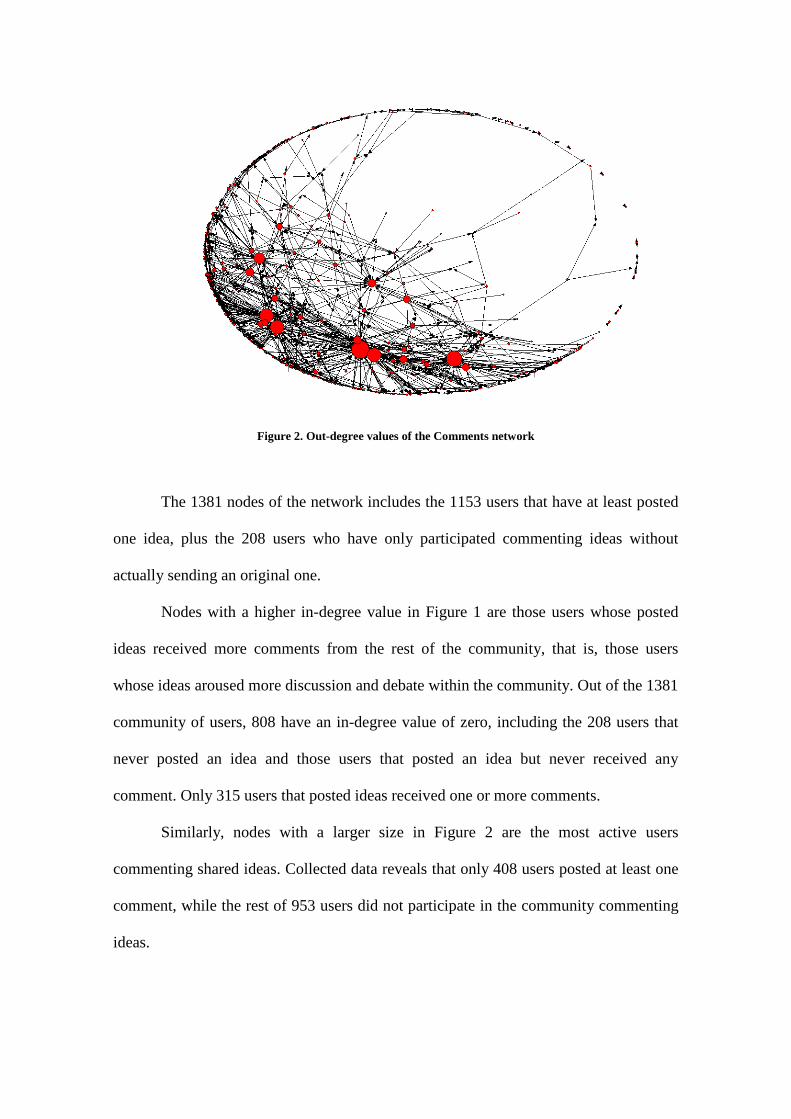
Figure 2. Out-degree values of the Comments network
The 1381 nodes of the network includes the 1153 users that have at least posted
one idea, plus the 208 users who have only participated commenting ideas without
actually sending an original one.
Nodes with a higher in-degree value in Figure 1 are those users whose posted
ideas received more comments from the rest of the community, that is, those users
whose ideas aroused more discussion and debate within the community. Out of the 1381
community of users, 808 have an in-degree value of zero, including the 208 users that
never posted an idea and those users that posted an idea but never received any
comment. Only 315 users that posted ideas received one or more comments.
Similarly, nodes with a larger size in Figure 2 are the most active users
commenting shared ideas. Collected data reveals that only 408 users posted at least one
comment, while the rest of 953 users did not participate in the community commenting
ideas.

In summary, open innovation communities follow up an inequality participation
scheme similar to other online communities. This inequality participation means that a
majority of contributions are posted by a small fraction of the community (Toral et al.,
2010).
B. Promotions network
The promotions network is built considering users as nodes, and arcs as the links
between users promoting an idea and the author who originally posted this idea. Figure
3 and Figure 4 show the promotions network, emphasizing with a larger area those
nodes with a higher in and out degree, respectively. In this case, the network size is
2151. Again, it can be distinguished between users who have posted at least one idea
1153, and users who have promoted ideas but have never posted an idea, 998.
Figure 3. In-degree values of the Promotions network

Figure 4. Out-degree values of the Promotions network
Figure 3 clearly illustrates that shared ideas receive more promotions than
comments in comparison to the corresponding comments network of Figure 1. This
could be explained because it is much easier rating an idea than commenting it. Rating
ideas do not require any justification, while commenting an idea requires a previous
knowledge about the addressed subject.
Figure 4 shows the activity of the members of the community when promoting
ideas. Although nodes appear overlapped, it has been maintained the same scale when
representing the area of nodes for comparison purpose with previous networks. It can be
noticed that some specific users are quite prolific sending promotions (there are 5 users
with an out-degree higher than 500). Most of users have promoted at least one idea.
C. Demotions network
The demotions network is built in a similar way to the previous network, but
using demotions instead of promotions. Network size is 1459 (that is, the 1153 users

who have posted at least one idea, and the 306 users who have demoted ideas but have
never posted an idea). The meaning of the demotions network is the same as the
promotion network, but using the idea of demotion instead of promotion.
Figure 5 and Figure 6 displays the demotions network, being the size of the
nodes proportional to their in and out degrees. As in the corresponding promotions
networks, Figure 5 confirms that shared ideas generate more activity through scoring
than through comments. Figure 6 illustrates the presence of very active “demoter” users
with an huge out-degree value.
Figure 5. In-degree values of the Demotions network
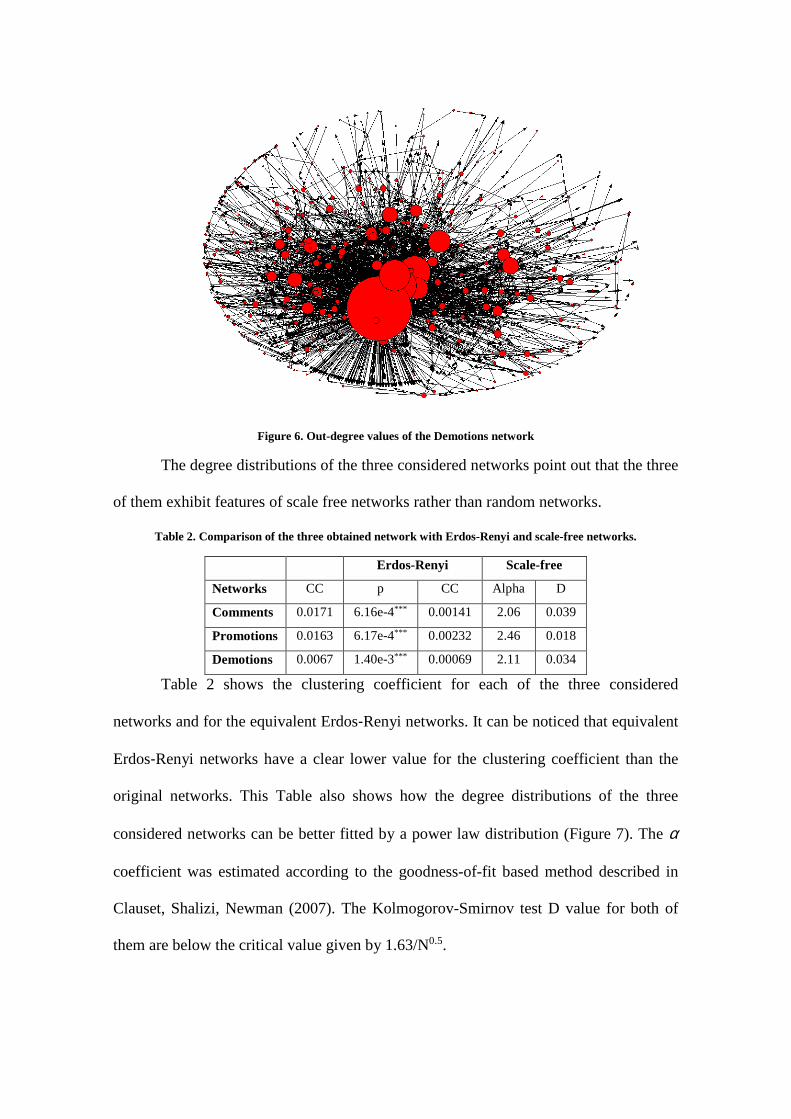
Figure 6. Out-degree values of the Demotions network
The degree distributions of the three considered networks point out that the three
of them exhibit features of scale free networks rather than random networks.
Table 2. Comparison of the three obtained network with Erdos-Renyi and scale-free networks.
Erdos-Renyi Scale-free
Networks CC p CC Alpha D
Comments 0.0171 6.16e-4*** 0.00141 2.06 0.039
Promotions 0.0163 6.17e-4*** 0.00232 2.46 0.018
Demotions 0.0067 1.40e-3*** 0.00069 2.11 0.034
Table 2 shows the clustering coefficient for each of the three considered
networks and for the equivalent Erdos‐Renyi networks. It can be noticed that equivalent
Erdos‐Renyi networks have a clear lower value for the clustering coefficient than the
original networks. This Table also shows how the degree distributions of the three
considered networks can be better fitted by a power law distribution (Figure 7). The α
coefficient was estimated according to the goodness-of-fit based method described in
Clauset, Shalizi, Newman (2007). The Kolmogorov-Smirnov test D value for both of
them are below the critical value given by 1.63/N0.5.
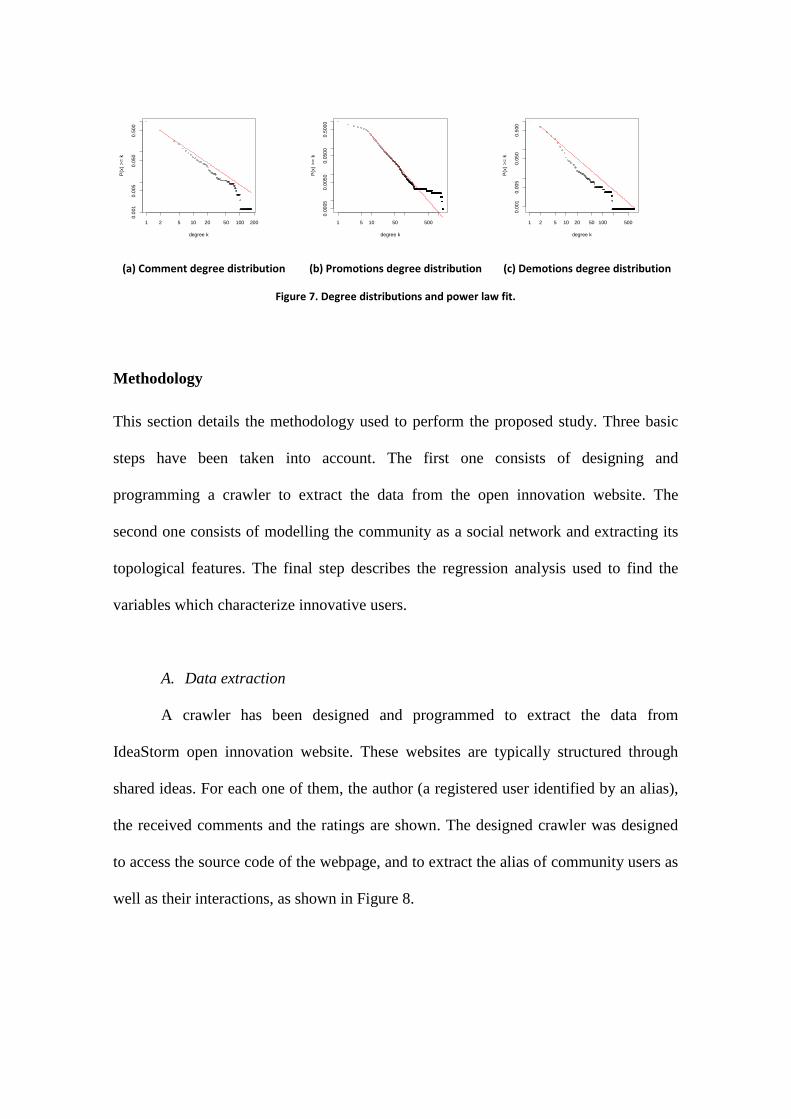
(a) Comment degree distribution (b) Promotions degree distribution (c) Demotions degree distribution
Figure 7. Degree distributions and power law fit.
Methodology
This section details the methodology used to perform the proposed study. Three basic
steps have been taken into account. The first one consists of designing and
programming a crawler to extract the data from the open innovation website. The
second one consists of modelling the community as a social network and extracting its
topological features. The final step describes the regression analysis used to find the
variables which characterize innovative users.
A. Data extraction
A crawler has been designed and programmed to extract the data from
IdeaStorm open innovation website. These websites are typically structured through
shared ideas. For each one of them, the author (a registered user identified by an alias),
the received comments and the ratings are shown. The designed crawler was designed
to access the source code of the webpage, and to extract the alias of community users as
well as their interactions, as shown in Figure 8.
1 2 5 10 20 50 100 200
0.00
10.
005
0.05
00.
500
degree k
P(x
) >
= k
1 5 10 50 500
0.00
050.
0050
0.05
000.
5000
degree k
P(x
) >
= k
1 2 5 10 20 50 100 500
0.00
10.
005
0.05
00.
500
degree k
P(x
) >
= k

Figure 8. Flow diagram of the designed crawler for extracting users and their interactions in open innovation communities.
Basically, the crawler performs a double processing of webpages, as shown in
the two inner loops of Figure 8. In the first loop, those webpages which contains the
shared ideas are accessed and processed to obtain the final list of users. These users are
identified by an alias that they choose when registering in the community. The second
loop obtains the interactions among users, extracting and processing those users that
have posted comments or ratings to shared ideas. The main advantage of using a
specific crawler instead of a general one is that the content can be filtered and processed
to obtain the desired elements.
B. Social Network Analysis
A social network is defined as a set of nodes connected by ties, and it is
primarily concerned with the interconnections between individuals, rather than being
focused on their attributes or behaviours (Wellman, 1983). This is the only available
information through online communities, where users are identified by an alias and their
activity is recorded in the form of messages, comments or ratings. When building the
social network, it has been considered that an user sending a comment to a shared idea
is linked not only to the author of the idea, but to all the community of users that
previously submitted comments to the same idea (Toral et al., 2010). The reason is that
it is more cognitively complex to reply to a threaded discussion than to a single
message, because the flow of earlier messages should be considered to post a coherent
new comment (Knock, 2001).
Once the network is built, social network analysis techniques provides a
powerful means for describing and analyzing individuals within a community structure.
One of the most representatives features of each node is its degree, which refers to the
number of lines incident with it (Toral et al., 2009). In the case of directed networks, the
indegree of a node refers to the number of arcs it receives, while the outdegree refers to
the number of arcs it sends. The outdegree of a given user is an indicator of his or her
activity in the different modalities of participation allowed by the innovation website,
while the indegree represents the popularity or reputation of each user (Lin & Kao,

2010). This features associated to the community of users will be correlated to
characterize their behaviour.
C. Regression Analysis
A regression analysis will be used to find the variables that characterize the
behaviour of innovative users. The dependent variable is the condition of being or not
an innovative user, which can be easily extracted from open innovation websites, since
they usually informs about those ideas that have been finally adopted. The main
problem with this dependent variable is that only a small fraction of shared ideas are
finally adopted by the company. Consequently, the dependent variable contains a high
number of zeros (which is the value assigned to the non innovative users) and a low rate
of ones (which is the value assigned to innovators). This kind of problems where the
dependent variable contains a disproportionally high number of zeros are known as zero
inflated problems, and they can lead to biased/inconsistent parameter estimates, inflated
standard errors and invalid inferences (Jang, 2005; Lee et al., 2006). Sometimes, this
problems can be addressed using zero inflated models, which consider a mixture of
models to deal with the excess zeros (Lambert, 1992). The justification for splitting the
distribution into two pieces is because zero values can be structural zeros, which are
inevitable, or sampling zeros, which occur by chance. However, this is not the case of
open innovation communities, where all the zeros are sampling zeros. The reason is that
whenever a user is sharing an idea, he has the expectation that his idea is going to be
adopted. The fact of implementing or not the idea relies on the company and its experts.
Therefore, there are no structural zeros and no reason for considering a mixture of
models. The alterative consists of considering generalized linear modelling with Poisson
distribution, because the response is discrete and includes zeros responses. But often

generalized linear modelling with Poisson distribution has problems with overdispersion
(Hinde & Demetrio, 1998). The model with negative binomial distribution is an
alternative way to fix overdispersion problem in Poisson distribution (Hinde &
Demetrio, 1998), as the variance and mean are not assumed to be equal. This is the
chosen regression model for this study.
Results
In and out degree of the comments, promotion and demotions networks are the
independent variables that have been considered in this study. They measure several
properties of users as part of the community. The three out-degree values refer to the
activity of the users in the three modalities offered by the IdeaStorm website
(Out_Comm, Out_Prom, Out_Dem). The in-degree of the comments network
(In_Comm) measures the users' popularity. In this case, users are visited whenever other
users read their posted idea and decide to post a comment. A high number of comments
received means the shared ideas are attracting the interest of the community. The scores
received through promotions and demotions constitute a measure about the good or bad
reputation of a given user (In_Prom, In_Dem), respectively. As it was shown in the
comments, promotions and demotions networks of Figures 1-6, the activity of users
commenting ideas is quite different to their activity rating ideas.
The dependent variable is given by those users whose ideas were finally
implemented by Dell (Innov). Table 3 shows the Spearman's rank-order correlations
between all these variables for the 1153 users that posted at least one idea. The
Spearman's rank-order correlation is the nonparametric version of the Pearson product-
moment correlation, and measures the strength of the association between ranked

variables, that is, how closely several sets of rankings agree with each other (Rencher,
2002).
Table 3. Correlation matrix of defined variables.
In_Comm Out_Comm In_Prom Out_Prom In_Dem Out_Dem Innov In_Comm 1,000 ,363** ,274** ,190** ,196** ,146** ,204**
Out_Comm ,363** 1,000 ,315** ,461** ,144** ,434** ,073* In_Prom ,274** ,315** 1,000 ,402** -,079** ,276** -,059*
Out_Prom ,190** ,461** ,402** 1,000 ,170** ,588** ,057 In_Dem ,196** ,144** -,079** ,170** 1,000 ,134** ,008
Out_Dem ,146** ,434** ,276** ,588** ,134** 1,000 ,054 Innov ,204** ,073* -,059* ,057 ,008 ,054 1,000
** Correlation is significant at the 0,01 level (2-tailed). * Correlation is significant at the 0,05 level (2-tailed).
When analyzing the partitions related to the in-degree values, it can be noticed a
positive but low correlation between comments and scoring (both positive and negative)
received. That means that ideas arising more debate in the community are not always
the best evaluated by the community. Correlation between promotions and demotions
received is almost zero, which means that the community is able to clearly distinguish
interesting ideas and to discriminate them from those with no potential applicability.
Therefore, it can be said that collective intelligence is working in the sense of
discriminating ideas.
Regarding the out-degree values, Table 3 shows that those active users posting
comments are also active promoting and demoting ideas. This means users tend to be
active in all the modalities of participation offered by the open innovation website. The
highest correlation coefficient value is obtained for promotions and demotions, result
which also supports the fact that a higher percentage of users prefer to participate
scoring ideas rather than commenting them.
The last column of Table 3 shows the correlation of innovators, defined as users
posting ideas which have been implemented by Dell, with the rest of variables
charactering the participative behavior of the community of users. It can be observed

the highest correlation coefficient is obtained with the number of comments received.
However, the correlation with the number of promotions received, or the activity of
users is low and non significant in some cases. A possible interpretation could be that
the evaluation system based on collective intelligence is able to discriminate good ideas
from poor ones, but in many occasions these well-evaluated ideas have scarce
applicability or are far from the company innovation strategies. In the case of
IdeasStorm website, ideas are scored by users without any previous information from
the organization, so users follow their own feelings when scoring them. This result
points out that there is a lack of agreement or alignment between the interest of users
and the interest of the company.
A negative binomial regression has been applied next to identify the key
determinants of the condition of being an innovator. The results of the estimation are
shown in Table 4.
Table 4. Negative binomial regression results.
Model estimation Coefficient p-value Constant -3.416*** < 2e-16 In_Comm 0.227*** 2.38e-12 Out_Comm 0.087* 0.019 In_Prom 0.071*** 0.000 Out_Prom -0.007 0.264 In_Dem -0.019 0.629 Out_Dem 0.007 0.825 Log Likelihood at maximum -298.120 Wald chi-squared 753,100*** Akaike information criteria (AIC) 316.119 Bayesian information criteria (BIC) 361.571 McFadden pseudo R2 0.162 Maximum likelihood pseudo R2 0.048 Cragg and Uhler's pseudo R2 0.183 *** p<0.001 ** p<0.01 * p<0.05
The negative binomial regression model predicting innovators is significant and
reveals that the number of comments received is the main predictor of the condition of
being an innovator. The number of promotions received and the number of comments

sent have also positive and significant coefficients, but with a much lower coefficient
value. The other three variables related to the promotions and demotions network are
not significant. These results highlight the importance of comments in open innovation
communities. Popularity measured in terms of comments received is the main
antecedent of being an innovator, in front of the number of promotions received.
Furthermore, the most useful indicator of activity of users for identifying innovators is
the activity of commenting other users ideas.
Discussion
This paper analyzes the participation features of users in open innovation
communities and considers how these participation characteristics can help to identify
the important subset of users proposing ideas potentially applicable. The analysis of
patterns of behavior in virtual communities have been previously used to detect special
group of users such as brokers of knowledge (Sowe et al, 2006) or core team members
(Martinez-Torres et al., 2010). The reason is that virtual communities are open to users
and contributors all over the world, and they are only identified through an alias.
Therefore, the only available personal information is the activity within the community.
This information is stored and can been analyzed for the whole community as a social
network (Pujol et al., 2002). Therefore, open innovation communities can be analyzed
as social network where each individual is characterized by his behavior with respect to
the rest of the community. The main distinctive characteristic of open innovation
communities is that posted ideas are independently evaluated by the company (status
associated to each shared idea), and by the community in the form of a scoring also
assigned to each idea. It is expected that collective intelligence applied to idea
evaluation can help the organization when selecting the best ideas to be finally

implemented. However, obtained results show a weak correlation between these two
forms of evaluation. The main drawback of the company evaluation is that it is a costly
and timely consuming task. Each idea must be individually evaluated and the
participation of experts related to the subject of the idea is continuously required.
Obtained results using regression analysis clearly highlight the importance of
comments for the identification of innovators (Bailey & Horvitz, 2010). The number of
comments received and sent are two of the three significant antecedents of the condition
of being an innovator. This result can be attributed to the fact that it is much more
complex to post a comment than a score. The in and out degree analysis show that
participation through the scoring systems is much more higher than participation
through commenting ideas. Besides, comments always requires a justification about the
critic or the improvement proposed, while scoring can be done without any justification
of the score. Users score thinking more on their feeling and their own necessities than
on the real applicability of the proposed ideas. Another important point is that
participation by commenting other users ideas promotes the construction of knowledge
through the interactions with other users. Obtained results point out that the best ideas
are those that receive more comments. This can be attributed to the social dimension of
knowledge, in the sense that ideas are improved or refined through the generated debate,
leading to more concrete and well formulated ideas, easier to be implemented by the
organization. Innovators are also characterized by their involvement with the
community by commenting other users ideas.
A. Implications for researchers
From a theoretical point of view, this study is aligned with von Hippel lead user
theory about lead user identification (von Hippel, 1986; 1988). Several of the identified
characteristics like popularity or high involvement with the community were already

anticipated in von Hippel's previous studies. Obtained results reinforce the alternative of
identifying best ideas through lead users rather than using collective intelligence scoring
systems.
This study also highlights the importance of "commenting" as a way of building
innovations through the interactions with other users. According to the obtained results
the number of comments received is by far the main variable able to identify innovators.
This result is in line with the social learning theory from Wenger (Wenger, 1998) that
argues that knowledge can only be built in the context in which it is generated. The
social learning theory have been used as the theoretical base for the development of
communities of practice, which in turn explains how virtual communities work (Toral et
al, 2009). In the case of open innovation communities it is a mechanism for improving,
refining, and formulating ideas more accurately. The more comments an idea receives,
the more chances to be implemented by the company.
B. Implication for practitioners
Understanding open innovation paradigm requires understanding the process by
which shared ideas are finally implemented by the organization. This study provides to
practitioners and open innovation websites managers a practical study about the main
participation variables which are able to explain the ideas which have more chances to
be implemented. From the organization perspective, this information can be used to
improve the idea evaluation procedures. Instead of relying on the collective judgement
of the community, the identified innovator features can be used as a first filter in the
task of looking for the best ideas. Through this way, the cost associated to the
evaluation of ideas can be reduced. Second, this study also reveals that the collective
scoring system could be improved if some justification of the posted score were asked
to participants. A score with an accompanying argument would encourage community

users to think in detail about the shared ideas and their possibilities for a real
implementation. Besides, the provided arguments can also be useful to build upon
previous arguments. The rest of users can be aware of why an idea is receiving a good
or a bad score, and their posted scores can support or contradict previous ones.
C. Limitations
The problem of having a large proportion of zero values can result in a loss of
important information and, thus, a diminished explanatory power, as it happens in our
study. The fact of not having structural zeros means that a standard distribution like
negative-binomial must be used instead of zero-inflated distributions that can properly
account for a large proportion of zero values when they have a structural nature. This is
an inherent limitation of open innovation communities, as only a small fraction of ideas
are accepted by the organization.
Another inherent limitation of the applied methodology is that SNA does not
take into account the quality of posted ideas and comments, but their quantity. The
problem of analyzing the content of shared ideas and comments is that online open
innovation systems receive thousands of ideas, and evaluating them one by one would
be a high time consuming task. That's the reason why this systems rely on the
judgement of the rest of the community. However, the patterns of participation have
already been used to analyze the structure of communities or to characterize those users
occupying relevant positions, for instance, in open source communities (Sowe et al.,
2006; Toral et al., 2010). This information could be complemented with some external
information about users, as the time since they registered in the community, their
persistence of participation along time, of the number of topics covered by their
innovations.
Finally, another limitation is some possible bias due to the way in which shared
ideas are displayed. Trending or most popular ideas are usually separately displayed and
this fact may cause that they can receive more comments and scores than the rest of
ideas. In general, ideas with easier accessibility will have more chances of being
commented and scored. This is the case of IdeaStorm website, which provides a direct
link to the most popular ideas.
Conclusion
This paper analyzes the open innovation paradigm from the perspective of social
network analysis. It models the interactions among the members of the community
through their comments and scores as graphs. It has also extracted several variables
based on the in and out degree values of users in each social network. Obtained results
show that open innovation communities follow an inequality participation scheme,
similar to other online communities. However, active users tend to participate in all the
modalities offered by the open innovation website. Scoring systems have also been
analyzed. Obtained results show that the scoring system based on collective intelligence
can unanimously discriminate between interesting and poor ideas. However, the best
ideas according to the collective scoring system do not match with those finally
implemented by the organization. This result is explained because no previous
information is provided to users about how the scoring should be done nor any
argumentation is required. On the contrary, the evaluation performed by Dell are in
more agreement with those ideas that have received a higher number of comments.

References
Antikainen, M., Mäkipää, M., Ahonen, M. (2010). Motivating and supporting
collaboration in open innovation, European Journal of Innovation Management,
13(1): 100-119
Bailey, B. P. & Horvitz, E. (2010). What's your idea?: a case study of a grassroots
innovation pipeline within a large software company, Proceedings of the SIGCHI
Conference on Human Factors in Computing Systems, CHI'10, pp. 2065-2074.
Banerjee, P., Friedrich, R., Morell, L. (2010). Open Innovation at HP Labs, Computer,
43(11):88-90.
Basole, R. C. (2009). Visualization of interfirm relations in a converging mobile
ecosystem, Journal of Information Technology, 24:144-159.
Blohm, I., Riedl, C., Leimeister, J. M. and Krcmar, H. (2011), Idea Evaluation
Mechanisms for Collective Intelligence in Open Innovation Communities: Do
Traders Outperform Raters?. Proceedings of 32nd International Conference on
Information Systems, pp. 1-24.
Chesbrough, H., Vanhaverbeke, W. & West, J. (2006). Open Innovation: Researching a
New Paradigm, Oxford: Oxford University Press.
Clausen, T. (2013). External knowledge sourcing from innovation cooperation and the
role of absorptive capacity: empirical evidence from Norway and Sweden,
Technology Analysis & Strategic Management, 25(1):57-70.
Clauset, A., Shalizi, C. R., Newman, M. E. J. (2009). Power-law distributions in
empirical data, SIAM Review, 51:661-703
Di Gangi, P. M., and Wasko, M. (2009), Steal my idea! Organizational adoption of user

innovations from a user innovation community: A case study of Dell IdeaStorm,
Decision Support Systems, 48(1):303–312.
Elmquist, M., Fredberg, T., Ollila, S. (2009) Exploring the field of open innovation,
European Journal of Innovation Management, 12(3):326 - 345.
Faraj, S., Jarvenpaa, S.L., Majchrzak, A. (2011). Knowledge Collaboration in Online
Communities, Journal of Organization Science, 22(5):1224-1239.
Galbraith, B., & McAdam, R. (2011). The promise and problem with open innovation,
Technology Analysis & Strategic Management, 23(1):1-6.
Hinde, J., and Demetrio, C. (1998), Overdispersion: Models and Estimation, Computational
Statistics and Data Analysis, 27:151-170.
Jang, T. Y. (2005). Count data models for trip generation. Journal of Transportation
Engineering, 131:444-450.
Jeppesen, L. B. and Lakhani, K. R. (2010). Marginality and Problem-Solving
Effectiveness in Broadcast Search, Organization Science, 21(5):1016-1033.
Knock, N. (2001) Compensatory adaptation to a lean medium: An action research
investigation of electronic communication in process involvement groups, IEEE
Trans. on Professional Communication, 44(4):267–285.
Lambert, D. (1992). Zero-inflated Poisson regression with an application to defects in
manufacturing, Technometrics, 34(1):1–14.
Laursen, K., and Salter, A. J. (2006). Open for Innovation: The role of openness in
explaining innovation performance among UK manufacturing firms. Strategic
Management Journal, 27(2):131-150.

Lee, A.H., Wang, K., Scott, J.A., Yau, K.K., McLachlan, G.J. (2006). Multi-level zero-
inflated poisson regression modelling of correlated count data with excess zeros,
Statistical Methods in Medical Research, 15:47–61.
Leimeister, J.M. (2010). Collective Intelligence, Business & Information Systems
Engineering, 52(4):239-242.
Lin, C.-L., Kao, H.-Y- (2010). Blog Popularity Mining Using Social Interconnection
Analysis, IEEE Internet Computing, 14(4):41-49.
Mahr, D., Lievens, A. (2012) Virtual lead user communities: Drivers of knowledge
creation for innovation, Research Policy, 41(1):167– 177.
Martínez-Torres, M.R., Toral, S. L., Barrero, F., Cortés, F. (2010). The role of Internet
in the development of Future Software Projects, Internet Research, 20(1):72-86.
Martínez-Torres, M.R. (2012). A genetic search of patterns of behaviour in OSS
communities. Experts Systems with Applications, 39(18):13182-13192.
Martínez-Torres, M.R., Díaz, C., Toral, S. L., Barrero, F. (2012). A text categorisation
tool for open source communities based on semantic analysis, Behaviour and
Information Technology, doi:10.1080/0144929X.2010.529942
Martínez-Torres, M.R., Díaz-Fernandez, C. (2013). Current Issues and Research Trends
on Open Source Software Communities, Technology Analysis & Strategic
Management, in press.
Morrison, P.D., Roberts, J.H., Midgley, D.F. (2004). The nature of lead users and
measurement of leading edge status, Research Policy, 33:351–362.
Pujol, J. M., Sangüesa, R., Delgado, J. (2002). Extracting reputation in multi agent

systems by means of social network topology, Proceedings of the first
international joint conference on Autonomous agents and multiagent systems,
AAMAS '02, pp. 467-474.
Rencher, A.C. (2002). Methods of Multivariate Analysis. 2nd ed. Wiley Series in
Probability and Statistics, John Wiley & Sons.
Sowe, S., Stamelos, I., and Angelis, L. (2006), Identifying knowledge brokers that yield
software engineering knowledge in OSS projects, Information and Software
Technology, 48(11):1025-1033.
Toral, S. L., Martínez-Torres, M.R., Barrero, F. (2009). Virtual Communities as a
resource for the development of OSS projects: the case of Linux ports to
embedded processors, Behaviour and Information Technology, 28(5):405-419.
Toral, S. L., Martínez-Torres, M. R., and Barrero, F. (2010) Analysis of Virtual
Communities supporting OSS Projects using Social Network Analysis,
Information and Software Technology, 52(3):296-303.
Toral, S. L., Martínez Torres, M. R., Di Gangi, P. (2011). User Innovations Through
Online Communities From the Perspective of Social Network Analysis, Proc. 1st
International Conference on Advanced Collaborative Networks, Systems and
Applications (COLLA 2011), Luxemburgo, pp. 40-45.
Urban, G. L., & von Hippel, E. (1988). Lead user analyses for the development of new
industrial products, Management Science, 34(5):569–582.
Von Hippel, E. (1986) Lead users: a source of novel product concepts, Management
Science, 32(7):791-805.

Von Hippel, E. (1988) The Sources of Innovation, New York, Oxford University Press.
Wellman, B. (1983) Network analysis: some basic principles, Sociological Theory,
1:155-200.
Wenger, E. (1998) Communities of practice: learning, meaning, and identity,
Cambridge, Cambridge University Press.