analysis of operating performance of bsnlanalysis of bharath sanchar nigam limited (bsnl)‖...
TRANSCRIPT
http://www.iaeme.com/JOM/index.asp 481 [email protected]
Journal of Management (JOM)
Volume 5, Issue 4, July – August 2018, pp. 481–495, Article ID: JOM_05_04_051
Available online at
http://www.iaeme.com/JOM/issues.asp?JType=JOM&VType=5&IType=4
Journal Impact Factor (2016): 2.4352 (Calculated by GISI) www.jifactor.com
ISSN Print: 2347-3940 and ISSN Online: 2347-3959
© IAEME Publication
ANALYSIS OF OPERATING PERFORMANCE
OF BSNL
Prof. M. Yadagiri
Dean, Faculty of Commerce and Business Management,
Telanagana University, Nizamabad, T.S
B. Rajaram
Research Scholar, Department of Commerce, Telangana University, Nizamabad, T.S
ABSTRACT
Bharat Sanchar Nigam Limited took over the business of providing of telecom
services and network management from the erstwhile Central Government
Departments of Telecom Services (DTS) and Telecom Operations (DTO), with effect
from 1st October‘2000. It is one of the largest and leading public sector units
providing comprehensive range of telecom services in the entire India except New
Delhi and Mumbai. BSNL is the only service provider, making focused efforts and
planned initiatives to bridge the rural-urban digital divide in ICT sector. The present
study is focused mainly to assess the operating performance of BSNL in terms of total
income, operational income, total expenses, employee benefit expenses,
administrative, operating and other expenses, profit before tax, tax expenses and
profit after tax. The operational revenue from sale of services of BSNL in initial years
2007-08 and 2008-09 is highest and from the 2008-09 onwards it has been declining
year after year up to 2012-13 and started increasing slowly from 2013-14 onwards.
The revenue from basic segment has been declining year after year, whereas the
revenue from cellular segment and broadband segment increasing. The operating
expenses of the BSNL has been increasing year after year from 2007-08 and the
major operating expenses are employee benefit expenses and administrative,
operating and other expenses. The EBIDT is highest in the initial years of study 2007-
08, 2008-09 and then after it has been declining year after and become negative in the
year 2013-14. From the year 2014-15 the EBIDT become positive and increasing.
Keywords: Basic, Cellular, Broadband, Leased Line.
Cite this Article: Prof. M. Yadagiri and B. Rajaram, Analysis of Operating
Performance of BSNL. Journal of Management, 5(4), 2018, pp. 481–495.
http://www.iaeme.com/JOM/issues.asp?JType=JOM&VType=5&IType=4
Analysis of Operating Performance of BSNL
http://www.iaeme.com/JOM/index.asp 482 [email protected]
1. INTRODUCTION
Operating performance refers measuring performance of a firm against standard or prescribed
indicators effectiveness and efficiency such as total profit, operating profit, profit before tax
etc. The operational income generated by BSNL only from the basic operations of sale of
telecom services such as Telephones other than Wireless in Local Loop, Cellular, Wireless in
Local Loop, Broadband services, Leased lines, Leased income from passive infrastructure,
Interconnection usage charges (IUC) from other service providers, Other Services and other
operating income which includes income from construction contracts, income from sale to
third party sales from telecom factories , Profit from manufacturing activities of telecom
factories etc., excluding the other incomes during the financial year.
2. REVIEW OF LITERATURE
Paul (2011) has mentioned that Bharat Sanchar Nigam Limited would be subjected to extra
financial liabilities like license fees, corporate tax, dividend payment, etc which were not
possible to erstwhile DOT.
Varadharajan Sridhar (2011) highlights the unique cost structure, tariff regulation, and
universal service obligations of basic telecom services. It dwells upon the different stages of
spectrum allocation and management, including third generation and broadband wireless
services. The trade-off between competition and industry efficiency due to limited spectrum
availability and fragmentation is well emphasized.
Dr. Kanchan Bhatia and Prof Prashanth Jain (2012) concluded that the performance
appraisal system helps to increase organizational effectiveness as appraisal encourages high
level of performance , identifies employees with potential , rewarding performance equitably
and determined employees need for development. These all activities support organisational
strategic orientation and achieve organizational effectiveness. In private sector the principle
measure of successful performance is profit. Public agencies, on the other hand, have no such
universal and widely accepted performance measures of success. However, performance is
judged against the goals their programmes and weathers the desired results and outcomes
have been achieved.
R.C.Upadhyaya & Vashundhra Sharma (2012) in their Research Article on ‗A
Comparative Study of the Telecommunication Service Providers BSNL and Airtel Operating
in Gwalior Division India‖ concluded that after analyzing the performance, they found that
the Wireless services provided by the Airtel are more satisfactory than the services provided
by the BSNL. The performances in case of Wire line and Broadband services are almost
similar in both the companies and there is need to improve the performance of BSNL in case
Wireless services.
Dr.M.Dhanabhakyam & Swapna Kurian (2012) in their Research Article ―Profitability
Analysis of Bharath Sanchar Nigam Limited (Bsnl)‖ calculated the Net Profit Ratio, Return
On Assets Ratio, Return On Equity, Earning Per Share and Cash Profit Ratio from the year
2001-02 to 2010-11 and concluded that the profitability ratios shows fluctuating trends except
last two years and the last two years ratios shows negative values except cash profit ratios.
N.Swapna (2012) in her Research Article ―Telecommunication Sector in India – An
Analysis‖ concluded that the telecom industry in India has witnessed a phenomenal and
manifold growth over the recent years. In the country, personalized telecom access has
become an essential necessity of life for a growing number of people. The telecom sector in
India holds unlimited potential talking of future growth. In the nation, both Public as well as
private firms are vigorously enhancing their technologies in a venture to take the telecom
industry in the country to a much higher development.
Prof. M. Yadagiri and B. Rajaram
http://www.iaeme.com/JOM/index.asp 483 [email protected]
Chhaya P.Patel, Asst.Professor & Smt.K.K.Patel (2014) concluded in their Research
Article on the ―study on Performance Appraisal System in BSNL‘ that practically there was
no appraisal in the organization. To be an effective tool, it has to be on the continuous basis
as in the absence of continuity, it becomes a redundant exercise. The very concept of
performance appraisal should be marketed throughout the organization. Unless this is done,
people would not accept it, be it how important to the organization.
Dr.Papori Baruah & Rashmi Baruah (2014) concluded in their Research Article ―Telecom
Sector in India: Past, Present and Future‖ that the growth and development of Telecom sector
of India has made it a key contributor in India‘s economic and social up gradation. Every
functional division and service provider of Telecom Sector of the country is trying to provide
world class telecom infrastructure in its area of operation to give services to its customers and
so, helping the country to progress in the global scenario.
Ms.Pritish, Dr.Taruna Saxena (2015) in their Research Article on ―An Analysis of the
Indian Telecom Industry‖ concluded that the Indian Telecom Industry contributes
significantly to the overall socioeconomic development of India. It is an essential tool for the
growth of the nation and the various telecom service providers offer voice and data services
to the customers across different regions of the country including both urban and rural areas
thereby facilitating the growth of this industry.
Anshu Gupta (2015) in his Research Article ―Financial Performance Evaluation of
Telecommunication with special reference to BSNL‖ concluded that the BSNL follows
aggressive policy of managing liquidity & company has sufficient liquidity assets to satisfy
its short term liabilities. After overhauling the five years balance sheets of BSNL and all
conditions, the author concluded that BSNL is facing the capital problem because of which
financial position of BSNL are affected. Financial position of BSNL was good in 2004
comparative to present year. Working process of BSNL takes long time because of which
BSNL is not being able to progress. The earned profits were more in the year 2005 but year
by year company is in a situation of downward profits. The profits of the company are
decreasing year by year due to maintaining high liquidity.
3. METHODOLOGY
The analysis of operating performance has made an attempt to assess the operating
performance of the BSNL on the basis of revenue sources and various types of operating
expenses for the period of ten years commenced from 2007-08 to 2016-17. The relevant data
collected from various issues of BSNL annual reports.
4. OBJECTIVES OF THE STUDY
The following are the fundamental objectives of the study;
1. To assess the revenue of the BSNL from sale of its services.
2. To know the segment wise total revenue of BSNL.
3. To identify the component wise operating expenses of BSNL.
4. To discuss the EBITDA, tax expenses and profit after tax of BSNL.
4.1. Revenue from Sale Services of BSNL
Broadly the revenue from the sale of services of BSNL can be classified in to the following
different types; i. Telephone Services, ii. Cellular Services, iii. Wireless in Local Loop
(WLL), iv. Broadband Services, v. Leased Lines services, vii. Interconnection Usage Charges
from Other Service Providers, viii. Other Services, ix. Income from Passive Infrastructure.
Analysis of Operating Performance of BSNL
http://www.iaeme.com/JOM/index.asp 484 [email protected]
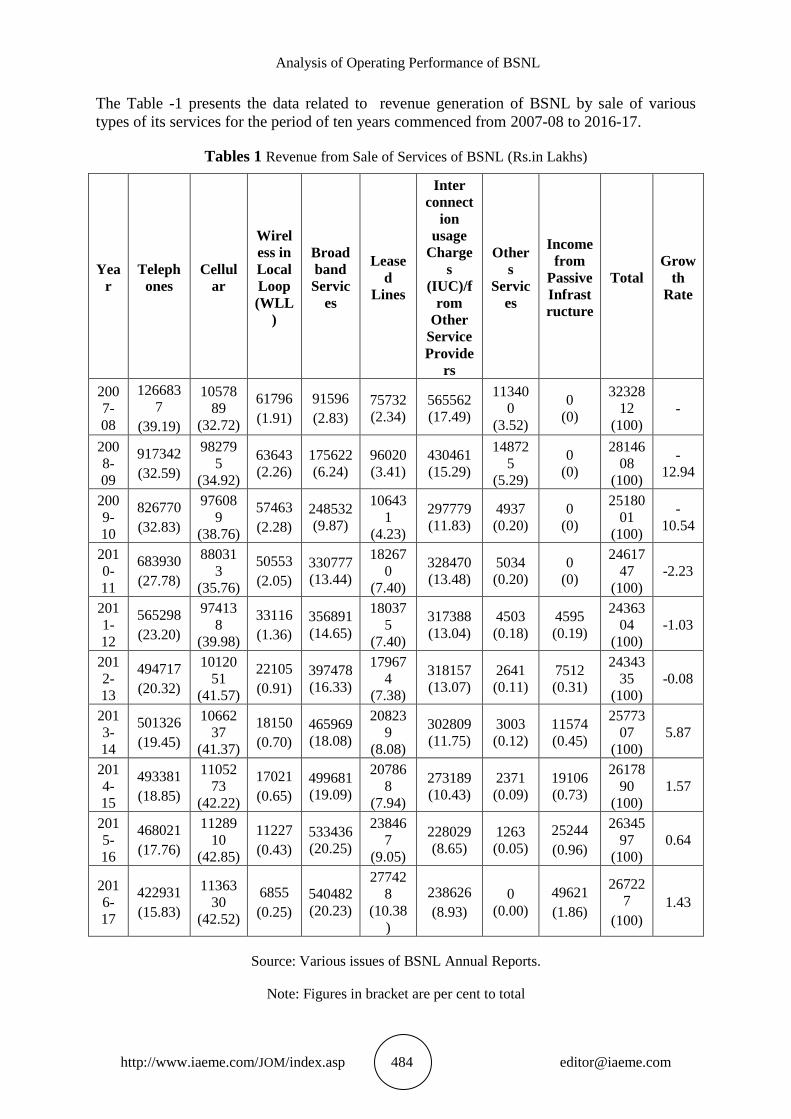
The Table -1 presents the data related to revenue generation of BSNL by sale of various
types of its services for the period of ten years commenced from 2007-08 to 2016-17.
Tables 1 Revenue from Sale of Services of BSNL (Rs.in Lakhs)
Yea
r
Teleph
ones
Cellul
ar
Wirel
ess in
Local
Loop
(WLL
)
Broad
band
Servic
es
Lease
d
Lines
Inter
connect
ion
usage
Charge
s
(IUC)/f
rom
Other
Service
Provide
rs
Other
s
Servic
es
Income
from
Passive
Infrast
ructure
Total
Grow
th
Rate
200
7-
08
126683
7
(39.19)
10578
89
(32.72)
61796
(1.91)
91596
(2.83)
75732
(2.34)
565562
(17.49)
11340
0
(3.52)
0
(0)
32328
12
(100)
-
200
8-
09
917342
(32.59)
98279
5
(34.92)
63643
(2.26)
175622
(6.24)
96020
(3.41)
430461
(15.29)
14872
5
(5.29)
0
(0)
28146
08
(100)
-
12.94
200
9-
10
826770
(32.83)
97608
9
(38.76)
57463
(2.28)
248532
(9.87)
10643
1
(4.23)
297779
(11.83)
4937
(0.20)
0
(0)
25180
01
(100)
-
10.54
201
0-
11
683930
(27.78)
88031
3
(35.76)
50553
(2.05)
330777
(13.44)
18267
0
(7.40)
328470
(13.48)
5034
(0.20)
0
(0)
24617
47
(100)
-2.23
201
1-
12
565298
(23.20)
97413
8
(39.98)
33116
(1.36)
356891
(14.65)
18037
5
(7.40)
317388
(13.04)
4503
(0.18)
4595
(0.19)
24363
04
(100)
-1.03
201
2-
13
494717
(20.32)
10120
51
(41.57)
22105
(0.91)
397478
(16.33)
17967
4
(7.38)
318157
(13.07)
2641
(0.11)
7512
(0.31)
24343
35
(100)
-0.08
201
3-
14
501326
(19.45)
10662
37
(41.37)
18150
(0.70)
465969
(18.08)
20823
9
(8.08)
302809
(11.75)
3003
(0.12)
11574
(0.45)
25773
07
(100)
5.87
201
4-
15
493381
(18.85)
11052
73
(42.22)
17021
(0.65)
499681
(19.09)
20786
8
(7.94)
273189
(10.43)
2371
(0.09)
19106
(0.73)
26178
90
(100)
1.57
201
5-
16
468021
(17.76)
11289
10
(42.85)
11227
(0.43)
533436
(20.25)
23846
7
(9.05)
228029
(8.65)
1263
(0.05)
25244
(0.96)
26345
97
(100)
0.64
201
6-
17
422931
(15.83)
11363
30
(42.52)
6855
(0.25)
540482
(20.23)
27742
8
(10.38
)
238626
(8.93)
0
(0.00)
49621
(1.86)
26722
7
(100)
1.43
Source: Various issues of BSNL Annual Reports.
Note: Figures in bracket are per cent to total

Prof. M. Yadagiri and B. Rajaram
http://www.iaeme.com/JOM/index.asp 485 [email protected]
4.1.1. Findings and Discussion
The analysis of the data of the table – 1 reveals the following findings with regard to the
revenue generated by BSNL by sale of its different types of services;
i. Sale of Telephone Services: It is noticed that the percentage of revenue from sale
of basic telephone services is highest at 39.18 in the year 2007-08. Then after it
was declined to around 33 per cent in the year 2008-09 and 2009-10. From the
year 2010-11 onwards the revenue contribution of basic telephone services was
gradually reduced year after year and reached to 15.83 per cent in the year 2016-
17. Therefore a clear cut declined trend was emerged during the period under
review. Therefore it can be concluded that the number of basic telephone
connections greatly affected by cellular phone connections.
ii. Cellular Services: A revolutionary change was evident by the Cellular phone
services in the telecommunication sector. The cellular services contributing the
major portion of the revenue in the telecommunication sector from date of
introduction of cellular phones. The revenue generated from the sale of cellular
services is Rs.10, 57,889 lakhs with the contribution of 32.72 per cent in the year
2007-08. Then after there was a drastically increased in year to year is evident and
reached to Rs.11, 36,330 lakhs with 42.51 per cent in the year 2016-17. It can be
concluded that there was a clear cut increasing trend emerged during the period
under study.
iii. Wireless in Local Loop (WLL): It is observed that the income from the sale of
WLL Service was Rs.61, 796 lakhs with 1.91 per cent contribution in the year
2007-08. Then after the contribution of WLL revenue was increased to 2.26 per
cent and 2.82 per cent in the year 2008-09 and 2009-10 respectively. From the
year 2009-10, the revenue from the WLL service contribution was continuously
declined from 2.05 per cent to 0.26 per cent in the year 2016-17. It can be
concluded that there was continuous fall in number of WLL connections from the
year 2010-11 onwards due to introduction of GSM.
iv. Broadband Services: The revenue from the broadband services was Rs.91, 596
lakhs in the year 2007-08 with 2.83 per cent contribution and then after there was
almost continuous increase from year to year and reached to Rs.5, 40,482 lakhs
with 20.23 contribution in the year 2016-17. It is found that there was an
increasing trend in revenue generation from the broadband services during the
entire period of study.
v. Leased Lines: It is noticed that the revenue from the Leased lines services was
Rs.75, 732 lakhs in the year 2007-08 with the contribution of 2.34 per cent in the
total revenue. Then after there was continuous increase in revenue from leased
lines service from the 2007-08 to 2010-11. In the year 2011-12 and 2012-13 there
was around 7.4 per cent revenue contribution from leased lines services. The
revenue contribution from the leased lines was registered around 8 per cent in the
years 2013-14 and 2014-15. The company earned Rs.2, 38,467 lakhs in the year
2015-16 and reached to Rs.2, 77,428 lakhs in the year 2016-17 with 10.38 per cent
contribution. It can be concluded that there is an increasing trend in the revenue of
leased lines.
vi. Interconnection Usage Charges (IUC) from Other Service Providers: It is evident
that the highest 17 per cent of revenue is generated with an amount of Rs.5,
65,562 lakhs in the year 2007-08. Then after it is noticed that its contribution of
revenue generation slowly declined year after year and reached to Rs.2, 38,626
lakhs with a percentage of 8.93 in the year 2016-17.
Analysis of Operating Performance of BSNL
http://www.iaeme.com/JOM/index.asp 486 [email protected]
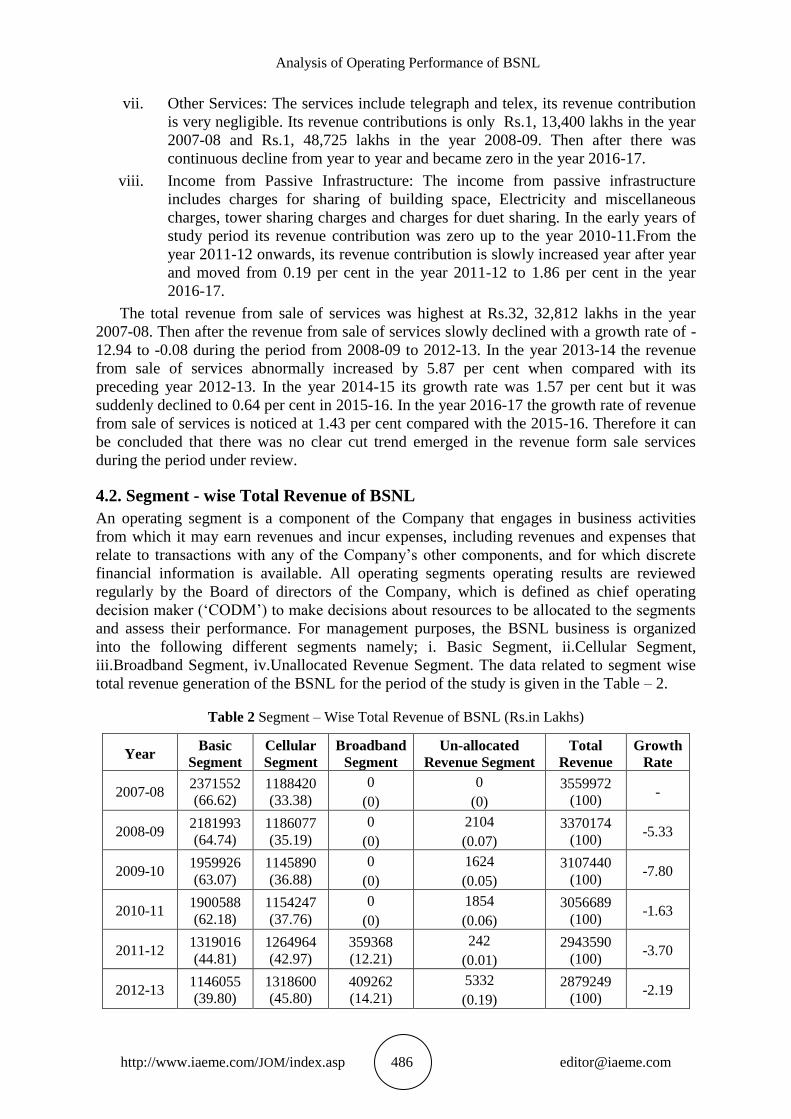
vii. Other Services: The services include telegraph and telex, its revenue contribution
is very negligible. Its revenue contributions is only Rs.1, 13,400 lakhs in the year
2007-08 and Rs.1, 48,725 lakhs in the year 2008-09. Then after there was
continuous decline from year to year and became zero in the year 2016-17.
viii. Income from Passive Infrastructure: The income from passive infrastructure
includes charges for sharing of building space, Electricity and miscellaneous
charges, tower sharing charges and charges for duet sharing. In the early years of
study period its revenue contribution was zero up to the year 2010-11.From the
year 2011-12 onwards, its revenue contribution is slowly increased year after year
and moved from 0.19 per cent in the year 2011-12 to 1.86 per cent in the year
2016-17.
The total revenue from sale of services was highest at Rs.32, 32,812 lakhs in the year
2007-08. Then after the revenue from sale of services slowly declined with a growth rate of -
12.94 to -0.08 during the period from 2008-09 to 2012-13. In the year 2013-14 the revenue
from sale of services abnormally increased by 5.87 per cent when compared with its
preceding year 2012-13. In the year 2014-15 its growth rate was 1.57 per cent but it was
suddenly declined to 0.64 per cent in 2015-16. In the year 2016-17 the growth rate of revenue
from sale of services is noticed at 1.43 per cent compared with the 2015-16. Therefore it can
be concluded that there was no clear cut trend emerged in the revenue form sale services
during the period under review.
4.2. Segment - wise Total Revenue of BSNL
An operating segment is a component of the Company that engages in business activities
from which it may earn revenues and incur expenses, including revenues and expenses that
relate to transactions with any of the Company‘s other components, and for which discrete
financial information is available. All operating segments operating results are reviewed
regularly by the Board of directors of the Company, which is defined as chief operating
decision maker (‗CODM‘) to make decisions about resources to be allocated to the segments
and assess their performance. For management purposes, the BSNL business is organized
into the following different segments namely; i. Basic Segment, ii.Cellular Segment,
iii.Broadband Segment, iv.Unallocated Revenue Segment. The data related to segment wise
total revenue generation of the BSNL for the period of the study is given in the Table – 2.
Table 2 Segment – Wise Total Revenue of BSNL (Rs.in Lakhs)
Year Basic
Segment
Cellular
Segment
Broadband
Segment
Un-allocated
Revenue Segment
Total
Revenue
Growth
Rate
2007-08 2371552
(66.62)
1188420
(33.38)
0
(0)
0
(0)
3559972
(100) -
2008-09 2181993
(64.74)
1186077
(35.19)
0
(0)
2104
(0.07)
3370174
(100) -5.33
2009-10 1959926
(63.07)
1145890
(36.88)
0
(0)
1624
(0.05)
3107440
(100) -7.80
2010-11 1900588
(62.18)
1154247
(37.76)
0
(0)
1854
(0.06)
3056689
(100) -1.63
2011-12 1319016
(44.81)
1264964
(42.97)
359368
(12.21)
242
(0.01)
2943590
(100) -3.70
2012-13 1146055
(39.80)
1318600
(45.80)
409262
(14.21)
5332
(0.19)
2879249
(100) -2.19

Prof. M. Yadagiri and B. Rajaram
http://www.iaeme.com/JOM/index.asp 487 [email protected]
2013-14 1086682
(37.03)
1369290
(46.65)
474612
(16.17)
4391
(0.15)
2934975
(100) 1.94
2014-15 1070235
(36.01)
1389506
(46.75)
503567
(16.94)
9142
(0.30)
2972450
(100) 1.28
2015-16 1160736
(37.13)
1422404
(45.50)
542179
(17.34)
1109
(0.03)
3126428
(100) 5.18
2016-17 1045811
(33.17)
1398951
(44.36)
540482
(17.14)
168100
(5.33)
3153344
(100) 0.86
Source: Various issues of BSNL Annual Reports.
Note: Figures in bracket are per cent to total
4.2.1. Findings and Discussion
i. Basic Segment Revenue: The basic segment of telephony has been strategically
important for the PSU, as around 70 per cent of its revenue was generated from it over
the years. However, subscriber‘s base and revenue generation from basic telephony
had declined from Rs.23, 71,552 lakhs in 2007-08 to 10, 45,811 in 2016-17. Further
the basic telephony segment had been incurring losses from 2008-09 onwards, which
impacted the financial health of the company and during 2009-10, it had run into the
red. It is observed that the basic segment revenue declined from 66.62 per cent to
33.17 per cent during the study period. To improve its revenue generation capacity the
company had invested Rs.89, 11,800 lakhs to build up equipped capacity of 546.32
lakh lines against the working connections of 339.75 lakh lines for its basic telephony
network. Though the basic service customer base of BSNL started declining from
2005-06 onwards, but only in 2008 BSNL appointed IMRB for determining the
reasons for surrendering of landlines. However, the CAG recommended that BSNL
should have a time bound programme and fix milestones for increasing its landline
subscribers through aggressive marketing strategy, competitive tariffs plans and
improving its quality of service. BSNL should revamp its tariffs plans to revive the
demand for landline telephony and improve the capacity utilisation of telephone
exchanges. Broadband should be marketed effectively to attract new customers and
increase customer base of landline telephony. Tariffs structure for PCO market must
be redesigned to ensure retention and enhancement of PCO base. Subscriber base and
revenue from basic telephone service of BSNL declined drastically over the last five
years as also its overall revenue. Lack of dynamic tariff structuring, slack marketing
efforts especially in the face of competition from private operators, lack of quality in
service were major contributing factors for erosion of customer base and revenue of
BSNL. Erosion in subscriber resulted in accumulation of spare exchange capacity and
consequent unexploited capital investment.
ii. Cellular Segment Revenue: After basic segment, the Cellular segment is placed in
second position to generate the more revenue to the BSNL. The first Cellular phone
was introduced in India in the year 1995. The 4G services were launched in the year
2012. Now the cellular segment is with a subscriber base of more than 1,151.94
million as of January 2018, the mobile telecommunications system in India is the
second largest in the world and it was thrown open to private players. The GSM was
comfortably maintaining its position as the dominant mobile technology with 80 per
cent of the mobile subscriber market, but CDMA seemed to have stabilized its market
share at 20 per cent for the time being. Revenue generation point of view, the cellular
segment improving its performance year after year. In the year 2007-08 the cellular

Analysis of Operating Performance of BSNL
http://www.iaeme.com/JOM/index.asp 488 [email protected]
segment contributed 33.38 per cent of the total revenue. This upward trend continued
up to 2016-17 with 44.36 per cent. Based on this trend, it can be said that the cellular
segment revenue will be overcome the revenue of the basic segment of BSNL total
revenue.
iii. Broadband segment Revenue: The Internet in India began with the launch of the
Educational Research Network (ERNET) in 1986. The first publicly available internet
service in India was launched by state-owned Videsh Sanchar Nigam Limited
(VSNL) on 14 August 1995. The network was only made available to educational and
research communities. ERNET was initiated by the Department of Electronics (DoE),
with funding support from the Government of India and United Nations Development
Program (UNDP), involving eight premier institutions as participating agencies—
NCST Bombay, Indian Institute of Science, five Indian Institutes of Technology at
Delhi, Mumbai, Kanpur, Kharagpur and Chennai, and the DoE in New Delhi. ERNET
began as a multi-protocol network with both the TCP/IP and the OSI-IP protocol
stacks running over the leased-line portion of the backbone. In the initial period up to
2010-11 the revenue from broadband was included in the basic segment. From 2011-
12 onwards revenue generated from broadband has been shown as a separate segment.
It is noticed that the total revenue generated from broadband segment in the year
2011-12 is Rs.3, 59,368 lakhs and it has been increased year after year and reached to
Rs.5,40,482 lakhs in the year 2016-17. Thus the revenue from broadband segment
was moved from 12.21 per cent to 17.14 per cent from 2011-12 to 2016-17. As per
the internet usage data from the BSNL, it can be forecasted that the significance of
this segment will be increased in the near future.
iv. Un-Allocated Segment Revenue: The different types of miscellaneous revenues which
were not included in any of the above three segments are shown separately under un-
allocated segment. This segment contributes insignificant amount in the total revenue
of BSNL. The data reveals that only Rs.2, 104 lakhs of revenue generated from this
segment in the year 2008-09. It was drastically declined to Rs.242 lakhs in the year
2011-12. However there was an abnormal increased of Rs.5,332 lakhs in the year
2012-13, Rs.9,142 lakhs in the year 2014-15 and Rs.1,68,100 lakhs in the year 2016-
17.The total revenue of the BSNL declined by 5.33 per cent in the year 2008-09 and
7.80 per cent in the year 2009-10 when compared with its preceding years. The
declined growth rates were registered at 1.63 per cent, 3.70 per cent, and 2.19 per cent
in the year 2010-11, 2011-12 and 2012-13 respectively. The positive growth rates
were identified at 1.94 per cent, 1.28 per cent and 5.18 per cent in the years 2013-14,
2014-15 and 2015-16 respectively. Whereas only 0.86 growth was identified in the
year 2016-17 compared with 2015-16. Therefore it can be concluded that the revenue
generation capacity of BSNL has been in increasing trend year after year from 2013-
14 onwards.
4.3. Component wise Operating Expenses of BSNL
The cost of earning revenue is called operating expenses. The total expenses of BSNL
includes Employee benefits expenses ,License and spectrum fee, Administrative, Operating
and Other expenses , finance costs, and non-cash expenditure i.e., depreciation and
amortisation expenses. These expenses are directly or indirectly attributable to the revenue
earnings of the BSNL. The data related to component –wise operating expenses of BSNL for
the period 2007-08 to 2016-17 is presented in the Table – 3.
Prof. M. Yadagiri and B. Rajaram
http://www.iaeme.com/JOM/index.asp 489 [email protected]
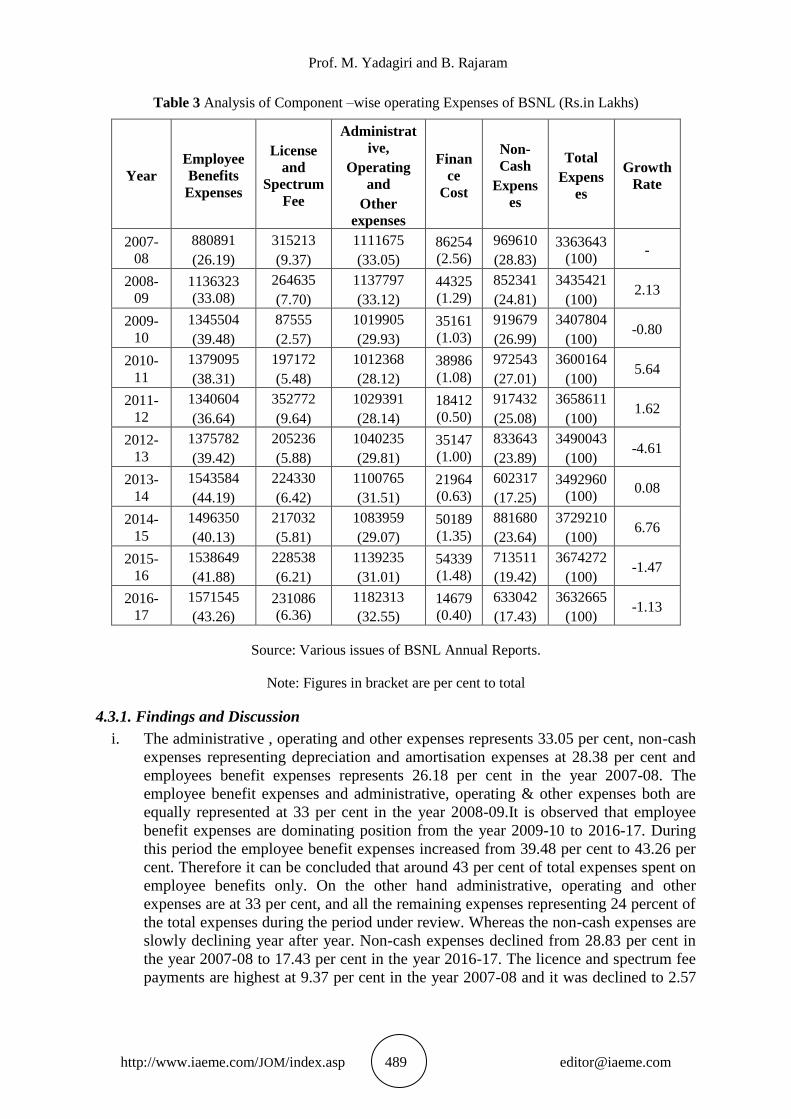
Table 3 Analysis of Component –wise operating Expenses of BSNL (Rs.in Lakhs)
Year
Employee
Benefits
Expenses
License
and
Spectrum
Fee
Administrat
ive,
Operating
and
Other
expenses
Finan
ce
Cost
Non-
Cash
Expens
es
Total
Expens
es
Growth
Rate
2007-
08
880891
(26.19)
315213
(9.37)
1111675
(33.05)
86254
(2.56)
969610
(28.83)
3363643
(100) -
2008-
09
1136323
(33.08)
264635
(7.70)
1137797
(33.12)
44325
(1.29)
852341
(24.81)
3435421
(100) 2.13
2009-
10
1345504
(39.48)
87555
(2.57)
1019905
(29.93)
35161
(1.03)
919679
(26.99)
3407804
(100) -0.80
2010-
11
1379095
(38.31)
197172
(5.48)
1012368
(28.12)
38986
(1.08)
972543
(27.01)
3600164
(100) 5.64
2011-
12
1340604
(36.64)
352772
(9.64)
1029391
(28.14)
18412
(0.50)
917432
(25.08)
3658611
(100) 1.62
2012-
13
1375782
(39.42)
205236
(5.88)
1040235
(29.81)
35147
(1.00)
833643
(23.89)
3490043
(100) -4.61
2013-
14
1543584
(44.19)
224330
(6.42)
1100765
(31.51)
21964
(0.63)
602317
(17.25)
3492960
(100) 0.08
2014-
15
1496350
(40.13)
217032
(5.81)
1083959
(29.07)
50189
(1.35)
881680
(23.64)
3729210
(100) 6.76
2015-
16
1538649
(41.88)
228538
(6.21)
1139235
(31.01)
54339
(1.48)
713511
(19.42)
3674272
(100) -1.47
2016-
17
1571545
(43.26)
231086
(6.36)
1182313
(32.55)
14679
(0.40)
633042
(17.43)
3632665
(100) -1.13
Source: Various issues of BSNL Annual Reports.
Note: Figures in bracket are per cent to total
4.3.1. Findings and Discussion
i. The administrative , operating and other expenses represents 33.05 per cent, non-cash
expenses representing depreciation and amortisation expenses at 28.38 per cent and
employees benefit expenses represents 26.18 per cent in the year 2007-08. The
employee benefit expenses and administrative, operating & other expenses both are
equally represented at 33 per cent in the year 2008-09.It is observed that employee
benefit expenses are dominating position from the year 2009-10 to 2016-17. During
this period the employee benefit expenses increased from 39.48 per cent to 43.26 per
cent. Therefore it can be concluded that around 43 per cent of total expenses spent on
employee benefits only. On the other hand administrative, operating and other
expenses are at 33 per cent, and all the remaining expenses representing 24 percent of
the total expenses during the period under review. Whereas the non-cash expenses are
slowly declining year after year. Non-cash expenses declined from 28.83 per cent in
the year 2007-08 to 17.43 per cent in the year 2016-17. The licence and spectrum fee
payments are highest at 9.37 per cent in the year 2007-08 and it was declined to 2.57
Analysis of Operating Performance of BSNL
http://www.iaeme.com/JOM/index.asp 490 [email protected]
per cent in the year 2009-10. Again in the year 2011-12 it represents 9.64 per cent and
gradually declined year after year and reached to 6.36 per cent in the year 2016-17.
ii. In case of finance cost includes interest expenses on financial liabilities at amortised
cost such as subscribers deposits, loan, unwinding of discount on decommissioning
liabilities and others represents 2.56 per cent in the year 2007-08. This cost was
declined from year to year and reached at only 0.4 per cent in the year 2016-17. It is
noticed that employee benefit expenses represents the highest percentage of total
expenses followed by administrative, operating & other expenses, non-cash expenses,
licence and spectrum fee and finance cost in the entire period of study.
iii. The growth rate of total expenses is identified at 2.13 per cent in the year 2008-09
when compared with its preceding year 2007-08. The growth rate was declined by
0.80 per cent in the year 2009-10.Whearas the growth of total expenses registered at
5.64 per cent in the year 2010-11. Then after the negative growth rate -4.61 per cent
was identified again in the year 2012-13. In the year 2013-14 total expenses are
almost similar to total expenses of 2012-13. Again in the year 2014-15 the growth rate
of total expenses are highest at 6.76 per cent. By introducing various controlling
measures internally the growth rate of total expenses declined to -1.47 per cent and -
1.13 per cent in the year 2015-16 and 2016-17 respectively. Based on fluctuations of
total expenses year to year it can be concluded that there is no clear cut trend was
emerged in the growth rate of total expenses of BSNL.
4.4. Analysis of EBITDA, Tax expenses and Profit After Tax of BSNL
The operating performance of the BSNL is measured accurately in general by analysing its
Earnings before Interest, Tax expenses, Depreciation and Amortization. Thus it is aimed to
analyse the following aspects
i. Earnings before Interest, Tax, Depreciation and Amortization (EBITDA): It is a
measure of a company‘s operating performance. Essentially, it‘s a way to evaluate
a company‘s performance without having to factor in financing decisions,
accounting decisions or tax environments. EBIDTA allows analysts to focus on
the outcome of operating decisions while the impacts of non-operating decisions
like interest expenses a financing decision, tax rates a governmental decision, or
large non-cash items like depreciation and amortization an accounting decision.
By minimising the non-operating effects that are unique to each company,
EBITDA allows investors to focus on operating profitability as a singular measure
of performance. Such analysis is particularly important when comparing similar
companies across a single industry, or companies operating in different tax
brackets. EBITDA is calculated by adding back the non-cash expenses of
depreciation and amortization to a firm‘s operating income.
ii. Profit Before Tax: The Net profit margin is indicative of management‘s ability to
operate the business with sufficient success not only to recover from revenues of
the period, the cost of services, the expenses of operating the business including
the depreciation and the cost of the borrowed funds, but also to leave a margin of
reasonable compensation to the owners for providing their capital at risk.
iii. Tax Expenses: A tax expense is a liability owed to federal, state/provincial and
municipal governments within a given period. Tax expenses are calculated by
multiplying the appropriate tax rate of an individual or business by the income
received or generated before taxes, after factoring in such variables as non-
deductible items, tax assets, and tax liabilities. Tax expense affects a company‘s
net earnings given that it is a liability that must be paid to a federal or state
Prof. M. Yadagiri and B. Rajaram
http://www.iaeme.com/JOM/index.asp 491 [email protected]
government. The expense reduces the amount of profits to be distributed to
shareholders in the form of dividends. This is even more disadvantageous to
shareholders of corporations who must pay taxes again on the dividend received.
However, a tax expense is only recognized when a company has taxable income.
In the event that a loss is recognized, the business can carry its losses forward to
future years to offset or reduce future tax expenses.
iv. Profit After Tax: Profit after-tax is the earnings of a business after all income
taxes have been deducted. This amount is the final, residual amount of profit
generated by an organization. The profit after-tax figure is considered the best
measure of the ability of an entity to generate a return, since it incorporates both
operating income and income from other sources, such as interest income. The
profit after-tax margin is closely watched by investors to see if the income-
generating ability of a firm is changing over time. If so, this could be considered a
valuation indicator that may result in a change in the stock price. If a company is
publicly-held, it also reports profit after-tax on a per share basis. This information
appears on the face of the income statement. The Earnings after income taxes and
other statuary taxes are earnings available to pay to the equity shareholders.
v. Deferred Tax: A deferred tax liability occurs when taxable income is smaller than
the income reported on the income statements. This is a result of the accounting
difference of certain income and expenses accounts. This is only a temporary
difference. The most common reason behind deferred tax liability is the use of
different depreciation methods for financial reporting and the IRS. A deferred tax
asset is the opposite of deferred tax liability. Deferred tax assets are reductions in
future taxes payable, because the company has already paid the taxes on book
income to be recognized in the future like a prepaid tax.
In case of BSNL, the deferred tax has been dealt with in accordance with the contention
of the Company before the tax authorities. The depreciation has been calculated on the book
value of assets taken over from DoT, contrary to the Income Tax Department‘s contention of
treating capital reserve as relief/ grant/ subsidy deductible from book value of assets. The
Company contends that the capital reserve arising out of the capital structure at the time of
incorporation of the company is not in the nature of financial relief and hence not to be
reduced from the value of fixed assets. According to the company‘s contention, the
depreciation provided in the books on the value of assets without deducting the amount
involved in capital reserve is admissible in income-tax. The stand of company was upheld by
the Hon‘ble High Court of Delhi and the Income Tax Department has not contested against
this in the higher court as at the balance sheet date. The company recognising deferred tax
assets/liabilities accordingly.
The BSNL, being a company providing telecommunication services is eligible to claim
deduction under Section 80 IA of the Income Tax Act, 1961 with respect to 100 per cent of
the profits and gains derived from this business for the first five years and thereafter at 30 per
cent of the profits for the second five years (referred to as the Tax Holiday Period). The
company has opted for tax holiday period from financial year 2003-04 and the period ends in
the previous financial year 2012-13
In accordance with Accounting Standard Interpretation (ASI)-3 issued by the Institute of
Chartered Accountants of India, the deferred tax provision in respect of timing differences
which originates and gets reversed during the tax holiday period have not been recognised.
Deferred tax in respect of timing differences which originate during the tax holiday period
but gets reversed after the tax holiday period, have been recognized in the year in which the
timing differences have originated. For this purpose, as a conservative measure, deferred tax
Analysis of Operating Performance of BSNL
http://www.iaeme.com/JOM/index.asp 492 [email protected]
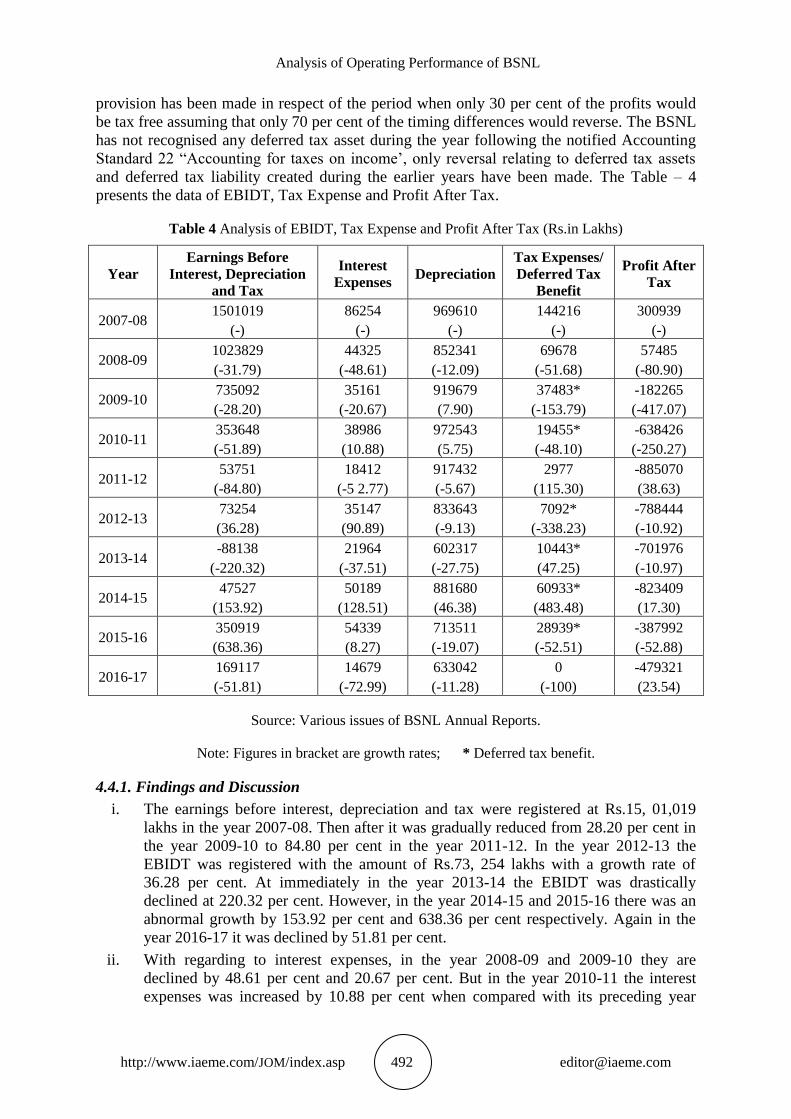
provision has been made in respect of the period when only 30 per cent of the profits would
be tax free assuming that only 70 per cent of the timing differences would reverse. The BSNL
has not recognised any deferred tax asset during the year following the notified Accounting
Standard 22 ―Accounting for taxes on income‘, only reversal relating to deferred tax assets
and deferred tax liability created during the earlier years have been made. The Table – 4
presents the data of EBIDT, Tax Expense and Profit After Tax.
Table 4 Analysis of EBIDT, Tax Expense and Profit After Tax (Rs.in Lakhs)
Year
Earnings Before
Interest, Depreciation
and Tax
Interest
Expenses Depreciation
Tax Expenses/
Deferred Tax
Benefit
Profit After
Tax
2007-08 1501019
(-)
86254
(-)
969610
(-)
144216
(-)
300939
(-)
2008-09 1023829
(-31.79)
44325
(-48.61)
852341
(-12.09)
69678
(-51.68)
57485
(-80.90)
2009-10 735092
(-28.20)
35161
(-20.67)
919679
(7.90)
37483*
(-153.79)
-182265
(-417.07)
2010-11 353648
(-51.89)
38986
(10.88)
972543
(5.75)
19455*
(-48.10)
-638426
(-250.27)
2011-12 53751
(-84.80)
18412
(-5 2.77)
917432
(-5.67)
2977
(115.30)
-885070
(38.63)
2012-13 73254
(36.28)
35147
(90.89)
833643
(-9.13)
7092*
(-338.23)
-788444
(-10.92)
2013-14 -88138
(-220.32)
21964
(-37.51)
602317
(-27.75)
10443*
(47.25)
-701976
(-10.97)
2014-15 47527
(153.92)
50189
(128.51)
881680
(46.38)
60933*
(483.48)
-823409
(17.30)
2015-16 350919
(638.36)
54339
(8.27)
713511
(-19.07)
28939*
(-52.51)
-387992
(-52.88)
2016-17 169117
(-51.81)
14679
(-72.99)
633042
(-11.28)
0
(-100)
-479321
(23.54)
Source: Various issues of BSNL Annual Reports.
Note: Figures in bracket are growth rates; * Deferred tax benefit.
4.4.1. Findings and Discussion
i. The earnings before interest, depreciation and tax were registered at Rs.15, 01,019
lakhs in the year 2007-08. Then after it was gradually reduced from 28.20 per cent in
the year 2009-10 to 84.80 per cent in the year 2011-12. In the year 2012-13 the
EBIDT was registered with the amount of Rs.73, 254 lakhs with a growth rate of
36.28 per cent. At immediately in the year 2013-14 the EBIDT was drastically
declined at 220.32 per cent. However, in the year 2014-15 and 2015-16 there was an
abnormal growth by 153.92 per cent and 638.36 per cent respectively. Again in the
year 2016-17 it was declined by 51.81 per cent.
ii. With regarding to interest expenses, in the year 2008-09 and 2009-10 they are
declined by 48.61 per cent and 20.67 per cent. But in the year 2010-11 the interest
expenses was increased by 10.88 per cent when compared with its preceding year
Prof. M. Yadagiri and B. Rajaram
http://www.iaeme.com/JOM/index.asp 493 [email protected]
2009-10. Then after in the year 2011-12, it was declined by 52.77 per cent, that in the
year 2012-13 it was abnormally increased by 90.89 per cent. In the year 2014-15 and
2015-16 the interest expenses were increased by 128.51 per cent and 8.27 per cent
respectively. But in the year 2016-17 the interest expenses declined by 72.99 per cent.
Though there was no clear cut trend in the interest expenses, we can say that the
company has taken necessary measures to minimise the interest expenses during the
period of the study.
iii. The total depreciation charged by the BSNL in the year 2007-08 was Rs.9, 69,610
lakhs. But it was declined by 12.09 per cent in the year 2008-09. Then there was a
slight increase in the year 2009-10 and 2010-11 by 7.90 per cent and 7.57 per cent
respectively. Then after there was a continuous decline up to the year 2013-14.
Whereas in the year 2014-15 the depreciation charged by the company was increased
by 46.38 per cent. Again there was a slight decline continuously in the year 2015-16
and 2016-17.
iv. The company has paid tax expenses only in the year 2007-08, 2008-09 and 2011-12
with an amount of Rs.1, 44,216 lakhs, Rs.69, 678 lakhs and Rs.2,977 lakhs. In the left
over years the BSNL has received the deferred tax benefit because of deferred tax
assets are recognised and carry forward to the extent there is a virtual certainty that
such deferred tax assets can be realised.
v. As EBIDT declined year after year the profit after tax also declined year after year.
The company has registered profit after tax only in the first two years i.e., 2007-08
and 2008-09 with an amount of Rs.3, 00,939 lakhs and Rs.57, 485 lakhs, except these
two years in every year the profit after tax is negative.
5. CONCLUSIONS
The following are the broad conclusions drawn from the study:
i. It can be concluded that the revenue from sale of telephone services declining year
after year and the number of basic telephone connections greatly affected by
cellular phone connections .There was a clear cut increasing trend emerged in
cellular services revenue during the period under study. A continuous fall in
number of WLL connections noticed from the year 2010-11 onwards due to
introduction of GSM. An increasing trend is observed in revenue generation from
the broadband services during the entire period of study. With regard to the
revenue of leased lines there is an increasing trend. It can be concluded that there
was no clear cut trend emerged in the revenue form sale services during the period
under review.
ii. It is also observed that the basic segment revenue declined from 66.62 per cent to
33.17 per cent during the study period. The cellular segment revenue will be
overcome the revenue of the basic segment of BSNL total revenue. The revenue
from broadband segment was moved from 12.21 per cent to 17.14 per cent from
2011-12 to 2016-17. As per the internet usage data from the BSNL, it can be
forecasted that the significance of this segment will be increased in the near
future. It can be concluded that the revenue generation capacity of BSNL has been
in increasing trend year after year from 2013-14 onwards.
iii. It is noticed that employee benefit expenses represents the highest percentage of
total expenses followed by administrative, operating & other expenses, non-cash
expenses, licence and spectrum fee and finance cost in the entire period of study.
Based on fluctuations of total expenses year to year it can be concluded that there
is no clear cut trend was emerged in the growth rate of total expenses of BSNL.
Analysis of Operating Performance of BSNL
http://www.iaeme.com/JOM/index.asp 494 [email protected]
iv. The BSNL has paid tax expenses only in the year 2007-08, 2008-09 and 2011-12
and in the left over years it has received the deferred tax benefit because of
deferred tax assets are recognised and carry forward to the extent there is a virtual
certainty that such deferred tax assets can be realised.
SCOPE FOR FURTHER RESEARCH
This paper is limited to the analysis of operating performance with the help of absolute
figures of sources of income and operating expenses of BSNL for the period from 2007-08 to
2016-17. One can analyse the operating performance of firm by using other different types of
statistical tools and comparison may be made between BSNL and other telecom service
providers. The comparison can also be made with industry also.
REFERENCES
[1] Paul J (2011), International business, PHI Learning Private Limited, New Delhi.
[2] Varadharajan, Sridhar (2011), The Telecom Revolution in India: Technology, Regulation
and Policy, Publisher; Oxford University Press.
[3] Dr. Kanchan Bhatia and Prof Prashanth Jain (2012) ―A study of Performance appraisal
and organizational effectiveness in terms of individual and organizational basis. A
comparative study of BSNL and AIRTEL‖ International Journal on Arts, Management
and Humanities 1(1): pp.63-72.
[4] R.C.Upadhyaya and Vashundhara Sharma (December-2012) ―A Comparative Study of
Telecommunication Service providers BSNL and AIRTEL Operating in Gwalior Division
India ―International Journal of Business Management & Research (IJBMR), Vol. 2 Issue
4, pp. 13-20.
[5] Dr.M.Dhanabhakyam and Swapna Kurian (March-2012) ―Profitability Analysis of
Bharath Sanchar Nigam Limited (Bsnl)‖ Indian Journal of Applied Research,
Ahmedabad,Volume:1,Issue:6 ISSN-2249-555X
[6] N. Swapna (7-8th April-2012) MPGI National Multi Conference 2012 ―Advancement in
Electronics & Telecommunication Engineering‖ International Journal of Computer
Applications® (IJCA) ISSN: 0975 – 8887.
[7] Chhaya P.Patel and Smt.K.K.Patel (April-2014) ―Study on Performance Appraisal
System in BSNL‖ VSRD International Journal of Business and Management Research,
Vol. IV, Issue IV.
[8] Dr.Papori Baruah and Rashmi Baruah (November-2014) ―Telecom Sector in India: Past,
Present and Future‖ International Journal of Humanities & Social Science Studies
(IJHSSS) ISSN: 2349-6959, Volume-I, Issue-III, Page No. 147-156, Scholar Publications,
Karimganj, Assam, India.
[9] Ms.Pritish and Dr.Taruna Saxena (Oct-2015) ―An Analysis of the Indian Telecom
Industry‖ IOSR Journal of Business and Management (IOSR-JBM), Volume 17, Issue
10.Ver.II, PP 35-42.
[10] Anush Gupta(April-2015) ―Financial Performance Evaluation of Telecommunication
with special reference to BSNL‖ SSRG-International Journal of Humanities and Social
Science, ISSN:2394-2703.
[11] RNCOS, Mobile Industry Research( Tuesday, 22nd January-2008) ‖Rural India New
Playground for Mobile Industry Players‖
[12] Corporate Catalyst India(August-2013) ―A brief Report on Telecom Sector in India‖
[13] Telecom Regulatory Authority of India‘s Study Paper on Shareholding Pattern, Financing
Pattern and Capital Structure of Indian Private Telecom Access Service Providers 8th
September, 2016.

Prof. M. Yadagiri and B. Rajaram
http://www.iaeme.com/JOM/index.asp 495 [email protected]
[14] Telecom Regulatory Authority of India ―A Twenty year of Odyssey 1997-2017‖ Report
prepared by National Institute of Public Finance and Policy, New Delhi-110067.
[15] Economic Survey 2016-17 Vol2, Chapter -08 – Industry and Infrastructure, Telecom
sector, P. No.207-209.
[16] IBEF, Telecommunications-December-2017.www.ibef.org
[17] Department of Telecommunications, Achievements of telecom sector in financial year
2016-17.
[18] Department of Telecommunications, Progress during the last three years (2014-17).
[19] Nishith Desai Associates, The Indian Telecom Sector – Legal and Regulatory
Framework, July 2014.
[20] TRAI Annual Reports 2007-08 to 2016-17.
[21] Deloitte & Aegis, Broadband The lifeline of Digital India, November 2014.
[22] DoT, Annual Reports 2007-08 to 2016-17.
[23] BSNL, Annual Reports 2007-08 to 2016-17.
WEBSITES
[24] www.bsnl.co.in
[25] www.dot.gov.in
[26] www.trai.gov.in
[27] www.deloitte.com/in
[28] www.icra.in
[29] www.pwc.in
[30] www.ijar.in