analysis of performance evaluation for...
TRANSCRIPT

ANALYSIS OF PERFORMANCE EVALUATIONFOR BUS BASED PUBLIC TRANSPORT WITH
REFERENCE TO SERVICE LEVEL BENCHMARKS
By:Rahul TiwariPhD. Scholar, School of Planning and Architecture, Bhopal&Senior Transport OfficerDirectorate, Urban Administration and DevelopmentBhopal
Under Guidance and Co-Authors:
Dr. Kshama Puntambekar,Asst. Professor & Coordinator, Master of Urban & Regional Planning Programme, Department of Planning, SPA Bhopal &Dr. Purnima Parida,Head (Transportation Planning), Central Road Research Institute (CRRI), New Delhi

Objective
• To evaluate the Level of Service being offeredby BRTS, City Bus and Mini Bus Services inBhopal, based on the User Opinion Survey
• Compare the scores achieved with respect toUser Perception and the LOS achieved onService Level Benchmarks (SLBs)

Methodology
Literature Review
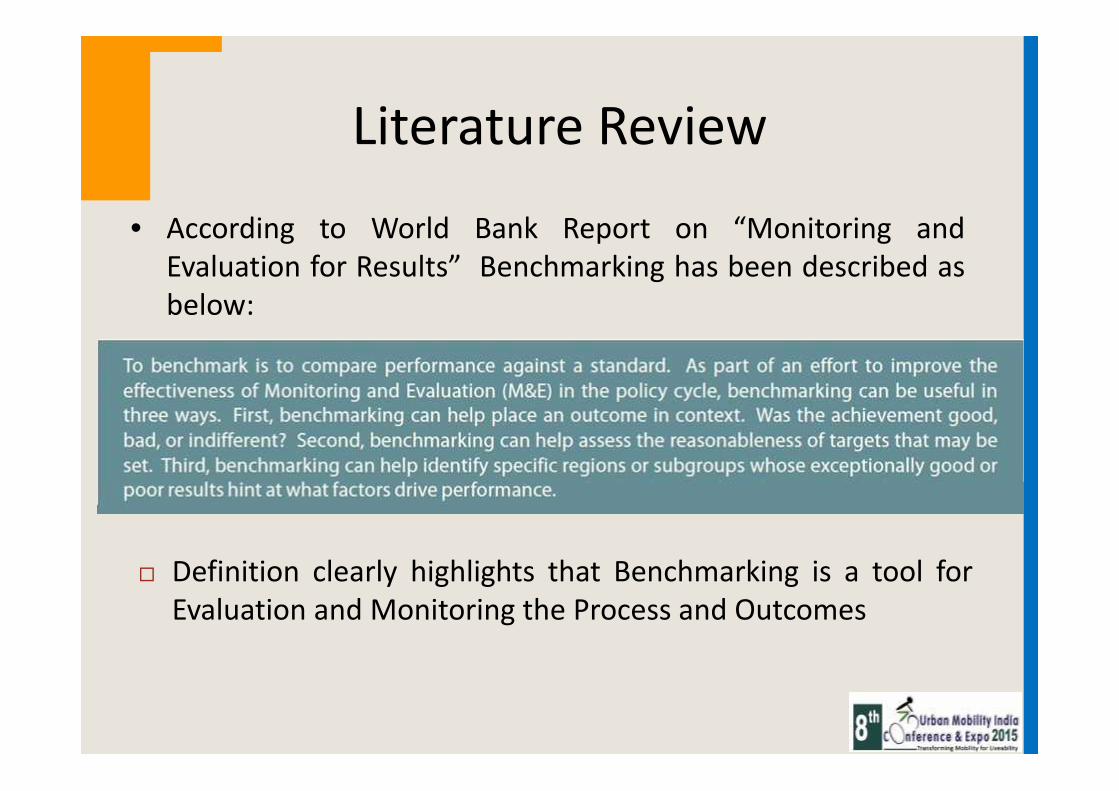
• According to World Bank Report on “Monitoring andEvaluation for Results” Benchmarking has been described asbelow:
Definition clearly highlights that Benchmarking is a tool forEvaluation and Monitoring the Process and Outcomes

Literature Review
• National Coordinating Centre for Public Engagements, Bristol -Briefing Report, Series 1 titled “Summary: Auditing,Benchmarking and Evaluating Public Engagement” states thatfor effective evaluation, the flow of enquiry is as below:
Audit Benchmarking Evaluation

Literature Review
• The Report also marked difference betweenAudit, Benchmarking and Evaluation, whichare as below:
Bhopal• Bhopal, capital city of Madhya Pradesh, used to
move on Tempos and Mini Buses.• With JnNURM, Bhopal started operation of Bus
based Public Transport Service under banner ofBCLL
• BRTS System operational in Bhopal since October2013.
• The interesting fact, till date almost 200 MiniBuses, which offer inferior quality service tocommuters, are operating on the road,profitably, major question – Why ?

Indian Benchmarking Practice

Evaluating PT in Bhopal on SLBs
• Data collected from Bus Operators / BCLL• Data Collected on:
– Bus Available– Staff– Operating expenditure– Station Boarding/Alighting– Route wise Ridership

Evaluating PT in Bhopal on SLBsParameter Calculation Value LOS
Presence of Organized Public Transport System in UrbanArea (%)
220/520 42 % 2
Extent of Supply Availability of Public Transport 220/2000 .11 4
Service Coverage of Public Transport in City 232/697 .33 3
Average Waiting Time for Public Transport User (mins) 20 -- 2
Level of Comfort in Public Transport .72 -- 1
%age of Fleet as per Urban Bus Specification 220/520 42 % 3
LOS AchievedOverall LOS
152

User Perception Survey

Methodology
Score Calculation:
Users were asked to rate the service parameter in the range of
1 to 10 marks (1 being lowest and 10 highest)
Cumulative Score for each System was calculated and wasconverted into percentage taking the number of responses inconsideration

Study Details
Service Type Commuter Interview (in nos.)
Bus Rapid Transit (BRT) 38
City Bus 34
Mini Bus 36
The interviews were conducted at following Bus Stops• Board Office Square• Habibganj Railway Station

Glimpse of the Survey

Survey Findings• It was observed that female passengers preferred BRTS over
Mini Bus service.• Age Distribution in the BRTS is Normative whereas Mini Bus
users are in the age group of 20-50 years, and is leastpreferred by the Young and Elderly.
0
10
20
30
40
50
60
70
80
90
BRTS City Bus Mini Bus
Perc
enta
ge
Gender Profile
Male
Female
0
10
20
30
40
50
60
70
BRTS City Bus Mini Bus
Perc
enta
ge
Commuters Age Profile
< 20
20-35
36-50
> 50

Survey Findings• More than 70% of BRTS users are holding Graduate or above
Degree whereas more than 75% of the Mini Bus users are underGraduate.
• More than 60% users of Mini Bus service have monthly incomeless than 10000
0
10
20
30
40
50
60
BRTS City Bus Mini Bus
Perc
enta
ge
Commuter Qualification
< 10
10th to 12th
Graduate
PG and above
0
5
10
15
20
25
30
35
40
45
50
BRTS City Bus Mini Bus
Perc
enta
ge
Commuter Income
< 5000
5000-10000
10000-20000
20000-50000
> 50000
Survey Findings
Marks scored by various Bus based PT System
Survey Findings
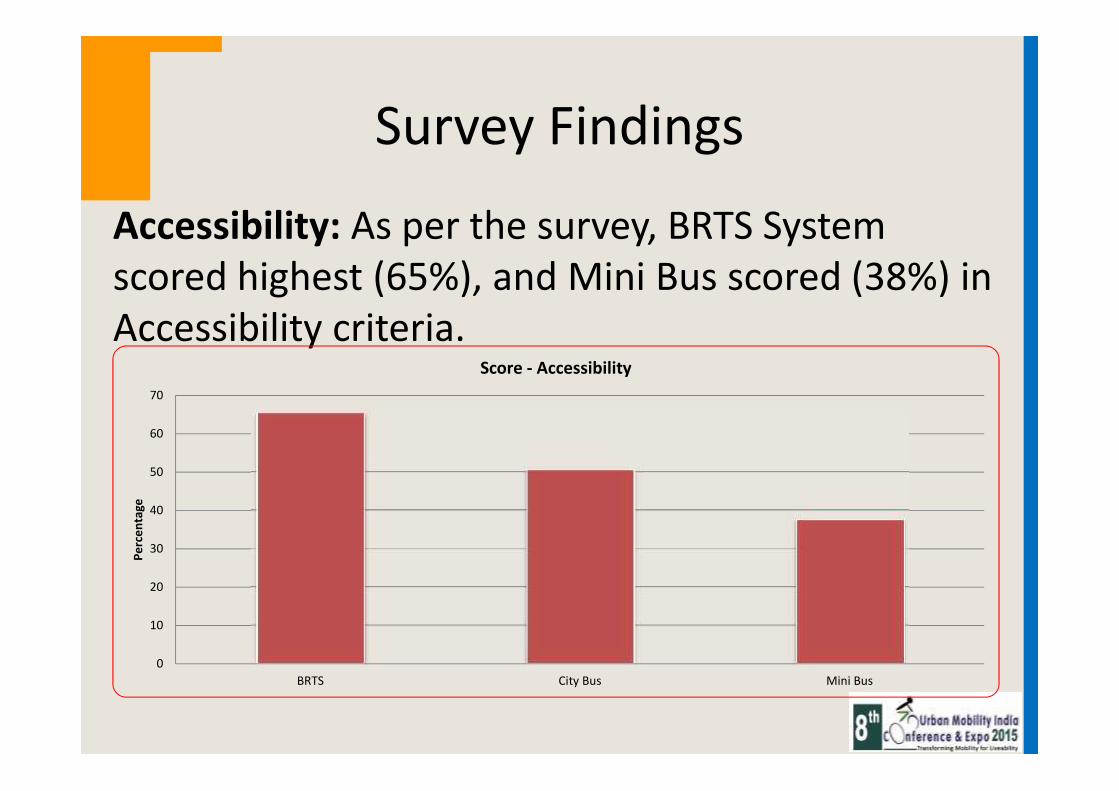
Accessibility: As per the survey, BRTS Systemscored highest (65%), and Mini Bus scored (38%) inAccessibility criteria.
0
10
20
30
40
50
60
70
BRTS City Bus Mini Bus
Perc
enta
ge
Score - Accessibility

Survey Findings– Safety: BRTS scored 80% whereas Mini Bus scored 35%– Frequency: Mini Bus scored 62% whereas City Bus and BRTS scored 58%, 41%
respectively. In other words, the frequency of BRTS Service is even inferior tothe City Bus service.
0
10
20
30
40
50
60
70
80
90
BRTS City Bus Mini Bus
Perc
enta
ge
Score - Safety
0
10
20
30
40
50
60
70
BRTS City Bus Mini Bus
Perc
enta
ge
Score - Frequency

Survey FindingsDriver Behavior: Scores achieved by BRTS and City Bus, are
80% and 70% respectively. It was observed that Mini Bus Drivers andConductors are not properly dressed and force the passengers toboard their bus (to maximize profits) and this ended up in users givingonly 40% score to Mini Bus Service in Driver Behavior criteria.
0
10
20
30
40
50
60
70
80
90
BRTS City Bus Mini Bus
Perc
enta
ge
Score - Driver Behavior

Survey FindingsSpeed/Travel Time: The scores of BRTS, City Bus and Mini Bus
Services are 82%, 61% and 45% respectively. The scoring clears thatBRTS service is the fastest Public Transport Service in Bhopal, asperceived by Commuters.
0
10
20
30
40
50
60
70
80
90
BRTS City Bus Mini Bus
Perc
enta
ge
Score - Travel Time/Speed

Survey Findings
Space Availability: As per the survey, City Buses are the mostcrowded, followed by Mini Bus and BRTS. Commuters gave 79% marksto BRTS, 65% marks to Mini Bus, whereas City Bus Service scored only40% on the Space Availability criteria.
0
10
20
30
40
50
60
70
80
90
BRTS City Bus Mini Bus
Perc
enta
ge
Score - Space Availability
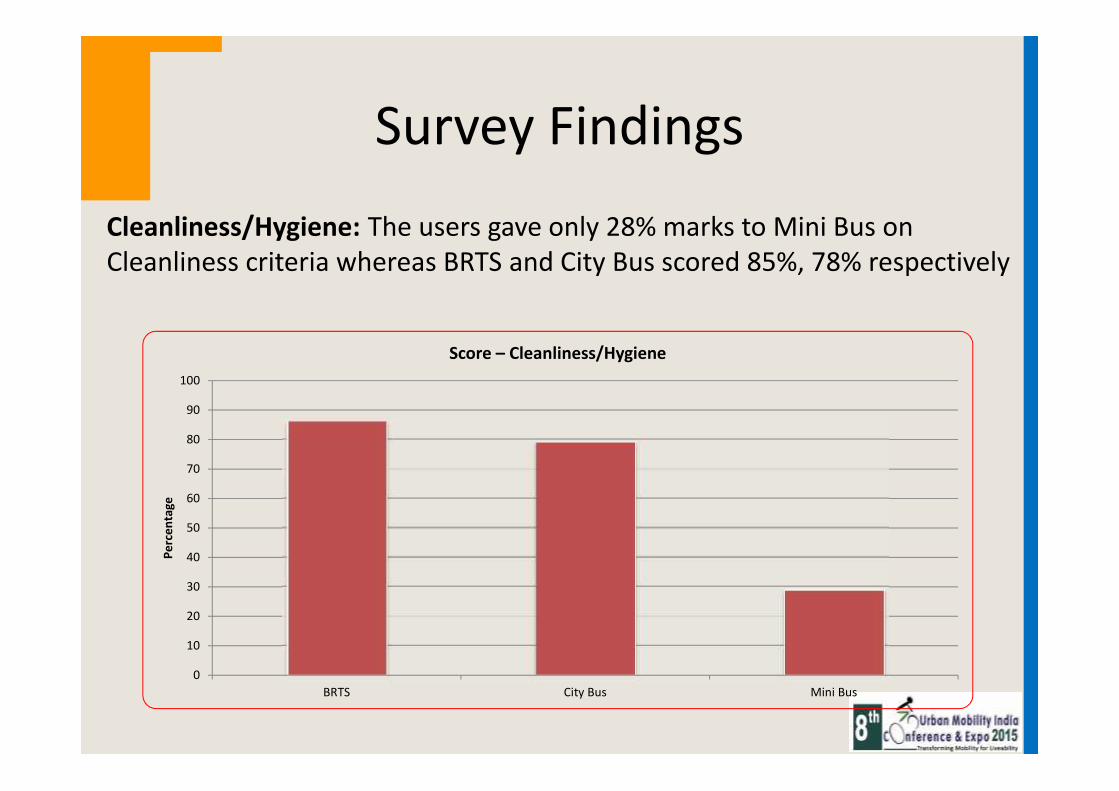
Survey FindingsCleanliness/Hygiene: The users gave only 28% marks to Mini Bus onCleanliness criteria whereas BRTS and City Bus scored 85%, 78% respectively
0
10
20
30
40
50
60
70
80
90
100
BRTS City Bus Mini Bus
Perc
enta
ge
Score – Cleanliness/Hygiene

Survey Findings
Comfort: The Mini Bus Service scored nearly 20% whereas BRTS andCity Bus Service scored 90% and 78% respectively, making BRTS asmost comfortable service.
0
10
20
30
40
50
60
70
80
90
100
BRTS City Bus Mini Bus
Perc
enta
ge
Score - Comfort

Survey FindingsValue for Money: As per the user interview, the fare range of BRTSService is from INR 10 – INR 30 whereas that of City Bus fare range isINR 8 – INR 25. On the other hand, Mini Bus service is offered on fareslab of INR 5 – INR 10 – INR 15 only. On many parallel stretches thefare of BRTS is just double that of Mini Bus fare. The users on Valuefor Money criteria gave BRTS, City Bus and Mini Bus service 50%,53%and 78% respectively
0102030405060708090
BRTS City Bus Mini Bus
Perc
enta
ge
Score - Value for Money
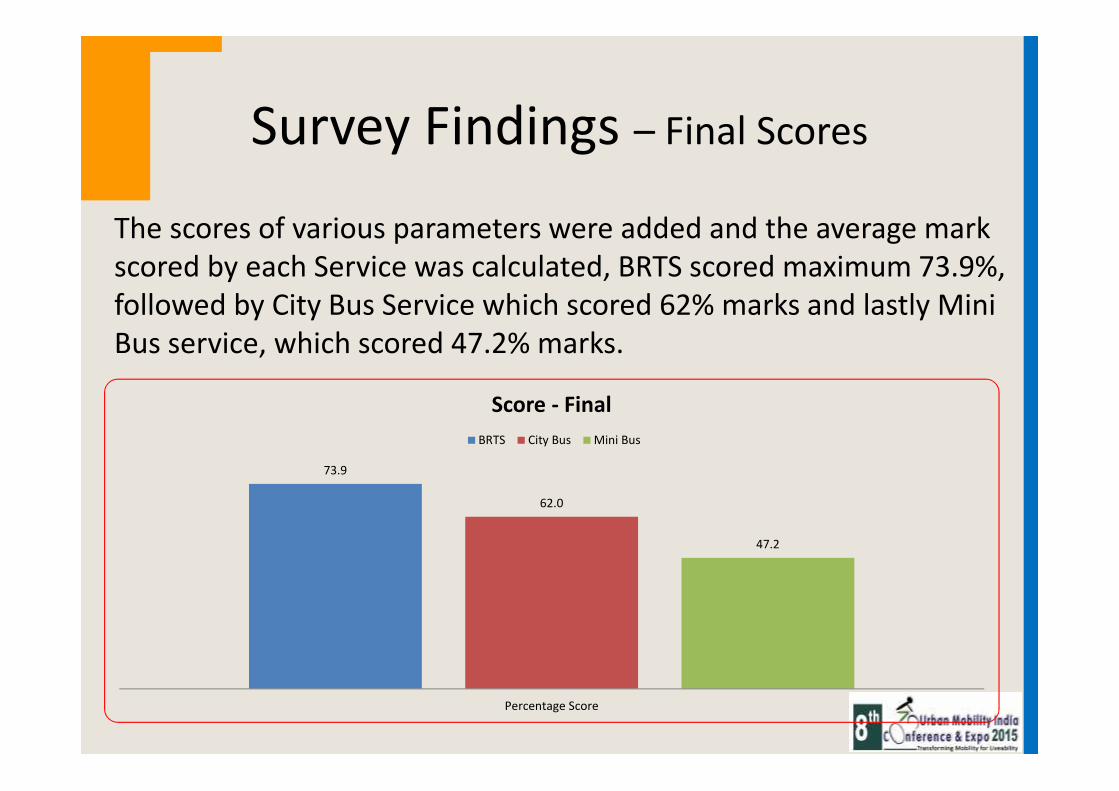
Survey Findings – Final Scores
The scores of various parameters were added and the average markscored by each Service was calculated, BRTS scored maximum 73.9%,followed by City Bus Service which scored 62% marks and lastly MiniBus service, which scored 47.2% marks.
73.9
62.0
47.2
Percentage Score
Score - FinalBRTS City Bus Mini Bus

Comparative Analysis of ScoresMini Bus service can improvise upon the Safety, Comfort and
Cleanliness parameters. Mini Bus service has scored well inFrequency, Seat Availability and Value for Money.BRTS and City Bus services are Comfortable, Safe and Clean but needto work on Last Mile Connectivity, Accessibility, Frequency, and mustreview Fare Structure to increase the patronage and Scores.
0%
10%
20%
30%
40%
50%
60%
70%
80%
90%
100%
BRTS City Bus Mini Bus
Perc
enta
ge
Comparative Analysis of Performance Indicators
Value for Money
Comfort
Cleanliness
Over Crowding
Speed/Travel Time
Driver Behaviour
Frequency
Safety
Accessibility

Scores by PT Users
• In previous study the scores given by users toMini Bus, City Bus and BRTS Service is asbelow:
S. No Service Type Fleet Size Score Achieved
1 Mini Bus 300 (approx) 47.2 %
2 City Bus 199 62.0 %
3 BRTS 20 73.9 %
Cumulative Score (Weighted Mean)
= {(300*47.2)+(199*62.0)+(20*73.9)}/519
53.90 %

Understanding from Literature Study
• Benchmarking Public Transport in India is a LOSbased Evaluation
• Indian SLB have 6 categories of Benchmarks,which are as mentioned below:– Presence of organized Public Transport System in
Urban Areas (in %)– Extent of Supply Availability of Public Transport– Service Coverage of Public Transport in City– Average Waiting Time for Public Transport users– Level of Comfort in Public Transport, and– %age of fleet as per Urban Bus Specification
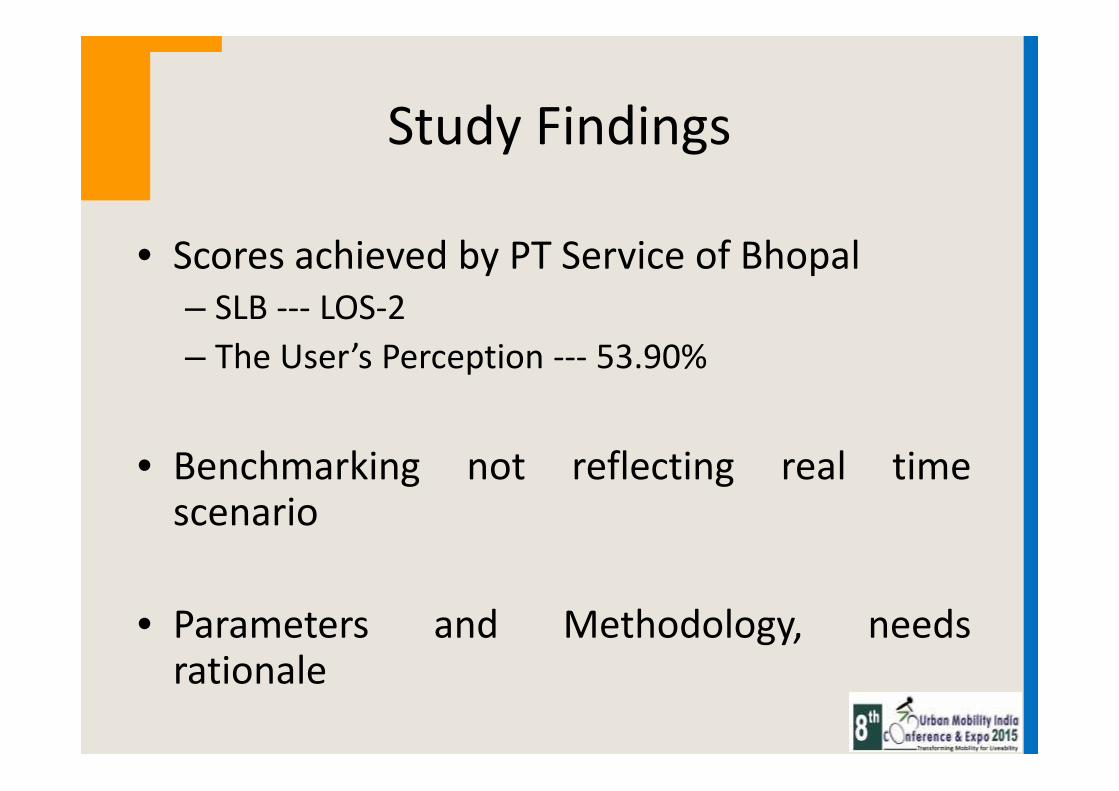
Study Findings
• Scores achieved by PT Service of Bhopal– SLB --- LOS-2– The User’s Perception --- 53.90%
• Benchmarking not reflecting real timescenario
• Parameters and Methodology, needsrationale

Limitations & Challenges
• Data Collection visit to Office/Depot revealedfollowing Limitations and Challenges, inIndian context– Inadequate Staff– No budget for extensive Survey requirement– Less Technical Know How and Analytical Skills– Lack of Disclosure, Reporting & Monitoring
mechanism– Lack of Incentives and Disincentives
Conclusions
Public Transport users are diverse. They have diversecharacteristics like Gender, Age, Qualification, Income etc. Thedecision of establishing and operating a Public Transport serviceshould not be focused to a particular Commuter Category rathershould be inclusive.
The Public Transport service should not be evaluated inisolation, but it should be evaluated in regards to accessibility tothe Transit Stop, First and Last Mile Connectivity, Integration ofPublic Transport with Land Use and with other Modes of Transportincluding Multi Modal Integration.
Conclusions
Public Transport should address the travel need of Massand not just Class, as observed in the case of BRTS Bhopal.
The Benchmarking Parameters should also include theFinancial Criteria for evaluating a particular system. A servicewell established but which is not affordable by the users, makesno sense. The fare mechanism should be introduced to makePurchasing Power of the users as one of the most importantcriteria in Fare Fixation.

Thank You !!