analysis of potato consumption among households in odeda
TRANSCRIPT
DOI: 10.1515/ats‑2017‑0010 AGRICULTURA TROPICA ET SUBTROPICA, 50/2, 89–99, 2017
89
INTRODUCTIONAgriculture is the mainstream sector for food
production in Africa. However, it has not been given much consideration when it comes to staple food crops. As part of efforts to accelerate under‑nutrition reduction across a range of sectors, there is particular interest in ways to reshape agricultural and food systems, recognizing that in many countries, agricultural growth has failed to drive greater dietary diversity among the poor (Headey, 2012). Food is a basic need of man and requires a steady production to meet consumers’ need for consumption. Adesimi (1997) opined that the nation’s agricultural production is still largely in the hands of the small‑scale farmers who are said to account for ninety‑five percent of the total agricultural production in spite of the tremendous human, diverse climatic and land resources in Nigeria, thus food supply has continued to fall below demand level. Fabiyi and Idowu (1991) also indicated that Nigeria has been finding it difficult to feed its population without recourse to massive importation of food.
With regard to root and tuber crops, Scott et al. (2000) indicated that many developing countries’ policies towards the potato sector is at best characterised as one of benign neglect. Whereas other commodity groups have managed to interest government to the point of garnering public financial support for integrated strategies for crop improvement, marketing schemes that include product promotion both at home and abroad; and industrialisation. This is the situation with cassava production in Nigeria. Thus, meeting the ever‑growing demand for food remains a major challenge for world agriculture (Bhasin, 2002). Sub‑Saharan Africa (SSA) is the only region of the world where per capita food production has steadily declined over the past two decades and where agricultural output has grown annually by an average of less than 1.5 %, with food production increasing at a lower rate than the population growth (FAO, 2000). This greatly undermines the food security situation of the sub‑region.
Sweet potato (Ipomoea batatas [L.] Lam.) is a distinct tuberous crop which is rich in carbohydrate and
Original Research Article
Analysis of Potato Consumption among Households in Odeda Local Government Area, Ogun State, Nigeria
Muinat Mobolanle Sanusi, Damola Andrew Babatunde
Department of Agricultural Economics and Farm Management, Federal University of Agriculture, Abeokuta, Nigeria
Abstract
The study investigated the socio‑economic factors affecting potato consumption among households in Odeda Local Government Area (LGA), Ogun State. Multistage sampling technique was used to gather information from 80 households using a structured questionnaire. Data collected were analyzed using descriptive statistics and regression model. The study showed that 67.5 % of the household‑heads were male, 42.5 % were less than 30 years old, more than half (53.8 %) had income less than NG₦50,000.00 (US$322.59) monthly while 55 % and 68.8 % spend less than NG₦2,000.00 (US$12.90) on sweet and Irish potato, respectively, on a monthly basis. The linear functional form for sweet potato regression result showed that the total household income and sweet potato market price were both significant at 5 % with the coefficient of determination (R2) being 0.611 while the double‑log functional form for Irish potato regression result showed that age of household‑head, Irish potato market price and price of substitute (yam) were significant at 5 %, 10 % and 10 %, respectively, with coefficient of determination (R2) being 0.897; and had a positive relationship with potato consumption in the study area. Conclusively, the age of household‑head, total monthly income, price of potato and price of substitute were factors that determined consumption of potato in the study area. In order to combat problems of malnutrition and to contribute to improvement in households’ welfare in Odeda LGA, efforts should be intensified in ensuring that households have access to adequate quantity of food and promotion of households’ education on the nutritional values and human nutrition with respect to age and gender are necessary.
Keywords: consumption; expenditure; food; households; income; sweet potato; Irish potato; market price; substitutes; utility.

AGRICULTURA TROPICA ET SUBTROPICA VOL. 50 (2) 2017
90
other nutrients (Odebode, 2004). It is classified within the family Convolvulaceae which include 40 or 50 genera and 1,200 or more species. Sub‑Saharan Africa produces more than seven million tonnes of sweet potatoes annually, and this constitutes 5 % of global production (Ewell, 2002). Africa’s main producers of sweet potatoes are Uganda (1.7 million tonnes) and Nigeria (1.6 million tonnes) followed by Tanzania (1.3 million tonnes; FAO, 2004). In Nigeria, sweet potato production is done by farmers who maintain small farms and carry out their operations manually with traditional farm tools like hoes and machetes. It is one of the most important staple food crops with significant role for food security and also a potential commercial crop in many Sub‑Saharan African countries (Kivuva et al., 2014). As food, sweet potato storage roots are boiled and eaten or chipped, dried and milled into flour which is then used to prepare snacks and baby weaning foods (Kidmose et al., 2007). Also, deep orange fleshed sweet potato roots are reported to be rich in Fe (50 ppm DM) and Zn (40 ppm DM) with about 3.5 % – 9.5 % DM protein in storage roots, stems and leaves (Çalifikan et al., 2007; Grüneberg et al., 2009). In some developed countries, light industries use sweet potato as an industrial raw material to produce starch, natural colorants and fermented products such as wine, ethanol, lactic acid, acetone, and butanol (Duvernaya et al., 2013). Importantly, farmers use almost all parts of the sweet potato plant as livestock feed (Claessens et al., 2008). This illustrates the inherent potential of sweet potato which is unexploited in many African countries including Nigeria.
The Irish potato (Solanum tuberosum L.) on the other hand, is classified within the family Solanaceae is by far the most efficient tuber crop in Nigeria in terms of tuber yield and days to maturity. It matures in about 80 – 90 days as compared to 9 – 12 months, respectively, for yam and cassava. Therefore, the crop is produced almost throughout the year because of the short maturity period making it the highest yielding tuber crop in Nigeria (Okonkwo et al., 1995). It is a starchy tuber which contains vitamins A and C. It has become an attractive winter crop in many arid irrigated areas where they are grown on relatively large commercial farms. As harvest in these areas occurs at the beginning of summer, storage and marketing constraints pose severe problems for the perishable crop; refrigeration is generally required both for seed and potatoes in these areas (FAO, 1992). This crop, however, is predominantly cultivated in Ireland and this gives it its name. Irish potato has high starch content with proteins which makes it important in the diet of human beings and also in animals.
Potato consumption is also very low at barely 3.2 kg per capita per year and Nigeria’s taste for potatoes especially in rapid growing urban areas is increasing. Since 2000, imports of raw and processed potatoes
have risen from less than 9,000 tonnes to 40,000 tonnes a year (Ugonna et al., 2011). Despite this increase, there are constraints to production such as high cost of production inputs which need attention for more production to meet consumption. Survey reports in Nigeria show that production, marketing and utilization have expanded in the last decades beyond its traditional central and riverine areas (Agboola, 1979) to almost all ecological zones in the country (Teweet al., 2001). The crops are grown for both human and animal consumption (Onwueme, 1978; Onwueme and Sinha,1991; Onyenweaku and Nwaru, 2005). Household income is also supplemented by sales of the root tubers in local markets and to urban dwellers (Woolfe, 1992).
Food consumption is centered mainly on household and income. The household can be defined as a group of people who eat from the same pot, excluding people not living permanently with the family. The amount spent by individuals or households on any particular goods or services is determined by a number of factors which influence the aggregate consumption by the level of current disposal income which is of high precedence. An increase in disposable income would induce consumers to increase their total spending in the country; decrease in disposable income will induce the consumers to reduce their spending on goods and services; thus, it can be said that consumption increases demand. The total consumer spending in an economy is generally calculated using the consumption function, a metric devised by John Maynard Keynes, which simply expresses consumption as a function of the aggregate disposable income. This metric essentially defines consumption as the part of disposable income that does not go into saving. Disposable income can be defined in a number of ways and this includes borrowed funds or expenditures from savings.
Consumption of food is a necessity to humans and thus there is need for the diet of consumers to be balanced in their nutrient composition and also for good health. In Nigeria, sweet potato is eaten as a substitute for yam as a result of lower cost of production, price and also its sweetness. This makes this crop very important in the diet of humans. The skin of potato could be employed for pectin production which is a structural polysaccharide used in animal feed production and also as a gelling agent in food such as jam, fruit juices (Horton, 1987).
Generally, the agricultural industry in Nigeria has performed below expectation despite the various efforts made by government in increasing food production. The major factors contributing to the generally low level of agricultural production in Nigeria include: poor allocation and management of resources, low level of technology, inadequate capital, poor economic infrastructure, lack of adequate incentives among others. These drawbacks led to
AGRICULTURA TROPICA ET SUBTROPICA VOL. 50 (2) 2017
91
the sub‑optional utilization of scarce resources (Sanni, 2000). In Nigeria, potato is still restricted to a few States and it is mainly for local consumption. Potato also constitutes a major part of diabetic diet due to its high protein content (Okonkwo et al., 1995; Scott et al., 2000). Over 80 % of the potatoes produced in Nigeria are consumed by boiling or frying. Some of the products made from potato and their uses include: potato crisp (thin sliced and dried potatoes used as snacks); potato starch (used in pharmaceutical industries and in the production of alcohol and wines). Others are potato used in bread baking industries and animal feeds. This is a major bottleneck for consumption as there are other improved recipes of potato which makes consumption better. All these would help answer questions such as: what are the socio‑economic characteristics of the respondents in the study area? What is the monthly expenditure on potato consumption? And what are the socio‑economic factors affecting the consumption of potato in the study area?
Therefore, this study was undertaken to assess potato consumption among households in Odeda Local Government Area, Ogun State, Nigeria. The objectives were to: describe the socio‑economic characteristics of respondents in the study area; estimate monthly expenditure on potato consumption; and examine the socio‑economic factors affecting potato consumption in the study area.
MATERIALS AND METHODS
Theoretical Framework
Theory of Utility Maximization by Consumer
The law of demand and supply is the concept of utility maximization which represents the advantages or the relative satisfaction an individual derives from the consumption of a good or service. Utility then explains how consumer and economy aims to gain optimal satisfaction in dealing with scarcity. Total utility is the aggregate sum of satisfaction that an individual gains from consuming a given amount of commodity or service in an economy. It is the total satisfaction from the consumption of a given product. The amount of personal utility corresponds to the amount or level of consumption. Usually, the more the person consumes, the larger the person’s utility will be. Total utility usually increases as more good is consumed. Consumer equilibrium occurs when the entire consumer’s income is allocated among different products so that the combination of products maximizes the consumer’s total utility. Total Utility is maximized when: the entire consumer’s income is spent; and the marginal utility per naira spent which is the marginal utility from a good divided by the price of the good.
Marginal utility is the additional satisfaction derived from the consumption of an additional unit of a good or
service. It is the extra utility obtained from consuming one additional unit of a commodity. Marginal utility usually decreases with each additional increase in the amount of consumption of a good. This decrease explains the law of diminishing marginal utility. This is so because there is a certain threshold satisfaction a consumer has that the consumer will no longer receive pleasure in consumption once that threshold is crossed. So, total utility increases at a slower pace as an individual increases the quantity consumed. Economists assume that the consumer is rational and will thus maximize his or her total utility by purchasing a combination of different products rather than one particular product.
Keynesian Theory of Consumption
Consumption is the total amount of goods and services people are willing to purchase for immediate consumption. As such it is one of the main determinants of economy’s aggregate demand. Keynes’ theories center on the equation:
C = a + bY
This shows that the consumption level is influenced by an autonomous figure (a), and a constant fraction of income (bY). Keynes theorized that the autonomous figure would always be positive and the multiple of income would lie between one and zero, varying according to the individuals in the economy. This factor of income is named the marginal propensity to consume (MPC) and was included because men are disposed, as a rule, and on the average to increase their consumption as income increases but not by as much as the increase in their income. This may seem obvious as it is impossible for an individual to continually spend more than they earn, which would be implied if the MPC were to be greater than one. In general, any rise in income would lead to an equal rise in consumption. A key idea from this theory is that of saving, by definition, all income not spent on consumption in a two‑sector economy is saved by the individual. In a three‑four sector economy, this still holds but must be examined more closely. Keynes reasoned that there is a certain level of consumption that is necessary for an individual to stay alive; this would typically consist of expenditure on food, health and shelter and sometimes in certain cases could contain other items. The Keynesian theory of consumption states that current real disposable income is the most important determinant of consumption in a short‑run. It is a measure of the quantity of goods and services that consumers have bought with their income (budget).
The Keynesian consumption function: Disposable income (Yd) = Gross income – (Deduction from direct taxation + benefits).

AGRICULTURA TROPICA ET SUBTROPICA VOL. 50 (2) 2017
92
The standard Keynesian consumption function is:
C = a +C1 Yd
WhereC = total consumptiona = autonomous consumption (a > 0), this is the level of consumption that would take place even if income was zero. If the individual’s income falls to zero some of his existing spending could be sustained by using savings. This is known as dis‑saving. In estimation, it is usually assumed to be positive. There is a positive relationship between disposable income (Yd) and consumer spending. As income rises, so does total consumer demand.Yd = disposable income (Income after government intervention)C1 = the marginal propensity to consume (i.e. the induced consumption) (0 < C1 < 1), this is the change in consumption divided by the change in income supply; it is the percentage of each additional pound earned that would be spent. A change in marginal propensity to consume causes a pivotal change in the consumption function and it measures the rate at which consumption is changing when income is changing. In a geometric fashion, the MPC is actually the slope of the consumption function.
The average propensity to consume (APC) is a relationship between total consumption and total income in a given period of time. In other words, APC is the ratio of consumption to income. Thus: APC = C/Y; where C = Consumption; Y = Income; APC = Average propensity to consume. The MPC is assumed to be positive. Thus, as income increases, consumption increases. However, Keynes mentioned that the increases (for income and consumption) are not equal.
Permanent Income Hypothesis
The main assumption behind this theory is that people prefer their consumption to be smooth rather than volatile; that is, they prefer to buy a similar quantity of goods from week to week, from month to month and so on. At the same time, it is assumed that individuals are rational and sensible problem solvers. As this is known, consumers aim to smoothen their consumption, they will cut back links between consumption and any volatile variable, including income. In other words to do this, people would instead look into their long‑term income prospects which are known as their permanent income and adjust consumption to this rather than actual income. It is also noted that the Keynesian theory had included a form of permanent income, in that it was assumed that workers would not spend all their allocated money on the day they were paid; rather they will spread consumption over the month or however long between their salaries.
The hypothesis formulated by Milton Friedman was based on the assumption that the consumer maximizes utility over an extended period. Its key assumption is that permanent consumption (Cp) is proportional to permanent income (Yp), i.e. Cp = KYp, where K is a factor of proportionality and it depends on interest rate. Permanent income is defined as the long‑run income which is generated, such wealth remains fixed.
Life Cycle Hypothesis
The life cycle hypothesis is similar to the permanent income hypothesis, but it assumes that permanent incomes are usually calculated over individuals’ entire life spans. This leads to the transitory element being decided by the occupation and status of the individual. If income is lower than expected, individuals would borrow; then as their salaries increase, they start paying this borrowing off and then finally saving for when they retire. Amounts of income saved and dis‑saved over time are not always equal and interest on borrowing will diminish the savings considerably. Here permanent income is entirely constant, ceteris paribus.
The hypothesis is also heavily influenced by wealth other than income. If life starts with a certain amount of money, this money will be spent over the lifetime, thus increasing the level of permanent income, and the amount of saving and dis‑saving will alter accordingly; net saving will decrease. The life cycle hypothesis seems to be quite realistic and plausible. It may be noted, however, that this hypothesis emphasizes income as derived from wealth more than cash receipts. It also draws our attention to the fact that the consumers have to make a choice between immediate consumption and accumulating of assets for future use.
The Theory of Consumer Behaviour
The theory of consumer behaviour is based on the assumption of consumer utility function and consumer preferences. Consumption theory is based on the behavior of the individual as that consumer seeks to optimize his or her self‑interest. It deals with how the consumer behaves in an effort to maximize the benefits from the consumption of a commodity and how the consumer evaluates those benefits.
The models that make up consumer theory are used to present prospectively observable demand patterns for an individual buyer on the hypothesis of constrained optimization. Prominent variables used to explain the rate at which the good is purchased are the price per unit of that good, prices of related goods, and wealth of the consumer.
The fundamental theorem of demand states that the rate of consumption falls as the price of the good rises. This is called the substitution effect. Clearly if one does not have enough money to pay the price then one cannot buy any of the items. As prices rise, consumers will substitute away from higher priced goods and

AGRICULTURA TROPICA ET SUBTROPICA VOL. 50 (2) 2017
93
services, choosing less costly alternatives. Subsequently, as the wealth of the individual rises, demand increases, shifting the demand curve higher at all rates of consumption. This is called the income effect. As wealth rises, consumers will substitute away from less costly inferior goods and services, choosing higher priced alternatives.
Engel’s Law
Engel’s law is based on the observation that there is a limit to the amount that any person can possibly eat so that from a certain level of income, onward demand for food increases by less than income. This implies that food expenditure as a proportion of income decreases. Engel’s law postulates that by no means the absolute amount of food decreases. The absolute amount of food consumed may stay constant, it may increase or it may decrease. So long as it increases more slowly than income, it is consistent with Engel’s law. Engel’s law states that the demand for food income is inelastic. This means that demand for food rises proportionately less than income while the absolute amount consumed may change in a number of ways. Whether or not expenditure on a commodity change in the same way as demand for this commodity depends on what happens to prices and can depend on how narrowly the product in question is defined.
Engel also suggested that as income increases a large percentage of the income would be spent on luxuries. His earlier studies of family budget revealed that food consumption takes a bulk of the expenditure and it decreases as the standard of living of household improves. He also proposed that the lower the proportion of a nation’s wealth spent on food, better the welfare of such country (Mansfield, 1982).
Description of the study area
The study area is Odeda Local Government Area in the capital city of Ogun State which is Abeokuta. This area was selected because of production and consumption of food crops. Odeda Local Government Area is located 7°13′N3°31′E. It has an area of 1,560 km2 and a population of 109,449 at the 2006 census. It came into existence in 1976 after the creation of Ogun State following the reform of the military administration. It has tropical climate and two seasons: the raining and dry seasons. The raining season is from April to October, average daytime temperature is about 32 °C and relative humidity can be as high as 95 %, the land is made up of predominantly tropical soil and the major occupation is crop and livestock production.
Data collection
The study used primary data collected from a cross‑sectional survey of potato consumers from Odeda Local Government Area of Ogun State with the aid of a structured questionnaire. The survey
collected valuable information on several factors including household composition and characteristics, household income, households’ expenditure on food, potato quantity consumed, as well as socio‑economic factors affecting potato consumption.
Sampling procedure
A multistage sampling technique was used to gather information from 80 households with the use of a structured questionnaire. The first stage was the purposive selection of Odeda Local Government Area due to the availability of many potato consumers in this area. The second stage employed the use of simple random sampling technique which was used to select eight (8) communities in the area which are: Aregbe, Obantoko, Somorin, Osiele, Alabata, Kotopo, Eweje and Oluwo‑keesi and the last stage was the random selection of ten (10) households from each of the selected communities producing a sample size of 80.
Analytical Technique
Descriptive Statistics was used to analyze the socio‑economic characteristics of the respondents and estimate monthly expenditure on potato consumption. This included the use of frequency tables, percentages and means of distributions; regression model was used to analyze the socio‑economic factors affecting potato consumption in the study area. Here, the dependent variable is the quantity of potato ‘Y’ consumed (kg) while the independent variables are factors that affect the consumption of sweet and Irish potato which include; age of household head, education level of household head, household size, household income, price of potato and price of potato substitutes.
Implicitly, the functional form is as follows:
Y = ƒ(X1, X2, X3, X4, X5, X6, X7, X8, µ)
where:Y ......Quantity of potato consumed (Kg)X1 .....Age of household head (years)X2 .....Highest educational level of household head
(Years)X3 .....Household size (Number of persons)X4 .....Total household income (NG₦)X5 .....Potato market price (NG₦)X6 .....Substitute1 (Cocoyam) market price (NG₦)X7 .....Substitute 2 (Yam) market price (NG₦)X8 .....Substitute 3(Cassava) market price in (NG₦)µ .......Error term
The fitted functional forms are:
Linear: Y = β0 + β1X1 + β2X2 + β3X3 + + β4X4 + β5X5 + β6X6 + β7X7 + β8X8 + µ
Semi‑log: Y = β0 + β1lnX1 + β2lnX2 + β3lnX3 + + β4lnX4 + β5lnX5 + β6lnX6 + β7lnX7 + β8lnX8 + µ
Double Log: lnY = β0 + β1lnX1 + β2lnX2 + β3lnX3 + + β4lnX4 + β5lnX5 + β6lnX6 + β7lnX7 + β8lnX8 + µ

AGRICULTURA TROPICA ET SUBTROPICA VOL. 50 (2) 2017
94
A priori expectations of the coefficients are as specified below
β1 < 0; β2 > 0; β3 > 0; β4 > 0; β5 < 0; β6 > 0; β7 > 0; β8 > 0
RESULTS AND DISCUSSION
Socio‑economic characteristics of respondents
Table 1 shows the distribution of households according to socio‑economic variables as they relate to potato consumers. It is evident that the majority of the household heads (67.5 %) were male and 32.5 %
were female. The domination by male household heads among the potato consumers could be the result that males were being exposed to tedious nature of work like farming while their female counterparts did less strenuous works like processing and marketing of the agricultural produce. It could also be the result of the physical inbuilt nature and body composition of the male as compared to their female counterparts. This implies that potato consumption is mostly by male headed households whose physical body structure requires more energy giving food and are thus instrumental for potato consumption than their female
Table 1. Distribution of Potato Consumers according to Gender
Variables Frequency Percentage Mean
Gender
Female 26 32.5
Male 54 67.5
Total 80 100.0
Marital Status
Single 30 37.5
Married 47 58.7
Widowed 1 1.3
Divorced 2 2.5
Total 80 100.0
Age Group
<30 34 42.5
30–39 27 33.7
40–49 13 16.3
50–59 5 6.2
≥60 1 1.3
Total 80 100.0 33.60
Educational Level
SSCE 3 3.7
NCE 1 1.3
OND 3 3.7
HND 17 21.3
BSc 30 37.5
Masters 20 25.0
PhD 6 7.5
Total 80 100.0
Household Size
<4 19 23.8
4–6 45 56.2
7–9 13 16.3
10–12 3 3.7
Total 80 100.0
Religion
Islam 20 25.0
Christianity 60 75.0
Total 80 100.0
Source: Field Survey, 2013

AGRICULTURA TROPICA ET SUBTROPICA VOL. 50 (2) 2017
95
counterparts. The result further revealed that most of the households (58.8 %) were married, 37.5 % were single whereas 1.3 % were widowed and 2.5 % were divorced. This implied that the respondents were dominated by married men and women who invariably contributed to increase in household size and as a result increase in potato consumption was more among the married class in the various households than the single, divorced and widowed class. The age distribution of the household heads revealed that the age group of less than 30 years had the highest proportion (42.5 %) and this implied that households with this age group would consume more potato than other age groups since they are in their active years; this would enable them to work, increase farm production and ultimately reduce hunger and poverty if given adequate resources and enabling working environment. The educational background of the respondents revealed that households with a head holding B.Sc. were in the majority (37.5 %) while heads that had NCE were the least (1.3 %). This implied on the aggregate that majority of the households have a good knowledge of the nutritional benefits of potato and thus consume more potato. Furthermore, the study revealed that most (56.3 %) of the sampled respondents had a household size ranging between 4 and 6. This contributed to the consumption of potato by the households; implying that most household heads with large household size could bring an opportunity of meeting the welfare need and nutritional status of the households. Also, the result showed the households religious affiliation; and this indicated that most (75.0 %)
of the households were Christians while 25.0 % were Muslims. Christian households consume more of potato compared to Muslim households according to the survey. This implied that there was no taboo with respect to consumption of potato in the study area.
Description of Respondents by Proportion of Monthly Income and Monthly Food Expenditure on Consumption of Potato
The distribution of the households according to total monthly income is presented in Table 2. Households having an income less than NG₦50,001 (US$322.59) were the highest (53.8 %) in proportion and households with income above NG₦450,000 (US$2,903.23) were the least in number. However, the mean total monthly income was NG₦60,256.66 (US$388.75). This implied that households would be able to purchase more potato because of the cheap price of the commodity which could readily be afforded by households irrespective of their household size. Data in Table 2 also revealed the distribution of household according to total monthly expenditure on food. It showed that 36.2 % of the respondents spent more on food than others. This showed that households knew the importance of food to the welfare development of her members. The distribution also helps to explain Engel’s law which shows that as income increases, amount spent on food increases which is evident with households with income NG₦15,001 – NG₦25,000.
Table 2. Distribution of Households according to Monthly Income and Expenditure on Food
Total Monthly Income Frequency Percentage
NG₦ US$
<50,001 <322.59 43 53.8
50,001–150,000 322.59–967.75 30 37.5
150,001–250,000 967.75–1612.90 4 5.0
350,001–450,000 2258.07–2903.2 2 2.5
>450,000 >2,903.23 1.3
Mean 60,256.66 388.75 – –
Total – – 80 100.0
Monthly Food Expenditure
<15,001 <96.77 23 28.8
15,001–25,000 96.78–161.29 29 36.2
25,001–35,000 161.29–225.80 14 17.5
35,001–45,000 225.80–290.32 6 7.5
45,001–55,000 290.32–354.84 4 5.0
>55,000 >354.84 4 5.0
Total – – 80 100.0
Source: Field Survey, 2013NB: US$1 = NG₦155The use of current exchange rate of US$ to NGN is because the study was conducted in 2013 and not 2017. Thus, current exchange rate could not be used because there was no inflation and/or recession in the country when the study was carried as compared to the present situation.

AGRICULTURA TROPICA ET SUBTROPICA VOL. 50 (2) 2017
96
Description of Household by Quantity of Sweet and Irish Potato Consumed
The distribution of households according to the quantity of sweet potato consumed monthly is presented in Table 3. Almost half (48.8 %) of the households consumed less than 11 kg of sweet potato. This showed that majority of the households (48.8 %) in Odeda Local Government do not consume more than 11 kg of sweet potato monthly and this showed that the food crop is not mostly consumed in larger quantity by households in Odeda. Table 3 also revealed the distribution of households according to the quantity of Irish potato consumed monthly. Majority (75.0 %) of the households consumed less than 11 kg of Irish potato monthly.
Household Expenditure on Sweet and Irish Potato
Table 4 showed the distribution of households according to expenditure on sweet and Irish potato. Majority (55 %) and 68.8 % of the households spent less than NG₦2,001 (US$12.90) monthly on sweet and Irish potato respectively while 1.3 % each of the households spent more than NG₦10,000 (US$64.52) monthly on
both potato varieties. This means that the households were frugal in spending and may be because most of the households fall within the low‑income earners’ group.
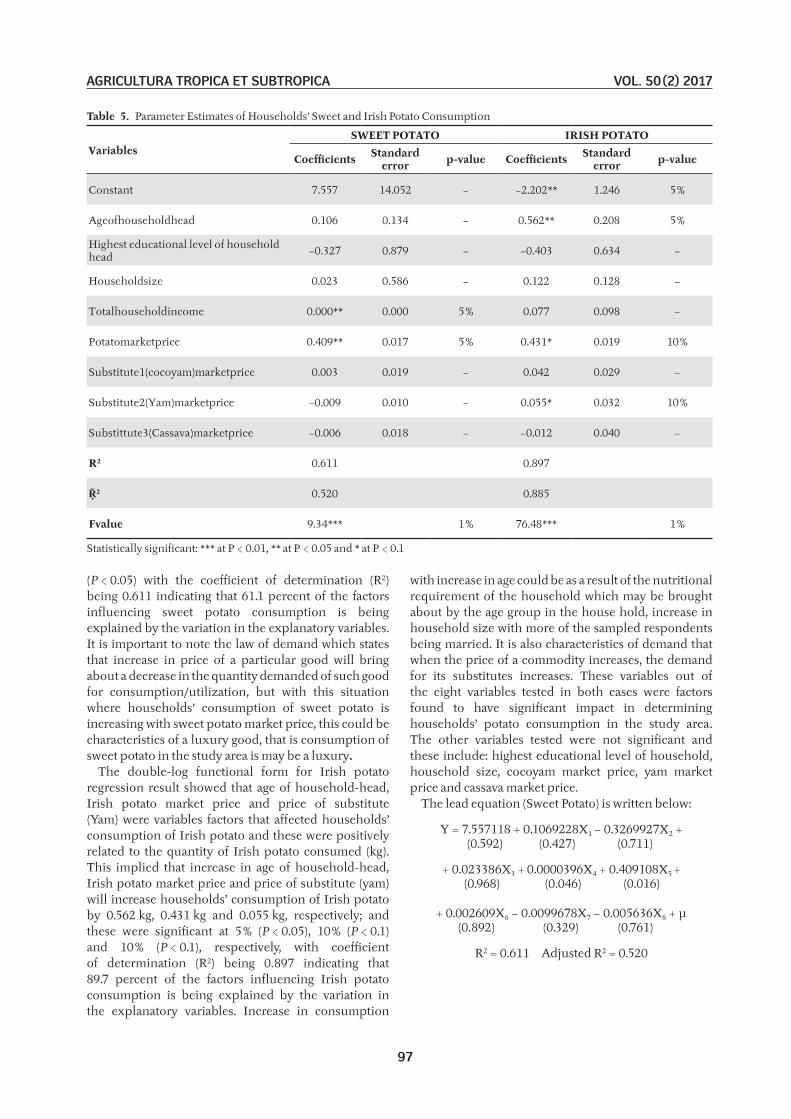
Determinants of Households’ Sweet and Irish Potato Consumption
Eight independent variables were considered to determine the effects they had on household consumption of potato. These variables included: age of household head, highest educational level of household head, household size, total household income, potato market price, substitute 1 (Cocoyam) market price, substitute 2 (Yam) market price and substitute 3 (Cassava) market price. The linear functional form for the sweet potato regression result showed that total household income and sweet potato market price were variables factors that affected households’ consumption of sweet potato and these were positively related to the quantity of sweet potato consumed (kg). This implied that increase in total household income and sweet potato market price will increase households’ consumption of sweet potato by 0.00004 kg and 0.40911 kg, respectively; both were significant at 5 %
Table 3. Distribution of Households according to Quantity of Sweet and Irish Potato Consumed
Quantity Consumed (Kg) Frequency Percentage
Sweet Potato
<11 39 48.7
11–20 34 42.5
21–30 2 2.5
31–40 4 5.0
41–50 1 1.3
Total 80 100.0
Irish Potato
<11 60 75.0
11–20 19 23.8
21–30 0 0.0
31–40 1 1.3
41–50 0 0.0
Total 80 100.0
Source: Field Survey, 2013
Table 4. Distribution of Household according to Monthly Expenditure on Sweet and Irish Potato
ExpenditureSWEET POTATO IRISH POTATO
Frequency Percentage Frequency Percentage
NG₦ US$
<2,001 <12.90 44 55.0 55 68.8
2,001–4,000 12.91–25.80 27 33.8 14 17.5
4,001–6,000 25.81–38.70 4 5.0 9 11.3
6,001–8,000 38.71–51.60 4 5.0 1 1.3
≥10,000 ≤64.52 1 1.3 1 1.3
Total – 80 100.0 80 100.0
Source: Field Survey, 2013
AGRICULTURA TROPICA ET SUBTROPICA VOL. 50 (2) 2017
97
(P < 0.05) with the coefficient of determination (R2) being 0.611 indicating that 61.1 percent of the factors influencing sweet potato consumption is being explained by the variation in the explanatory variables. It is important to note the law of demand which states that increase in price of a particular good will bring about a decrease in the quantity demanded of such good for consumption/utilization, but with this situation where households’ consumption of sweet potato is increasing with sweet potato market price, this could be characteristics of a luxury good, that is consumption of sweet potato in the study area is may be a luxury.
The double‑log functional form for Irish potato regression result showed that age of household‑head, Irish potato market price and price of substitute (Yam) were variables factors that affected households’ consumption of Irish potato and these were positively related to the quantity of Irish potato consumed (kg). This implied that increase in age of household‑head, Irish potato market price and price of substitute (yam) will increase households’ consumption of Irish potato by 0.562 kg, 0.431 kg and 0.055 kg, respectively; and these were significant at 5 % (P < 0.05), 10 % (P < 0.1) and 10 % (P < 0.1), respectively, with coefficient of determination (R2) being 0.897 indicating that 89.7 percent of the factors influencing Irish potato consumption is being explained by the variation in the explanatory variables. Increase in consumption
with increase in age could be as a result of the nutritional requirement of the household which may be brought about by the age group in the house hold, increase in household size with more of the sampled respondents being married. It is also characteristics of demand that when the price of a commodity increases, the demand for its substitutes increases. These variables out of the eight variables tested in both cases were factors found to have significant impact in determining households’ potato consumption in the study area. The other variables tested were not significant and these include: highest educational level of household, household size, cocoyam market price, yam market price and cassava market price.
The lead equation (Sweet Potato) is written below:
Y = 7.557118 + 0.1069228X1 − 0.3269927X2 + (0.592) (0.427) (0.711)
+ 0.023386X3 + 0.0000396X4 + 0.409108X5 + (0.968) (0.046) (0.016)
+ 0.002609X6 − 0.0099678X7 − 0.005636X8 + µ (0.892) (0.329) (0.761)
R2 = 0.611 Adjusted R2 = 0.520
Table 5. Parameter Estimates of Households’ Sweet and Irish Potato Consumption
VariablesSWEET POTATO IRISH POTATO
Coefficients Standard error p‑value Coefficients Standard
error p‑value
Constant 7.557 14.052 − −2.202** 1.246 5 %
Ageofhouseholdhead 0.106 0.134 − 0.562** 0.208 5 %
Highest educational level of household head
−0.327 0.879 − −0.403 0.634 −
Householdsize 0.023 0.586 − 0.122 0.128 −
Totalhouseholdincome 0.000** 0.000 5 % 0.077 0.098 −
Potatomarketprice 0.409** 0.017 5 % 0.431* 0.019 10 %
Substitute1(cocoyam)marketprice 0.003 0.019 − 0.042 0.029 −
Substitute2(Yam)marketprice −0.009 0.010 − 0.055* 0.032 10 %
Substittute3(Cassava)marketprice −0.006 0.018 − −0.012 0.040 −
R2 0.611 0.897
Ṝ2 0.520 0.885
Fvalue 9.34*** 1 % 76.48*** 1 %
Statistically significant: *** at P < 0.01, ** at P < 0.05 and * at P < 0.1

AGRICULTURA TROPICA ET SUBTROPICA VOL. 50 (2) 2017
98
The lead equation (Irish Potato) is written below:
LogY = − 2.202203 + 0.562149lnX1 − 0.4028118lnX2 + (0.082) (0.009) (0.527)
+ 0.1227325lnX3 + 0.0772762lnX4+ 0.4312721nX5 + (0.342) (0.435) (0.000)
+ 0.0424586lnX6 + 0.0556829lnX7 + 0.012589lnX8 + µ (0.149) (0.087) (0.755)
R2 = 0.897 Adjusted R2 = 0.885
NB: Values in parenthesis are standard t‑values
CONCLUSION AND RECOMMENDATIONThis study examined potato consumption among
households in Odeda LGA of Ogun State, Nigeria. The findings from the study showed that the age of household head, total monthly income, price of potato, and price of substitutes (Yam) were some of the important factors that determined the consumption of potato in the study area. Based on the findings from this study, the following recommendation becomes relevant:1. Apart from age of household head, government
should attempt to improve all or any of the remaining aforementioned factors, this would help improve the quantity of potato consumed in the Odeda LGA and this would consequently reduce the problem of malnutrition and also contribute to an improvement in households’ welfare in the area, thereby contributing to national efforts on the Millennium Development Goals (MDGs).
2. Stakeholders in the economy should help provide quality education and information on the qualities through implementation of programs, strategies and policies that would promote households’ education on the nutritional values of potato and human nutrition with respect to age and gender.
REFERENCESAdesimi A. A. (1997): Elasticity of Substitution, Return
to Scale and Farm Size, Empirical Evidence from Subsistence Agriculture. The Nigeria Agricultural Journal 13(3): 3 – 10.
Agboola S. A. (1979): An Agricultural Atlas of Nigeria, 248 p.
Bhasin V. K. (2002): Agricultural Productivity, Efficiency, and Soil Fertility Management Practices of Vegetable Growers in the Upper East Region of Ghana. A Revised Research Report Submitted to SADAOC Foundation. P. 4. Retrieved from http://content .c sbs.ut a h .edu/~ eh rba r/erc2 0 02/pd f/ P092.pdf
Çalifikan M. E., Sögut T., Boydak E., Ertürk E., Arioglu H. (2007): Growth, yield, and quality of sweet potato (Ipomoea batatas (L.) Lam.) cultivars in
the southeastern Anatolian and East Mediterranean Regions of Turkey. Turkish Journal of Agriculture and Forestry 31(4): 213 – 227.
Claessens L., Stoorvogel J. J., Antle J. M. (2008): Ex‑ante assessment of dual purpose Sweet potato in the crop‑livestock system of western Kenya: a minimum data approach. Agricultural Systems 99: 13 – 22.
Duvernaya W. H., Chinna M. S., Yencho G. C. (2013): Hydrolysis and fermentation of Sweet potatoes for production of fermentable sugars and ethanol. Industrial Crops and Products 42: 527 – 537.
Ewell P. T. (2002): Sweet Potato Production in Sub‑Saharan Africa: Patterns and Key Issues. Nairobi, Kenya: CIP.
Fabiyi Y. L., Idowu E. O. (1991): Investment Behaviour of Farmers in South‑Western Nigeria: Implications for Policy and Research. In: Olukosi J. O. and A. O. Ogungbile (eds): Appropriate Agricultural Technologies for Research – Poor Farmers. Nigerian Farming Systems Research Network, ABU, Zaria, Nigeria, pp. 45 – 52.
Food and Agricultural Organization (FAO) (2004): FAO Statistics. Food and Agriculture Organization, Rome, Italy. Accessed online 30thOctober, 2013 from http://www.apps.fao.org
Food and Agricultural Organization (FAO) (2000): World Agricultural Statistics, Basic Data Unit, Statistics Division. FAO, Rome, Italy.
FAO (1992): Corporate Document Repository. Appendix 4 – Global Production and Consumption of Roots and Tubers.
Grüneberg W., Mwanga R., Andrade M., Espinoza J. (2009): Selection methods: breeding clonally propagated crops. In: Ceccarelli S., Guimarães E. P. and E. Weltzien (eds.), Plant breeding and farmer participation. FAO, UN, Rome, Italy, pp. 275 – 322.
Headey D. (2012): Turning Economic Growth into Nutrition‑sensitive Growth. In Fan S. and R. Pandya‑Lorch (eds): Reshaping Agriculture for Nutrition and Health: International Food Policy Research Institute, Washington DC, pp. 39 – 46. Accessed online 20th January 2015 from www.ifpri.org/sites/default/files/publications/oc69ch05.pdf
Horton D. E. (1987): Potato, Production, Marketing, and Programmes for Developing Countries. West view press (Boulder), I. T. Publication London, pp. 127 – 135.
Kidmose U., Christensen L. P., Agili S. M., Thilsted S. H. (2007): Effect of home preparation practices on the content of provitamin A carotenoids in coloured Sweet potato varieties (Ipomoea batatas L. Lam.) from Kenya. Innovative Food Science and Emerging Technologies 8: 399 – 406.
Kivuva B. M., Musembi F. J., Githiri S. G., Yencho C. G., Sibiya J. (2014): Assessment of production constraints and farmers’ preferences for sweet

AGRICULTURA TROPICA ET SUBTROPICA VOL. 50 (2) 2017
99
potato genotypes. Journal of Plant Breeding and Genetics 2(1): 15 – 29.
Mansfield E. (1982): How Economists See Research and Development. Research Management 25(4): 23 – 29.
Odebode S. O. (2004): Acceptability of Sweet Potato “sparri” and its potentials for enhancing food security and economic empowerment of rural women in Southwestern Nigeria. The Nigerian Journal of Rural Sociology, Nos. 1 & 2: 104 – 112.
Okonkwo J. C., EneL. S. O., Okoli O. O. (1995): Potato Production in Jos Plateau National Root Crops Research Institute, Umudike, Nigeria, pp. 1 – 33.
Onwueme I. C. (1978): The Tropical Tuber crops: yam, cassava, sweet potato, and cocoyam. John Wiley and Sons Ltd, Chichester, United Kingdom, 232 p. ISBN: 0471996076.
Onwueme I. C., Sinha T. D. (1991): Field Crops Production in Tropical Africa. Technical Centre for Agriculture and Rural Cooperation, 480 p.
Onyenweaku C. E., Nwaru J. C. (2005): Application of a Stochastic Frontier Production Function to the Measurement of Technical Efficiency in Food Crop Production in Imo State, Nigeria. Nigeria Agricultural Journal 36(1): 1 – 12.
Sanni A. (2000): Farm Organization in Katsina State. Unpublished Ph.D. Dissertation. Department of Agricultural Economics and Rural Sociology, Ahmadu Bello University, Zaria, Nigeria.
Scott G. J., Best M. R., Rosegrant M., Bokanga M. (2000): Roots and Tubers in the Global Food System: A Vision Statement to the Year 2020. International Potato Center, Lima, Peru, 118 p. ISBN: 92‑9060‑203‑1.
Tewe O. O., Abu O. A., Ojeniyi E. F., Nwokocha N. H. (2001): Status of Sweet Potato Production, Utilization and Marketing in Nigeria. In Akoroda, M. O. and J. M. Ngeve (eds): Root Crops in the 21st Century: Proceedings of the 7th symposium of the ISTRC‑AB, Cotonou, Benin, pp. 65 – 74.
Ugonna C. U., Jolaoso M. O., Onwualu A. P. (2011): Value Chain Analysis of Potato in Nigeria. Raw Materials Research and Development Council (RMRDC), Abuja, ISBN: 978‑978‑50745‑8‑1
Woolfe J. A. (1992): Sweet Potato: An Untapped Food Resource. Published in collaboration with International Potato Center (CIP) – Peru. Cambridge University Press, 643 p. ISBN: 0521402956; 9780521402958
Received: January 25, 2016Accepted after revisions: August 7, 2017
Corresponding author:Muinat Mobolanle Sanusi Department of Agricultural Economics and Farm Management Federal University of Agriculture, Abeokuta, Nigeria P.M.B 2240, Sapon, Ogun State, Nigeria E‑mail:[email protected],[email protected] Telephone Number: +234 703‑3046‑336

AGRICULTURA TROPICA ET SUBTROPICA VOL. 50 (2) 2017
100