households’ net income and food consumption in the …
TRANSCRIPT

69
HOUSEHOLDS’ NET INCOME AND FOOD CONSUMPTIONIN THE CONTEXT OF THE CURRENT FINANCIAL CRISIS
(A CASE STUDY IN HANOI SUBURBAN)
VU DINH TON, PHAN DANG THANG, B. DUQUESNE, P. LEBAILLY *
1. INTRODUCTIONAccording to the General Statistics Office (GSO, 2008), Vietnam’s population is 86.2 million,with the annual growth rate of about 1.22%. Recent years witnessed a remarkable economicgrowth, which then raised the demand of food consumptions and the expenditures of foodproducts in the households. In the period of 1992 – 1993, the total expenditures of foodconsumption of the country reached about US$ 3.4 billion. The expenditures of foodconsumption were doubled in 2002, reaching approximately US$ 7.2 billion (GSO, 2002). Theaverage food consumption a year in urban areas is about 2.2 million of Vietnam Dong (VND)per person and the rural areas is about VND 1.1 million (M. Figuié and N. Bricas, 2003). Therole of food self-sufficiency in rural areas plays an important part by supplying food, vegetablesand crops. In addition, a part of food from eggs and poultry meat is mainly from the self-sufficiency in households, in general. The self-sufficiency accounts for 36% in a family(Nguyen Duc Truyen, 2003).
A high proportion of daily expenditures for food consumption can be seen in the householdswith low and average income, accounting for 92% of total income in Hanoi (IPSARD andFUSAGx, 2008). The foods consumed are often pork, fish, poultry and sometimes beef, etc.Pork consumption per capita is about 29.7 kg per year of living pork (MARD, 2008). Therefore,the consumption habits of fresh meat are still common in households. However, consumers havedifficulties concerning hygiene and food safety, labeling, products traceability, etc. (Phan DangThang, 2007). There are some researches on the income and expenditures of foods in householdsuch as Vietnam living standards surveys (VLSS) every two years. This research aims to reply aquestion on income and food consumption in household through an approach of identification ofvarious income levels from agricultural production and off-farm activities and the expendituresof food consumption at household level in Hanoi rural areas in the context of present globaleconomic crisis.
* Vu Dinh Ton and Phan Dang Thang from the Centre for Interdisciplinary Research on RuralDevelopment, Hanoi University of Agriculture. Brigitte Duquesne and Phillipe Lebailly from the Unit of Economic and Rural Development,Gembloux Agro-Bio Tech, University of Liege, Belgium.

VIETNAM'S SOCIO-ECONOMIC DEVELOPMENT, N0.61, March 2010
70
2. METHODOLOGY
2.1. Selection of survey sitesPhu Xuyen and Chuong My districts are selected in this research. Phu Xuyen district is situatedin the South, which has the national highway No.1 connecting Hanoi with the Southernprovinces; therefore, the district provides a large quantity of fish and poultry products; whereasChuong My district, with the national highway No.6 connecting Hanoi with the Northwestregion, supplies a large quantity of pork and industrial poultry products for Hanoi City.
The sampling households are surveyed by a variety of agricultural activities or off-farm incomeat different scales and by the diversity of small geographic areas in these districts. The surveyedcommunes in Phu Xuyen district include Phuc Tien, Dai Xuyen, Hoang Long and Hong Thai;and the surveyed communes in Chuong My district consist of Dong Phuong Yen, Truong Yen,Trung Hoa and Tot Dong. The research is carried out from March to October 2009, a period ofmost grave global economic crisis.

Vu Dinh Ton, Phan Dang Thang, B. Duquesne, P. Lebailly
71
2.2. Survey methods2.2.1. Data collection
The research began with the collection of official data concerning the household economicactivities and household food consumption from the reports of the Ministry of Agriculture andRural Development, General Statistics Office, etc.
Also, there are some direct interviews with local authorities such as Departments of Agricultureand Rural Development, Offices of Agriculture at the districts, and the leaders of communes orvillages of households selected based on the diversification of household structure in thesezones.
A diversification of household economic types was determined by some discussions with thekey persons at the research fields. 30 households at least per a household type are interviewed.But the households without labour force are not interviewed. 240 households are investigatedfollowing a structured questionnaire through random stratified sampling methods and a varietyof economic types of household to get to know the resources of household income and the foodconsumption level.
The interview of food consumption is confined to the foods mostly used every day such as eggs,beef, pork, chicken, duck, fish and tofu. Consumed foods quantity is interviewed by a tableaccording to a day, a week and a month in a year. This quantity is also included the food for theholidays.
2.2.2. Data analysis
The collected information allows the characterization of the recent economic activities and thenet income level, as well as the food consumption level and the quantity of daily, weekly ormonthly food consumption.
The principal income in the households are calculated such as cropping, animal production atdifferent scales and the income of off-farm activities such as hired labour, handicraft,transformation of agricultural products, transport services, small tractors, commerce andmonthly salary, etc. The survey data is preliminarily treated by the software of Excel and ofMinitab 15.
Different distribution models were associated to the income and each consumed food type bylogarithmic or square root according to the sale or purchase prices at household level.
The agricultural income are calculated by the method of value-add:
• Net Values Add (VAN) = Brut Values Add (VAB) – Depreciation Costs (Amt); in there:VAB = Gross Products (GP) – Intermediate Costs (IC)
• The income of off-farm activities is the net income by VND coming from hired labour,handicraft, transformation of agricultural products, monthly salary, etc. per household ayear.
• The consumed food quantity is the products that are purchased or self-products including inhousehold by daily, monthly and a year.

VIETNAM'S SOCIO-ECONOMIC DEVELOPMENT, N0.61, March 2010
72
• Expenditures of food consumption are the quantity of all types of food by the carcass meatconsumed in the household a daily, a weekly, a monthly are purchased in the market (withself-products including and with self-products none including in household).
3. RESULTS AND DISCUSSION
3.1. Household typesThe net income of the households is really diversified and complicated. Most of income of thehouseholds surveyed is still partly from agricultural production. This crop aims at satisfying thedemand of self-consumption and at buying a small part. Therefore, the cash income comes fromthe extra-agricultural activities such as seasonal hired labours, less qualified workers, civilservices, handicrafts, agricultural services of transport or of small tractors and traders atdifferent scales, etc. There are from two to three economic activities in most surveyedhouseholds. The results of this analysis of 237 households at these districts are presented inTable 1.
Table 1: Household types by income resource
Surface(sao**/household)Household types
Number ofsurveyed
households
Rate on allhouseholds indistrict* (%)
Agricul-ture
Garden,Fish pond
Small scale 35 21.0 5.06 1.00Simple agriculturalhouseholds
Commercial scale 32 3.2 20.59 21.13
Hired labour 30 40.8 6.80 4.30
Handicraftss 42 15.0 6.80 3.10
Service of transport 20 1.6 10.13 3.65
Agriculture withextra-agriculturalactivities
Monthly salary 32 5.4 3.94 2.03
Small trader 23 8.5 5.37 4.43Commercialhouseholds
Big trader 23 4.5 2.81 1.00
Total 237 100.00 - -
Notes: * Statistical Offices of Phu Xuyen and Chuong My Districts (2007).
** Sao is an area unit used in rural areas of the North of Vietnam. 1sao = 360m2
There are three different household types based on the importance level and the features offamilial economic activities such as the simple agricultural production households, theagricultural and extra-agricultural activities and the traders at different scales.
(a) Simple agricultural production households: the principal income is from vegetal production,animal production and fish production. The small production scale has an agricultural surface of5 sao/household and the income of animal or fish production is really limited. The surface of

Vu Dinh Ton, Phan Dang Thang, B. Duquesne, P. Lebailly
73
fish pond is presented in few households with an average surface of 1 sao/household. Accordingto local authorities, this group has a low and average economic level or at the poor threshold.The average age of householder is 46.2 years old, which is higher than other groups.
The commercial agricultural production scale is households with a large accumulation of rice-fields, with an average surface of 20 sao/household and there are 21 sao/household of fish-pondproduction surface. In addition, the animal production is at high commercial scale. Thesehouseholds are richer in communes. The average age of householder is 41.4 years old. There are4.22 persons and 2.28 actives per household.
(b) Agricultural income with extra-agricultural activities: under the pressure of work and cashfor diversified demands in the household, most of household income also from one or severalextra-agricultural activities. The most popular works are seasonal hired labour, carrying bricks,mason or handicraftss at Hoang Long and Dong Phuong Yen communes; whereas, fewhouseholds who have an agricultural service of transport or of small tractors. Few householdshave income from aquatic products, with an average surface from 1 – 4.5 sao per household.However, the rice production brings low income, therefore, some households spent theiragricultural surfaces for other purposes. There are from 4.50 to 4.63 persons and from 2.20 to2.56 actives per household.
(c) Trade households: the principal income of this group is from commercial activities such asselling animal aliments, agricultural inputs and general stores. Whereas small traders have also amixed income from agricultural and off-farm activities, big traders leave their agriculturalsurface. There are from 4.39 to 4.57 persons and 2.30 actives per household. In addition, the bigtraders also have to employ 2.19 workers per household.
3.2. Sources of household income
The sources of income of surveyed households are very diverse, so most of them have a mixedincome between the crops – animal production with the extra-agricultural activities. The incomeof most households is still met with grave difficulties caused by global economic crisis duringthe research period, particularly economic results of poultry and pig production households arevery unsettled. The small agricultural production households just have income of 15,775thousand VND per household per year, equivalent of 4,059 thousand VND per person per year.So, the crop production income accounts for 48.78%, from animal production 41.62%, and fromfishery only 9.60%. Whereas, the commercial agricultural production households have anincome of 107,883 thousand VND per household per year, or 26,945 thousand VND per personper year (Tables 2 and 3). So, the crop production occupies 17.19%, animal production 35.20%and fishery 47.60%. According to Vietnam Living Standards Survey (VLSS, 2007), the monthlyaverage income in whole country is 636 thousand VND per capita, and in rural areas was 506thousand VND per capita.
The crop production aims at food’s self-sufficiency in every household but the extra-agriculturalactivities play an important role for the cash. There is why the economic crisis influencedgreatly to national economy but in this research the rural areas are not greatly influenced. Theannual stable income per household comes 59,638 thousands VND in the group who has amonthly salary. As a result, the crop production takes up from 15.73% to 22.49%, from 21.90%to 34.07% for animal production, and from 7.86% to 17.56% from fishery. The income of extra-

VIETNAM'S SOCIO-ECONOMIC DEVELOPMENT, N0.61, March 2010
74
agricultural activities in this group occupies from 30.89% to 44.02% of total income perhousehold per year.
Table 2: Diversified income sources of household (VND 1.000/household/year)
AgricultureHousehold types
Crops Animal Fish
Hiredlabour
Handi-crafts
Servi-ces
Trade Salary
Small 6,727 7,033 2,014 0 0 0 0 0Agriculture
Commer-cial
18,533 35,303 54,047 0 0 0 0 0
Labour 9,691 18,543 8,373 15,954 0 0 0 0
Handi-craft
8,298 16,258 14,440 0 12,590 0 0 0
Service 12,781 13,072 5,250 0 2,160 25,640 0 0
Agriculturewith off-farmactivities
Salary 8,518 19,166 10,313 0 719 0 0 20,923
Small 7,308 15,941 11,804 0 0 0 19,643 0Commercialhouseholds
Big 0 12,782 0 0 0 0 94,348 17,148
Table 3: Average income per household and those per capita (1000 VND)
Household types VAN/year/person
VAN/month/person
VAN/month/household
VAN/year/household
Small scale 4,059c 338 1,315 15,775cAgriculturalhouseholds
Commercial scale 26,945a 2,245 8,990 107,883a
Hired labour 12,137b 1,011 4,380 52,562b
Handicrafts 11,060b 922 4,299 51,587b
Service of tractor 13,248b 1,104 4,909 58,904b
Agricultureand off-farmactivities
Monthly salary 15,321b 1,277 4,970 59,638b
Small trader 12,567b 1,047 4,558 54,697bCommer.Households
Big trader 29,068a 2,422 10,356 124,277a
Note: Statistical significant difference (P<0.05) if the values which have different letters in a column.
There are large fluctuations within the income among different household groups.Consequently, the small agricultural production households have a low income or a little higherthan the national poverty threshold. The monthly income of this group is lowest, with only 338thousand VND per capita. An income disparity is wide accounting for 7.9 times between the bigtrade households and the small farmers. These economic results are higher than economicresults of VLSS 2006 (the monthly income of poorest households in whole country reached 184thousand VND and of richest households reached 1,542 thousand VND per capita). The

Vu Dinh Ton, Phan Dang Thang, B. Duquesne, P. Lebailly
75
monthly income per capita in a commercial agricultural production household is about 2,245thousand VND, or higher 6.6 times than a small agricultural household. The income of extra-agricultural households or small traders is about 1 million VND per capita per month. While thebig traders get the highest income, up to 29,068 thousand VND per capita per year or 2,422thousand VND per capita per month or 7.2 times higher than small farmers.
This result is the same with the coefficient in whole country. Comparison between 20% ofrichest households with 20% of poorest households in whole country, a wide income disparitywas 8.4 times in 2006 and from 7.6 times in 1999 to 8.3 times in 2004 (VLSS, 2007). Thus, aninequality in income trends to increase between the households in the same region.
3.3. Consumer tastes and food consumption quantity
The principal foods usually consumed are pork, fish, tofu, eggs, poultry meat and sometimesbeef, etc. Therefore, pork and poultry meat occupies an important position in almosthouseholds. The rate of beef only occupies 2.58%, to 35.66% of pork, 15.83% of chicken meat,18.41% of duck meat and 27.53% of fish of the total meat consumed.
In fact, the consumption of beef and pork can increase according to the familial income. Thefood consumption of poor households is usually lower than that of rich households. The higherincome households may often reduce the demand of poultry consumption, while averageincome households may often increase the poultry consumption. The self-sufficient level ofpoultry products is very important in almost households. Especially, the poultry are not usuallypurchased in many agricultural production households.
The rate of beef consumption of pure agricultural production households and farm-householdswith extra-agricultural activities such as handicrafts, seasonal hired labour, and small traderoccupies only 1.4%, so that the pork consumption occupies between 32.55% and 38.69%, thechicken meat occupies between 11.89% and 19.35% and the fish consumption occupies from26.93% to 32.65% (Table 4).
Table 4: Annual food consumption of household per year
Carcass meat (kg/household/year)
Household types Beef Pork Chicken Duck Fish Averagetotal
Eggs
/year
Small scale 2.43a 97.72a 30.94a 39.59a 87.06 257.74a 512.91Agriculturalhouseholds
Comerc. scale 4.60a 96.98a 49.27a 58.46a 90.29 299.60a 387.31
Hired labour 3.24a 130.84a 57.40a 60.32a 97.91 349.70a 661.40
Handicrafts 5.66a 107.61a 40.36a 52.57a 76.02 282.22a 547.81
Services 11.30a 147.78b 60.42a 57.43a 92.40 369.32b 645.00
Agriculturewith off-farmactivities
Salary 8.39a 111.76a 59.90a 49.10a 86.09 315.25a 635.88
Small scale 4.12a 103.87a 53.21ab 61.66ab 94.52 317.39a 458.70Commer.
households Big scale 29.48b 120.52a 70.42b 106.07b 71.57 398.05ab 819.13
Note: Statistical significant difference (P<0.05) if the values which have different letters in a column
VIETNAM'S SOCIO-ECONOMIC DEVELOPMENT, N0.61, March 2010
76
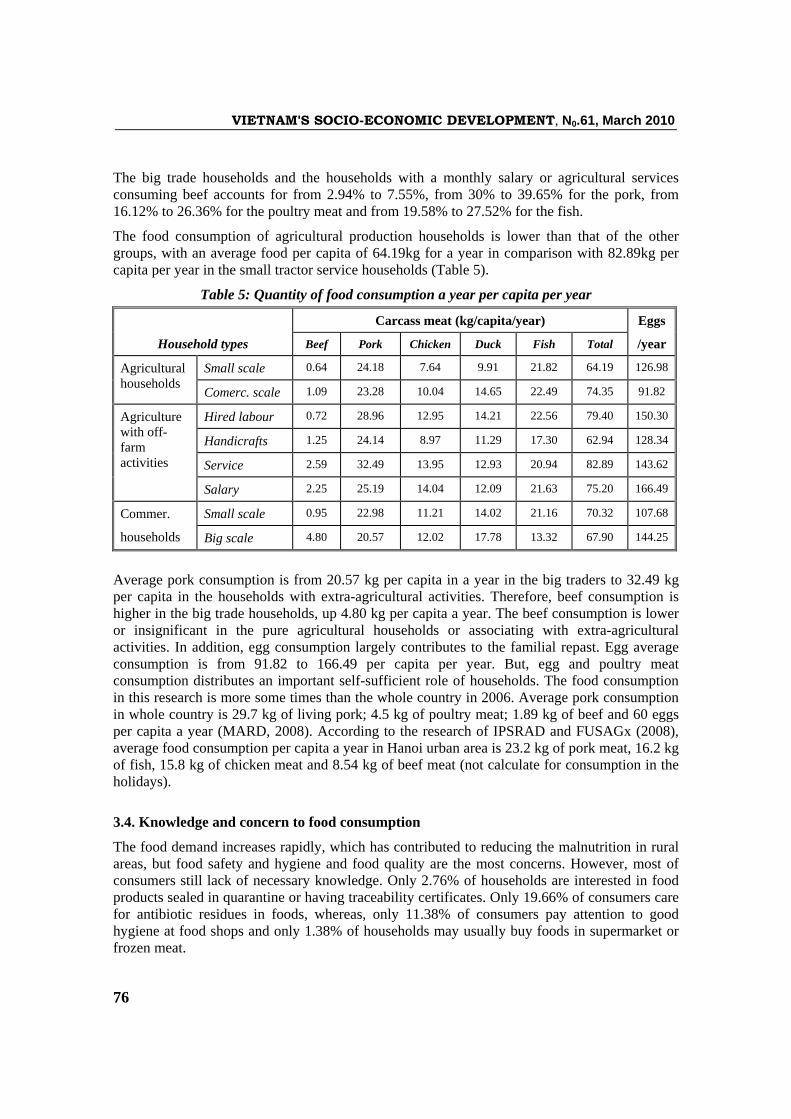
The big trade households and the households with a monthly salary or agricultural servicesconsuming beef accounts for from 2.94% to 7.55%, from 30% to 39.65% for the pork, from16.12% to 26.36% for the poultry meat and from 19.58% to 27.52% for the fish.
The food consumption of agricultural production households is lower than that of the othergroups, with an average food per capita of 64.19kg for a year in comparison with 82.89kg percapita per year in the small tractor service households (Table 5).
Table 5: Quantity of food consumption a year per capita per year
Carcass meat (kg/capita/year)
Household types Beef Pork Chicken Duck Fish Total
Eggs
/year
Small scale 0.64 24.18 7.64 9.91 21.82 64.19 126.98Agriculturalhouseholds
Comerc. scale 1.09 23.28 10.04 14.65 22.49 74.35 91.82
Hired labour 0.72 28.96 12.95 14.21 22.56 79.40 150.30
Handicrafts 1.25 24.14 8.97 11.29 17.30 62.94 128.34
Service 2.59 32.49 13.95 12.93 20.94 82.89 143.62
Agriculturewith off-farmactivities
Salary 2.25 25.19 14.04 12.09 21.63 75.20 166.49
Small scale 0.95 22.98 11.21 14.02 21.16 70.32 107.68Commer.
households Big scale 4.80 20.57 12.02 17.78 13.32 67.90 144.25
Average pork consumption is from 20.57 kg per capita in a year in the big traders to 32.49 kgper capita in the households with extra-agricultural activities. Therefore, beef consumption ishigher in the big trade households, up 4.80 kg per capita a year. The beef consumption is loweror insignificant in the pure agricultural households or associating with extra-agriculturalactivities. In addition, egg consumption largely contributes to the familial repast. Egg averageconsumption is from 91.82 to 166.49 per capita per year. But, egg and poultry meatconsumption distributes an important self-sufficient role of households. The food consumptionin this research is more some times than the whole country in 2006. Average pork consumptionin whole country is 29.7 kg of living pork; 4.5 kg of poultry meat; 1.89 kg of beef and 60 eggsper capita a year (MARD, 2008). According to the research of IPSRAD and FUSAGx (2008),average food consumption per capita a year in Hanoi urban area is 23.2 kg of pork meat, 16.2 kgof fish, 15.8 kg of chicken meat and 8.54 kg of beef meat (not calculate for consumption in theholidays).
3.4. Knowledge and concern to food consumption
The food demand increases rapidly, which has contributed to reducing the malnutrition in ruralareas, but food safety and hygiene and food quality are the most concerns. However, most ofconsumers still lack of necessary knowledge. Only 2.76% of households are interested in foodproducts sealed in quarantine or having traceability certificates. Only 19.66% of consumers carefor antibiotic residues in foods, whereas, only 11.38% of consumers pay attention to goodhygiene at food shops and only 1.38% of households may usually buy foods in supermarket orfrozen meat.

Vu Dinh Ton, Phan Dang Thang, B. Duquesne, P. Lebailly
77
Most of consumers rely upon an individual sensorial evaluation when deciding to buy food(32.76% of consumers). In addition, food price is always of great importance for determiningfood consumption. As a result, 29.66% of consumers always buy cheap products. Only 22.41%of consumers are interested in the origin of products. Up to 15.17% of consumers often buyfood based on close relationships with vendors. In fact, the food hygiene knowledge ofconsumers is still limited. The sick animal is mainly consumed or sold at low prices.
When epidemic diseases occur on animal flocks, around 41.38% of households don’t buyrelated foods because they are warned not to eat these products on the means of publicinformation. However, about 20.34% of households still consume these foods without vigilanceand 38.28% of households buy these products with more vigilance.
Because of food consumption habits and rural typical conditions, up to 73.10% of householdsonly accept fresh food consumption. Only 5.17% of consumers require the products with labelsor certificates of quarantine agencies. There are 12.41% of households requiring the productswhich must be packed and stored in cold chains. Therefore, there are 9.31% of consumers onlyconsuming the products of their own households, particularly with eggs, poultry and fish.
3.5. The self-sufficient level of food consumption
While beef, pork and tofu are mainly bought at kermis or vendors, eggs and poultry meatoccupy an important self-sufficient part in most of households, especially in agriculturalproduction households. The self-sufficient level with chicken occupies from 75.10% to 84.47%in these households. And the self-sufficient level with duck, Muscovy duck occupies over 74%in pure agricultural production households and 62% in the households with extra-agriculturalactivities.
The self-sufficient quantity of egg consumption in pure agricultural production householdsoccupies up 70.84% and occupies 62% in the households with extra-agricultural activities. As aresult, this quantity of egg is not important in trade households and households with monthlysalary.
In addition, fish products occupy also an important part in agricultural production households.The self-sufficient level with fish occupies from 21.25% to 33.48% in agricultural households atsmall scale and agricultural households with extra-agricultural activities. This level is especiallyhighest in agricultural production households at commercial scale, up 94%.
Therefore, the self-sufficient level with fish, eggs and poultry meat products is very important inhouseholds; and many households only consume their self fish and poultry. So, the smallagricultural production plays still an important role for supplying additional nutrition in manyrural households.
3.6. The expenditures of food consumption in households
In whole country, the proportion in expenditures for food consumption occupies 53.50% in2004 and 52.80% in 2006. In rural areas, this cost of food consumption occupies 50.20% in totalexpenditures for living (VLSS, 2007). These expenditures occupy about 58.5% in Hanoi urbanarea (IPSARD & FUSAGx, 2008). The total expenditures of food consumption occupy up to88.39% of total income in pure small agricultural production households. These expenditures
VIETNAM'S SOCIO-ECONOMIC DEVELOPMENT, N0.61, March 2010
78
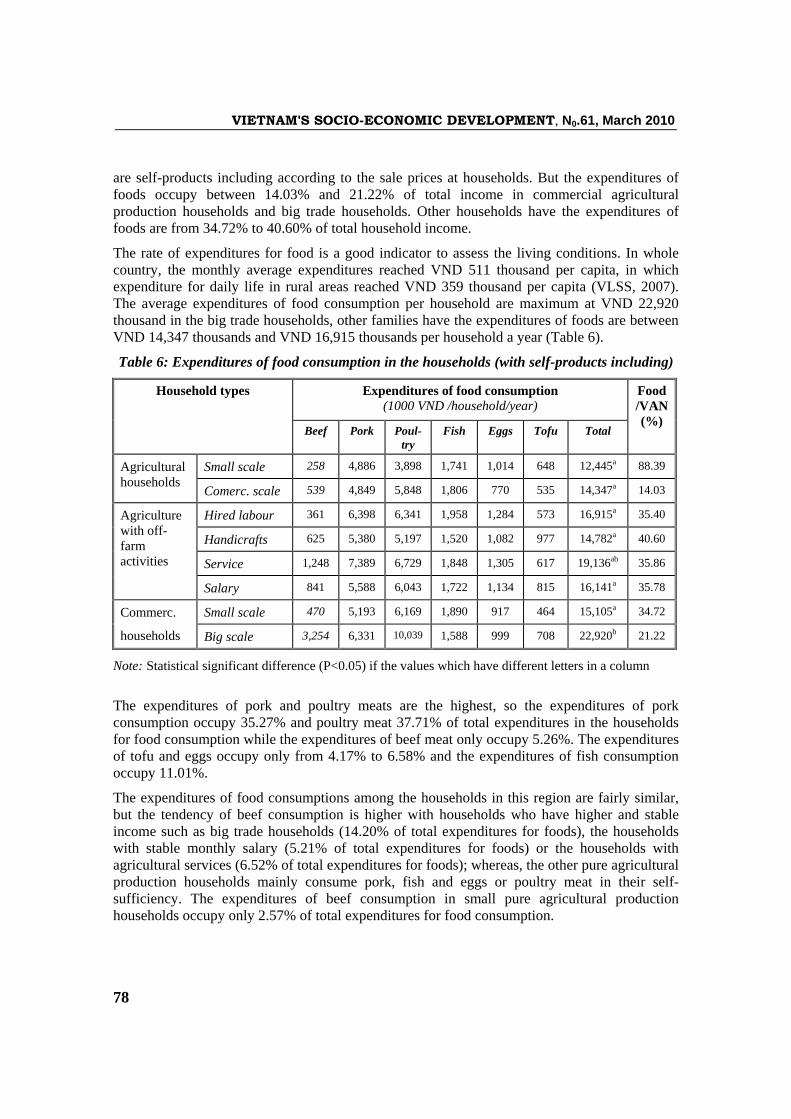
are self-products including according to the sale prices at households. But the expenditures offoods occupy between 14.03% and 21.22% of total income in commercial agriculturalproduction households and big trade households. Other households have the expenditures offoods are from 34.72% to 40.60% of total household income.
The rate of expenditures for food is a good indicator to assess the living conditions. In wholecountry, the monthly average expenditures reached VND 511 thousand per capita, in whichexpenditure for daily life in rural areas reached VND 359 thousand per capita (VLSS, 2007).The average expenditures of food consumption per household are maximum at VND 22,920thousand in the big trade households, other families have the expenditures of foods are betweenVND 14,347 thousands and VND 16,915 thousands per household a year (Table 6).
Table 6: Expenditures of food consumption in the households (with self-products including)
Expenditures of food consumption(1000 VND /household/year)
Household types
Beef Pork Poul-try
Fish Eggs Tofu Total
Food/VAN(%)
Small scale 258 4,886 3,898 1,741 1,014 648 12,445a 88.39Agriculturalhouseholds
Comerc. scale 539 4,849 5,848 1,806 770 535 14,347a 14.03
Hired labour 361 6,398 6,341 1,958 1,284 573 16,915a 35.40
Handicrafts 625 5,380 5,197 1,520 1,082 977 14,782a 40.60
Service 1,248 7,389 6,729 1,848 1,305 617 19,136ab 35.86
Agriculturewith off-farmactivities
Salary 841 5,588 6,043 1,722 1,134 815 16,141a 35.78
Small scale 470 5,193 6,169 1,890 917 464 15,105a 34.72Commerc.
households Big scale 3,254 6,331 10,039 1,588 999 708 22,920b 21.22
Note: Statistical significant difference (P<0.05) if the values which have different letters in a column
The expenditures of pork and poultry meats are the highest, so the expenditures of porkconsumption occupy 35.27% and poultry meat 37.71% of total expenditures in the householdsfor food consumption while the expenditures of beef meat only occupy 5.26%. The expendituresof tofu and eggs occupy only from 4.17% to 6.58% and the expenditures of fish consumptionoccupy 11.01%.
The expenditures of food consumptions among the households in this region are fairly similar,but the tendency of beef consumption is higher with households who have higher and stableincome such as big trade households (14.20% of total expenditures for foods), the householdswith stable monthly salary (5.21% of total expenditures for foods) or the households withagricultural services (6.52% of total expenditures for foods); whereas, the other pure agriculturalproduction households mainly consume pork, fish and eggs or poultry meat in their self-sufficiency. The expenditures of beef consumption in small pure agricultural productionhouseholds occupy only 2.57% of total expenditures for food consumption.

Vu Dinh Ton, Phan Dang Thang, B. Duquesne, P. Lebailly
79
Therefore, the food expenditures are very great compared with total income in small pureagricultural households, especially in the context of current economic crisis. An incomedisparity is wide between small agricultural households and others. As a result (Table 7), whilethe self-products occupy only 7.20% in total food expenditures at big trade households, but thislevel occupy from 17.93% at small pure agricultural households to 28.18% of total expendituresat commercial agricultural households.
Table 7: Expenditures of food consumption in the households(with self-products none including)
Expenditures of food consumption(1000 VND /household/year)
Household types
Beef Pork Poul-try
Fish Eggs Tofu Total
Self-prod.(%)
Small scale 258 4,886 2,449 1,324 707 648 10,290a 17.93Agriculturalhouseholds
Comerc. scale 539 4,849 4,090 96 414 535 10,523a 28.18
Hired labour 361 6,398 3,771 1,131 842 573 13,075a 24.10
Handicrafts 625 5,380 2,382 1,072 647 977 11,082a 25.37
Service 1,248 7,389 3,398 1,290 846 617 14,789a 23.59
Agriculturewith off-farmactivities
Salary 841 5,588 3,841 1,338 766 815 13,188a 18.32
Small scale 470 5,193 3,358 1,311 605 464 11,402a 24.65Commerc.
households Big scale 3,254 6,331 8,737 1,457 766 708 21,254b 7.20
Note: Statistical significant difference (P<0.05) if the values which have different letters in a column
Thus, the self-products in households play an important role. The expenditures of foodconsumption in households with self-products none including occupy only from 65.23% ofincome in small agricultural households. These expenditures occupy from 20.85% in tradehouseholds to 25.11% in agricultural households with extra-agricultural activities, but only9.75% of total income in commercial agricultural households. However, the current economiccrisis influenced greatly to small agricultural production households, but thanks to the self-sufficient food products, the rural areas could be passed these grave difficulties.
4. CONCLUSION
The household income is really diversified, so the agricultural production activities have stillever played an important role in most of households (occupying 82% of households). Thereremains a high disparity between big traders with higher income and small farmers with lowerincome, about 7.9 times. The rural areas play an important role, in this research thanks to theself-sufficiency of food in every household; this rural area could be against better the currenteconomic crisis. But agricultural income is very unsettled, so almost households have to seekextra-agricultural activities, up to 72% of households in these districts. These off-farm activitiesare principally concentrated in the field of manual labours. In order to sustainable development

VIETNAM'S SOCIO-ECONOMIC DEVELOPMENT, N0.61, March 2010
80
in the next years, it is necessary to supply the good scientific knowledge or good practicalagricultural production to farmers.
The tastes of food consumption are mainly fresh products and the decision to buy the products isbased on their sense organs. However, the living standards about food consumption inhouseholds are really high, but the sick animal is popularly consumed in the households. So it isnecessary to establish a network of food supply chains with good traceability. The average levelof food consumption per capita per year is between 62.94 kg to 82.89 kg, so the principal foodsare pork, poultry meat and fish. The beef consumption is little and there is a high disparitybetween the households with lower and higher income. The eggs and poultry meat of self-sufficiency still plays an important role.
The expenditures of food consumption with self-products none including occupy up to 65.23%of total income in the small agricultural production households, while other families with off-farm activities occupy from 9.75% to 25.11% of total income. Or almost income in households,about 21% of small agricultural households, is reserved for food consumption.
REFERENCES
• GSO - General Statistical Office (2002). Vietnam Living Standards Survey. Statisticalpublishing house. Hanoi, Vietnam.
• GSO - General Statistical Office (2007). Results of the 2006 rural, agricultural and fisherycensus. General statistical office. Statistical publishing house, Hanoi, Vietnam.
• GSO - General Statistical Office (2008). Statistical yearbook of Vietnam. StatisticPublishing House. Hanoi, Vietnam.
• Figuié M. and Bricas N. (2003). L’évolution de la consommation alimentaire. Marchéalimentaire et développement agricole au Vietnam. Malica, Novembre 2003.
• IPSARD – FUSAGx (2008). Rapport d’enquête de consommation de volaille sur le marchéà Hanoi. Projet de Coopération bilatérale Vietnam – Wallonie.
• MARD - Ministry of Agriculture and Rural Development (2008). Strategies of livestockproduction development up to 2020. Agricultural Publishing House. Hanoi, Vietnam.
• Nguyen Duc Truyen (2003). Alimentations et productions paysannes. Le cas du village deMong Phu dans la région périurbaine de Hanoi. Malica, Hanoi, Vietnam.
• Phan Dang Thang (2007). Report of field study of GRIPAVI project. CIRAD Vietnam andCentre for Interdisciplinary for Rural Development. Hanoi, Vietnam.
• Statistical Office of Chuong My District (2007). Results of the 2006 rural, agricultural andfishery census of Chuong My District.
• Statistical Office of Phu Xuyen District (2007). Results of the 2006 rural, agricultural andfishery census of Phu Xuyen District.