analysis of reinforced revetment slope of sargent beach
TRANSCRIPT

Miscellaneous Paper GL-97-4 March 1997
US Army Corps of Engineers Waterways Experiment Station
Analysis of Reinforced Revetment Slope of Sargent Beach Erosion Protection Project on the Gulf Intracoastal Waterway
by Ronald E. Wahl, John F. Peters, Kris McNamara, WES Ira Brotman, Galveston District
Approved For Public Release; Distribution Is Unlimited
i*U ^fcii
mim w Prepared for U.S. Army Engineer District, Galveston

The contents of this report are not to be used for advertising, publication, or promotional purposes. Citation of trade names does not constitute an official endorsement or approval of the use of such commercial products.
The findings of this report are not to be construed as an official Department of the Army position, unless so desig- nated by other authorized documents.
® PRINTED ON RECYCLED PAPER

DISCLAIMS! Nona
TfflS DOCUMENT IS BEST
QUALITY AVAILABLE. THE COPY
FURNISHED TO DTIC CONTAINED
A SIGNIFICANT NUMBER OF
COLOR PAGES WHICH DO NOT
REPRODUCE LEGIBLY ON BLACK
AND WHITE MICROFICHE.

Miscellaneous Paper GL-97-4 March 1997
Analysis of Reinforced Revetment Slope of Sargent Beach Erosion Protection Project on the Gulf Intracoastal Waterway by Ronald E. Wahl, John F. Peters, Kris McNamara
U.S. Army Corps of Engineers Waterways Experiment Station 3909 Halls Ferry Road Vicksburg, MS 39180-6199
Ira Brotman
U.S. Army Engineer District, Galveston P.O. Box 1229 Galveston, TX 77553-1229
Final report Approved for public release; distribution is unlimited
Prepared for U.S. Army Engineer District, Galveston P.O. Box 1229, Galveston, TX 77553-1229

US Army Corps of Engineers Waterways Experiment Station
HEADQUARTERS SUU3MG
ENTRANCE
ENVMONMENTAL LABORATORY
FOR INFORMATION CONTACT: PUBLIC AFFAIRS OFFICE U.S. ARMY ENGINEER WATERWAYS EXPERIMENT STATION 3909 HALLS FERRY ROAD VICKSBURG. MISSISSIPPI 39180-6199 PHONE: (601) 634-2502
AREAV*RESERVAT«»! ■ Mut«
Waterways Experiment Station Cataloging-in-Publication Data
Analysis of reinforced revetment slope of Sargent Beach Erosion Protection Project on the Gulf Intracoastal Waterway / by Ronald E. Wahl ... [et al.] ; prepared for U.S. Army Engineer District, Galveston. 54 p.: ill.; 28 cm. — (Miscellaneous paper; GL-97-4) Includes bibliographic references. 1. Sargent (Tex.) 2. Beach erosion — Texas. 3. Shore protection — Texas. 4. Coastal
zone management. I. Wahl, Ronald E. II. United States. Army. Corps of Engineers. Galveston District. III. U.S. Army Engineer Waterways Experiment Station. IV. Geotechnical Laboratory (U.S. Army Engineer Waterways Experiment Station) V. Series: Miscellaneous paper (U.S. Army Engineer Waterways Experiment Station); GL-97-4. TA7 W34m no.GL-97-4

Contents
Preface iv
Conversion Factors, Non-SI to SI Units of Measurement v
1—Introduction 1
Background 1 Purpose 2 Scope 2
2—Site Conditions and Construction Sequences 4
Idealized Soil Profile 4 Construction Sequence . 4
3—Analysis 6
UTEXAS3 6 STUBBS 7 Finite Element Model 7 Analysis of Unreinforced Section 8
UTEXAS3 analysis 8 Finite element analysis 8
Analysis of Reinforced Slopes 9 UTEXAS3 analysis 9 Finite element analysis 10 Lateral displacement 10 Vertical displacement 11 Reinforcement force 11 Analysis of pullout resistance 12 Reinforcement performance 12
4—District Comments 13
5—Conclusions 14
References 15
Figures 1-31
Tables 1-5
SF298
HI

Preface
This report describes the finite element and slope stability analyses used for the design of the reinforced revetment slope for the Sargent Beach Ero- sion Protection Project. Funding for this project was provided by the U.S. Army Engineer District, Galveston (CE-SWG), and the Directorate of Research and Development, Headquarters, U.S. Army Corps of Engineers, through the Civil Works Research and Development (CWR&D) Soils Pro- gram work unit entitled "Design of Earth Structures with Reinforcement." STUBBS, the computer program used for the finite element analysis, was developed by Dr. John F. Peters, U.S. Army Engineer Waterways Experi- ment Station (WES), Geotechnical Laboratory (GL), Soil Research Facility (CEWES-GS-GC), Soil and Rock Mechanics Division, under the Repair, Evaluation, Maintenance, and Rehabilitation (REMR) Research Program work unit entitled "Allowable Deformation of Earth Structures" and the CWR&D Soils work unit entitled "Large Deformation of Soils."
The analysis of the reinforced slope at the Sargent Beach Erosion Protec- tion Project was performed at WES by Mr. Ronald E. Wahl, and Dr. John F. Peters, GS-GC. Ms. Kris McNamara, GS-GC, provided valuable assistance with the computer graphics employed for many of the figures used in this report. Mr. Ira Brotman, CE-SWG, provided input pertaining to the site characterization and assisted in the slope stability and finite element analyses. The work was accomplished under the general direction of Mr. David Bennett, Chief, GS-GC, and Dr. Don C. Banks, Chief, Soil and Rock Mechanics Division, and Dr. William F. Marcuson HI Chief, GL.
Dr. Robert W. Whalin was Director of WES and COL Bruce K. Howard, EN, was Commander at the time of the publication of this report.
The contents of this report are not to be used for advertising, publication, or promotional purposes. Citation of trade names does not constitute an official endorsement or approval of the use of such commercial products.
IV

Conversion Factors, Non-SI to SI Units of Measurement
Non-SI units of measurement used in this report can be converted to SI units as follows:
Multiply By To Obtain
degrees (angle) 0.01745329 radians
feet 0.3048 meters
inches 25.4 millimeters
kip-feet 1355.818 newton-meters
kips (force) per square foot 47.88026 kilopascals
kips (force) per square inch 6.894757 kilopascals
miles (U.S. nautical) 1.852 kilometer
pounds (force) per linear foot 14.5939 newtons per meter
pounds (force) per square foot 47.88026 pascals
pounds (force) per square inch 0.006894757 megapascals
pounds (mass) per cubic foot 16.01846 kilograms per cubic meter

1 Introduction
Background
The Gulf Intracoastal Waterway (GIWW) is located along the gulf coast of Texas and serves as a passageway for barge and ship traffic' which carry goods and commodities to and from ports and harbors located along the east coast. The GIWW was designated as part of the national inland waterway system by the Revenue Act of 1978. As such, the U.S. Army Engineer Galveston District (CE-SWG) is responsible for the design and maintenance of the GIWW.
Erosion is a particular problem faced by the CE-SWG in maintaining the GIWW. Specifically, in a particular 8-mile segment near Sargent Beach the width of the land barrier has decreased to between 600 and 900-ft. The ero- sion rate in this segment has been observed to be between 25 and 36 ft per year. Thus, the CE-SWG is involved in the design of an erosion barrier to ensure that the GIWW will be protected from erosion. The location of the Sargent Beach Erosion Protection Project is shown in Figure 1.
The erosion control project will consist of the construction of a structural barrier which is approximately 8-miles (42,000 ft) long. The barrier will be placed 300-ft seaward and parallel to the GIWW. This width will save as much land as possible yet allow construction landward of the tidal range. The top elevation of the barrier was established at Elevation +7 to provide protection slightly above the top of the existing ground which is at approxi- mate Elevation +5. The top elevation also corresponds closely with the surge elevation having a frequency of once every 10-years.
The type of structural barrier depends upon the subsurface conditions along the alinement of the GIWW. The current design plans allow for 36,600 ft of precast concrete revetment block and 5,440 ft of precast sheet- pile wall. The precast concrete revetment block will be along segments where the foundation conditions are strong enough to support the weight of the blocks. In these sections the block will be placed on 2-ft blanket stone (0.5 - 200 lb). The blanket stone will be placed on an excavated and pre- pared slope of IV : 2.5H. The prestressed precast sheetpile wall is planned for use in stretches having weak foundation conditions. The design process required that piles must be 16-in. thick and 40-ft long to resist the maximum bending stresses. The piles will be composed of Type II or Type III
Chapter 1 Introduction

concrete. The reinforcement is to be ASTM A 615, Grade 60, and will be epoxy coated to resist corrosion. Pretension strands will be ASTM A 41, Grade 270k. Pile joints will be grouted to prevent the loss of fill through the joints.
In their cost analysis, CE-SWG determined that the construction of the sheetpile wall was an expensive design option for this project. Thus, they sought a less expensive alternative that would still meet the project require- ments. The potential for significant savings exists if the sheetpile wall is replaced by precast revetment blocks placed on an excavated slope of IV: 8H. A cross-sectional view of this design option is presented in Figure 2. The design calls for the placement of geosynthetic reinforcing material to provide additional stability to the slope.
Purpose
The CE-SWG tasked the Waterways Experiment Station (WES) to per- form a finite element analysis to aid in the design of the reinforced slope faced with the concrete revetment blocks. The finite element method has the ability of simulating the construction process and predicting the behavior at different stages in the construction process.
In this study, the principal objective of the finite element analysis was to provide insight toward evaluating whether or not the predicted behavior of the slope would meet the project requirements. The direction and magnitude of foundation movements and forces in the reinforcement at different stages of construction were key items of information sought from the study. The effect of reinforcement stiffness on the slope's predicted performance was evaluated as part of this study to assist the designers in the selection of an appropriate reinforcing material. All analysis reported herein were per- formed under total stress and undrained conditions. These results were applicable to the short-term performance of the embankment.
Scope
The report is divided into five chapters including the introductory com- ments included in this part of the report. Chapter 2 contains presentations of the idealized soil profile and foundation conditions presumed to exist beneath the reinforced slope. The soil profile was drawn up by CE-SWG based on their subsurface investigation. Chapter 2 also contains a discussion of the sequence of construction activities simulated in the finite element analysis. Chapter 3 has a discussion of the analytical procedures used in this study. These include a limit equilibrium analysis using UTEXAS3 and the finite ele- ment analysis using STUBBS. The results of analysis involving the unrein- forced cross-section and the effect of stiffness on the reinforced cross-section are also presented in Chapter 3. Some comments on the construction of the
Chapter 1 Introduction

project provided by the CE-SWG are included in Chapter 4. Finally, the conclusions drawn from this study are documented in Chapter 5.
Chapter 1 Introduction

2 Site Conditions and Construction Sequences
Idealized Zoil Profile
The idealized soil profile used in the analysis of the reinforced slope is presented in Figure 3. This profile was developed by CE-SWG based on the results of a subsurface investigation conducted during 1991-92 in the stretches where weak foundation soils occurred. All properties are consistent with those required for a total stress analysis representing the short-term or undrained conditions. The material properties needed for the analysis include the unit weight and undrained shear strength of each soil layer in the profile. Field vane shear and laboratory Q-tests were conducted to determine the undrained shear strength of each soil layer. The undrained shear strengths of each layer in the profile were conservatively selected based on an analysis of these data.
The idealized soil profile was made up of four layers. The top layer was described as consisting of a medium clay which extended from Elevation +5 ft to Elevation 0 ft. The second layer was a soft clay having an undrained shear strength of 290 psf and extending from Elevation 0 ft to Ele- vation -4 ft. The third layer was described as a very soft clay (probably normally consolidated) which had an undrained shear strength of 130 psf and extended from Elevation - 4 ft to Elevation - 24 ft. Subsequent analysis showed that this layer had a pronounced effect on the predicted performance of the reinforced slope because of its extremely low strength. This was underlain by a medium clay which had an undrained shear strength of 600 psf and extended from Elevation - 24 ft to unknown depth.
Construction Sequence
Details of the construction steps must be known to accurately model the performance of the reinforced revetment slope. CE-SWG has planned the construction to be carried out in six basic phases as shown in Figure 4.
Chapter 2 Site Conditions and Construction Sequences

PHASE 1. Figure 4 shows that the construction was initiated by making an excavation of 6-ft depth to Elevation - 1 ft. This excavation was made by removing the medium clay of Layer 1 and the upper foot of the soft clay of layer 2. This cut was necessary for the placement of the reinforcement. A sump pump was used to keep the excavation dry since the bottom is below the groundwater table.
PHASE 2. The reinforcement was placed at the base of the initial exca- vation (Elevation - 1 ft) and the initial excavation was backfilled with a com- pacted clay as shown in Figure 4. The compacted clay provided the ballast (normal load) necessary for developing the pullout resistance of the geo- synthetic reinforcement. The reinforcement provided additional stability to the excavated slope as the construction progresses.
PHASE 3. The remainder of the required excavation was completed to Elevation - 9.5 ft as shown in Figure 4. The slope of the excavation is 1 V:8H. The excavation removed the soft clays of Layer 2 and the very soft clay of Layer 3 down to Elevation - 9.5 ft. The cut will be flooded as the excavation progresses.
PHASE 4. Blanket stone will be placed along the slope of the excavation. The blanket stone will support the revetment blocks placed during Phase 5. The blanket stone were placed to a thickness of 24-in. along the surface of the slope and to a thickness of 18-in. above the compacted fill at the top of the excavation.
PHASE 5. The toe block and toe stone were placed at the bottom of the slope upon and adjacent to the blanket stone, respectively. The precast revetment blocks are then placed upon the blanket stone.
PHASE 6. Lastly, the construction was completed by placing the core stone and backfilling the excavation. This backfill will eventually erode away since it was placed on the Gulf side of the revetment stone.
Only Phases 1 through 5 were modeled in this study. The simulation of the construction of the reinforced revetment slope will be discussed in the next part of this report. The critical time for stability during construction was after the fifth phase because the excavation had attained its greatest depth and because the foundation soils were fully loaded by the surcharge placed on the slope by the weight of the blanket stone and revetment block. The long-term stability of the revetment slope was not evaluated as part of this sjudy.
Chapter 2 Site Conditions and Construction Sequences

3 Analysis
The analysis of the reinforced slope was performed using both limit equilibrium and finite element methods. Total stress analyses were per- formed to evaluate the short-term stability of the slope. The cross-section of Figure 2 was analyzed both with and without reinforcement. Limit equili- brium calculations were performed with the slope stability program UTEXAS3 (Edris, and Wright 1993). The finite element analysis was performed with the program STUBBS (Peters, Wahl, Meade 1996). The finite element method offers the advantage of accounting for nonlinear soil behavior and the stiffness of the reinforcement and provides the designer with information about stresses and movements in the slope and foundations soils. However, the limit equilibrium offers the more conventional approach (Koerner 1991) and is useful because it provides a check on the finite ele- ment method, is relatively easy to use, and has features which allow its use in the design of reinforced slopes and embankments. Descriptions of the computer codes, computer models, analyses, and results are described in the following sections of this report.
UTEXAS3
UTEXAS3 is a general purpose program for evaluating the stability of embankments and slopes. Basically, the program uses Spencer's method to compute the factor of safety with respect to sliding for specified geometries and soil strengths. The program includes an option for including the effect of the force provided by a reinforcing element on the factor of safety.
In this study, UTEXAS3 was used to determine the safety factor of the unreinforced section and also determine the amount of force the reinforce- ment must supply to bring the system to equilibrium if the unreinforced safety factor is less than one. The cross-section and properties used in this analysis are shown in Figure 5. The effect of submergence was modeled with a piezometric line at Elevation + 1 ft and by the application of surface pressures on the slope at locations below Elevation + 1 ft.
6 Chapter 3 Analysis
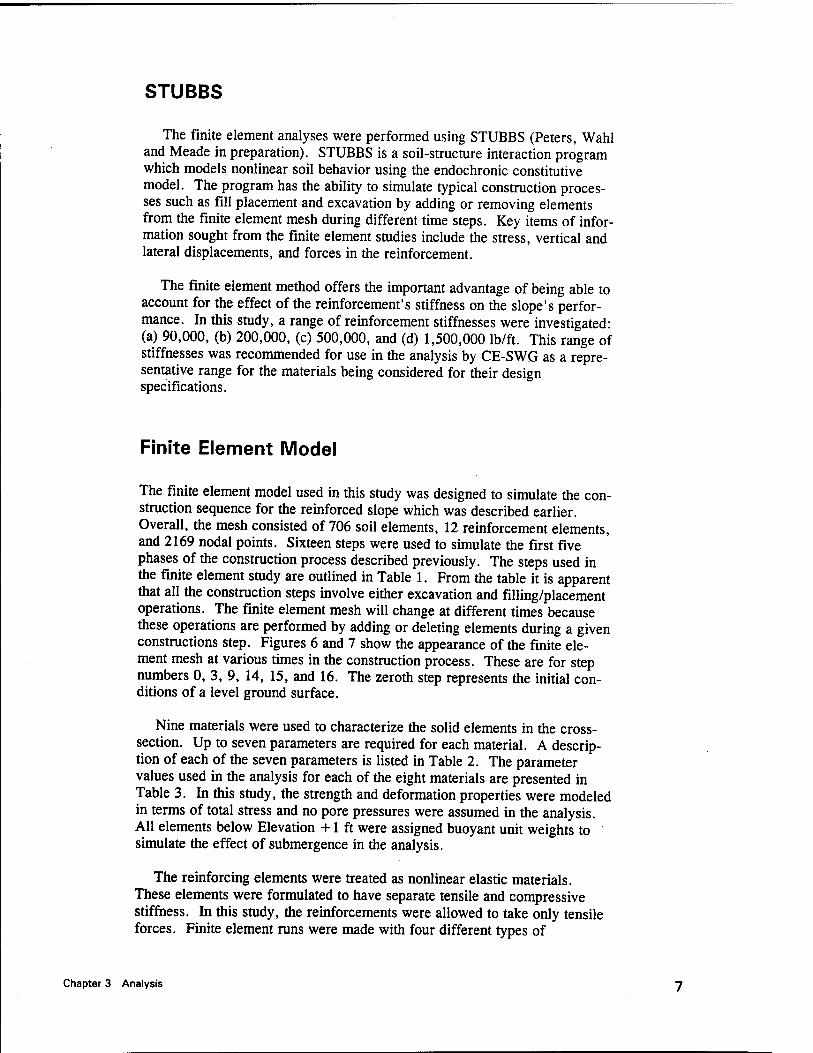
STUBBS
The finite element analyses were performed using STUBBS (Peters, Wahl and Meade in preparation). STUBBS is a soil-structure interaction program which models nonlinear soil behavior using the endochronic constitutive model. The program has the ability to simulate typical construction proces- ses such as fill placement and excavation by adding or removing elements from the finite element mesh during different time steps. Key items of infor- mation sought from the finite element studies include the stress, vertical and lateral displacements, and forces in the reinforcement.
The finite element method offers the important advantage of being able to account for the effect of the reinforcement's stiffness on the slope's perfor- mance. In this study, a range of reinforcement stiffnesses were investigated: (a) 90,000, (b) 200,000, (c) 500,000, and (d) 1,500,000 lb/ft. This range of stiffnesses was recommended for use in the analysis by CE-SWG as a repre- sentative range for the materials being considered for their design specifications.
Finite Element Model
The finite element model used in this study was designed to simulate the con- struction sequence for the reinforced slope which was described earlier. Overall, the mesh consisted of 706 soil elements, 12 reinforcement elements, and 2169 nodal points. Sixteen steps were used to simulate the first five phases of the construction process described previously. The steps used in the finite element study are outlined in Table 1. From the table it is apparent that all the construction steps involve either excavation and filling/placement operations. The finite element mesh will change at different times because these operations are performed by adding or deleting elements during a given constructions step. Figures 6 and 7 show the appearance of the finite ele- ment mesh at various times in the construction process. These are for step numbers 0, 3, 9, 14, 15, and 16. The zeroth step represents the initial con- ditions of a level ground surface.
Nine materials were used to characterize the solid elements in the cross- section. Up to seven parameters are required for each material. A descrip- tion of each of the seven parameters is listed in Table 2. The parameter values used in the analysis for each of the eight materials are presented in Table 3. In this study, the strength and deformation properties were modeled in terms of total stress and no pore pressures were assumed in the analysis. All elements below Elevation +1 ft were assigned buoyant unit weights to simulate the effect of submergence in the analysis.
The reinforcing elements were treated as nonlinear elastic materials. These elements were formulated to have separate tensile and compressive stiffness. In this study, the reinforcements were allowed to take only tensile forces. Finite element runs were made with four different types of
Chapter 3 Analysis

reinforcements having stiffnesses of 90,000, 200,000, 500,000, and 1,500,000 lb/ft to evaluate the effect of different reinforcements on the performance of the slope.
Analysis of Unreinforced Section
UTEXAS3 analysis
A conventional slope stability analysis was performed to evaluate the safety factor of the unreinforced section, FSU. Knowledge of FSU is impor- tant in understanding the significance of the reinforcement in the stability of the slope. If FSU is less than one than the slope's stability depends entirely on the ability of the reinforcement to carry any force deficiency necessary to keep the system in equilibrium. This force deficiency is caused by the inabil- ity of the foundation soils to carry the design loads. On the other hand, if FSU is greater than one, then the reinforcement becomes a secondary defense against a slide and its purpose is to guard against uncertainty in the foun- dation strengths or other factors which may threaten the stability of the slope.
A model of the slope used in the UTEXAS3 analysis is shown in Fig- ure 5. The analysis was performed using the UTEXAS3 search options for both circular and noncircular (wedge shaped failure surfaces. Safety factors were computed for three separate stages in the construction sequence. These stages include the time (a) when the excavation has been just completed to Elevation -9.5 ft (Step Number 14), (b) just after placement of the concrete revetment blocks at the end of construction (Step Number 15, and (c) just after placement of the concrete revetment blocks at the end of construction (Step Number 16). The results are shown in Figure 8. Significantly, this plot also shows that the critical wedges had lower safety factors than the critical circles for each of the three construction steps analyzed. Thus, the wedge shaped failure surface is the critical failure mechanism for this prob- lem. For the wedges, Figure 8 shows that the safety factor for the unrein- forced slope will decrease from about 1.52 to 1.33 as the slope is loaded with the blanket stone. The safety factor finally decreases to 0.923 after the revetment block is placed. The analysis shows that the reinforcement is absolutely essential in providing stability for this combination of geometry and foundation strength since the critical wedge has a safety factor which is less than one. Additionally, this lack of stability is controlled by the very soft clay layer (Layer 3) which had an undrained shear strength of 130 psf.
Finite element analysis
A finite element analysis was performed to evaluate the projected perfor- mance of the unreinforced section and to establish a link to the limit equili- brium analysis performed with UTEXAS3. This link is essential to tuning the interpretations of both the finite element and limit equilibrium calculations.
8 Chapter 3 Analysis

The results of the finite element analysis for the unreinforced case are presented in Figures 10, 11, and 12 which represent the results of construc- tion step numbers 14, 15 and 16, respectively. Displacement vectors (show- ing the relative magnitude of movement and direction) for each nodal point are shown in each plot. The color in each figure shows the mobilized shear stress expressed as a percentage of the failure stress. In the figures, ele- ments which are red have mobilized all of the available shear strength and have no reserve strength remaining.
Figure 10 shows that at Step Number 14 (after the excavation is com- pleted to Elevation -9.5 ft) only a small portion of the elements have fully mobilized their available shear strength. Figure 11 shows that at Step Num- ber 15 that the displacements increase (especially in the very soft clay layer) and that a greater number of elements have fully mobilized the available shear strength due to the increased load imposed by the stone blanket. The contours indicate that a failure surface is beginning to mobilize as indicated by the numerous elements colored red at the bottom of the very soft clay layer. Figure 12 shows that after completion of Step Number 16 the unrein- forced slope has failed because a contiguous group of elements have mobi- lized all of their available shear strength. These elements are mainly located in the very soft weak clay which had an undrained shear strength of 130 psf. Additionally, the finite element solution did not converge on the sixteenth step which is another sign that the slope had failed.
The finite element results discussed in the previous paragraph are very similar to the results from the UTEXAS3 analysis. First, both methods predict that the slope will fail during the time when the revetment block is placed (Step Number 16). Secondly, the displacement vectors in Figure 12 show that the failure surface is a wedge located approximately in the same location as the critical wedge in the UTEXAS3 analysis (See Figure 8). These results show that the finite element solution is in good agreement with the UTEXAS3 results.
Analysis of Reinforced Slopes
UTEXAS3 analysis
The analysis of the unreinforced section revealed that the unreinforced safety factor (FSU) of the slope at the end of construction was less than one (FSU = 0.923). This result indicates that there is a force imbalance between the driving and resisting forces which will cause the slope to be unstable at this point in the construction process. The magnitude of this force deficiency will be the minimum force which the reinforcement must supply to maintain the slope's equilibrium. This force will be the value required to increase the safety factor of the slope to one.
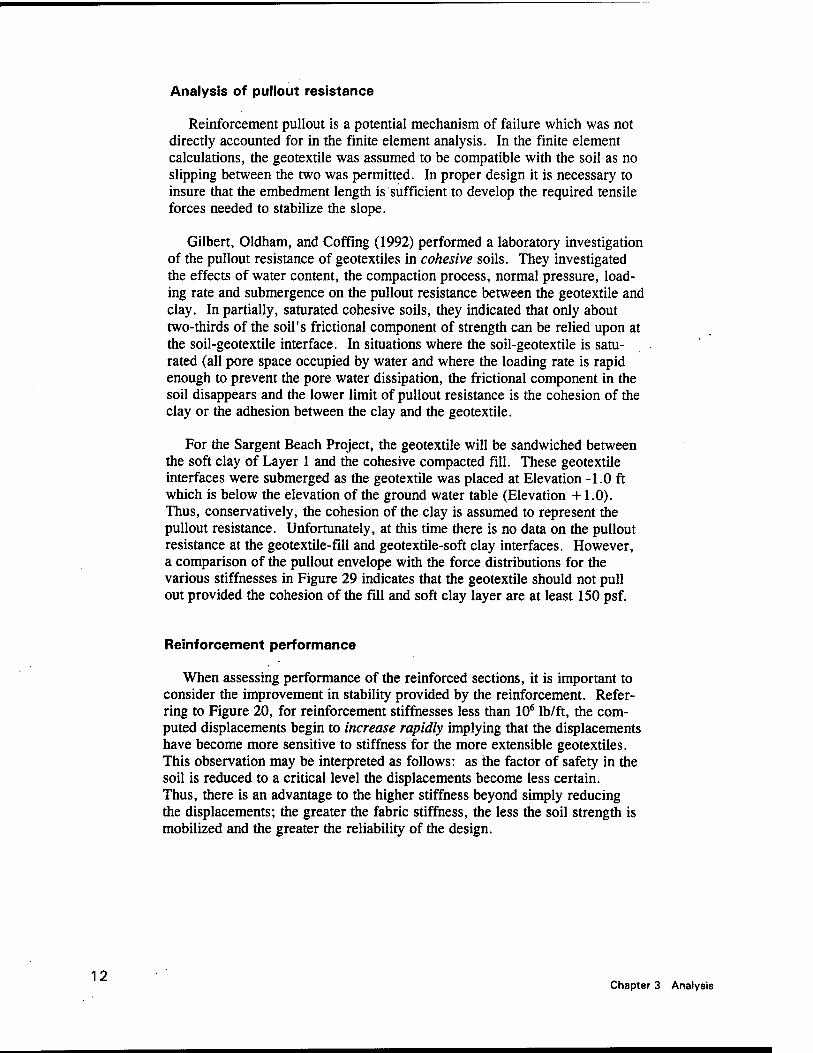
This minimum reinforcement force was calculated with UTEXAS3 using the program's reinforcement options. Various values of reinforcement forces were specified as input to UTEXAS3. The forces in the reinforcement were
Chapter 3 Analysis

assumed to act in line with the orientation of the reinforcement. The critical wedge of Figure 9 was used as a failure surface and the safety factor was computed. The results of these calculations are given in Table 4 and are plotted in Figure 12. Figure 12 shows that a force of about 2700 lb/ft will be required to increase the safety factor from 0.923 to 1.0.
Finite element analysis
As mentioned previously, one of the principal objectives of the finite ele- ment method for this study was to evaluate the effect of stiffness on the expected performance of the slope. Four different stiffnesses having values of 90,000, 200,000, 500,000, and 1,500,000 lb/ft were used in the analysis. A separate finite element run was made for each case. Except for the pre- sence of the reinforcement the finite element runs were made in an identical manner as that described earlier for the unreinforced slope. The following paragraphs describe the results of these runs. Key information sought in these runs included lateral displacements, vertical displacements, and the distribution of forces in the reinforcement.
Lateral displacement
Lateral displacement profiles from three separate locations were gathered from the finite element solutions. Figure 14 shows these locations were at sections 12 ft landward of the centerline (at the top of the slope at X = -12 ft), 8 ft to the gulf side of the centerline (at midslope at X = 38 ft) and 96 ft to the gulf side of the centerline (at the toe of the excavation at X = 96 ft).
The lateral displacement profiles for stiffnesses of 90,000, 200,000, 500,000, and 1,500,000 lb/ft are shown in Figures 15 through 18, respec- tively. In each figure, the top (X = -12 ft), midslope (X = 38 ft), and toe (X = 96 ft) profiles are presented in the left, center, and right plots, respec- tively. Each plot shows data for the fourteenth, fifteenth, and sixteenth con- struction steps. These plots show that generally lateral displacements increase markedly during the sixteenth construction step at which time the revetment blocks were placed on the slope.
Figures 19 and 20 contain plots which compare the effect of varying stiff- nesses on the lateral displacements at the end of the sixteenth construction step. The displacement profiles for the top, midslope, and toe locations dur- ing the sixteenth construction step are presented in Figure 19. Plots of the peak lateral displacement in the midslope profile plotted against reinforce- ment stiffness are presented in Figure 20. The data in these two figures clearly show that the lateral displacements decrease as the stiffness of the reinforcement increases.
10 Chapter 3 Analysis

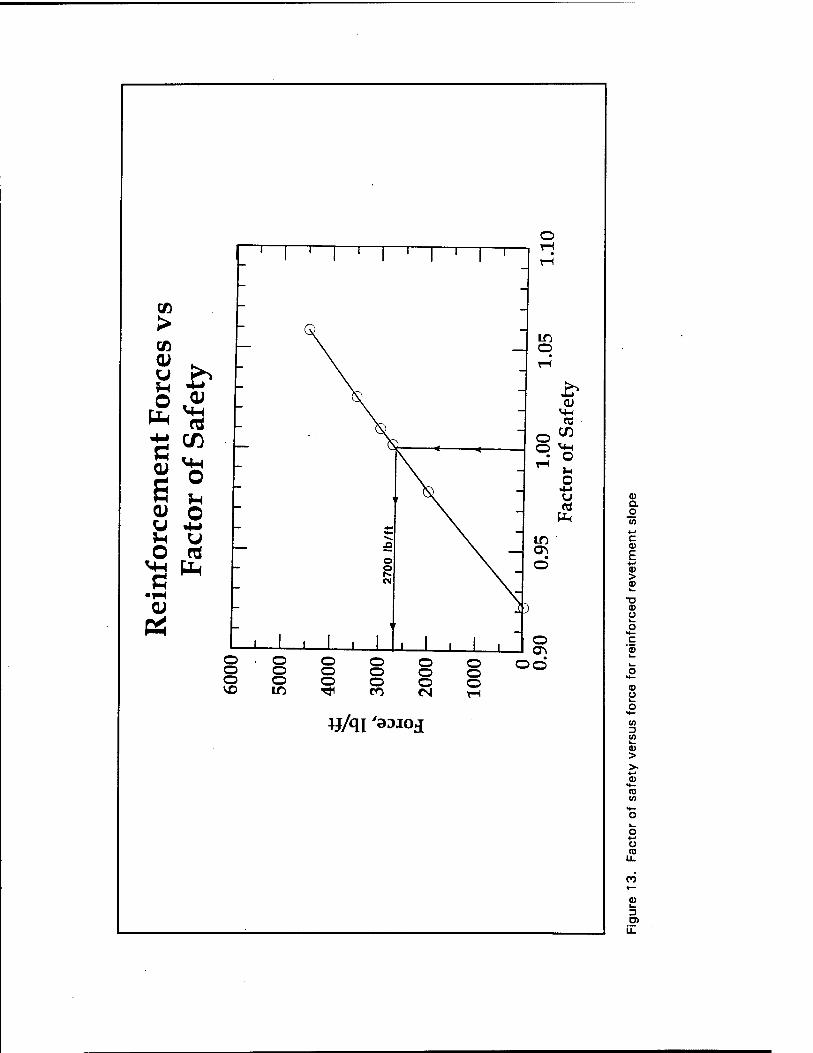
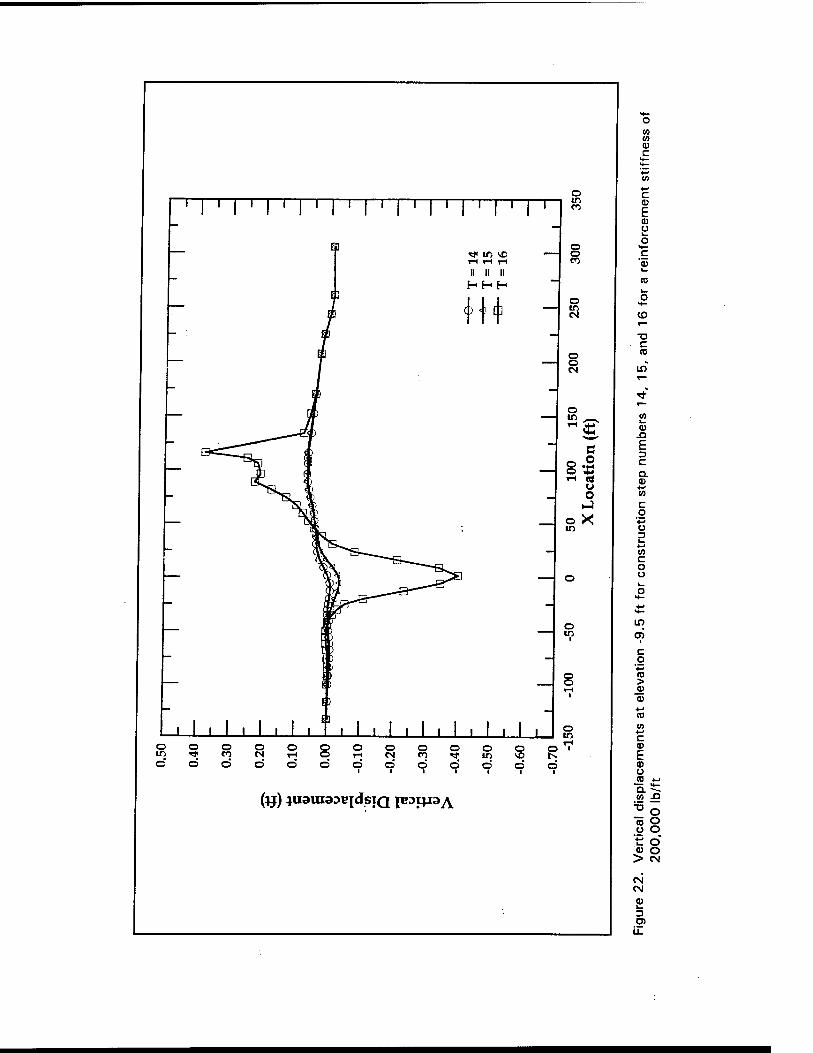
Vertical displacements
The vertical displacements of all nodal points located at elevation -9.5 ft were compiled from the finite element solution. This elevation is the level of the bottom of the excavation after the sixteenth construction step. Plots of the vertical settlement distribution at this level for reinforcement stiffnesses of 90,000, 200,000, 500,000, and 1,500,000 lb/ft are presented in Fig- ures 21 though 24, respectively. Each plot shows the information obtained from data for the fourteenth, fifteenth, and sixteenth construction steps. As was the case for lateral displacements, the vertical displacements increase sharply during the sixteenth step when the revetment blocks are placed on the slope. In general, for each stiffness, the plots show that the maximum down- ward (negative) vertical displacement occurs near the project centerline (X = 0 ft). Heave (positive upward movement) begins near midslope (X = 38 ft) and increases to a maximum at the base of the excavation between X = 96 and 115 ft. Additionally, comparison of the data in Figures 21 through 24 after the sixteenth construction step shows that the vertical displacement decreases as the stiffness of the reinforcement increases.
Reinforcement forces
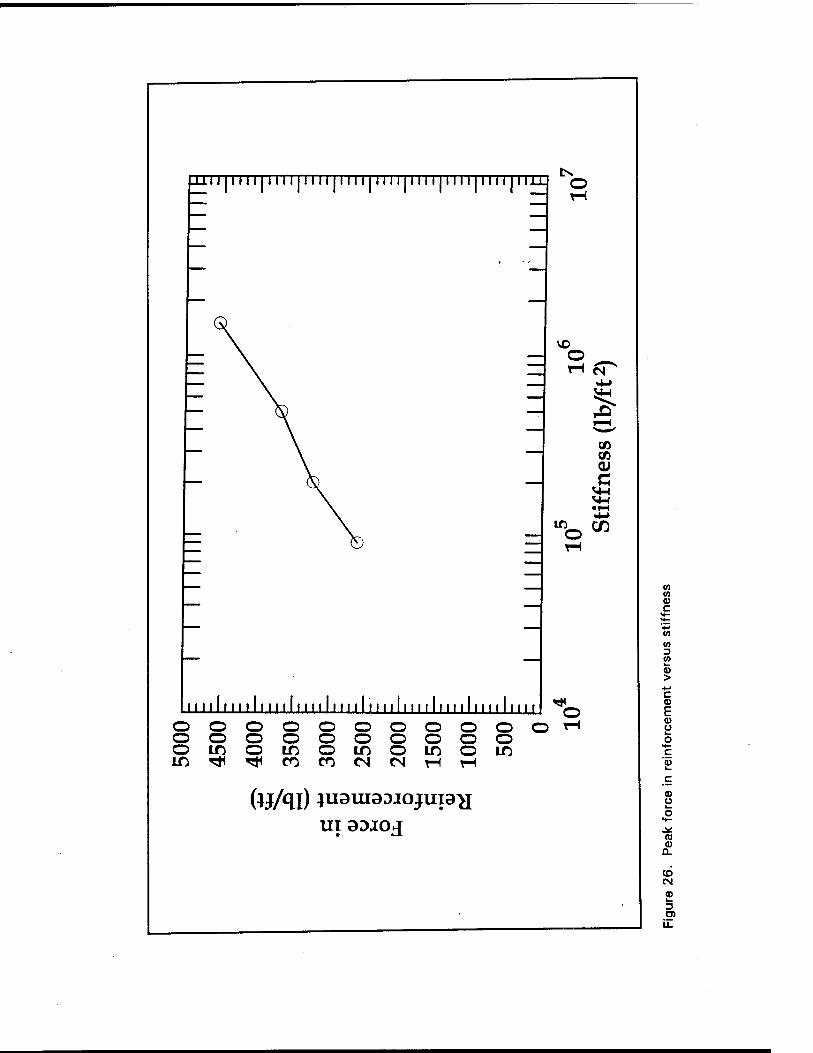
The force distributions in the reinforcements were calculated as part of the finite element analysis. This information is essential in the selection of the reinforcement. Figure 25 shows the force distribution at the end of the six- teenth construction step for the four stiffnesses studied as part of this project. This figure shows that the forces mobilized in the reinforcement depend on the stiffness of the reinforcement. The peak force is plotted versus stiffness in Figure 26. Both figures clearly show that the forces in the reinforcement increase as the stiffness of the reinforcement increases.
The peak forces computed in the finite element analysis are also listed in Table 5. The results indicate that as the stiffness decreases the peak force approaches the UTEXAS3 force required to improve the safety factor to one. This is because the stiffer reinforcements inhibit large movements in the foundation soils. The less the movement in the foundation soils the lower will be the percentage of the available shear strength mobilized. However, these smaller movements come at the expense of higher forces in the rein- forcement because the stiffer reinforcement "attracts" load which would otherwise be carried by the shear resistance of the foundation soils. Con- versely, since the FSU is less than one, as the reinforcement becomes more extensible the full shear capacity of the foundation is approached and the force attracted by the geotextile will only be large enough to match the imbalance between the driving and resisting forces.
The concept discussed in the previous paragraph is illustrated in Fig- ures 27 and 28. The plots on these figures show the percentage of available shear strength expressed as color contours. These figures show that a con- tiguous zone of fully mobilized shear stresses (red areas) is manifested only for the most extensible case where the stiffness equals 90,000 lb/ft.
Chapter 3 Analysis 11
Analysis of pullout resistance
Reinforcement pullout is a potential mechanism of failure which was not directly accounted for in the finite element analysis. In the finite element calculations, the geotextile was assumed to be compatible with the soil as no slipping between the two was permitted. In proper design it is necessary to insure that the embedment length is sufficient to develop the required tensile forces needed to stabilize the slope.
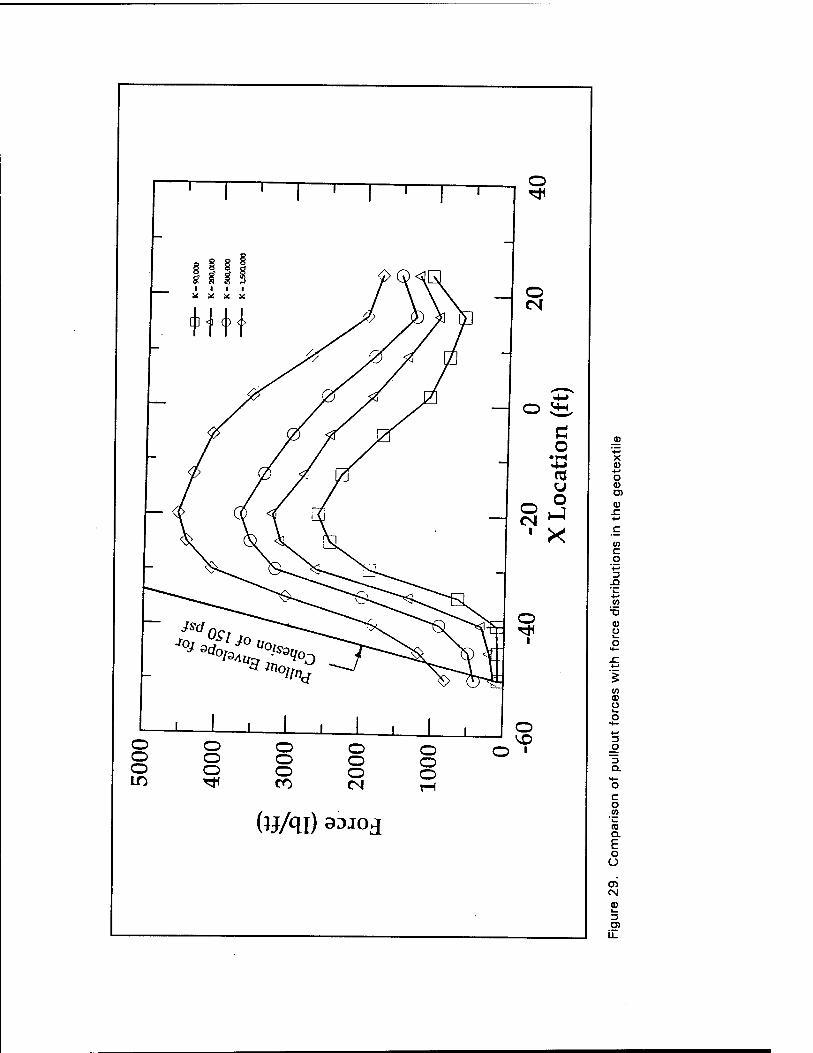
Gilbert, Oldham, and Coffing (1992) performed a laboratory investigation of the pullout resistance of geotextiles in cohesive soils. They investigated the effects of water content, the compaction process, normal pressure, load- ing rate and submergence on the pullout resistance between the geotextile and clay. In partially, saturated cohesive soils, they indicated that only about two-thirds of the soil's frictional component of strength can be relied upon at the soil-geotextile interface. In situations where the soil-geotextile is satu- rated (all pore space occupied by water and where the loading rate is rapid enough to prevent the pore water dissipation, the frictional component in the soil disappears and the lower limit of pullout resistance is the cohesion of the clay or die adhesion between the clay and the geotextile.
For the Sargent Beach Project, the geotextile will be sandwiched between the soft clay of Layer 1 and the cohesive compacted fill. These geotextile interfaces were submerged as the geotextile was placed at Elevation -1.0 ft which is below the elevation of the ground water table (Elevation +1.0). Thus, conservatively, the cohesion of the clay is assumed to represent the pullout resistance. Unfortunately, at this time there is no data on the pullout resistance at the geotextile-fill and geotextile-soft clay interfaces. However, a comparison of the pullout envelope with the force distributions for the various stiffnesses in Figure 29 indicates that the geotextile should not pull out provided the cohesion of the fill and soft clay layer are at least 150 psf.
Reinforcement performance
When assessing performance of the reinforced sections, it is important to consider the improvement in stability provided by the reinforcement. Refer- ring to Figure 20, for reinforcement stiffnesses less than 106 lb/ft, the com- puted displacements begin to increase rapidly implying that the displacements have become more sensitive to stiffness for the more extensible geotextiles. This observation may be interpreted as follows: as the factor of safety in the soil is reduced to a critical level the displacements become less certain. Thus, there is an advantage to the higher stiffness beyond simply reducing the displacements; the greater the fabric stiffness, the less the soil strength is mobilized and the greater the reliability of the design.
12 Chapter 3 Analysis

4 District Comments
The Sargent Beach project was under construction at the time of publi- cation. The contract was awarded to Luhr Brothers, Inc. for $42,648,694 in April 1995. The final design included 3,008 ft of 1V:5H sloped geotextile reinforced revetment, 4,468 ft of sheet pile wall, and 34,524 ft of 1V:2.5H sloped revetment. The contractor elected to construct the project using quar- ried granite block, trucked in from central Texas, instead of precast concrete block. An aerial view of the of a portion of the project is shown in Fig- ure 30. A view of the in-place blanket stone and granite blocks is shown in Figure 31.
The finite element method gave the District an important option, by show- ing that a more gently sloped reinforced revetment, could be used in lieu of a sheetpile wall, in areas containing the poorest foundation conditions along the 8-mile reach. Refined cost estimates and constructability reviews concluded that a sheetpile wall would be easier, and as economical, to construct, as the revetment with a IV:8H slope.
Areas adjacent to those displaying the weakest foundation conditions were reanalyzed with the appropriate design parameters. A limit equilibrium analysis (using UTEXAS3) revealed that the 1V:8H slope could be steepened to 1V:5H in those areas, better optimizing the design. One conclusion of the report was that UTEXAS3 and STUBBS agreed in their prediction of failure, and the force required by the geotextile to stabilize the slope. The informa- tion from STUBBS was critical in determining the stiffness of reinforcement specified to minimize the movement of the stone slope during construction, since this information could not be determined from a limit equilibrium analysis. Based on the results of STUBBS, the specifications require the woven geotextile to have an ultimate wide width tensile strength of 2,600 lb/in. (ASTI D 4595, and at 5 percent strain, a minimum tensile strength of 2,100 lb/in. (stiffness requirement).
Although the exact configuration of what was analyzed was not specified, the finite element method (STUBBS) provided much needed insight into how the slope would behave through the critical construction period. The esti- mated savings by using the reinforced slope, in place of the sheetpile wall, is $455,000. It is estimated that construction of the geotextile reinforced revet- ment will begin in the Spring of 1997.
Chapter 4 District Comments 13

5 Conclusions
The following conclusions were drawn from the limit equilibrium (UTEXAS3) and finite element (STUBBS) analyses performed to evaluate the stability of the reinforced revetment slope of the Sargent Beach Project on the Gulf Intracoastal Waterway. This analysis represents a worst case sce- nario due to the conservatism used in the selection of the undrained shear strengths of the natural soils occurring in the foundation.
a. The UTEXAS3 analysis showed that the unreinforced safety factor was 0.923. The critical failure surface was a noncircular wedge. This finding means that the geotextile reinforcement will be the primary line of defense in stabilizing the slope for the conditions of the analysis.
b. Both the UTEXAS3 and STUBBS analyses of the unreinforced slope indicated that the critical construction step will be during the placement of the revetment block.
c. The UTEXAS3 analysis revealed that the reinforcement must be able to supply a minimum of 2700 lb/ft to stabilize the revetment slope. This is the force required to improve the safety factor to unity.
d. For reinforced slopes, the STUBBS analyses showed that movements in the foundation will decrease as the stiffness of the reinforcement increases. The greatest increment in movement will occur during the construction step when the revetment blocks are placed upon the blanket stone. These movements are assumed to be those which occur immediately after construction of the slope and do not include consolidation.
e. The forces attracted by the geotextile increases as the geotextile's stiff- ness increases. This force increase represents the reduced strength mobilization in the soil that-is responsible for reduced movements.
/. Pullout of the reinforcement should not occur provided the cohesive component of the cohesive fill and the soft clay between which the geotextile will be sandwiched are at least 150 psf.
g. Fabric selection and construction procedures should be directed toward achieving the greatest possible effective stiffness.
14 Chapter 5 Conclusions

References
Gilbert, P. A., Oldham, J. C, and Coffing, L. R. (1992). "Laboratory measurement of pullout resistance of geotextiles against cohesive soils," Technical Report GL-92-6, USAE Waterways Experiment Station, Vicksburg, MS.
Koerner, R. M. (1991). "Designing with Geosynthetics," Prentice-Hall, Englewood, NJ.
Peters, J. F., Wahl, R. E., and Meade, R. B. "STUBBS user's manual" (Instruction Report in Preparation), USAE Waterways Experiment Station, Vicksburg, MS.
Edris, E. V. and Wright, S. G. (1992). "User's Guide: UTEXAS3 slope- stability package, Volume IV: User's Manual," Instruction Report GL-87-1, USAE Waterways Experiment Station, Vicksburg, MS.
References 15

.c ü
(A
(0 Ü o
O)

*J-::
Q
Q Z
> LÜ o: :*: o o _l CD
cr o o o
00
>
CL >-
(U a <o
TJ v o i- o c 5>
> CO
c a> E 4-» 03 > 0)
c g
*+^ u 0) 10
I CO (0 o l_
U
a) D O)

— I O CO CD o 0- CO CN CM <tf
—II O CO CO in _i| in co Tt to
(0 © 4-< 3 ü o o O O 1_ o cn CO o © C0 Q to ex iß Q O k. Q. J"5 en CD CO co
o ?- Q T—
L.
<u ^ >*5 T- CN CO «3- «3 Z _J
_i UJ ^
£ + in
C3 'S' 'S- + •i i N
_l t> s< _! 1
LU l' UJ _l UJ
O ü >* (D >. «3 >. 3
ro o «3
V) ü > ♦* ü ■ö E (D o E c 3 ü C/5 3 3 o '■5 '"5 i- o o CJ tu
1
2 CO >
1 1 1 1 o o o o o o
-.- CN 1 1
U 'U0UBA9I3
co 1 1
o </]
T3 0) N
75 <D
■D
C0

c
E
> 0) tr X oo
0) Ü c 0) 3 o-
co c g o 3 i- </> C o Ü
c. E o
O o
A E o o
o 3 5'
o 2
J L J L 'J L J L J L l 8SDL)d 2 aSDLJd £ asDMd •t, asDqd g asoqd 9 asDqd
in
u CD
C g
o 3 L.
ID c o u
u c V 3 o- V
CO
V L_ 3

% o o o o o o
- s. s 8 o o 8 to o o
'-£. o o> ©\ m
O o
e ^o o.
■c a V Q £
G •a
G o
«0
G « o to
>"
G
2 c o
M
CD
2 - c« r* ^ V» *o f-
/
o
o o
o w
o
o o
o
CM IO CM
i
o V) ■
<n '5> >• (0 c (0
CO (/) < x
0) (0 D V D. O
O
in

Materials
g| 1 medium clay E%%%| deep medium clay HIstone
BUI soft clay lUfi" Ijljljjl submerged block
BSSSa very soft clay IIHIII submerged stone B8S1 block
T = 0
T = 3
T = 10
Figure 6. Finite element mesh at construction step numbers 0, 3, and 10

medium clay
soft clay
very soft clay
Materials
U deep medium clay
fill
submerged stone
I ston~
jjjijjl submerged block
i&'fi':l block
T=14
T = 15
T = 16
Figure 7. Finite element mesh at construction step numbers 14, 15, and 16

w a. CD
c g o 3 t_
■4-» CO c o u 03 CD
(0 CO
.c
c/> CD o CO
H- L. 3 Cfl
a> _3 'S »+—
_co 3
U c o c
■o c to k-
JO 3 O
CO
o u CO
*♦—
>- 4-» tu to
00 CD L_
3 ra

—I 25
-25
X X -50
-75 -50 -25 25 50
X(ft) 75 100 125 150
Mil Description
pcf
c
psf #•
1 Fill 120 400 0
2 MedCliy ■ 19 «00 0
3 Soft Clay 119 290 0
4 V. Soft CUy 113 130 0
J MedCUy 108 600 0
6 Slooe 130 0 35
' 7 Block 137 | 0 0 —125
-75 -50 -25 JL
25 50 X(ft)
75
-25
-1-50
X X J 100 125 150
Figure 9. Critical wedge and circular failure surfaces at the end of the last (16th) construction step

T3 0) V
•W 1» V «s a a.
£ o U CO
-4—
0»
s c © H
c 0> St- © 0£
«9 "5 u Tf >• 5/3 e F"^ CQ
P
o O '
If».
(0
fi 55 £ 3 O o a. u>'
c o
o a
?-■'.!
a <D
+-* V)
JZ
C o 0)
(0 (0 CD
(0 a)
J3 CO
03 TO (0 1-* C 0) Ü a> Q.
co T3 <D V) U> CD
CLV4- X LO
o
CO 03 V
£ cu tn o
■a ■w
as N 0)
■w
jQ 03 o n E F
T3 C
o ü
(0 CO
C/> c o o o 03 >
CO > CD
+-» O c X a> 0
C 03
ü <-> J5 c Q. CD M .c i5 §
3 TO

■to c a> s
V OJ w u
JS « a ce U •to Pu 03 a; T5 cc t- <y
s «to S o
■to
S ,© H ä •to IT)
<1 t/2
C
S
"3 «8
4-i O
P a» s to*
o O '
(0 CO
S3 S 3
u. m' o c 8
C4
r +-» LO r—
<u .c +J
«4— o
T3 c (1) 03 .c +-< +-^ CO V) <o <D u.
■*-» OT 0) to. 3
(0 H-
H- O 0) O) <o
■(-»
c: D o k. <D a (0 (/> (0
■Ö <D U) U) <D L. a X S) ■a
to <D (D
-t-» Q. w (0 k_ (D +-* a) a> .c J* (A c
T3 (0 0) -Q N 0) ._ r .a o o +•* F w
a) u r c ■»-»
(Ö L-
(fl v. o
0)
m o o a> <i> > ■*-» </> c r 0) o h '+-* (1) o (1 3 aj a Vt
C n
Q o
*— »—
<D L_ D D>
LL

-4—
c V
E in CU
03 u cu ■*■»
C/5
CU cu 173
PÜ
cu ©
CO CU CU
CU
E cu C
CD
c CU
OX) '— CO
C/2
=2 "53 c
<
"03 03
E CU
> cu
3 T3 cu E E
©
mmm
I
.r ■w
CD *- cu .c 4-»
M— o
XI c 0 0 ..r ■w
+-J (0
co co <a w.
■w CO
<1> k_ D
m H—
4— o CU CD m
■(-'
t" cu O k_ cu Q.
CO
CO (D
"O CU CO 1/1 CU cu n o X CO cu Q.
0) m co L- (1) m L_ -t-1 in 10 j*: L_ o (0 o cu -Q
co •+-» r u (ii
cu N E •— •*-»
(i) -U •> Ü n> h k_
Cl> T3 r C_ ■(-'
CD ^_ CO cu
-t-<
u m O n CU cu > ■w
c. r cu o h +^ a> o o _) CO •^ n CO co 1_
n U o
CN
IE
o
>
£> o 0)
PH
(/>
0) o 0) O u •M JH u o ni
%M Üi £
o
o o o o o o in
o o o
0) VM
C3
o en o MH • o TH
O u a) « Q.
o fc ■♦-'
in c • F
O >
•D a> u h. o
o c (^ a>
o o o CD
O o o o o o TH
oo
4j/qi 'aDioj
u
(A 3 c/> L_
>
as H- (D V)
U (0
CO
3 D)

(0 _0)
o k- Q. +-» C V E » ü jo a. w
CO
0) 4-» (0
(0 c g
V-» (0 u o
3

in rH 1 | . | 1 | 1 | 1 | 1
C/i
c «* *0 *£> rH rJ rH
a» a HMD
© i^ i^ i-,
rH
ra O < ] [] - v£>
"BH II c/5 L—JT*X —
in \ - X
"73 d V V-c [Yl ~~ o> *\ •*-» \ ro \
►-J o 1 1 1 A-rt Hr\ A r ptpftpfl f4] 4J
°o o o o o g rH «N tn 9
I i i I o
T-l in
UOtJEA8|3
m rH 1 | 1 | 1 | . | 1 | 1
tß 1 1 1 ■ ■
•A-'
c __ üB»10^ T s a s u S 1 III
O 1 1- H H
i-5 00 rd c ) < ] [] CO *H< II «3 —
s in - X
"73 d *•* — O»
•4—» ~~ ™"
rt i—1
o 1 -tZlUXtli (.1 0 C r\ i 1 1
tit 4i HR ~r 1 mttfttft fl ft httäsL^A ^■^ bit EU
© o © © o p rH CN tD ^<
i i i i
O rH ID
i
UOpBA3X3
ID rH 1 1 1 | 1 | 1 | 1
CD ■4-rf c s » s CU
a ■ MR O h- H H
rH <N «* ( ) < ] E ] rH | 'S-! CD ||
• 1—1
Q in — X
"«3 d *-< _ a»
.4—• _
rö H-J
o -
TJ IfSjäÄäamy^'OQöGJ-ca-*^,^,
°o o o o o p rH «N en rF
• i i i O
rH in ■
UOt)EA9l3
in CO <D C
C V E as o t_ o
H- c
V) c o (0 u
_o
o
■D c CO
a _o CO
73
a o
(0
CO
T> c (0
IO
a. v (0
c o u -i L.
■*-»
CO c O o u 0) 4-*
(0 V) •*-< c CD E cu CN
ü H-
cu .Q a _.. CO o -o o
o CO o 0) 4-» o CD »*—
_J o
in
3

OJ
"SH en
«a
CD
o o
R
o in
S S - 2 6 - a»
•4—>
00
« V) <G
a > • f- H H
() <1 []
R
o in d
»_ © —
-J S
5 O O O i CN m rf
—i—r
ON
II X
s—a o IT)
©o
^ ifl *e
() <i C]
=Ü= A
00 CO
II X
o
(U) uopcAaia
.22 in
o in d
en
l-H O ai
T
^ m «
() <i []
©o
CM
i
X
©
(jj) UOPBA3I3
(A </> v c
c CO
E 0) Ü I— o
»4— c
c g
V-» (D U
_o CO o
c (0
tu _o
CO ■D
D. O
CO
CO
-o c (0
in
(A Q. CO 4-* CO c o 4^ u 3 k_ 4-» (A C o u ^. CO 4-»
»4— CO CO 4-* c CO F 4-» CO »4—
o -Q CD Q.O CO O
■a o o ^ o
co 4- CN CO M—
—I o
CD
O)

o ID
■zs- ° VhH.
c a» e QJ C-l fB
"H* eft
• <■*
Q C3
ai re
C
s re
CD
re ai re
.-J
e ai s CD U re
CD
1-4
"re
o CD d © tN d
s s
o d t
8b d0
o ID d
d o n d
(v) u°PEAaia
o tN d t- o d
8b d0
o ID d
(«) UOJJBA3I3
i£ §
(lj) UOI}BA3l3
CO CO
c
c
E CD u o c
CO c o ID o
_o
o ■4-»
T5 c CD
0) a o CO ■D
a o
(0
CO r— ■a c (0
ID
CO a <D +-> CO
c O +-' u "3 u.
+-» CO c O u k_ <U
•H*
CO CO +-» c CD E a> CM
ü ^- IU .Q a CO o •a o
o i_ Ü 0) in (0 *+- _i o
D)

ST <=>
CO o c CO Ol o s o> CJ o ra CM OH o CO
»^H
Q o 1 1 rH t-i O <u C3
H-l 2
C) <i n
00
(Jj) UOIJBA3I3
-3^- o -
C a* s QJ
«J
CO
5 "«3
«a
O CD d
o CM d
o d
*• m »a
°o
d
00 CO
X
(W) «OHBA3I3
CJ
OL» CJ fÖ
"Su, CO
1-4
o to d
o CM
o d
() <i []
<=©
tN I
II X
(y) uopcAaiH
co en v c
c
E CO u o c
(0 c g (D O
_o 0) o
c (D
ea a. o (A
■D
Q. O
(0
CO
c <D
(0 a. a> +^ (0
c o
■*-»
u 3 i_
4-> co c o o L. co 4-» H—
CO
CO +■* c <N 03
E ■4-»
Ü5 u o
CO
ü o ■D o
o CD LO k. cu rmm
(0 *4— _l o
CO
k_ 13 TO

CO
C u E u w "a
co •P*
D ■a
a; a
OJ u
"E, to
-a u
13
B
g 0> u «
"E, .a D •a H
O in
8 O o o
6
in
o o d
ON
II X
o o 6 ID
i
uot}EAai3
IT)
d
o d
8
o <i [] <> -
00
II X
o in
(y) uopcAaia
in
o
in d
o d
i—I—r 1
%
8 8 8 - o O O
■ ■ « X. X. u,
O <1 [] <> _
4h
rH i
II X
o o in ■
(y) uopcAae
o o o o o in *- T3 C CD «. o o o o o m
^ o o o o o CM
fc o o o o 05 0)
"o CO
CO eo CD
c O
c o H- T
■*-»
m 10 r *->
c 0)
o ü
E x: Hi r u k_ o c
03 0)
X
0) en L. 0) I_ r o ■#-*
*♦- ^ CO a> V M—
M— CO o CO
Q. c o
4-* c 4-»
CO (1
(- o V o a> CO o Q (0 •o
■o c CO
(0 a> V a CO
o CO
»♦- •a o c E o * en
Ü CO a tt) E .c o u CD
O)

-3 «•-
u 4-1 01
•4-*
a a 0)
3 es s &
73
s a s
$ S
4-1 0)
4-1 IS
B s u 3 a &H
•rH tß
8 0 s
1.40 L i i i HIHI—i i iiiiiii—i i i Mini 1.20
1.00 0.80 0.60 0.40 0.20
0.00
10
1.40
x =-12 _:
I I IIIIIII—I- I IIIIIII I I III unJ 10 10 10
i i i HiHi i i i linn—i i 111in 1.20 I—
1.00
0.80
0.60 I—
0.40
0.20
X=38
i i i nun—i » ' mi" ^i ■ ■ "|
10 10^ 10 10
cr 1.40 1.20 1.00 0.80 0.60
0.40 0.20
i i i nun—i i i nun IM inn
X = 96 J
0.00 I—i ' "inn—i i mini i i i mil
>4 io5 io6 io7
Reinforcement Stiffness (lb/ft2)
Figure 20. Peak lateral displacements in the midslope profile (X = 38 ft) versus reinforcement stiffness

o 1 1 1 1 I 1 1 1 1 1 1 1 1 1 1 1 1 1 1 1 1 1 1 - in to
E r*\r>\a f*> rlrtrl ^
- II II II
- I H + o
in CM
o ©
-
__
IN
o in , .
—
s^ ff) — 10
0 ca
tion
(
0
©X ^■*_. in
*i !=■—-
-
©
o m i
I [
) :> >
- o
I > ■'■"
o I
1 1 1 . 1 . 1 . f. 1 , 1 , 1 , 1 , 1 , 1 1 O
© o o OOOOOOOOO 1H
o firHOr-iesnTJiicvS tx © © o ©OOOÖOOÖO
* 1 * 1 1 1 © 1
(/) in CO c
c 0)
E a) ü
c 'a) CO
O
CO
C CO
CO .a E C a. cu
c o o D
(0 c o u
in
i
c g 4-» CD > CO
CD
(A *-» C CO
E CO o
JO
«o *: =5 £ "5 O ü o r °. fc o > 05
CM
CO
CO in <D c
o m co
c eu E tu u
rf in vo HrtH II II II
«Mt
I
8
»
o o «N
o in
8B rH rj u o
oX ID
o in
. I ■ I ■ I . I . T , I , I , I ■ I , I , I , I o in
o in
o o CO
o CN
o o o o o o o
CM d
o CO
o o <* in 6 ö
i i
o
d
(y) ^uaraaaBidsja p»i)J9A
to
o *♦—
to
•D C CO
CD .G
E C
Q. CD
C _o 4-» u D i—
+-* CO c o u
in oi
i
c g
v» CD > CD
CO
CO *■* c CD
E CD Ü CO +J
CO -Q
CO u
CD
>
o O O O O CN
CN CN
CD
D g>
LL

CO CO CD c
5
n
»s< in vo HHlH II II II
i. i. 1111111 o in
o o CO
o CM
o o o o
o o O rH
O CN
O CO
O
d o m d
o in
§
o in
o o ■
d d ■ i
o in co
co
o in CM
o o CN
o
8 c o
u O
X
(y) 4uainaDB[dsiQ papaa^
c
E CO Ü
c 'co L-
co
o CO r- T3 c 10
CO .Q
E 3 C a cu
c o Ü D k_
■*-»
CO c O u
in en
i
c g CO > CD
CO
to c CO
E CO u CO 4-*
CO -Q
CO u t CD
>
o o o d o Ifl
CO CN
CO
D O)

to in CD c
o in co
c CD
i *f< Ifi vo rl H rt II II II
■Ht ~
-
o o co
o in CM
CM
o in
s-l u O
o X in
I ■ I ■ I ■ I ■ I . I
o in
o o
o in
o o o o in *»< CO CM o o o o
O rH O CM
6 o CO
o d
o in ö
o VC
o
(y) iuaraaacidsia potpaA
0} o
CD
o
CO
T3 C to
in
.O E D C Q.
C o Ü D +-* </> C o Ü
if)
O)
c o 4-» ft) > V a) 4-» to (0
■I-» c CD E +-» 0) Ü "n a. o to o
•D o "m o o o 0)
o If)
> *- * CM
CD ^ 3 D)

CD
c o u D
in c o u
en a) (0 (0 a) c
c
T3
o
c (0 E Q) U k. o c
(0 c o D
w
CD U
IT) CM
3
.II|IIII|IIII|IIM|IIII|IIIIJIIM|IIII|IIII jllIJJ o
vo
1' 111111 11 11111 ll1111111111111111111
4-»
3*
C •»H
^ "llllllllllllll llHlllllllllllllllllllllllll 0
O rH oooooooooo oooooooooo omoLnomomom
CO OT U c
to
in » > c 0) E v ü
o
UI 9DIOJ
a> u
0-
C£> c\ a> k.
D D>
Li.

IHK CM 1 •*-> ■
£ wBwBiHIff o as o o ■ Sf o IIIISiMUHffln o> IE
II B BUS *
1 'XI
WBk lags SH HI ?«J Is E L« ill I & j ii I
w ;gg 11 1
31 III ■ fif Ulli iiifl H ill» ■ S'l« &ää mm WJffim P fflSSL wk
CM
O o o o o CM II
I
o en
w 0)
a)
"55
c o 0) Q.
o 00
mm 101.
o
O O <D o~ o C\l
"O c ro O O O O
a) (/) (/) C
w w <U I—
■4-J (/) <D
_D
CD
<U O) (0 +-• c (U Ü
CL

I
(/> Q)
+-»
O
3
"(5
c 0 o (1) ÜL
15
S II pit
M
o o o d o
T3 c CD
O o CD
<D O
CO CD CO CO CD C
CO CO CD l_ *-> CO
0 L.
_D
CD
01 O) CD +-> c Q) O i_ CD
D.
00 CM
. 1 . 1 1 1 , c 3 o o o o o o o o o o o u ) ^ CO CM
o o o
O vo
O '
te/qi) 3WOj
0)
o O)
en c o V-» D
J3
(0
03 O
<0 tt) Ü
O
3 Q.
C o CO
'v. 10 a E o u
CN
V
D at
LL

Figure 30. Aerial view of Sargent Beach Erosion Protection Project
Figure 31. Placement of blanket stone and granite blocks

Table 1 Finite Element Steps
Phase Number Step Number Description
Initial Conditions
0 Initial state represented by K0 level ground conditions
1 1, 2, 3 Initial excavation to Elevation -0.4 ft, the elevation at which the reinforcement will be placed
2 4 Place reinforcement and first of three lifts of fill over reinforcement
3 5, 6 Place second and third lifts of fill over reinforcement to Elevation +5.0 ft
4 7, 8, 9, 10, 11, 12, 13, 14
Excavate slope and sideslopes of 8:1 (land side) and 10:1 (gulfside) to Elevation -9.5 ft over eight construction steps
5 15 Place blanket stone on 8:1 slope
6 16 Place revetment block over blanket stone
Table 2 Descriptions of Parameters Used in the Finite Element Analysis
Parameter Description
s„ Undrained shear strength
Y Unit Weight
E Young's modulus
fJ Poisson's ratio
K„ Coefficient of earth pressure at rest
F< Endochronic parameter related to shear strength
*' Friction angle

i» 0) 0) ^ O) 0)
■o „ ! j J ! j o o ! i •e- 1 ' ' ' ! CO CO ' 1
*• CO CO CM o q CO (0 Q. •* CO <fr <fr CD r-^ <*
o CO r~ o CO CM CD ! ! U." CO co *~ CO ID CM CM ' 1
CD CD CD CD CD CD CD CD CD en 05 CD CD CD CD CD CD CD CD CD CD CD CD CD CD CD CD
SÄ d d d d d d d d d
ID ID ID ID ID ID ID O O
CO
"55 ■<fr ■* *fr •* ■* ■* si- CO CO
a. d d d d d d d d d >» to c < o o o o o o o o
to o *-* o o o o o o o c o o o o o o o * ^
X X Q) « o o o o o ID o E 0)
a o CD CO o o CO CM o o tu CO CM r~ CO ■* *~ CM *" *"
LU
V +■«
"E LL
q q q o o CO O q o ü cri CD CO cri d rv d r^ Ö ^ a i— «— o CM CO CO CO If)
o >- »— i— »— ^ i— *— ^- (0 a> t **•
IA a. o o o o O ID o 3 o CD CO o o CD CM ! !
o (0 CD CM 1— CD •<t v— CM ! J ^ Q.
■Ö C —„ ^^ (C ■a
CO ■a
CO
a> a> E CO
c o > >
> <0
O >-
a E n 3 £
<5 E .o 3 ? '-P a (D
o a O CO u 0)
CO 2 ^
(0 QL
o w 0) a
a) 2 "5
CO CO >
■D CD
5 iZ
c o 4-» CO
c o
CO
u o
CO
Ü o
CO
co 55
Tabl
e M
ater
d z
E - CM CO >* ID to r» CO CD

Table 4 Results of UTEXAS3 Analysis Reinforcement Force Versus Factor of Safety
Force (lb/ft) Factor of Safety
0 0
2,000 0.979
2,750 1.002
3,000 1.010
3,500 1.026
4,500 1.059
Table 5 Peak Reinforcement Forces for Different Stiffnesses from Finite Element Analysis
Stiffness (lb/ft)
90,000
200,000
500,000
1,500,000
Force (lb/ft)
2,610
3,227
3,685
4,545

REPORT DOCUMENTATION PAGE Form Approved OMB No. 0704-0188
Public reporting burden for this collection of information is estimated to average 1 hour per response, including the time for reviewing instructions, searching existing data sources, gathering and maintaining the data needed, and completing and reviewing the collection of information. Send comments regarding this burden estimate or any other aspect of this collection of information, including suggestions for reducing this burden, to Washington Headquarters Services, Directorate for Information Operations and Reports, 1215 Jefferson Davis Highway, Suite 1204, Arlington, VA 22202-4302, and to the Office of Management and Budget, Paperwork Reduction Project (0704-0188), Washington, DC 20503.
1. AGENCY USE ONLY (Leave blank) 2. REPORT DATE
March 1997 3. REPORT TYPE AND DATES COVERED
Final report
4. TITLE AND SUBTITLE
Analysis of Reinforced Revetment Slope of Sargent Beach Erosion Protection Project on the Gulf Intracoastal Waterway
6. AUTHOR(S)
Ronald E. Wahl, John F. Peters, Kris McNamara, Ira Brotman
5. FUNDING NUMBERS
7. PERFORMING ORGANIZATION NAME(S) AND ADDRESS(ES)
U.S. Army Engineer Waterways Experiment Station 3909 Halls Ferry Road, Vicksburg, MS 39180-6199; U.S. Army Engineer District, Galveston P.O. Box 1229, Galveston, TX 77553-1229
8. PERFORMING ORGANIZATION REPORT NUMBER
Miscellaneous Paper GL-97-4
9. SPONSORING/MONITORING AGENCY NAME(S) AND ADDRESSES)
U.S. Army Engineer District, Galveston P.O. Box 1229, Galveston, TX 77553-1229
10. SPONSORING/MONITORING AGENCY REPORT NUMBER
11. SUPPLEMENTARY NOTES
Available from National Technical Information Service, 5285 Port Royal Road, Springfield, VA 22161.
12a. DISTRIBUTION/AVAILABILITY STATEMENT
Approved for public release; distribution is unlimited.
12b. DISTRIBUTION CODE
13. ABSTRACT (Maximum 200 words)
This report documents finite element and stability analyses performed at the U.S. Army Engineer Waterways Ex- periment Station for the U.S. Army Engineer District, Galveston. These analyses aided in the design of a reinforced slope faced with concrete revetment blocks for the Sargent Beach Erosion Protection Project of the Gulf Intracoastal Waterway. The finite element method was used to simulate the construction process and predict the behavior at differ- ent stages of the construction process. Excavation, filling, and placement of geosynthetic reinforcement were the con- struction processes modeled. The principle objectives of the study were to use the results of the analyses to gain insight toward evaluating whether or not the predicted behavior of the slope would meet the stability requirements of the project. The direction and magnitude of foundation movements were estimated from the finite element calcula- tions. The effect of reinforcement stiffness on the predicted performance of the slope was also evaluated and used by district designers in the selection of an appropriate reinforcing material.
14. SUBJECT TERMS
Erosion protection Finite element method
Geosynthetic reinforcement Slope stability
15. NUM54BER OF PAGES
54
16. PRICE CODE
17. SECURITY CLASSIFICATION OF REPORT
UNCLASSIFIED
18. SECURITY CLASSIFICATION OF THIS PAGE
UNCLASSIFIED
19. SECURITY CLASSIFICATION OF ABSTRACT
20. LIMITATION OF ABSTRACT
NSN 7540-01-280-5500 Standard Form 298 (Rev. 2-89) Prescribed by ANSI Std. Z39-18 298-102