analysis of shoreline changes for the western tombolo of...
TRANSCRIPT

Analysis of Shoreline Changes for the Western Tombolo of Giens 1
V.V. Than a,b*, Y. Lacroix c,d 2
a Laboratory LATP, AMU, street F. Joliot Curie, 13453 Marseille Cedex 13, France 3 b Faculty of Civil Engineering, TLU (WRU), street Tay Son, Dong Da, Ha Noi, Viet Nam 4
c SEATECH, UTLN, avenue G. Pompidou, 83162 La Valette du Var, France 5 d MEMOCS, Università Degli Studi dell’Aquila, Italy 6
7
ABSTRACT 8
The Western tombolo of Giens in the South of France is submitted to shoreline retreats and coastal erosion. We are 9
trying to use statistical techniques in order to better understand an overall trend of the shoreline erosion. Our aim 10
was to evaluate the historical and future shoreline change. We have gathered all available data about shoreline 11
concerning the site from 1920 to 2012. The statistical methods from Digital Shoreline Analysis System are used 12
to estimate the overall change in shoreline position and shoreline change rates. The results demonstrate a clear 13
shoreline dynamics and annual shoreline change rates for four sectors of the Western tombolo. We discuss the trends 14
of shoreline changes, the relationship between shoreline change and some factors of coastal erosion (wave, sea level 15
rise, beach slope, and shoreline orientation) in the Western tombolo of Giens. We estimate that the average annual 16
rate of shoreline erosion is (-0.01 to -0.63) ± (0.27 to 1.82) meters per year in the northern part and the shoreline 17
accretion is (0.02 to 2.01) ± (0.14 to 5.10) meters per year in the central and southern part of the Western tombolo. 18
Individual rates along some transects in northern part of the Western tombolo reach as high as -1.17 ± 0.5 meters per 19
year. 20
21
Keywords: Shoreline retreat, wave, sea level rise, beach slope, shoreline orientation, DSAS. 22
23
*Corresponding author at: Faculty of Civil Engineering, TLU (WRU), street Tay Son, Dong Da, Ha Noi, Viet Nam. Tel.: +33762164318. E-mail addresses: [email protected] (V.V. Than), [email protected] (Y. Lacroix)

Introduction 1.24
The double tombolo of Giens is between the Gulf of Giens and Hyères harbor, located in the 25
Hyères Township in the Var department, France. This tombolo is formed from two sand dunes: 26
western and eastern arrows. The Almanarre beach is located at the western branch. It has a total 27
extent of 4 km of straight sandy beach, along the Salt Road (Fig. 1). 28
Since the 50s, there have been many studies about the tombolo to discover the causes of the 29
erosion and evaluate the coastal erosion (Lacroix et al. 2015a). However, the coastal erosion 30
process is still not well understood. 31
Worldwide, 70% of beaches tend to recede while only 10% fatten. The shoreline retreats 32
affect many countries in Europe. Actually, about 20% of coasts are affected by shoreline erosion 33
(Than 2015). 34
The majority of French beaches are concerned by the phenomenon of erosion. A quarter of the 35
metropolitan coast (24.2%), or 1723 km of coastline, retreats under the action of the sea. In 36
contrast, 43.7% of the coastline representing a linear distance of 3115 km are stable and almost 37
10% of the coastline are expanding and gain lands from the sea (IFEN 2007). On the French 38
Mediterranean coastline, 50% of beaches tend to erode, the Languedoc beaches are the most 39
affected, 76 km of the Languedoc-Roussillon coastline is suffering uncontrolled erosion over a 40
total of 356 km of coastline. The coastal erosion phenomenon in Saintes-Maries-de-la-Mer in 41
the Camargue causes the coastline to retreat ranging from 2.5 and up to 12 m/yr locally. 42
The Provence-Alpes-Côte d'Azur (PACA) coastlines are no exception to this evolution. The 43
maximal erosion rate estimated by GEOMER (1996) for the period from 1954 to 1993 is -1.5 44
m/yr from the mouth of the Gapeau river to approximately 800 m south (in the town of Hyères, 45
PACA) (Courtaud 2000). Individual shoreline erosion at Cabanes du Gapeau reaches as high as -46
40 m between 1969 and 1975 (Courtaud 2000). For the Western tombolo, the average shoreline 47
retreat estimate for 3000 years is -0,1 m/yr (Courtaud 2000). 48
The shoreline change analysis is of primary interest from the coastal manager’s areas (Dang and 49
Pham 2008). The shoreline evolution can be often divided into three overall categories: eroding, 50
equilibrium, and accreting (Salghuna and Bharathvaj 2015). 51
The focus on our work is the application of Digital Shoreline Analysis System (DSAS) to 52
analyze shoreline movements, identify the erosional and accretional trends, with different 53
timescales (long, medium and short-term) based on the 1920 to 2012 coastlines. We also predict 54
future trends of shoreline movements. This study determines a regression between shoreline 55
change and some agents of coastal erosion (wave, sea level rise, beach slope, and shoreline 56
orientation) in the Western tombolo of Giens. 57
Characteristics of the Study Area 2.58
Geomorphological Conditions 2.1.59
The coastline of the Western tombolo has been classified into four sectors that correspond to the 60
four hydro-sedimentary cells (Lacroix et al. 2015b), based on the geo-morphology and their 61
limiting landmarks (Fig. 1). 62
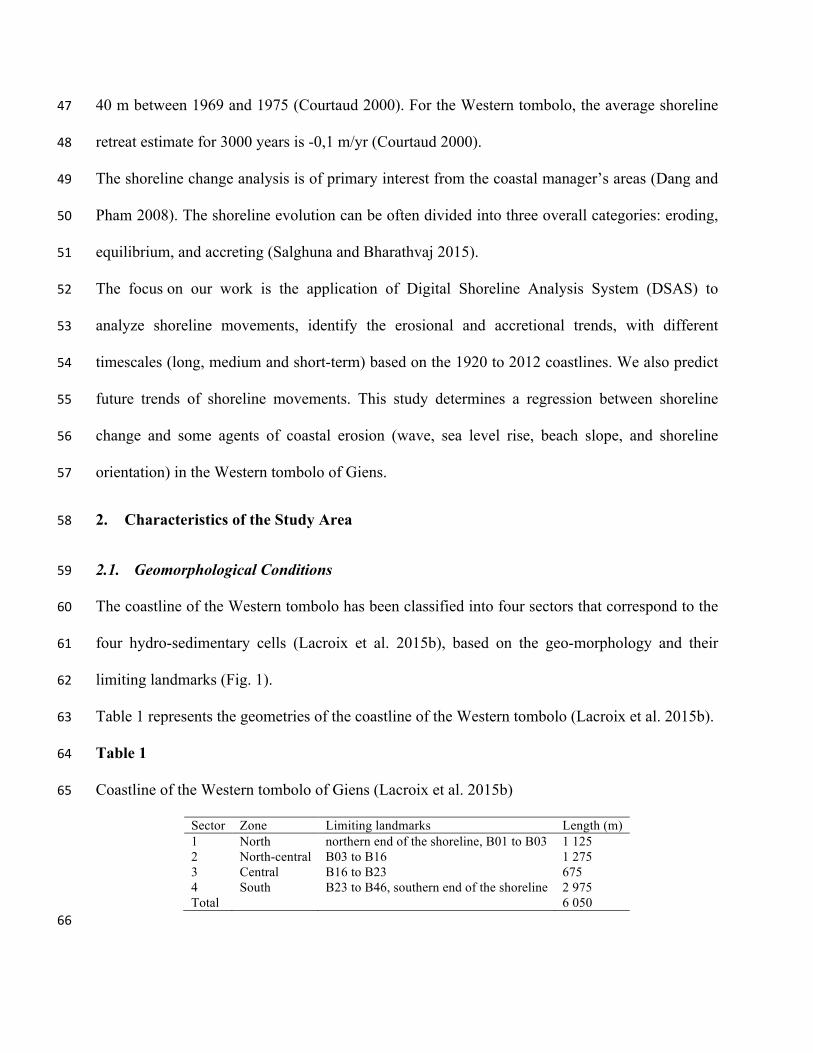
Table 1 represents the geometries of the coastline of the Western tombolo (Lacroix et al. 2015b). 63
Table 1 64
Coastline of the Western tombolo of Giens (Lacroix et al. 2015b) 65
Sector Zone Limiting landmarks Length (m) 1 North northern end of the shoreline, B01 to B03 1 125 2 North-central B03 to B16 1 275 3 Central B16 to B23 675 4 South B23 to B46, southern end of the shoreline 2 975 Total 6 050
66

67 Fig. 1. (A) Location of the Almanarre beach and Salt Road along the Western tombolo of Giens 68
and four sectors 1-4 from north to south of the coastline of the Western tombolo. (B) Aerial 69
photographs for tombolo of Giens in 1971. 70
71 The sector 1 of the coastline of the Western tombolo, which is about 1.1 km, stretches from the 72
extreme northern end of the shoreline which includes landmarks B01 to B03. Then, the sector 2 73
covers about 1.3 km of the coastline of the Western tombolo, from the landmark B03 to B16. 74
The coast of the Central Zone is about 0.7 km, from B16 to B23. The shoreline of the South 75
Zone is the longest, about 3 km. 76
A mean slope was estimated from 0.9 to 1% for the area of study. A distance from the coast to 77
the 30 m isobaths was reported at 3.2 km (Lacroix et al. 2015a). 78

Wind Conditions 2.2.79
We identify two prevailing wind regimes (Blanc 1974; Farnole et al. 2002; IARE 1996; Jeudy 80
De Grissac 1975). The western regime represents 70% of the total, which generates a stir in the 81
Gulf of Giens. Eastern regime represents 30% of the total and has no influence on the study area 82
which is protected by the tombolo and the peninsula. 83
Hydrodynamic Conditions 2.3.84
The water level data are available at Toulon station. The data recorded in Toulon are discontinuous (a 85
few years and often incomplete). However, changes in the sea level of tombolo are regularly 86
described using data from station Toulon (Courtaud 2000; IARE 1996; SOGREAH 1988b). The 87
tides in the study area do not exceed 0.3 m. 88
The wave is characterized by strong seasonality: actually, increased wave's amplitude happens in 89
the early fall, in winter, and during the spring equinox storms; the amplitudes of the wave have 90
the lowest values in summer. The highest amplitude of the offshore wave is at least greater than 91
1.25 m, corresponding to the three dominant directions, North-West, South-West, and East 92
(Courtaud 2000). Western and South-Western agitations with medium near-shore wave's 93
amplitude are predominant (HYDRO M 1993). The near-shore wave's amplitude may vary 94
depending on the presence of Posidonia and sandstone outcrops (Luhar et al. 2010). The 95
dominant near-shore waves are South-South-West to South-West in the Gulf of Giens (Lacroix 96
et al. 2015a). 97
At 4 m isobaths in northern part of Almanarre beach, the average current speed is between 3 and 98
7 cm/s in calm conditions and increases 15 to 25 cm/s in storm conditions (Lacroix et al. 2015a). 99
The dominant directions on average are East to South and West to North (Lacroix et al. 2015a). 100
Geomorphologic and Biologic Ground Conditions 2.4.101
The geology of the area generally comprises rock, gravels and fine sand (Blanc 1960; 102
SOGREAH 1988a). In the Gulf of Giens, the Posidonia meadows reduce wave energy and 103
protect the Almanarre beach from coastal erosion. 104
Materials and Methods 3.105
Workflow Methodology 3.1.106
In this study, two techniques were used: shoreline extraction techniques and shoreline change 107
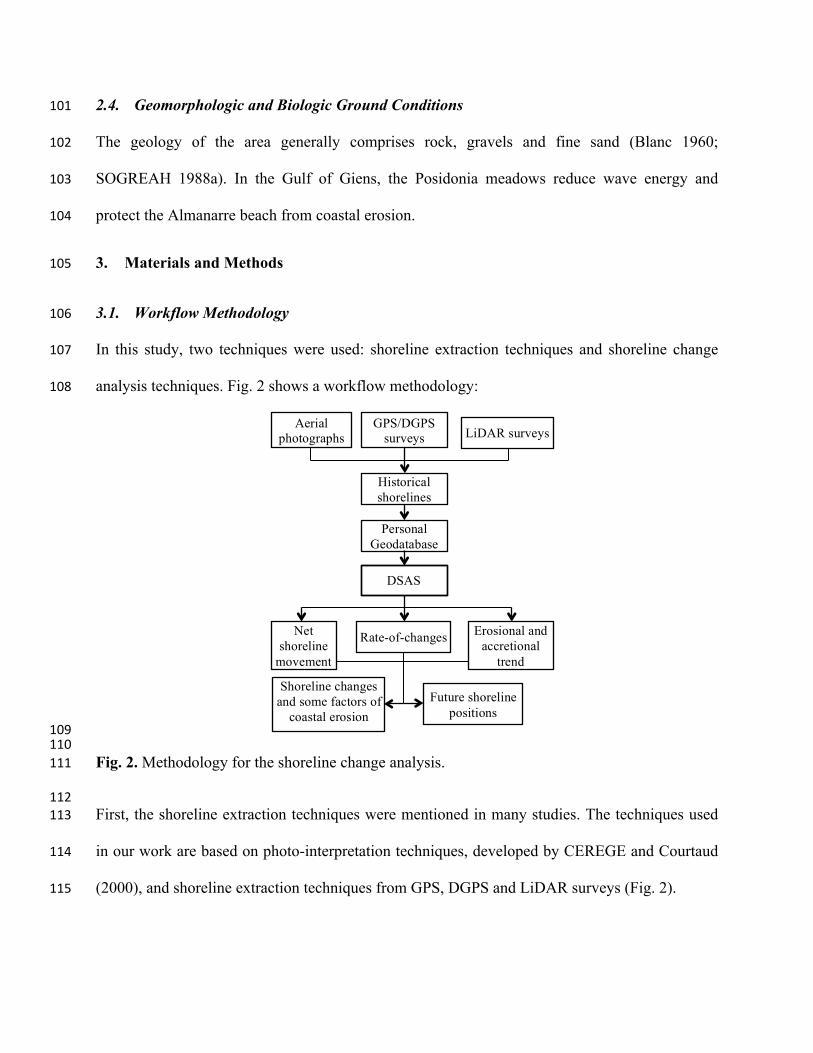
analysis techniques. Fig. 2 shows a workflow methodology: 108
109 110
Fig. 2. Methodology for the shoreline change analysis. 111
112 First, the shoreline extraction techniques were mentioned in many studies. The techniques used 113
in our work are based on photo-interpretation techniques, developed by CEREGE and Courtaud 114
(2000), and shoreline extraction techniques from GPS, DGPS and LiDAR surveys (Fig. 2). 115
Future shoreline positions
Aerial photographs
GPS/DGPS surveys LiDAR surveys
Historical shorelines
Personal Geodatabase
DSAS
Net shoreline
movement
Rate-of-changes Erosional and accretional
trend
Shoreline changes and some factors of
coastal erosion
Second, DSAS was applied to analyze shoreline change (Fig. 2). We investigate the overall 116
change in shoreline position (in meters) by Net Shoreline Movement (NSM) method (Fig. 2). 117
The annual shoreline change rates (in meters per year) is estimated at each transect by three 118
statistical methods: End Point Rate (EPR), Weighted Linear Regression (WLR), and Linear 119
Regression Rate (LRR). The short, medium, and long term shoreline change rates are estimated 120
for this study. 121
Third, we use an extrapolation of the average annual shoreline change rates to predict future 122
shoreline movements (Fig. 2). 123
Finally, we try to analyze the regression of the shoreline changes and some agents of coastal 124
erosion (wave, sea level rise, beach slope, and shoreline orientation) (Fig. 2). 125
Shoreline Positions Acquisition 3.2.126
In this study, some sources were used to get the shoreline positions. The coastlines data used for 127
our work are acquired from CEREGE (Centre de Recherche et d'Enseignement de Géosciences 128
de l'Environnement) association and Courtaud (2000) from 1920 to 1998. Table 2 reviews the 129
aerial photographs for tombolo of Giens (Fig. 1B) from the public and private organisms 130
(Courtaud 2000). The shoreline positions were extracted from aerial photographs by some public 131
and private organisms, namely IGN, Centre Camille Jullian (CNRS, Aix-en-Provence), Société 132
Aérial (Aix-Les Milles) (Table 2). This database includes twelve shorelines of 1920, 1950, 1955, 133
1960, 1970, 1971, 1984, 1987, 1991, 1994, 1995, and 1998. The different steps of data 134
processing of these aerial photographs are described by Courtaud (2000): selecting a reference 135
picture, geometric rectification of aerial photographs available; digitizing the coastline and error 136
estimate. 137
Table 2 138

Aerial photographs for tombolo of Giens from the public and private organisms (Courtaud 2000) 139
Year Organism Year Organism Year Organism Year Organism 1940 to 1944
Centre Camille Jullian
1972 IFN 1982 IGN 1991 IGN
1950 IGN 1976 IGN 1984 Société Aérial 1993 IGN 1955 IGN 1977 IGN 1987 IGN 1994 Société Aérial 1960 IGN 1978 IGN 1988 IGN 1997 IGN 1971 IGN 1979 IGN 1989 IGN 1998 IGN 140 The 2000 to 2010 and 2012 coastline were extracted from GPS, DGPS and LiDAR surveys 141
(bathymetry and topography data) from EOL (Etude et Observation du Littoral) and SHOM 142
(Service Hydrographique et Océanographique de la Marine) association, respectively. 143
All shoreline data were projected to the same geographical system (Lambert 93) (Faye et al. 144
2011). A shoreline data is a shapefile (format *.shp). The shoreline must have date, length, ID, 145
shape, and uncertainty attributes. The date’s historical shoreline position was added for the date 146
attribute as format MM/DD/YYYY. 147
The shoreline uncertainty was calculated and entered for the uncertainty attribute. The other 148
attributes (length, ID and shape) were automatically generated in Arcgis 10, once a shapefile was 149
created. Finally, we received a collection of shoreline position under shapefile format for entire 150
period of 1920-2012 including twenty-four shoreline positions for 1920, 1950, 1955, 1960, 1970, 151
1971, 1984, 1987, 1991, 1994, 1995, 1998, 2000-2010, and 2012. 152
Data Uncertainty 3.3.153
3.3.1. Data for period 1920 to 1998 154
3.3.1.1. Types of Uncertainty 155
There are two types of uncertainty: positional uncertainty and measurement uncertainty (Fletcher 156
et al. 2011). We evaluated up to five main sources of error in detecting shoreline positions from 157
the aerial photographs used for this study, namely seasonal error, tidal fluctuation error, 158
digitizing error, pixel error and rectification error (Fletcher et al. 2011; Romine and Fletcher 159
2012). 160
a. Positional Uncertainties 161
They are errors related to seasons, tides (Fletcher et al. 2011). 162
• Seasonal error (Es) 163
It is the error from movements in shoreline position (seasonal shoreline fluctuations) under the 164
action of the waves and storms (Fletcher et al. 2011). 165
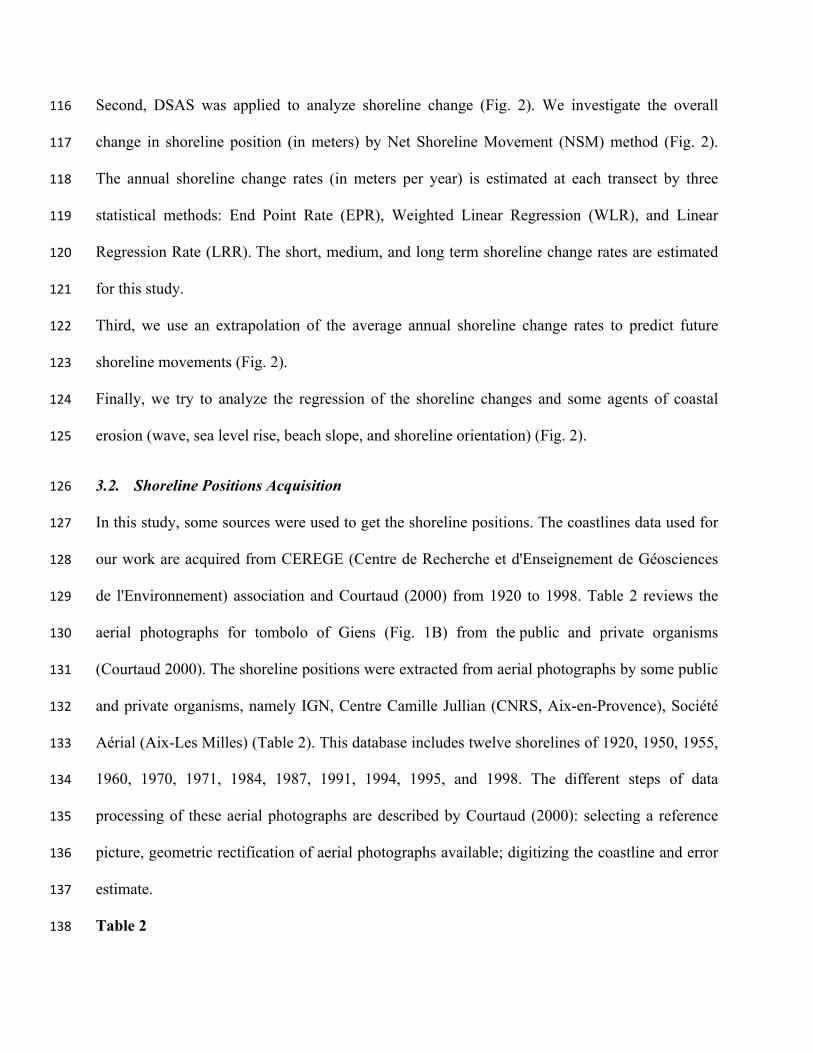
Seasonal shoreline position differences were calculated on the summer and winter beach profile 166
from EOL measurements at the Almanarre beach (Fig. 3) (Fletcher et al. 2011). 167
168
Fig. 3. Seasonal beach profile at the landmark B08 (left) and B11 (right) of the Western tombolo 169
in different observation season from 2002 to 2003 (Serantoni and Lizaud 2000-2010). 170
171 The different steps of calculation of this error are described by Fletcher et al. (2011). Finally, the 172
seasonal error was established ± 5 m. 173
• Tidal fluctuation error (Et) 174
It is the error associated with horizontal variability in shoreline position due to tides (Fletcher et 175
al. 2011). The tidal range (0.3 m) of the study area was insignificant. The tidal fluctuation error 176
thus is approximately 0 m (Addo et al. 2011). 177
-3,0
-2,0
-1,0
0,0
1,0
0 5 10 15 20 25 30 35
Hei
ght (
m)
Distance (m)
-2,0
-1,0
0,0
1,0
2,0
0 5 10 15 20 25 30 35
Hei
ght (
m)
Distance (m) spring 2002 spring 2003
fall 2002

b. Measurement Uncertainties 178
They are related to shoreline digitization, image resolution, and image rectification. 179
• Digitizing error (Ed) 180
It is the error related to shoreline digitization (Fletcher et al. 2011). The digitizing error was 181
estimated about ± 4.5 m (Romine and Fletcher 2012). 182
• Pixel error (Ep) 183
It relates to image precision (resolution). It is the image pixel size (Fletcher et al. 2011). The 184
image pixel size is from 2.5 to 5 m (Courtaud 2000). The graphic restitution of the coastline with 185
a maximum deviation of ± 2 pixels (± 5-10 m) (Courtaud 2000). Thus, we suggest that average 186
pixel error should be ± 7.5 m. 187
• Rectification error (Er) 188
It is the root mean square error of the image rectification process (Fletcher et al. 2011; Romine 189
and Fletcher 2012). The rectification error is proposed ± 0.1-7.3 m) (Romine and Fletcher 2012). 190
We have decided that the rectification error may be ± 1 m (Robichaud et al. 2012). 191
3.3.1.2. Total Positional Uncertainty 192
The total positional uncertainty (Ut) is the result of all errors that were previously estimated. It is 193
defined as the square root of the sum of the squares of the sources of error previously (Fletcher et 194
al. 2011; Romine and Fletcher 2012). It was calculated by using (1): 195
𝑈! = ± 𝐸!! + 𝐸!! + 𝐸!! + 𝐸!! + 𝐸!! (1) 196
where Es is the seasonal error, Et is the tidal error, Ed is the digitizing error, Ep is the pixel error, 197
and Er is the rectification error. 198
The estimation of each type of error is enumerated in Table 3. 199

Table 3 200
Uncertainties for historical position shorelines for period 1920 to 1998 201
Uncertainty Value (m) Positional uncertainty Seasonal error (Es) ± 5 Tidal error (Et) ≈ 0 Measurement uncertainty Digitizing error (Ed) ± 4.5 Pixel error (Ep) ± 7.5 Rectification error (Er) ± 1 Total positional uncertainty (Ut) ± 10
202 203 The total positional uncertainties were used as weights (weighted linear regression or weighted 204
least squares) in the shoreline change analysis in the DSAS. 205
The annualized uncertainty (Ua) is the uncertainty in the rate-determining model (error for the 206
shoreline change rate) (Addo et al. 2011; Fletcher et al. 2011). As the shoreline change rate, it is 207
expressed in m/yr. It was calculated as the root sum of squares of total positional uncertainty for 208
each shoreline divided by period of analysis, as in (2) (Fletcher et al. 2011) 209
𝑈! = ± !!"!!
!
! (2) 210
where i is index of the shoreline, Uti is the total positional uncertainty for each shoreline i and T 211
is the period of analysis. 212
3.3.2. Data for period 2000 to 2012 213
The mapping uncertainty is estimated as ± 5 m for the period from 2000 to the present (Anders 214
and Byrnes 1991; Crowell et al. 1991; Moore 2000; Thieler and Danforth 1994). Thus, we 215
suggest that an overall uncertainty should be ± 5 m for 2000 to 2012 shorelines. 216

Presentation of DSAS 3.4.217
DSAS version 4.3 tool developed by the USGS is an extension for ArcGIS version 10 software. 218
It uses several statistical techniques comparing shoreline positions through time to evaluate the 219
shoreline change. 220
There are many statistical approaches for the estimation of shoreline changes (Dang and Pham 221
2008; Jamont 2014), each method has advantages and disadvantages (Dang and Pham 2008; 222
Genz et al. 2007; Thieler et al. 2003). The methods used in the DSAS are described below. More 223
details about other statistical parameters are described by Himmelstoss (2009). 224
3.4.1. Net Shoreline Movement (NSM) 225
NSM is associated with the dates of two shorelines. It reports a distance in meters. It calculates 226
the distance between the oldest and the youngest shorelines at each transect (Oyedotun 2014). 227
The overall change in shoreline position was investigated by using NSM (Oyedotun 2014). 228
3.4.2. Shoreline Change Envelope (SCE) 229
SCE calculates a distance in meters between “the shoreline farthest from and closest to the 230
baseline at each transect” (Himmelstoss 2009). It is not associated with the dates of these 231
shorelines (Himmelstoss 2009). 232
3.4.3. End Point Rate (EPR) 233
EPR is determined by dividing NSM by the time period elapsed, as in (3) (Chand and Acharya 234
2010; Faye et al. 2011; Himmelstoss 2009; Jamont 2014; Oyedotun 2014; Prukpitikul et al. 235
2012) 236
R = D T! (3) 237
Where R is in meters per year (m/yr), D is in meters and Te is the time period elapsed between 238
the oldest and the most recent shoreline (years). 239
EPR still works well when we have only two shoreline to analyze the shoreline evolution 240
(Thieler et al. 2005). 241
3.4.4. Linear Regression Rate (LRR) 242
LRR corresponds to the value of the slope of a least squares regression line, as in (4), that fits all 243
points of intersection between all shorelines and a specific transects (Faye et al. 2011; Oyedotun 244
2014; Prukpitikul et al. 2012). 245
𝑦 = 𝑚. 𝑥 + 𝑏 (4) 246
where y is the distance from baseline, m is the slope (LRR method), and b is y-intercept (where 247
the line crosses the y-axis) (Himmelstoss 2009). 248
3.4.5. Weighted Linear Regression rate (WLR) 249
The WLR method uses a linear regression taking into account a weight (for each shoreline 250
position) according to the shoreline uncertainty to determine a best-fit regression line. The 251
weight is the inverse of the total positional uncertainty squared (Fletcher et al. 2011). 252
This method increases the influence of shoreline points with smaller total positional uncertainty 253
on the best-fit regression line (Himmelstoss 2009). The slope of this regression line is the 254
shoreline change rate in m/yr, as in (5). 255
𝑦 = 𝑚! . 𝑥 + 𝑏! (5) 256
Where mw is the slope (WLR method), and bw is y-intercept (where the line crosses the y-axis) 257
(Himmelstoss 2009). 258

WLR method requires at least three historical shoreline positions (Fletcher et al. 2011). 259
3.4.6. Least Median of Squares (LMS) 260
LMS uses a weighted least-squares regression. The shoreline points with larger offsets 261
(residuals) have less influence on the best-fit regression line (Himmelstoss 2009). The slope of 262
this regression line is the value of LMS. 263
3.4.7. Standard Error of the Slope (LCI, WCI) 264
The standard error of the slope with confidence interval LCI and WCI correspond to linear 265
regression and weighted linear regression methods, respectively. Its describes the uncertainties of 266
the rate-of-change, in meters per year (Himmelstoss 2009). 267
3.4.8. Coefficient of Determination (R2) 268
It “is the percentage of variance in the data that is explained by a regression” (Himmelstoss 269
2009). It is used to verify the quality of the best-fit line regression. 270
Determining the Period of Calculation 3.5.271
3.5.1. Long-term period 272
The period of calculation of the shoreline change is 92 years from 1920 to 2012 (Than 2015). All 273
shorelines were used to calculate in the DSAS for long-term period. 274
3.5.2. Short- to medium-term 275
To evaluate human impacts on the Almanarre beach, the shoreline data are divided into four 276
groups correspond to the short and medium term periods based on the human impacts: 277
-‐ From 1920 to 1960: without human impact; 278

-‐ From 1960 to 1971: installation of gabions, construction of the Salt Road; 279
-‐ From 1971 to 1998: the establishment of wooden palisades, riprap revetment, “ganivelles”, 280
etc. ...; 281
-‐ From 1998 to 2012: the complete removal of riprap revetment, annual reconstitution of the 282
sand dune. 283
The time intervals of each period vary from 11 to 40 years. It is enough to estimate the shoreline 284
changes in the study area. 285
Configuration of DSAS and Calculation 3.6.286
There are four main steps to configure DSAS: 287
The first step, we define a baseline in a shapefile format (*.shp) with many attributes (name, 288
type, geographic properties). A baseline was created from north to south almost parallel to 289
general orientation of the shoreline, through the landmarks B01-46 of EDF (Électricité de 290
France). The baseline location is onshore. This baseline is used to calculate the distance from a 291
shoreline to it at each orthogonal transect. 292
In a second step, we create a collection of shoreline and baseline in ArcGIS 10 for DSAS (Fig. 293
4A). 294
A Personal Geodatabase (*.mdb) was created by using ArcCatalog in ArcGIS 10 for each period. 295
We create the Feature Class (type of Line Features) of the shoreline and base line in each 296
Personal Geodatabase. All shoreline positions for each selected period were appended to a single 297
shapefile. 298
In a third step, the orthogonal transects (equidistant perpendicular lines) were generated at a 299
specified spacing alongshore by using DSAS. Once the Personnal Geodatabase was ready in 300
ArcGIS, the orthogonal transects were created perpendicular to the baseline. A total of 246 301
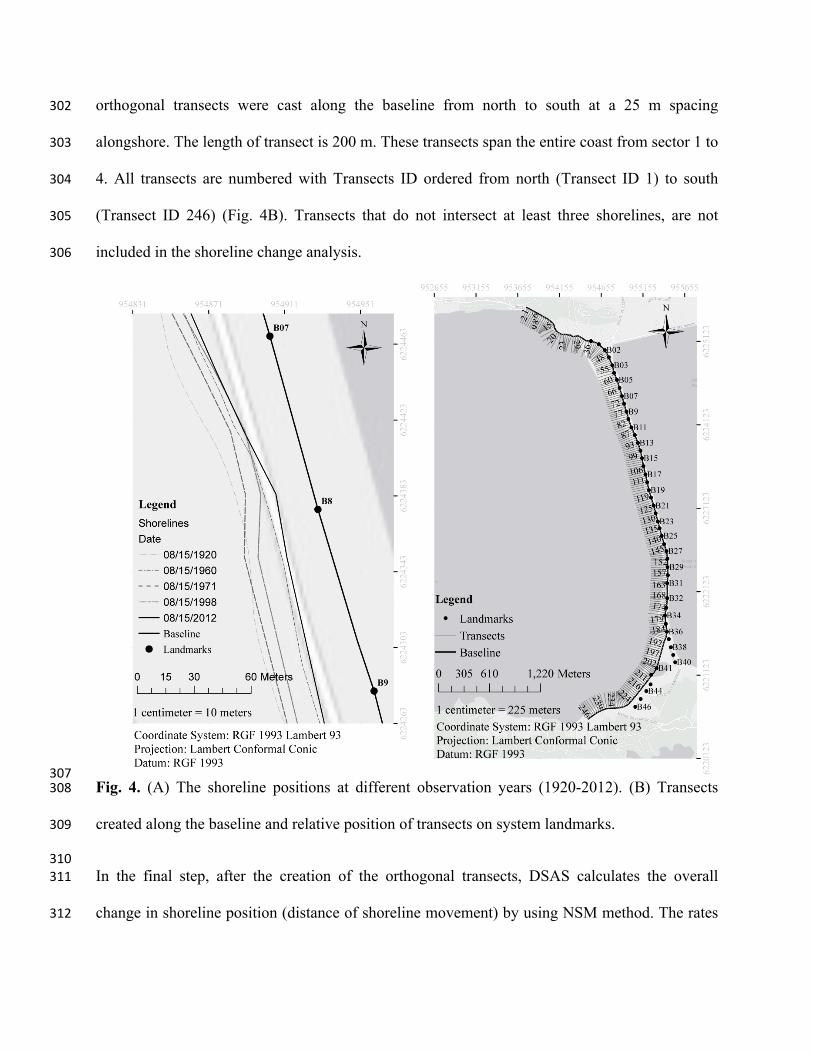
orthogonal transects were cast along the baseline from north to south at a 25 m spacing 302
alongshore. The length of transect is 200 m. These transects span the entire coast from sector 1 to 303
4. All transects are numbered with Transects ID ordered from north (Transect ID 1) to south 304
(Transect ID 246) (Fig. 4B). Transects that do not intersect at least three shorelines, are not 305
included in the shoreline change analysis. 306
307 Fig. 4. (A) The shoreline positions at different observation years (1920-2012). (B) Transects 308
created along the baseline and relative position of transects on system landmarks. 309
310 In the final step, after the creation of the orthogonal transects, DSAS calculates the overall 311
change in shoreline position (distance of shoreline movement) by using NSM method. The rates 312

of shoreline change along each transect for each period of observation were calculated by using 313
EPR, WLR, and LRR method. Regionally rate-of-change is calculated by averaging the rates of 314
changes from all transects in each studied sector. The coefficient of determination (R²) is 315
calculated by DSAS. The average coefficient of determination is the mean of these values at all 316
transects [48]. The uncertainties of the annual rate-of-change (m/yr) are the 95 percent 317
confidence interval (LCI95 or WCI95). 318
Results 4.319
Net Shoreline Movement 4.1.320
4.1.1. Sector 1 321
Sector 1 is composed of 53 transects. It comes under transect number 1 to 53. Fig. 5 shows that 322
the sector 1 includes a stable area between transect number 1 and 33. The South of sector 1 from 323
transect number 33 to 46 that corresponds to the landmarks B01-B03 has positive shoreline 324
movements before 1971. The negative shoreline movements are observed here after 1971 325
perhaps due to the existence of a Salt Road, riprap revetment, and Ceinture Canal, which 326
influence on the natural sediment balance (Fig. 5). 327

328
Fig. 5. Short-, medium-, and long- term net shoreline movement in meters along transects, sector 329
1 (left) and 2 (right) of the Western tombolo of Giens. 330
331
4.1.2. Sector 2 332
The number of transects of sector 2 are 51 (Fig. 5). Sector 2 includes transect number 54 to 104. 333
Sector 2 has a positive value indicating accretion (maximum 12 m of NSM) for short-term 334
approach of 1960-1971 perhaps due to the existence of beach nourishment during construction of 335
Salt Road (Fig. 5). 336
There are small accretion areas in the medium and short term period of 1920-1960, 1998-2012 337
and long-term (1920-2012) at the northern and southern part of this sector (Fig. 5). 338
Except two cases with accretion, we observed that this is a zone of erosion. Sector 2 has a 339
negative value indicating erosion regarding medium-term approach of 1971-1998 due to the 340
human impacts (Salt Road, riprap revetment, and Ceinture Canal) (Fig. 5). 341
4.1.3. Sector 3 342
343
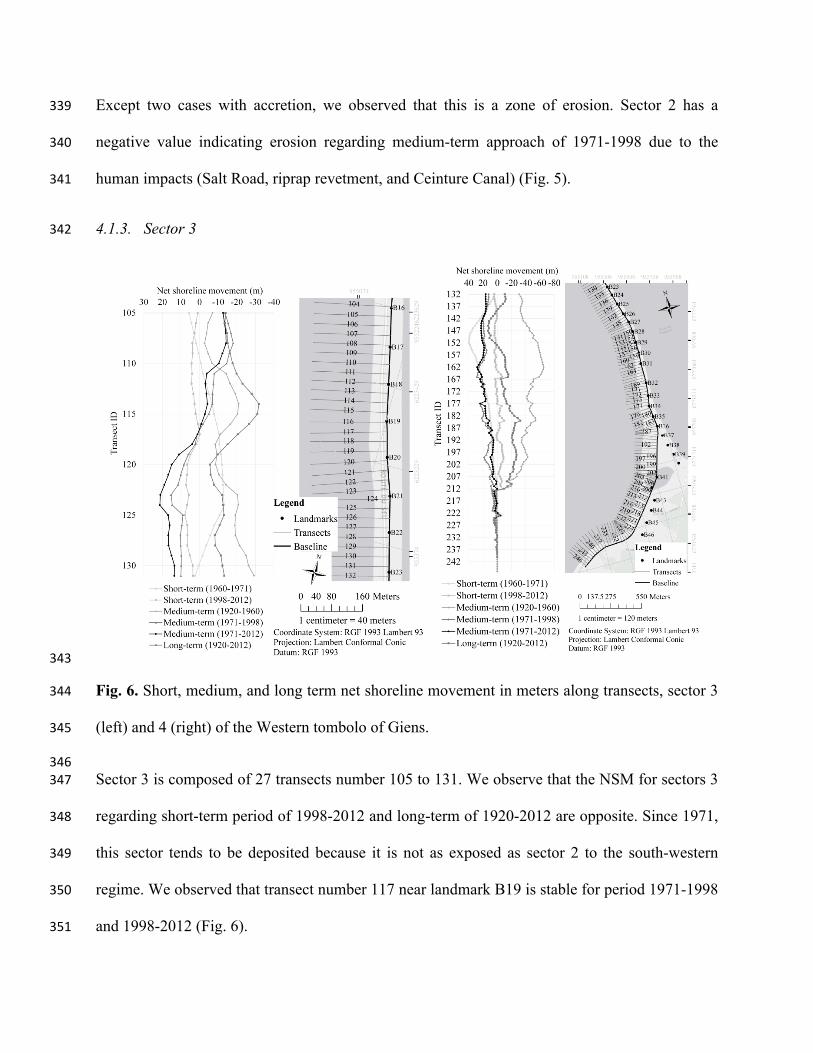
Fig. 6. Short, medium, and long term net shoreline movement in meters along transects, sector 3 344
(left) and 4 (right) of the Western tombolo of Giens. 345
346 Sector 3 is composed of 27 transects number 105 to 131. We observe that the NSM for sectors 3 347
regarding short-term period of 1998-2012 and long-term of 1920-2012 are opposite. Since 1971, 348
this sector tends to be deposited because it is not as exposed as sector 2 to the south-western 349
regime. We observed that transect number 117 near landmark B19 is stable for period 1971-1998 350
and 1998-2012 (Fig. 6). 351

4.1.4. Sector 4 352
The number of transects of sector 4 are 115. Sector 4 consists of transect number 132 to 246. The 353
South of sector 4 from transect number 224 to 246 (landmark B46 to southern end of the 354
shoreline) is stable (Fig. 6). The North of sector 4 from transect number 126 to 224 presents the 355
greatest amount of erosion (about -65 m of NSM) at transect number 162 in the medium term 356
period of 1920-1960 (Fig. 6). 357
The North of sector 4 also registered the highest amounts of accretion (about 40 m of NSM) at 358
transect number 151 regarding short-term approach of 1960-1971 (Fig. 6). 359
Annual Shoreline Change Rates 4.2.360
4.2.1. Sector 1 361
Only 9% of transects are erosional and 30% are accretional in the long term (Table 4). The 362
average long term rate of change for all erosional transects in the sector 1 is -0.15 ± 0.12 m/yr by 363
using WLR method (Table 4). Sector 1 is accreting at an average long-term rate of 0.04 ± 0.05 364
m/yr by LRR method (Table 4). 365
Fig. 7 summaries the rate-of-change for each studied period. The maximum long-term erosion 366
rate (-0.22 ± 0.16 m/yr) was found at transect number 47 (near landmark B02) by using WLR 367
method (Fig. 7). The maximum long-term accretion rate (0.14 ± 0.19 m/yr) was found at transect 368
number 38 (near landmark B01) by using EPR method. Along the sector 1 of coastline, and long-369
term (1920-2012) rates have similar trends with rates for short-term (1920-1960) by using EPR 370
method or rates for short-term (1971-1998) by using WLR method (Fig. 7). About 32% of 371
transects are erosional in the short-term (1998-2012), and 23% are accretional from the long term 372
rate (1920-2012) (Table 4). The maximum short term erosion rate (-0.98 ± 0.54 m/yr) was found 373

at transect number 47 (near landmark B02) (Fig. 7). Maximum accretion rates were found at 374
transect number 53 (about 0.93 ± 1.82 m/yr of EPR method) for period of 1960-1971 (Fig. 7). In 375
sector 1, the average medium-term rate (1971-2012) (-0.40 ± 0.15 m/yr in WLR method) 376
indicates more erosion than the average long-term rate (1920-2012) (-0.15 ± 0.12 m/yr in WLR 377
method) (Fig. 7). 378
Table 4 379
Shoreline change trends for sector 1 (North Zone) of the Western tombolo of Giens (negative 380
and positive values indicate erosion and accretion, respectively). 381
Period Short-term Medium-term Long-term 1960-1971 1998-2012 1920-1960 1971-1998 1971-2012
NTE 4 17 0 18 17 5 NTA 17 2 21 3 4 16 BE (m) 75 400 0 425 400 100 BA (m) 400 25 500 50 75 375 Rate BE (%) 8 32 0 34 32 9 Rate BA (%) 32 4 40 6 8 30 Minimal RE (m/yr) E -0.01 -0.05 0.00 -0.04 -0.06 -0.01
L 0.00 -0.03 0.00 -0.02 -0.02 -0.01 W 0.00 -0.02 0.00 -0.02 -0.07 -0.01
Average RE (m/yr) E -0.01 -0.38 0.00 -0.29 -0.33 -0.02 L 0.00 -0.43 0.00 -0.26 -0.23 -0.02 W 0.00 -0.63 0.00 -0.26 -0.40 -0.15
Maximal RE (m/yr) E -0.01 -0.62 0.00 -0.59 -0.47 -0.03 L 0.00 -0.63 0.00 -0.46 -0.33 -0.06 W 0.00 -0.98 0.00 -0.47 -0.58 -0.22
Minimal RA (m/yr) E 0.13 0.08 0.01 0.05 0.00 0.01 L 0.20 0.00 0.15 0.03 0.00 0.01 W 0.20 0.03 0.15 0.03 0.01 0.01
Average RA (m/yr) E 0.56 0.08 0.23 0.05 0.00 0.06 L 0.51 0.00 0.28 0.03 0.00 0.04 W 0.51 0.05 0.28 0.03 0.01 0.01
Maximal RA (m/yr) E 0.93 0.08 0.36 0.05 0.00 0.14 L 0.81 0.00 0.38 0.03 0.00 0.07 W 0.81 0.07 0.38 0.03 0.01 0.01
NTE = number of transects erosion, NTA = number of transects accretion, BE = Beach erosion, BA = Beach 382 accretion, E =EPR, L = LRR, W =WLR, RE = rate of erosion, RA = rate of accretion, km = kilometers, m/yr = 383 meters per year. 384 385
386
387
388
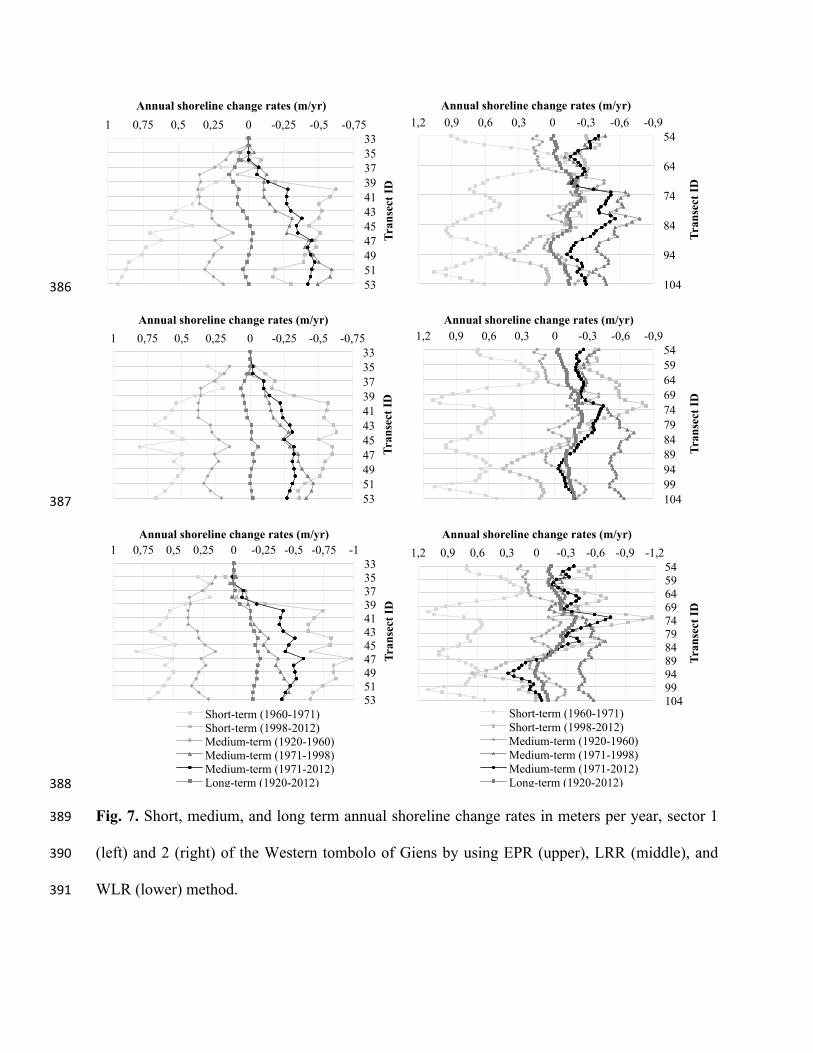
Fig. 7. Short, medium, and long term annual shoreline change rates in meters per year, sector 1 389
(left) and 2 (right) of the Western tombolo of Giens by using EPR (upper), LRR (middle), and 390
WLR (lower) method. 391
33 35 37 39 41 43 45 47 49 51 53
-0,75 -0,5 -0,25 0 0,25 0,5 0,75 1
Tran
sect
ID
Annual shoreline change rates (m/yr)
54
64
74
84
94
104
-0,9 -0,6 -0,3 0 0,3 0,6 0,9 1,2
Tran
sect
ID
Annual shoreline change rates (m/yr)
33 35 37 39 41 43 45 47 49 51 53
-0,75 -0,5 -0,25 0 0,25 0,5 0,75 1
Tran
sect
ID
Annual shoreline change rates (m/yr)
54 59 64 69 74 79 84 89 94 99 104
-0,9 -0,6 -0,3 0 0,3 0,6 0,9 1,2
Tran
sect
ID
Annual shoreline change rates (m/yr)
33 35 37 39 41 43 45 47 49 51 53
-1 -0,75 -0,5 -0,25 0 0,25 0,5 0,75 1
Tran
sect
ID
Annual shoreline change rates (m/yr)
Short-term (1960-1971) Short-term (1998-2012) Medium-term (1920-1960) Medium-term (1971-1998) Medium-term (1971-2012) Long-term (1920-2012)
54 59 64 69 74 79 84 89 94 99 104
-1,2 -0,9 -0,6 -0,3 0 0,3 0,6 0,9 1,2
Tran
sect
ID
Annual shoreline change rates (m/yr)
Short-term (1960-1971) Short-term (1998-2012) Medium-term (1920-1960) Medium-term (1971-1998) Medium-term (1971-2012) Long-term (1920-2012)

4.2.2. Sector 2 392
This sector is highly erosional because of its exposure to the strong waves, winds and rip 393
currents from the west and south-west in winter. At the sector 2, majority of shorelines were 394
eroded. Sector 2 is the most erosional sector of the Western tombolo of Giens (Table 5 and Fig. 395
7). The middle of sector 2 from transect number 65 to 88 are erosional in the long and short term 396
except one period of 1960-1971 (Fig. 7). 397
Erosion is the general long-term trend of the sector 2 (Fig. 7). 90% of transects are erosional in 398
the long term. Sector 2 has the lowest rate of accreting beach (0 percent) of the four sectors in the 399
period of 1971-1998 (Table 5). 400
Table 5 401
Shoreline change trends for sector 2 (North-central Zone) of the Western tombolo of Giens. 402
Period Short-term Medium-term Long-term 1960-1971 1998-2012 1920-1960 1971-1998 1971-2012
NTE 4 34 32 51 51 46 NTA 47 17 19 0 0 5 BE (m) 75 825 775 1250 1250 1125 BA (m) 1150 400 450 0 -25 100 Rate BE (%) 8 67 63 100 100 90 Rate BA (%) 92 33 37 0 0 10 Minimal RE (m/yr) E -0.06 -0.01 -0.03 -0.11 -0.13 -0.01
L 0.00 -0.04 -0.03 -0.14 -0.03 -0.02 W 0.00 -0.09 -0.04 -0.13 -0.03 -0.01
Average RE (m/yr) E -0.09 -0.23 -0.20 -0.43 -0.32 -0.12 L 0.00 -0.43 -0.17 -0.45 -0.22 -0.15 W 0.00 -0.49 -0.19 -0.42 -0.32 -0.19
Maximal RE (m/yr) E -0.11 -0.42 -0.46 -0.78 -0.56 -0.26 L 0.00 -0.83 -0.40 -0.72 -0.44 -0.25 W 0.00 -1.17 -0.42 -0.70 -0.75 -0.40
Minimal RA (m/yr) E 0.04 0.03 0.01 0.00 0.00 0.01 L 0.15 0.03 0.02 0.00 0.00 0.00 W 0.14 0.01 0.02 0.00 0.01 0.01
Average RA (m/yr) E 0.65 0.18 0.10 0.00 0.00 0.01 L 0.66 0.23 0.09 0.00 0.00 0.00 W 0.66 0.24 0.08 0.00 0.13 0.01
Maximal RA (m/yr) E 1.06 0.46 0.18 0.00 0.00 0.02 L 1.11 0.47 0.19 0.00 0.00 0.00 W 1.10 0.65 0.19 0.00 0.29 0.02
403

The average long-term erosion rate (1920-2012) is -0.19 ± 0.08 m/yr by using WLR method 404
(Table 5). The maximum long-term erosion rate (-0.4 ± 0.16 m/yr) was measured at transect 405
number 73 (near landmark B08). Other areas have a significant long-term (Fig. 7). 406
Approximately 100% of the short-term rates (1971-1998) are erosional, the highest percentage 407
for the four sectors (Fig. 7). The medium and short term erosion rates (1971-1998 and 1998-408
2012) in sector 2 are the most erosional rates of the four sectors. The maximum short-term 409
erosion rate (-1.17 ± 0.5 m/yr) was measured at transect number 73 (near landmarks B08). 410
Accretion rates have increased after the beach nourishment in short term period of 1960-1971 411
(Fig. 7). The average short-term accretion rate (0.66 ± 1.9 m/yr) was measured by using LRR 412
method for the period of 1960-1971. 413
4.2.3. Sector 3 414
Sector 3 is slightly erosional in the long term and accretional in the short term (1998-2012) (Fig. 415
8). The average long-term rate in sector 3 is erosional at -0.18 ± 0.07 m/yr by using LRR 416
method (Table 6). Approximately 100% of transects are erosional in the long term (Table 6). 417
The maximum long-term erosion rate (-0.35 ± 0.16 m/yr) was measured at transect number 114 418
(near landmark B19) (Table 6). The maximum long-term accretion rate (0.17 ± 0.14 m/yr) was 419
found at transect number 127 (near landmark B22). 420
In opposition to long-term analysis, the short-term approach suggests stable or accreting beaches. 421
We observed that short-term period of 1998-2012 in sector 3 indicates a trend of accretion (96% 422
of transects is accretional in Fig. 8). The average of short-term rates (1998-2012) is accretional at 423
0.44 ± 0.35 m/yr in the WLR method (Table 6). The maximum short-term accretion rate (0.76 ± 424
0.78 m/yr) was measured at transect number 120 (near landmark B20). 425

426
427
428
Fig. 8. Short, medium, and long term annual shoreline change rates in meters per year, sector 3 429
(left) and 4 (right) of the Western tombolo of Giens by using EPR (upper), LRR (middle), and 430
WLR (lower) method. 431
105
110
115
120
125
130
-1,2 -0,9 -0,6 -0,3 0 0,3 0,6
Tran
sect
ID
Annual shoreline change rates (m/yr)
132 142 152 162 172 182 192 202 212 222 232 242
-2 -1,5 -1 -0,5 0 0,5 1 1,5 2 2,5 3 3,5 4
Tran
sect
ID
Annual shoreline change rates (m/yr)
105
110
115
120
125
130
-1,2 -0,9 -0,6 -0,3 0 0,3 0,6 0,9
Tran
sect
ID
Annual shoreline change rates (m/yr)
132 142 152 162 172 182 192 202 212 222 232 242
-2 -1,5 -1 -0,5 0 0,5 1 1,5 2 2,5 3 3,5 4
Tran
sect
ID
Annual shoreline change rates (m/yr)
105
110
115
120
125
130
-1,2 -0,9 -0,6 -0,3 0 0,3 0,6 0,9
Tran
sect
ID
Annual shoreline change rates (m/yr)
Short-term (1960-1971) Short-term (1998-2012) Medium-term (1920-1960) Medium-term (1971-1998) Medium-term (1971-2012) Long-term (1920-2012)
132 142 152 162 172 182 192 202 212 222 232 242
-2 -1,5 -1 -0,5 0 0,5 1 1,5 2 2,5 3 3,5 4
Tran
sect
ID
Annual shoreline change rates (m/yr)
Short-term (1960-1971) Short-term (1998-2012) Medium-term (1920-1960) Medium-term (1971-1998) Medium-term (1971-2012) Long-term (1920-2012)

Table 6 432
Shoreline change trends for sector 3 (Central Zone) of the Western tombolo of Giens. 433
Period Short-term Medium-term
Long-term 1960-1971 1998-2012 1920-1960 1971-1998 1971-2012 NTE 20 1 27 12 12 27 NTA 7 26 0 15 15 0 BE (m) 475 0 650 275 275 650 BA (m) 150 625 0 350 350 0 Rate BE (%) 74 4 100 44 44 100 Rate BA (%) 26 96 0 56 56 0 Minimal RE (m/yr) E -0.06 -0.01 -0.07 -0.06 -0.02 -0.06
L -0.03 0.00 -0.14 -0.07 -0.01 -0.02 W -0.03 -0.02 -0.14 -0.05 -0.01 -0.02
Average RE (m/yr) E -0.73 -0.01 -0.37 -0.40 -0.19 -0.17 L -0.58 0.00 -0.45 -0.51 -0.17 -0.18 W -0.59 -0.05 -0.45 -0.49 -0.08 -0.12
Maximal RE (m/yr) E -1.20 -0.01 -0.73 -0.67 -0.35 -0.35 L -1.06 0.00 -0.75 -0.75 -0.26 -0.33 W -1.06 -0.07 -0.76 -0.75 -0.14 -0.16
Minimal RA (m/yr) E 0.05 0.06 0.00 0.05 0.03 0.00 L 0.12 0.09 0.00 0.06 0.05 0.01 W 0.01 0.06 0.00 0.08 0.13 0.07
Average RA (m/yr) E 0.24 0.31 0.00 0.34 0.35 0.00 L 0.24 0.34 0.00 0.38 0.35 0.02 W 0.21 0.44 0.00 0.41 0.33 0.14
Maximal RA (m/yr) E 0.51 0.57 0.00 0.57 0.52 0.00 L 0.43 0.59 0.00 0.56 0.51 0.03 W 0.43 0.76 0.00 0.56 0.51 0.17
434
4.2.4. Sector 4 435
The sector 4 presents trends of accretion in contrast to sector 2, except the short-term period of 436
1920-1960 (Fig. 8). 437
For the long-term period between 1920 and 2012, 58% of transects are erosional in the long-term 438
approach (Table 7). The average long-term shoreline erosion for EPR and LRR method were 439
approximately stable at -0.17 ± 0.16 and -0.14 ± 0.21 m/yr, respectively (Table 7). The 440
maximum long-term erosion rate (-0.35 ± 0.16 m/yr) was found at transect number 184 (near 441
landmark B36) (Table 7). This sector is accretional at 37% (long-term) and 46% (short-term 442
period of 1998-2012) of transects, suggesting a general trend of erosion (Table 7). The sector 4 443
experienced accretions at average long term rates of 0.18 ± 0.25 and 0.22 ± 0.18 m/yr by using 444

LRR and WLR method, respectively (Table 7). The sector 4 showed the highest accretion rate 445
about 0.53 ± 0.18 m/yr at transect number 147 (near landmark B36) by using the WLR method 446
(Table 7). Along the sector 4, long-term rates have similar trends with short-term rates except 447
periods of 1920-1960 and 1960-1971 (Fig. 8). The short-term rates (1920-1960) are opposite to 448
the short-term rates (1960-1971) (Fig. 8). 449
Table 7 450
Shoreline change trends for sector 4 (South Zone) of the Western tombolo of Giens. 451
Period Short-term Medium-term Long-term 1960-1971 1998-2012 1920-1960 1971-1998 1971-2012
NTE 9 43 81 0 2 67 NTA 83 53 24 109 107 42 BE (m) 200 1050 2000 -25 25 1650 BA (m) 2050 1300 575 2700 2650 1025 Rate BE (%) 8 37 70 0 2 58 Rate BA (%) 72 46 21 95 93 37 Minimal RE (m/yr) E -0.01 -0.01 -0.24 0.00 -0.01 -0.02
L 0.00 -0.01 -0.22 0.00 -0.01 -0.04 W 0.00 -0.01 -0.23 0.00 -0.01 -0.02
Average RE (m/yr) E -0.01 -0.32 -1.08 0.00 -0.06 -0.17 L 0.00 -0.11 -1.06 0.00 -0.01 -0.14 W 0.00 -0.14 -1.09 0.00 -0.06 -0.05
Maximal RE (m/yr) E -0.01 -0.69 -1.63 0.00 -0.11 -0.35 L 0.00 -0.27 -1.62 0.00 -0.01 -0.19 W 0.00 -0.60 -1.64 0.00 -0.22 -0.12
Minimal RA (m/yr) E 0.01 0.02 0.01 0.03 0.02 0.01 L 0.39 0.01 0.00 0.03 0.01 0.01 W 0.38 0.01 0.00 0.03 0.01 0.01
Average RA (m/yr) E 1.50 0.16 0.31 0.49 0.32 0.08 L 2.01 0.18 0.00 0.41 0.26 0.18 W 1.99 0.41 0.00 0.42 0.30 0.22
Maximal RA (m/yr) E 3.60 0.31 0.67 1.06 0.69 0.14 L 3.79 0.38 0.00 0.87 0.53 0.45 W 3.78 0.81 0.00 0.87 0.62 0.53
452
Discussion 5.453
Distribution of Coefficient of Determination (R2) 5.1.454
Fig. 9A represents the distribution of the values of the coefficient of determination along the 455
Western tombolo. 456

The correlation coefficient is pretty good in two areas: from the southern part of sector 1 to the 457
sector 2 and the northern part of sector 4. Majority of coefficient sof determination vary from 458
0.25 to 0.75 (Fig. 9A). For the medium term approach (1971-2012), the coefficients of 459
determination are greater than 0.5 between transect number 40 and 80 in the sector 2 and 460
between transect number 140 to 180 in the northern part of sector 4. 461
462
Fig. 9. (A) Distribution of coefficient of determination for WLR method in case of the Western 463
tombolo. (B) Long-term (1920-2012) annual shoreline change rates in meters per year, entire 464
Western tombolo of Giens by using End Point Rate. 465
466 For the sector 3 and the southern part of sector 4, the coefficients of determination are not good. 467
They are mainly distributed in the range of 0 to 0.5 (Fig. 9A). Between transect number 105 to 468
120, the coefficients of determination are smaller than 0.25 in the medium-term period (1971-469

2012). Transect number 190 to 230 also have more coefficients of determination in the range of 470
0.25 to 0.5. 471
Erosional and Accretional Trends 5.2.472
Fig. 9B summarizes the rate of change for long term period by using EPR method. The north 473
zone (sectors 1 and 2) presents trends of erosion in contrast to south zone (sectors 3 and 4). This 474
evolution is closely comparable to the trends from the literature (Courtaud 2000; SOGREAH 475
1988b). The maximum long term erosion rate (-0.35 ± 0.16 m/yr) was found at transect number 476
114 (near landmark B18 and B19, Fig. 9B). The average annual rate of shoreline retreat vary 477
from -0.01 ± 1.82 to -0.63 ± 0.27 m/yr in the northern part. The Western tombolo showed the 478
highest accretion rate about 0.14 ± 0.16 m/yr at transect number 147 (near landmark B26) (Fig. 479
9B). The average annual rate of shoreline accretion is estimated between 0.02 ± 0.14 and 2.01 ± 480
5.10 m/yr in central and southern part of the Western tombolo. 481
Trends of Shoreline Movement 5.3.482
This study has objectives to forecast shoreline movement. We used a linear regression with slope 483
the average annual rate-of-change. The extrapolations to ten, twenty, fifty and a hundred years of 484
the shoreline are made from the average rate of shoreline change for the period from 1971 to 485
2012. The average rate of shoreline erosion is between -0.22 ± 0.09 and -0.40 ± 0.15 m/yr for the 486
sector 1 and 2 and average rate of shoreline accretion is between 0.26 ± 0.17 and 0.35 ± 0.18 487
m/yr for the sector 3 and 4. 488
Table 8 shows the trends of shoreline movement for the Western tombolo in ten, twenty, fifty 489
and a hundred years. The coastline in short-term (2022) was predicted to recede at least –2.2 ± 490
0.9 m in the sectors 1 and 2. Similarly, the average shoreline recession in year 2032 was 491

predicted to be at least -4.4 ± 1.8 m. In long-term (2112) along sectors 1 and 2, coastline would 492
retreat at a distance of 22 m (Table 8). 493
Table 8 494
Prediction of future shoreline movement for Western tombolo. 495
Sector Average rates from 1971 to 2012 (m/yr)
Trends of shoreline movement (m) 10 20 50 100
(years) 1 EPR -0.33 -3.3 -6.5 -16.3 -32.6
LRR -0.23 -2.3 -4.6 -11.6 -23.1 WLR -0.40 -4.0 -7.9 -19.8 -39.6
2 EPR -0.32 -3.2 -6.3 -15.8 -31.5 LRR -0.22 -2.2 -4.4 -11.1 -22.1 WLR -0.32 -3.2 -6.4 -16.1 -32.2
3 EPR 0.35 3.5 7.1 17.7 35.5 LRR 0.35 3.5 6.9 17.3 34.5 WLR 0.33 3.3 6.5 16.3 32.6
4 EPR 0.32 3.2 6.3 15.8 31.6 LRR 0.26 2.6 5.2 12.9 25.9 WLR 0.30 3.0 6.0 15.1 30.2
Negative and positive values indicate erosion and accretion, respectively. 496 497
Shoreline Change and Some Agents of Coastal Erosion 5.4.498
5.4.1. Waves and Shoreline Changes 499
The statistics of wave data available from 1999 to 2012 (14 years) at the buoy Porquerolles - 500
08301 help to define the annual wave regime (annual condition). We have extracted from the 501
simulation in Mike 21 (Lacroix et al. 2015b) the nearshore significant wave height for all 502
transects in the annual condition (Fig. 10A). The strong waves are focused between transect 503
number 50 and 104 in Fig. 10A. 504
We try to find a linear regression among net shoreline movement/rates of change (y) and 505
significant wave height (x) in m by using the linear regression in Fig. 10B,C. Its coefficient of 506
determination is not bad (R2 = 0.35). These dispersions show that the shoreline erosions are 507
proportional to the significant wave height. A significant wave height change of 1 m causes a 508
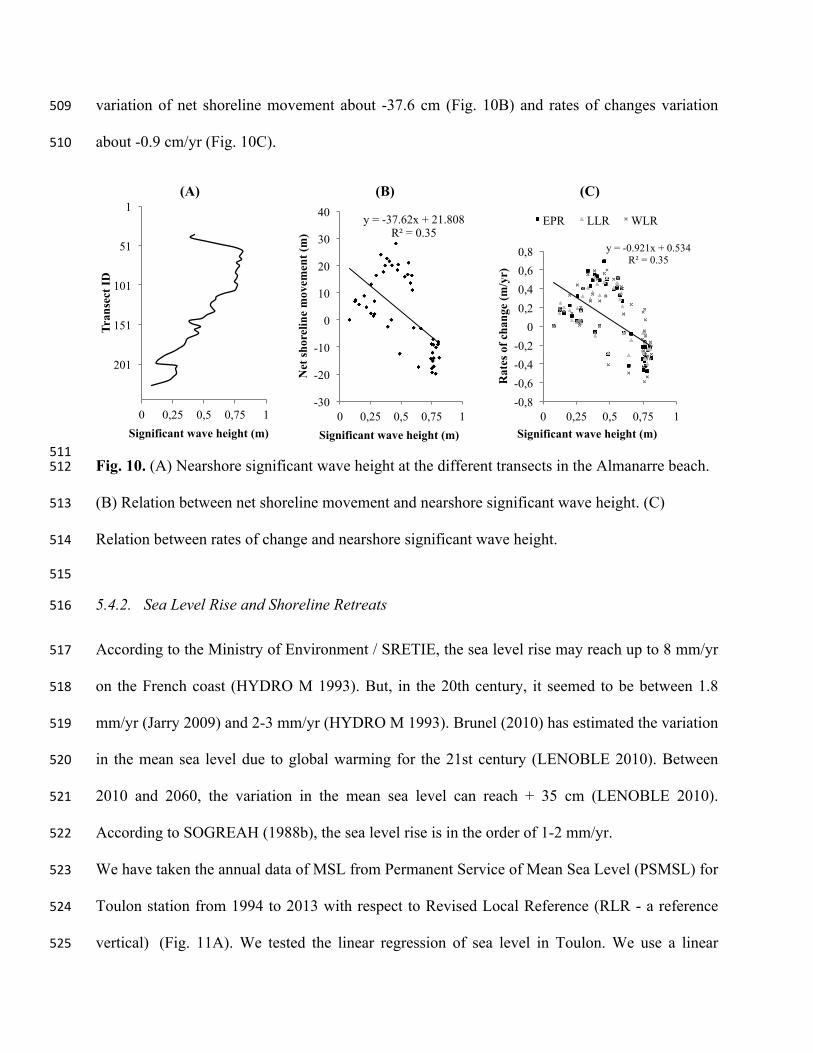
variation of net shoreline movement about -37.6 cm (Fig. 10B) and rates of changes variation 509
about -0.9 cm/yr (Fig. 10C). 510
511 Fig. 10. (A) Nearshore significant wave height at the different transects in the Almanarre beach. 512
(B) Relation between net shoreline movement and nearshore significant wave height. (C) 513
Relation between rates of change and nearshore significant wave height. 514
515
5.4.2. Sea Level Rise and Shoreline Retreats 516
According to the Ministry of Environment / SRETIE, the sea level rise may reach up to 8 mm/yr 517
on the French coast (HYDRO M 1993). But, in the 20th century, it seemed to be between 1.8 518
mm/yr (Jarry 2009) and 2-3 mm/yr (HYDRO M 1993). Brunel (2010) has estimated the variation 519
in the mean sea level due to global warming for the 21st century (LENOBLE 2010). Between 520
2010 and 2060, the variation in the mean sea level can reach + 35 cm (LENOBLE 2010). 521
According to SOGREAH (1988b), the sea level rise is in the order of 1-2 mm/yr. 522
We have taken the annual data of MSL from Permanent Service of Mean Sea Level (PSMSL) for 523
Toulon station from 1994 to 2013 with respect to Revised Local Reference (RLR - a reference 524
vertical) (Fig. 11A). We tested the linear regression of sea level in Toulon. We use a linear 525
1
51
101
151
201
0 0,25 0,5 0,75 1
Tran
sect
ID
Significant wave height (m)
(A)
y = -37.62x + 21.808 R² = 0.35
-30
-20
-10
0
10
20
30
40
0 0,25 0,5 0,75 1
Net
shor
elin
e m
ovem
ent (
m)
Significant wave height (m)
(B)
y = -0.921x + 0.534 R² = 0.35
-0,8 -0,6 -0,4 -0,2
0 0,2 0,4 0,6 0,8
0 0,25 0,5 0,75 1
Rat
es o
f cha
nge
(m/y
r)
Significant wave height (m)
(C)
EPR LLR WLR

regression as y = 3x + 722, where: y is the water level in mm; x is year. The linear regression 526
indicates a sea level rise in Toulon; this is quite consistent with the rising trend of sea level in 527
general. However, its coefficient of determination is bad (R2 = 0.26) (Fig. 11A). The sea level 528
rise can reach 3 mm/yr based on the water level data for period of 1994-2013 (Fig. 11A). 529
We estimated the dispersion among shoreline retreats (y) in m and sea level rise (x) in mm by 530
using a linear regression as y = -0.054x - 0947. This regression indicates that the shoreline 531
retreats are proportional to sea level rise. But its determination coefficient is very bad (R2 = 0.1). 532
With a sea level rise change of 1 mm, the shoreline retreat variation is -0.054 m (Fig. 11B). 533
534
Fig. 11. (A) Yearly average annual sea level in mm RLR (Revised Local Reference) at the 535
station Toulon (source: PSMSL). (B) The interactive relationship between average sea level 536
change and shoreline retreats over the period from 1998 to 2010. 537
538
5.4.3. Beach slope and Shoreline Changes 539
The beach slope has an important role in mitigating or accelerating rip-currents. The Gulf of 540
Giens presents a relatively low average beach slope (Courtaud 2000). However, ERAMM (2001) 541
highlights strong gradients of the beach slope near the coast in some beach profiles. The very 542
y = 3x + 722 R² = 0.26
0
1000
2000
3000
4000
5000
6000
7000
8000
1990 2000 2010
Sea level (mm RLR)
Year
y = -‐0.054x -‐ 0.947 R² = 0.1
-‐1,2
-‐1
-‐0,8
-‐0,6
-‐0,4
-‐0,2
0 0 10 20 30 40
Shoreline retreats (m
)
Sea level rise (mm)
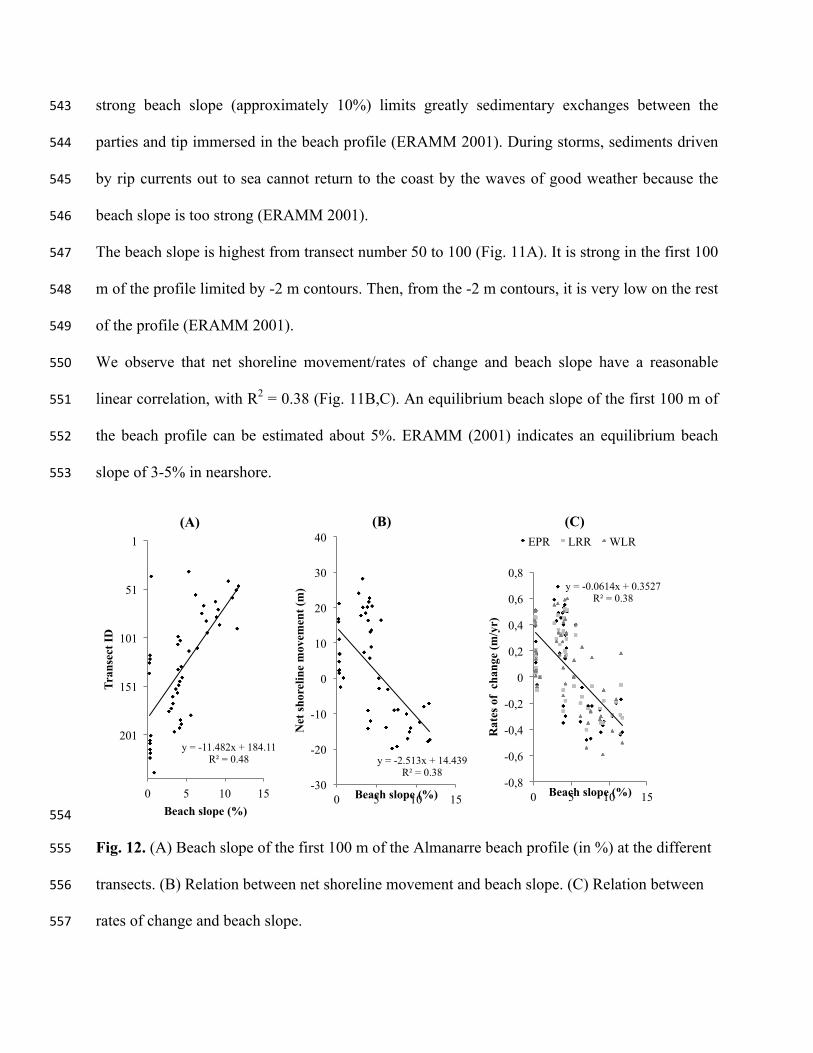
strong beach slope (approximately 10%) limits greatly sedimentary exchanges between the 543
parties and tip immersed in the beach profile (ERAMM 2001). During storms, sediments driven 544
by rip currents out to sea cannot return to the coast by the waves of good weather because the 545
beach slope is too strong (ERAMM 2001). 546
The beach slope is highest from transect number 50 to 100 (Fig. 11A). It is strong in the first 100 547
m of the profile limited by -2 m contours. Then, from the -2 m contours, it is very low on the rest 548
of the profile (ERAMM 2001). 549
We observe that net shoreline movement/rates of change and beach slope have a reasonable 550
linear correlation, with R2 = 0.38 (Fig. 11B,C). An equilibrium beach slope of the first 100 m of 551
the beach profile can be estimated about 5%. ERAMM (2001) indicates an equilibrium beach 552
slope of 3-5% in nearshore. 553
554
Fig. 12. (A) Beach slope of the first 100 m of the Almanarre beach profile (in %) at the different 555
transects. (B) Relation between net shoreline movement and beach slope. (C) Relation between 556
rates of change and beach slope. 557
y = -11.482x + 184.11 R² = 0.48
1
51
101
151
201
0 5 10 15
Tran
sect
ID
Beach slope (%)
(A)
y = -2.513x + 14.439 R² = 0.38
-30
-20
-10
0
10
20
30
40
0 5 10 15
Net
shor
elin
e m
ovem
ent (
m)
Beach slope (%)
(B)
y = -0.0614x + 0.3527 R² = 0.38
-0,8
-0,6
-0,4
-0,2
0
0,2
0,4
0,6
0,8
0 5 10 15
Rat
es o
f ch
ange
(m/y
r)
Beach slope (%)
(C) EPR LRR WLR

558
5.4.4. Shoreline Orientation and Shoreline Changes 559
For the Western tombolo, the orientations of the coastline vary between 200° and 310° (Fig. 560
13A). On the northern part of the tombolo, the shoreline orientations are from 200° to 258°. The 561
net transit is very sensitive to the shoreline orientation (Than 2015): a pivot 1° of the shoreline 562
orientation can cause a significant change in the net transit of about 2 000 m3/yr (cubic meters 563
per year). 564
We observe that shoreline orientation seems to be proportional with transect number (transect 565
ID) with a good correlation (R2 = 0.79) in Fig. 13A. The dispersion of rates of change and 566
shoreline orientation can be estimated by using two Fourier orders with a weak correlation (R2 = 567
0.34) (Fig. 13B). An equilibrium orientation of the coastline is located approximately 262° (Fig. 568
13B). 569
570
Fig. 13. (A) Shoreline orientation of the Almanarre beach (in degree Nord) at the different 571
transects. (B) Relation between rates of change and shoreline orientation by using a Fourier two 572
orders. 573
574
y = 2.3701x - 499.92 R² = 0.79 1
51
101
151
201
200 250 300
Tran
sect
ID
Shoreline orientation (degree Nord)
Conclusion 6.575
We conclude that DSAS is effective to determine the zone of erosion and accretion and to 576
estimate the overall change in historical shoreline position by using the extracted shorelines. An 577
analysis of Net Shoreline Movement was undertaken. We suggest that DSAS is helpful for the 578
management of the coastal area. We consider that the methodological approaches in this paper 579
can be used for other coasts. 580
The annual historical shoreline change rates are simply quantifiable by DSAS. The rates-of-581
change were calculated along transects. Average erosion rates are estimated to be (-0.01 to -0.63) 582
± (0.27 to 1.82) for sectors 1 and 2. Average accretion rates is (0.02 to 2.01) ± (0.14 to 5.10) for 583
the sector 3 and 4. 584
Individual rates along some transect in northern part of the Western tombolo reach as high as -585
1.17 ± 0.5 m/yr. The rates of change we have calculated are closely comparable with the trends 586
noted in the literature (Courtaud 2000; SOGREAH 1988b). 587
The correlation coefficients are pretty good in the southern part of sector 1, sector 2, and 588
northern part of sector 4. They are weak for the sector 3 and the southern part of sector 4. 589
The prediction of future shoreline movements was carried out by using an extrapolation of the 590
average annual historical shoreline change rates. The coastline in short term (2022) was 591
predicted to recede at least –2.2 ± 0.9 m in the sectors 1 and 2. Similarly, the average shoreline 592
recession in year 2032 was predicted to be at least -4.4 ± 1.8 m. In long term (2112) along 593
sectors 1 and 2, coastline would retreat at a distance of 22 m. 594
The strong waves focus between transect number 50 and 104. Shoreline erosions are proportional 595
to significant wave heights. A significant wave height change of 1 cm causes a variation of net 596
shoreline movement about -37.6 cm and rates of changes variation about -0.9 cm/yr. 597

We conclude that a rising trend of sea level during the period of 1994-2013 in Toulon harbor 598
correlates to the general increasing trend of Mean Sea Level. The sea level rise can reach 3 599
mm/yr in the Western tombolo. The results show that the shoreline retreats are proportional to 600
sea level rise. With a sea level rise change of 1 mm, the shoreline retreat variation is -0.054 m/yr. 601
The beach slope is highest from transect number 50 to 100. We observe that net shoreline 602
movement/rates of change and beach slope have a reasonable linear correlation. An equilibrium 603
beach slope of the first 100 m of the beach profile can be estimated about 5%. 604
On the northern part of the tombolo, the shoreline orientation is from 200° to 258°. We observe 605
that shoreline orientation seems to be proportional with transect number with a good correlation. 606
The dispersion of rates of change and shoreline orientation can be estimated by using a second 607
order Fourier approximation. An equilibrium orientation of the coastline is located 608
approximately 262°. 609
The shoreline change analysis in the Western tombolo helps to determine the key factors driving 610
the shoreline change. Our work will also help to propose possible solutions to stabilize the 611
shoreline. This subject will be the focus of a forthcoming paper by the authors. 612
613
List of acronyms 614
DSAS Digital Shoreline Analysis System 615
NSM Net Shoreline Movement 616
EPR End Point Rate 617
WLR Weighted Linear Regression 618
LRR Linear Regression Rate 619
CEREGE Centre de Recherche et d'Enseignement de Géosciences de l'Environnement 620

SHOM Service Hydrographique et Océanographique de la Marine 621
IGN Institut national de l'information géographique et forestière 622
IFN Inventaire Forestier National 623
EOL Etude et Observation du Littoral 624
PSMSL Permanent Service for Mean Sea Level 625
REFMAR Réseaux de rEFérence des observations MARégraphiques 626
EDF Électricité de France 627
USGS United States Geological Survey 628
MSL Mean Sea Level 629
RLR Revised Local Reference 630
List of symbols 631
Es seasonal error 632
Et tidal error 633
Ed digitizing error 634
Ep pixel error 635
Er rectification error 636
i index of the shoreline 637
Uti total positional uncertainty for each shoreline i 638
T period of analysis 639
R rate-of-change in meters per year (m/yr) 640
D net shoreline movement in meters 641
Te time period elapsed between the oldest and the most recent shoreline (years) 642
y distance from baseline 643
m, mw slope 644
b, bw y-intercept (where the line crosses the y-axis) 645
R2 Coefficient of Determination 646
647
Acknowledgements 648
We would like to thank the following organizations who have kindly provided data possible: 649
CEREGE, SHOM, IGN, EOL, PSMSL and REFMAR. We also thank USGS for the DSAS tool 650
for this paper. 651
652
References 653
Addo, K.A., Jayson-Quashigah, P.N., & Kufogbe, K.S. (2011). Quantitative analysis of shoreline change using 654
medium resolution satellite imagery in Keta, Ghana. Marine Science, 1, 1-9 655
Anders, F.J., & Byrnes, M.R. (1991). Accuracy of shoreline change rates as determined from maps and aerial 656
photographs. Shore and Beach, 59, 17–26 657
Blanc, J.J. (1960). Etude sédimentologique de la presqu l'île de Giens et de ses abords. In (pp. 35-52) 658 Blanc, J.J. (1974). Phénomènes d'érosions sous-marines à la Presqu'île de Giens (Var). CR Acad. Sci. Paris, 278, 659
1821-1823 660
Brunel, C. (2010). Évolution séculaire de l'avant côte de la méditerranée Française, impact de l'élévation du niveau 661
de la mer et des tempêtes. In, U.F.R des Sciences Géographiques et de l’Aménagement (p. 470). Marseille: 662
Université de Provence-Aix-Marseille I 663
Chand, P., & Acharya, P. (2010). Shoreline change and sea level rise along coast of Bhitarkanika wildlife sanctuary, 664
Orissa: an analytical approach of remote sensing and statistical techniques. International Journal of Geomatics 665
and Geosciences, 1, 436-455 666 Courtaud, J. (2000). Dynamiques geomorphologiques et risques littoraux cas du tombolo de giens (Var, France 667
méridionale). In (p. 263): Université Aix-Marseille I 668
Crowell, M., Leatherman, S.P., & Buckley, M.K. (1991). Historical Shoreline Change: Error Analysis and Mapping 669
Accuracy. JOURNAL OF COASTAL RESEARCH, 7, 839-852 670
Dang, V.T., & Pham, T.P.T. (2008). A shoreline analysis using DSAS in Nam Dinh coastal area. International 671
Journal of Geoinformatics, 4, 37-42 672
ERAMM (2001). Etude sur la protection de la partie Nord du tombolo Ouest de Giens. In 673

Farnole, P., Bougis, J., Ritondale, M., & Barbarroux, M. (2002). Protection du littoral contre l'érosion marine: 674
application au tombolo Ouest de Giens. In, VIIèmes Journées Nationales Génie Civil- Génie Côtier (pp. 513-675
522). Anglet, France: Editions Paralia 676
Faye, I., Giraudet, E., Gourmelon, F., & Henaff, A. (2011). Cartographie normalisée de l’évolution du trait de côte. 677 Mappemonde, 104, 12 678
Fletcher, C.H., Romine, B.M., Genz, A.S., Barbee, M.M., Dyer, M., Anderson, T.R., Lim, S.C., Vitousek, S., 679
Bochicchio, C., & Richmond, B.M. (2011). National assessment of shoreline change: Historical shoreline change 680
in the Hawaiian Islands. In (p. 55) 681
Genz, A.S., Fletcher, C.H., Dunn, R.A., Frazer, L.N., & Rooney, J.J. (2007). The predictive accuracy of shoreline 682
change rate methods and alongshore beach variation on Maui, Hawaii. JOURNAL OF COASTAL RESEARCH, 683
87-105 684
GEOMER (1996). Aménagement du littoral- Etude de faisabilité d'un port intérieur à l'embouchure du Gapeau: 685 Etude courantologique et sédimentologique. In. Marseille 686
Himmelstoss, E.A. (2009). DSAS 4.0 Installation Instructions and User Guide. in: Thieler, E.R., Himmelstoss, E.A., 687
Zichichi, J.L., and Ergul, Ayhan. 2009 Digital Shoreline Analysis System (DSAS) version 4.0 — An ArcGIS 688
extension for calculating shoreline change: U.S. Geological Survey Open-File Report 2008-1278. *updated for 689
version 4.3. (p. 79) 690
HYDRO M (1993). Etude d'impact sur l'environnement du projet de protection du tombolo ouest de la presqu'ile de 691
Giens. In 692
IARE (1996). Le Tombolo Occidental de Giens - Synthèse des connaissances- Analyse globale et scenarios 693 d'aménagement et de gestion. In 694
IFEN (2007). Analyse statistique et cartographique de l’érosion marine. In (p. 36). Orléans 695
Jamont, M.F. (2014). Etude des aléas naturels sur le «Sud Vendée et marais Poitevin» - Rapport de phase 2 - 696
Caractérisation des aléas de référence. In (pp. 67-67). Vendée 697
Jarry, N. (2009). Etudes expérimentales et numériques de la propagation des vagues au-dessus de bathymétries 698
complexes en milieu côtier. In (p. 339): Université du Sud Toulon Var 699
Jeudy De Grissac, A. (1975). Sédimentologie dynamique des rades d'Hyères et de Giens (Var). Problèmes 700 d'Aménagements. In (p. 86 + annexes). Marseille: Université d'Aix-Marseille II 701
Lacroix, Y., Than, V.V., Leandri, D., & Liardet, P. (2015a). Analysis of a Coupled Hydro-Sedimentological 702
Numerical Model for the Tombolo of GIENS. International Journal of Environmental, Ecological, Geological 703
and Geophysical Engineering, 9, 117 - 124 704
Lacroix, Y., Than, V.V., Leandri, D., & Liardet, P. (2015b). Analysis of Some Solutions to Protect the Tombolo of 705
GIENS. International Journal of Environmental, Ecological, Geological and Geophysical Engineering, 9, 108 - 706
116 707
LENOBLE, A. (2010). Etude pour la protection de la plage du Ceinturon et du secteur Sud du port Saint-Pierre – 708 Phase 1 : Synthèse des connaissances - Rapport. In 709
Luhar, M., Coutu, S., Infantes, E., Fox, S., & Nepf, H. (2010). Wave-‐induced velocities inside a model seagrass bed. 710 Journal of Geophysical Research: Oceans (1978–2012), 115 711
Moore, L.J. (2000). Shoreline mapping techniques. JOURNAL OF COASTAL RESEARCH, 16, 111-124 712
Oyedotun, T.D.T. (2014). Shoreline Geometry: DSAS as a Tool for Historical Trend Analysis. Geomorphological 713
Techniques, Chap. 3, Sec. 2.2 (2014), 12 714
Prukpitikul, S., Buakaew, V., Keshdet, W., Kongprom, A., & Kaewpoo, N. (2012). Shoreline Change Prediction 715
Model for Coastal Zone Management in Thailand. Journal of Shipping and Ocean Engineering, 2, 238-243 716 Robichaud, A., Simard, I., & Chelbi, M. (2012). Erosion et infrastructures à risque à Sainte-Marie-Saint-Raphaël, 717
Péninsule acadienne, Nouveau-Brunswick. In (p. 39) 718
Romine, B.M., & Fletcher, C.H. (2012). A summary of historical shoreline changes on beaches of Kauai, Oahu, and 719
Maui, Hawaii. JOURNAL OF COASTAL RESEARCH, 29, 605-614 720
Salghuna, N.N., & Bharathvaj, S.A. (2015). Shoreline Change Analysis for Northern Part of the Coromandel Coast. 721
Aquatic Procedia, 4, 317-324 722
Serantoni, P., & Lizaud, O. (2000-2010). Suivi de l évolution des plages de la commune Hyères-les-palmiers. In 723
SOGREAH (1988a). Défense du littoral oriental du golfe de Giens. In (p. 50 + annexes) 724 SOGREAH (1988b). Protection du tombolo Ouest. In 725
Than, V.V. (2015). Modélisation d'érosion côtière : application à la partie Ouest du tombolo de Giens. In, LATP (p. 726
400). Marseille: Aix Marseille Université 727
Thieler, E.R., & Danforth, W.W. (1994). Historical Shoreline Mapping (I): Improving Techniques and Reducing 728
Positioning Errors. JOURNAL OF COASTAL RESEARCH, 10, 549-563 729
Thieler, E.R., Himmelstoss, E.A., & Miller, T. (2005). Digital Shoreline Analysis System (DSAS) version 3.0: An 730
ArcGIS extension for calculating shoreline change. In, Extension for ArcGIS 731
Thieler, E.R., Martin, D., & Ergul, A. (2003). The Digital Shoreline Analysis System, version 2.0: Shoreline change 732 measurement software extension for ArcView. In, Extension for ArcGIS 733