analysis of soy natural products and esterase enzymes for · pdf file ·...
TRANSCRIPT

The University of ToledoThe University of Toledo Digital Repository
Theses and Dissertations
2011
Analysis of soy natural products and esteraseenzymes for drug developmentCrystal A. JurkiewiczThe University of Toledo
Follow this and additional works at: http://utdr.utoledo.edu/theses-dissertations
This Thesis is brought to you for free and open access by The University of Toledo Digital Repository. It has been accepted for inclusion in Theses andDissertations by an authorized administrator of The University of Toledo Digital Repository. For more information, please see the repository's Aboutpage.
Recommended CitationJurkiewicz, Crystal A., "Analysis of soy natural products and esterase enzymes for drug development" (2011). Theses and Dissertations.601.http://utdr.utoledo.edu/theses-dissertations/601

A Thesis
entitled
Analysis of soy natural products and esterase enzymes for drug development
by
Crystal A. Jurkiewicz
Submitted to the Graduate Faculty as partial fulfillment of the requirements for the Master of Science degree in Pharmacology and Toxicology
____________________________________ Dr. Paul Erhardt, Committee Chair
____________________________________ Dr. Jeffery Sarver, Committee Member
____________________________________ Dr. Ezidhar Hassoun, Committee Member
____________________________________ Dr. Patricia R. Komuniecki, Dean
College of Graduate Studies
The University of Toledo
August 2011


iii
An Abstract of
Analysis of soy natural products and esterase enzymes for drug development
by
Crystal A. Jurkiewicz
Submitted to the Graduate Faculty as partial fulfillment of the requirements for the Master of Science Degree in Pharmacology and Toxicology
The University of Toledo May 2011
Two broad subjects of the drug development process are covered in this thesis,
because of this the first chapter gives needed background information in order to fully
understand the projects presented in the next two chapters. The first chapter deals with
identification of a source for scale-up production of an active pharmaceutical ingredient
(API) for possible future investigational new drug submission. Glyceollin‟s (GLY‟s) or
phytoestrogens that are made in soy plants in response to stress, have been implicated in
the treatment for breast and prostate cancer. In order to determine relative amounts of the
GLY‟s in the plants, we have undertaken several studies. Firstly, we have performed
preliminary tests on extracts from various parts of the plant (roots, stems, leaf, seed and
seed pod) to determine the amounts of GLY produced. It has been demonstrated that
most of the GLY is generally found in the roots as this is where the cyst root nematode
(CRN) attacks the plant. Decreasing amounts of GLY are found further away from the
roots>>stem>>leaf>>seed pod>>seeds. Extraction of the GLY‟s from the roots of CRN
infected soybean plants is a viable source for the anti-estrogenic GLY I (-).
Lastly, we investigated the possibility that the soybean plant stores glycosylated

iv
forms of the GLY‟s for use when the plant is attacked or stressed. Extractions taken from
the roots of the soybean plant were incubated with the enzyme β-glucosidase. The results
showed no evidance of glycosylated forms of the GLY‟s present in the roots of the plant.
The second chapter shows the development of a screening assay that could be
used to help identify or narrow the list of lead candidates for pre-clinical drug testing.
Carboxylesterase (CES) is a drug metabolizing enzyme present predominatly in the liver.
It is involved in not only the biotransformation of API‟s for purposes of excretion, but
also largly associated with the activation of prodrugs. A spectrophotometric assay was
designed to measure the kinetic parameters of CES with the intensily studied and
characterized drug procaine. This assay is intended to be used to identify activity of this
enzyme with new drug products, along with characterizing it‟s pharmacokinetic behavior
using comparisons of Km and Vmax. Verification of the most ideal conditions to test the
rate of conversion were conducted, proving a pH of 7.4 and a temperature of 37°C to be
optimal. These conditions were used to measure the Km and Vmax of procaine with the
CES enzyme.

v
Acknowledgments
I would like to thank The Center For Drug Design and Development (CD3) for
the opportunity to work with some absolutely brilliant scientists. The CD3 and all of the
people associated with the CD3 have provided me a solid foundation on which I intend to
build an amazing career.
My career and my education have benefited from the support and encouragement
from my advisor Dr. Erhardt. Thank you for so many things, but mostly for working so
hard to provide a place like the CD3, that creates opportunities for scientists from a wide
range of disciplines to work together and learn from each other.
Dr. Sarver, I thank you for all of your help with putting my thesis together, for all
of the answers to my many questions, and especially for your „happy to help‟ attitude you
always show with any problem. I have learned a lot from you over these past few years,
and I am a much better scientist for having known and worked with you.
Dr. Hassoun, thank you for helping me finish up my master‟s requirements, for
serving on my committee and for taking the time to help me through this process. Dr.
Trendel thank you for taking on the not so easy job of helping me start the writing
process. Nicole Bearss for listening and understanding everything.
I would finally like to thank my family, in particular my mom because she is an
amazing person, and I owe who I am today to her. As well as my husband Nick, for
putting up with me, for pushing me to be better, and for loving me.

vi
Contents
Abstract iii
Acknowledgments v
Contents vi
List of Tables viii
List of Figures ix
1 General Comments 1
2 Isolation of Glyceollins in Soybean Plants 5
2.1 Introduction 5
2.2 Materials and Methods 10
2.2.1 Analytical Instrumentation 10
2.2.2 Reagents 10
2.2.3 HPLC Conditions 11
2.2.4 Mass Spectrometric Conditions 11
2.2.5 Processing Soybean Plants From the Field For Analysis 12
2.2.6 Total GLY Extraction From Soybean Plant Parts 14
2.2.7 Incubation Studies With β-Glucosidase 15
2.3 Results 16
2.3.1 Total GLY Extraction From Soybean Plant Parts 16

vii
2.3.2 Incubation Studies With β-Glucosidase 22
2.4 Conclusion 25
3 Development of a Screening Assay For Measuring Carboxylesterase Activity 27
3.1 Introduction 27
3.2 Materials and Methods 34
3.2.1 Reagents and Equipment 34
3.2.2 Spectrophotometric Readings 35
3.2.3 Enzyme Stability Tests 35
3.2.4 Calibration Curve Validation 36
3.2.5 Enzyme Concentration Tests 37
3.2.6 Selecting Assay Buffer pH 38
3.2.7 Selecting Assay Temperature 38
3.2.8 Assay For Measuring Km and Vmax 39
3.2.9 Method For Calculating 39
3.3 Results 40
3.3.1 Enzyme stability tests 40
3.3.2 Calibration curve validation 42
3.3.3 Enzyme concentration tests 47
3.3.4 Effects of buffer pH 50
3.3.5 Effects of temperature 51
3.3.6 Assay for measuring Km and Vmax 53
3.4 Conclusion 57
References 59

viii
List of Tables 2.1. Compound Specific MS Conditions. 12 2.2. Calibration Curve and QC Results. 19 2.3. Amount of Total Glyceollin Found in 100 mg of Dry Plant Material. 20 2.4. Amount of GLY I Extracted From the Roots of Soy Plants on Different Days Post CRN Penetration [Haung and Baker, 1991]. 22 2.5. Initial Peak Areas of Glyceollins, Daidzin, and Daidzein For Each of the Samples Used For Incubation Testing, Represented By Mean ± 95% CI. 23 3.1. Summary of Activity of Enzyme in Water Stored at 4°C. 41 3.2. Correlation Coefficient Values for the Calibration Curves. 43 3.3. Correlation Coefficient Values For the Calibration Curves. 45 3.4. Correlation Coefficient Values for the Calibration Curves. 47 3.5. Summary of Assay pH Testing With 4-MBA. 51 3.6. Summary of Assay Temperature Testing With pNPA. 52 3.7. Measurements of Km and Vmax. 55

ix
List of Figures 2.1. Chemical structures of glyceollin isoforms GLY I, II, and III. 6
2.2. Common isoflavones present in the soybean plant as both glycosides and aglycones. Glu signifies incorporation (glycosylation) of a glucose molecule. 10 2.3. A representative chromatogram for the detection of total glyceollin content. 16 2.4. A. The total ion chromatogram which represents the sum of channels 1, 2 and 3. B. Channel 1 represents the transition from m/z 321 to 305 for glyceollin. C. Channel 2 represents the transition from m/z 417 to 255 for daidzin. D. Channel 3 represents the transition from m/z 255 to 137 for daidzein. 17 2.5. Calibration curve comparison of Glyceollin I racemic, Glyceollin I (-), Glyceollin II (-), and a mixture of Glyceollin I, II, and III. 18 2.6. Representative calibration curve for total glyceollin. 19 2.7. Total GLY accumulation in ng/100 mg of soybean plant material from several different cultivars harvested from CRN infected research fields. 21 2.8. Percent of initial peak areas for the glyceollins in soy extract samples incubated at 37°C with β-glycosidase (solid circles, solid line) and without enzyme (open squares, dashed line). * indicates a significant difference (p < 0.05) versus corresponding initial peak area, while ^ indicates significant difference (p < 0.005) versus corresponding peak area without enzyme. 24 3.1. Conversion of ethyl butyrate to butyric acid and ethanol by the CES enzyme. 32 3.2. Conversion of 4-MBA to 4-MBO by the CES enzyme. 33 3.3. Conversion of 4-nitrophenyl acetate to 4-nitophenol by the carboxylesterase enzyme. 33

x
3.4. Conversion of Procaine to PABA by the carboxylesterase enzyme. 34 3.5. Results of stability testing done with rabbit CES stored at 1,000 U/ml in water for six months at 4°C 41 3.6. Representative calibration curves in citrate buffer (pH 4-6) and TRIS buffer (pH 6-8)for the substrate 4-MBA. 42 3.7. Representative calibration curves in citrate buffer (pH 4-6) and TRIS (pH 6-8) for the product 4-MBO. 43 3.8. Representative calibration curves in TRIS buffer (pH 6-8) for the substrate pNPA. 44 3.9. Representative calibration curves in TRIS buffer (pH 6-8) for the product pNP. 45 3.10. Representative calibration curve for the substrate procaine and the product PABA in TRIS buffer pH 7.4 at 265 nm. 46 3.11. Representative calibration curve for the substrate procaine and the product PABA in TRIS buffer pH 7.4 at 290 nm. 47 3.12. CES enzyme concentration testing using 4-MBA as a substrate. 48 3.13. CES enzyme concentration testing using pNPA as a substrate. 48 3.14. CES enzyme concentration testing using procaine as a substrate. 49 3.15. Results of the testing done to study the effects of buffer pH on enzyme activity using 4-MBA as a substrate. 50 3.16. Results of the temperature optimization assay using pNPA as a substrate in tris buffer. 52 3.17. Saturation curve for rabbit CES showing the relationship between substrate concentration and reaction rate. 53 3.18. Eadie-Hofstee plot used to calculate the initial guess of Km and Vmax. 54 3.19. Reaction rate vs. substrate concentration plot for both procaine and PABA showing the non-linear regression fit. 55

1
Chapter 1-General Comments
Drug design and development are key aspects of the overall process of
pharmaceutical research during which possible therapeutic agents are identified and
characterized by their pharmacodynamic behavior. Designing a new drug entity falls
under the discipline of medicinal chemistry, which includes developing novel chemical
structures that show biological function, or studying existing drugs for a new therapeutic
use. This stage of the initial process produces a large list of possible drug candidates, all
of which need to be screened for an intended use. Screening assays are developed in
order to narrow this large list to one or two lead compounds for further development.
Targeted, robust screening assays are important at this stage in order to make the most
informed decision on which drug candidate has the most potential for successfully
fulfilling the intended therapeutic need and making its way through the regulatory drug
approval process. This thesis investigates two aspects of the drug development process:
the first being characterization of a lead drug candidate and its potential natural sources
for agent production; and the second in developing a screening assay that could be used
to better understand the pharmacokinetic behavior of a new drug candidate.
The medicinal value of plants has been recognized by nearly every culture on
every continent around the world. Since the beginning of recorded history and into the
nineteenth century, bioactive natural products, particularly those originating from a plant
species, provided the main source of medicines [Sneader, 2001]. Synthetic chemistry

2
developed rapidly in the second half of the nineteenth century giving scientists a new
approach to developing and understanding the medicinal properties of compounds
constructed entirely in the lab. In recent years, however, drug discovery work has been
combining these two efforts by identifying lead agents in plants and then synthetically
making changes to the compound to boost its therapeutic effect [Historical Background,
(n.d.)]. Natural products still play a major role in drug treatment, as over 50% of the
most-prescribed drugs in the US had a natural product either as the drug, or as the model
in the synthesis or design of the drug [Grifo, et al., 1997]. For example Taxol, an anti-
cancer drug, was derived from the Pacific Yew tree. Cocaine from coca plants served as a
model for a vast number of local anaesthetics, such as procaine, with the marketed name
Novacain [Fakim, 2006].
In the first chapter of this thesis an investigation into a soy-derived natural
product called glyceollin is presented. Glyceollin is part of a family of compounds known
as isoflavones. Soy isoflavones first started being studied when an epidemiological study
of diet and disease showed that women in Japan, who have a diet high in soy, had a lower
incidence of cardiovascular disease, hormone dependent cancers, and menopausal
symptoms than women in Western societies [Schmid, 2002]. This study sparked interest
in identifying which components of the soy plant were responsible for these findings.
Many of the isoflavones are phytoestrogens due to the similarity in their chemical
structure to that of the human hormone estrogen. Because of this relationship, the
isoflavones have been thought to be the reason for the findings in the epidemiological
study related to hormone dependent cancers. Glyceollins are different from other soy
isoflavones in that they are produced in the soybean plant in response to plant pathogens

3
and related stress factors. In 2006 Salvo et al. identified the glyceollins as having activity
against breast and ovarian cancer, and in 2009 Payton-Stewart showed some promising
results with prostate cancer [Salvo et al., 2006; Payton-Stewart, Schoene, et al., 2009].
For the past few years a considerable amount of work has been done in finding a source
for this material. An investigation into the amount of the glyceollins produced in the
soybean plant is considered in Chapter 1.
Billions of dollars are spent in the US each year on drugs that never make it to the
market because of the lack of ability to identify potential issues with the drug once it is
given to the human population. If there were a way to better understand these possible
issues in the early stages of development, the quality of the drugs would improve. There
are many different questions that need to be answered about the disposition of the
compound as it travels through the body to its intended target. The FDA uses the
acronym ADMET, which stands for Absorption, Distribution, Metabolism, Excretion,
and Toxicity to describe how a drug interacts with the body. Absorption describes how a
drug gets into the blood stream, such as through the intestines from swallowing a pill,
through the mucus membranes in the mouth, or through the skin from topical application.
Once a drug is in the blood it has the potential to distribute into tissues or organs, get
metabolized by biotransformation enzymes, and eventually excreted in the urine or feces.
Toxicity can be associated with the drug itself or its metabolites. A clear understanding of
all of these properties is important in the development of a new drug.
During drug design and development, identifying a compound to investigate for
possible disease fighting properties is only the first step towards marketing that
compound for human use. The road a compound has to take before even being able to

4
begin testing within human subjects is long, expensive, and nine-out-of-ten times a dead-
end. The second chapter of this thesis addresses the need for assays that could help
streamline early drug development. Because most of all marketed drugs undergo some
form of metabolism once they are in the body, understanding which enzyme or enzymes
are responsible for this is an important part of early drug development. An in vitro assay
was designed in order to determine and characterize the possible contribution of one of
the drug metabolizing enzymes that is common for ester-containing drug molecules,
namely carboxylesterase (CES). This enzyme is responsible for the hydrolysis of short
chain aliphatic or aromatic esters. It plays an important role in the overall metabolism of
many marketed pharmaceuticals. Identifying this enzyme‟s function in the metabolism of
a new drug entity would be useful not only in ascertaining possible metabolites of the
drug, but also as a tool in designing in vivo studies. For example if it were possible to
relate the enzymatic activity of CES with a new drug compound and compare it to a drug
with a known profile, this could help to establish how to design the initial in vivo testing
protocol.

5
Chapter 2-Isolation of Glyceollin in Soybean Plant Extracts 2.1 Introduction
Phytochemicals are natural chemicals derived from plants. Many of these natural
products have been extensively studied because of their purported protective and disease
preventative properties. Examples of beneficial phytochemicals are lycopene found in
foods such as tomatoes and carrots, isoflavones from soy and red clover plants, and
flavanoids found most commonly in citrus fruit such as grapefruit [Home, (n.d.)].
Isoflavones are often referred to as phytoestrogens or plant hormones because they
commonly resemble the human hormone estrogen. This structural similarity enables them
to mimic the behavior of estrogen in certain tissues in the body, which is thought to
contribute to the health benefits of these compounds [Tilghmas, 1997]. Isoflavones are
found at the highest concentration in the soybean plant, including two of the most
common of these compounds, daidzein and genistein. Many studies have shown that
isoflavones have significant potential to fight disease. Some of these health benefits arise
from the fact that these compounds exhibit both estrogenic and anti-estrogenic effects,
with the type of effect dependant on relative estrogen and isoflavone levels [Mueller,
2004]. The benefits seen from the estrogenic effects of these compounds include relief
from menopausal symptoms and protection from osteoporosis [Isoflavones, 2010]. The
anti-estrogenic effects of these compounds are related to their therapeutic activity against
breast, ovarian and prostate cancers [Isoflavones, 2010].

6
Existing in the same biosynthetic pathway in the soybean plant as daidzein is another
group of phytoestrogens, known as the glyceollins (GLYs) [Oliver, 2003]. The GLYs are
produced when soybean plants become stressed by environmental factors or infections
thought to represent part of the soybean plant‟s defense mechanism to stress, these types
of compounds are also called „phytoalexins‟. The GLYs were studied in the early 1970‟s
in relation to their anti-fungal properties, which led to the identification of three isoforms
of this compound, GLY I-III [Bhattacharyya and Ward, 1986, Burden and Baily, 1975].
The structures of GLY I-III are shown in figure 2.1. Reported relative amounts of these
isoforms found in stressed soy plant tissue vary greatly, but most papers agree that the
GLY I isoform predominates over the other two forms in the seeds and roots of the soy
plant [Huang and Baker, 1991, Bhattacharyya and Ward, 1986].
O
O
OH
O
Glyceollin IOH
O
O
OH
O
Glyceollin II OH
O
O
OH
O
Glyceollin III OH
Figure 2.1. Chemical structures of glyceollin isoforms GLY I, II, and III.
While daidzein has been shown to exhibit estrogenic effects, the GLYs became
compounds of interest due to their anti-estrogenic effects in relation to cancer [Burow, et
al., 2001]. Studies by Wood et al. showed preliminary findings that the GLYs had
possible estrogen modulating properties [Wood , et al., 2006]. Later that year Salvo et al.
published a paper that not only backed-up those preliminary findings, but also showed
that the GLYs inhibited estrogen-induced tumor progression in human breast and ovarian
cancer cells [Salvo et al., 2006]. The estrogen modulating properties demonstrated by
Wood et al., and later by Salvo et al. are important because they show that when these

7
compounds were tested with hormone-dependant cancer cell lines they did not display
agonistic behavior with the estrogen receptor, which would cause tumor growth [Wood et
al., 2006,Oliver et al., 2003]. However, when they were tested with these cell lines in the
presence of 17β-estriodol, they displayed antagonistic behavior with the estrogen
receptor, blocking the 17β-estridol from binding to the receptor and inducing tumor
growth. These studies identified GLYs as a novel class of natural anti-estrogenic
compounds, which could be used not only for the treatment but also potentially in the
prevention of these types of cancers. All of these studies were conducted with a mixture
of the three glyceollin isoforms, extracted from soybean seeds stressed by exposure to
Aspergillus sojae, a fungal infection that serves as an established elicitor in the
production of GLYs [Boue et al., 2000]. Studies conducted later identified GLY I as
having the most potent anti-estrogenic effects of these three isoforms, and it has further
been shown that the GLY I(-) enantiomer is the only chiral form expressed in the soybean
plant [Payton-Stewart and Khupse, et al., 2010].
Breast cancer is the second most common form of cancer and the second leading
cause of cancer deaths in American woman, while ovarian cancer is the ninth most
common form, but the fifth leading cause of death [Breast-Ovarian, (n.d.)]. The high
mortality rate associated with these cancers demonstrates a need for improvement in the
way these diseases are being treated. The studies conducted with GLYs show that these
compounds could be a step forward in the treatment options available for these types of
cancers.

8
In establishing an interest in developing these compounds for further testing, it became
necessary to identify a more plentiful source of this material to allow broadened
experimental evaluation and as a means of scaling-up production for eventual use in
humans.
The cyst root nematode (CRN) is a soil born parasite that attacks the roots of soybean
plants. Infection of the soybean plant by CRNs is an environmental stress very common
to soy plants grown in the Midwest United States. As a response to this environmental
stress, the soy plant produces GLYs to fight off the infection [Gram, et al., 1991]. This
presented a unique opportunity for identifying a natural source of these compounds from
soy plants grown in Ohio fields, as described in the first section of this chapter. The
North Central Agricultural Research Station (NCARS) located in Fremont, Ohio and
operated by Ohio State University has been working on developing soy plant strains that
are resistant to infection by the CRN. In order to investigate these plants as a source of
the GLYs, our labs have collected several samples. Soy plants grown in CRN infected
NCARS test fields from several different seed types, or cultivars, were collected and
separated into their component parts, including roots, stems, leaves, pods, and seeds.
After drying, samples from each of these plant parts were extracted into methanol and
analyzed for total GLY levels. The results of these studies show the relative levels of total
GLY in different plant tissues and indicate which plant parts would be most useful as a
natural source for GLYs.
An important part of this chapter describes further testing performed to characterize
the level of glycosylation of GLYs derived from soy plant materials. Many plant
products, including the isoflavones daidzein, genistein and glycitein in soy plants, are

9
present in plant tissue as both glycosides and aglycones (figure 2.2). Glycolysis is
directly involved in many biochemical adaptations of plant and non-plant species due to
environmental stresses [Plaxton, et al., 1996]. It is thought that glycolysis of certain
compounds in the plant is done for the purposes of storage of these compounds for use at
a later time. For example, GLYs may be produced and stored for later release when the
plant is exposed to stress conditions in which a chemical response is needed. The direct
relationship between daidzein and the GLYs suggests a possibility that the GLYs are
present in both of these forms in the plant. Without proper evaluation, the true amount of
GLYs available in the soy plant materials may be underestimated. In order to determine
whether glycosylated GLYs are present at significant levels in the soy plant, incubation
studies with the enzyme β-glucosidase were performed [Matsuura and Obata, 1993,
EC.3.1.1.1, (n.d.)]. β-Glucosidase is an enzyme that hydrolyzes the terminal, non-
reducing β-D-glucosyl residue of a glycosylated plant molecule, releasing β-D-glucose
and the aglycone form of the compound [Gram et al., 1991]. These incubation samples
were run using a method developed to identify the total GLY content in the plant parts. If
significant amounts of the glycosylated forms of these compounds are present in the
extraction samples, an increased amount of total GLY will be measured after the enzyme
treatment.

10
Figure 2.2. Common isoflavones present in the soybean plant as both glycosides and aglycones. Glu signifies incorporation (glycosylation) of a glucose molecule. 2.2 Materials and Methods 2.2.1 Analytical Instrumentation
An Alliance® HT HPLC (model 2795) equipped with a quaternary pump, a
degasser, an autosampler, and a column oven from Waters Corporation (Milford, MA,
USA) were used. Mass spectrometric analysis was performed using a Quattro Micro™
triple–quadrupole instrument from Micromass (Manchester,UK) equipped with an
ESCi™ multi mode ionization source. MassLynx (version 4.01) software from
Micromass was used for data acquisition and processing. All weighings were done on an
XS205 analytical balance from Mettler Toledo (Columbus, OH, USA). Buffer pH was
adjusted using an Accumet Excel XL15 pH meter from Cole-Parmer (Vernon Hills, IL,
USA).
2.2.2 Reagents
HPLC grade methanol, formic acid, glacial acetic acid, sodium acetate and the
enzyme β-glucosidase were all purchased from Sigma-Aldrich (St. Louis, MO, USA).
The water used in these experiments was purified using a Barnstead International

11
(Dubuque, IA, USA) water purification unit. The argon and nitrogen gas used on the
mass spectrometer was supplied by Airgas (Ann Arbor, MI, USA). Glyceollin I (-),
glyceollin I (racemic) and glyceollin II were received from our center‟s synthetic
chemistry group at the University of Toledo (Toledo, OH, USA). Glyceollin I, II, III
mixture isolated from natural sources was kindly provided by Steven Boue of the USDA
Southern Regional Research Center (New Orleans, LA, USA).
2.2.3 HPLC Conditions
An LC-MS/MS isocratic method was used at a flow rate of 200 μl/min with an
injection volume of 10 μl and a total run time of 3 minutes. The samples that were
analyzed for the detection of total glyceollin from the extraction method were run
through a Gemini C18 analytical column (2.00 mm×100 mm, 5μm) and a guard column
(2.0 mm×10 mm, 5μm) purchased from Phenomenex (Torrance, CA, USA). The samples
that were analyzed for the detection of total glyceollin, diadzein and diadzin from the
enzyme assay were run through a Gemini C18 analytical column (2.00 mm×50 mm, 5μm)
and a guard column (2.0 mm×10 mm, 5μm) purchased from Phenomenex (Torrance, CA,
USA). The mobile phase was 20%-0.1% formic acid in water and 80%-0.1% formic acid
in methanol. A 0.2% formic acid in methanol/water mixture (50:50, v/v) was used as the
needle wash solvent; 0.1% formic acid in water was used as the purge solvent and 100%
methanol was used as the seal wash solvent. The column and samples were kept at
35±5°C and 4±5°C, respectively.
2.2.4 Mass Spectrometric Conditions
MS detection was used with the electro-spray ionization (ESI) source in the
positive mode using the following source settings. Nitrogen was used as the desolvation

12
and cone gas, and was set at a flow rate of 700 L/h and 25 L/h, respectively; the source
and desolvation gas temperatures were 120°C and 350°C, respectively. The ESI source
tip (capillary) voltage was 3.3 kV, extractor was 2V, ion energy for MS1 was 1.0V and
for MS2 was 0.5V. The MS was operated in the MRM mode with argon gas used as the
collision gas. The argon gas cell pressure was approximately 3.1×10⁻³ mbar. The dwell
time for detection of each compound was 200 ms. Full-scan mass spectra of each
compound was obtained by direct infusion into the ESI source at a flow rate of 5 μl/min.
Protonated molecular ions (parent-ions) were produced and optimized using the first
quadrupole analyzer. Collision-induced fragmentation was achieved using suitable
collision energy to produce product-ions within the second quadrupole. The specific
parameters for each compound are shown in Table 2.1.
Table 2.1. Compound Specific MS Conditions. Compound Detected
ions Parent-ions (m/z)
Product-ions (m/z)
Cone Voltage (V)
Collision Energy (V)
Glyceollins [M-H2O]+ 321 305 45 32
Daidzin [M+H]+ 417 255 22 15 Daidzein [M+H]+ 255 137 42 30
2.2.5 Processing Soybean Plants From the Field For Analysis
Soybean plants were collected from the North Central Agricultural Research
Station research field located in Fremont, Ohio. Five different soybean cultivars were
collected, all having a different cyst root nematode resistance package. The seed types
with the resistance package in parentheses included Peking (SC9288), Gries (PI88788),
L2620RX (CystX), S32-E2 (PI 188788), and S30-D4 (Susceptible). These plants were
harvested 120 days post planting. All plants were immediately separated into their

13
component parts, including seeds, pods, stems, leaves, and roots, and placed in open
containers. All samples were then allowed to air-dry at room temperature in a dark, low
humidity environment for two weeks.
The component samples of each plant part were then cut into smaller pieces using
scissors and/or a sharp blade. Roots and stems were sliced into 1-2 cm long segments,
with thicker segments halved or quartered lengthwise. Leaves and seed pod casings were
cut into pieces approximately 1cm x 1cm. Small seeds were sliced in half, while larger
seeds were quartered. All samples were then air-dried at room temperature for another 2
weeks.
At the end of this second drying period, each component plant part was processed
in a Krups model F203 grinder for 2-3 minutes to give a relatively homogeneous particle
size. All samples were then air-dried at room temperature for another 2 weeks. The
materials were then screened through a #25 sieve into Petri dishes. Coarse materials
collected on the sieve for each sample were processed for an additional 2-3 min with the
Krups grinder, and re-sieved into the corresponding Petri dish. Each of these samples was
then dried a final time for 3 days at 50°C.
At the end of this final drying process, the dried materials from each sample were
screened through a #25 sieve onto a clean sheet of paper. The resulting powder was
transferred into an amber glass vial, and sealed tightly with a Teflon-lined lid. Each
sample was then assigned a unique sample ID number and stored at room temperature for
subsequent extraction and chromatographic analysis. Once all of the samples were died, a
total of 25 samples were ready for analysis. This included 5 different plant parts, from 5
different cultivars.

14
2.2.6 Total GLY Extraction From Soy Plant Parts
Approximately 100 mg of dry plant powder was placed into a 25 ml round-bottom
flask. The exact amount weighed into each flask was recorded. Approximately 10 ml of
HPLC grade methanol was added to the dry plant powder in the 25 ml round-bottom
flask. The flask was then placed in a heating mantle with a water-cooled glass condenser
attached to the opening of the flask to stop methanol evaporation. The sample was then
refluxed at 78°C for 2 hours [Boue et al., 2000].
The methanol was collected and an additional 10 ml of fresh methanol was added
to the powder and again heated to reflux for 2 hours. This process was repeated a third
time and all three extractions were then combined. The vials that these three extractions
were combined in were weighed before the samples were combined and then again after
mixing. These weighings were used to calculate the exact volume of methanol used for
extraction, by dividing the mass difference by the density of methanol, which is 0.7918
g/ml.
The sample was then filtered with a Titan syringe filter consisting of a glass wool
prefilter and a 0.45 µm final filter. 200 μl of each sample was put into a 0.3 ml HPLC
micro vial for LC-MS-MS analysis using the LC-MS/MS conditions described above to
measure total glyceollins. The remaining extraction sample was stored at 4°C for future
testing.
A calibration curve with two quality control (QC) samples of GLY I were made
and run with each set of samples obtained from the extraction process. Two stock
solutions of GLY I were prepared in methanol at 1.00 mg/ml, one stock used to prepare
the standards while the other was used to prepare the QC samples. The calibration curve

15
prepared for GLY I was from 1-10,000 ng/ml, and the three QC samples were 2, 300 and
7000 ng/ml.
2.2.7 Incubation Studies With β-Glucosidase The positive control for the experiment with β-glucosidase was daidzin, a known
substrate for β-glucosidase which converts daidzin to daidzein [Matsuura and Obata,
1993]. Diadzin is known to be produced in the same stress-induced biosynthetic pathway
as glyceollin in the soy plant [Matsuura and Obata, 1993]. Preliminary tests on extracts
from soy plant roots showed the presence of both daidzin and daidzein at concentrations
sufficient to serve as an endogenous positive control to monitor the activity of the β-
glucosidase enzyme.
Four milliliters of the methanolic extract described in the previous section was dried
completely on a rotary evaporator and then resuspended in 8.1 ml of 100 mM sodium
acetate buffer (pH 5) and 180 μl was aliquoted into microcentrifuge tubes. These tubes
were incubated for 10 min at 37°C in a water bath shaking incubator. 20 μl of enzyme
was added to the reaction samples while 20 μl of water was added to the control samples.
Enzyme activity was stopped at various time points by addition of 800 μl of methanol.
The samples were then centrifuged at 10,000 rpm for 5 minutes and 200 µl of the sample
was transferred to a 0.3 ml HPLC micro vial for LC-MS/MS analysis using the
instrument conditions described for glyceollin, daidzein and daidzin. Preliminary testing
showed that the conversion of daidzein to daidzin was very quick and completed in less
than 15 min. Therefore sample time points for this assay were chosen at 0, 2, 4, 6, 10, and
15 minutes.

16
2.3 Results
2.3.1 Total GLY Extraction From Soy Plant Parts
A representative chromatogram using the detection method described for total
glyceollin is shown in figure 2.3.
Figure 2.3. A representative chromatogram for the detection of total glyceollin content. A representative chromatogram for the detection of total glyceollin, daidzein, and
daidzin is shown in figure 2.4. All samples were analyzed by averaging triplicate
injections.

17
Figure 2.4. A. The total ion chromatogram which represents the sum of channels 1, 2 and 3. B. Channel 1 represents the transition from m/z 321 to 305 for glyceollin. C. Channel 2 represents the transition from m/z 417 to 255 for daidzin. D. Channel 3 represents the transition from m/z 255 to 137 for daidzein.
As GLY I, II and III all share the same molecular weight, along with having a
very similar chemical structure, chromatographic separation of these three compounds
proved to be difficult. Since it has been shown previously that the extraction method will
completely extract all three of these compounds from the plant, identifying what ratio of
these compounds was being seen in the LC-MS/MS detection method also needed to be
further addressed. The method that is described in this chapter for the detection of GLY
was developed using pure GLY I. A sample of pure GLY II was obtained and was
infused on the mass spectrometer. GLY II proved to behave the same as GLY I by
A
B
C
D

18
sharing the same ionization fingerprint. They not only both lose a water molecule during
the ionization process and pick up hydrogen, but they also fragment to an ion with m/z of
305 in the collision cell. Calibration curves of these two compounds were made to
compare how similar their detection was using the same method with LC-MS/MS to
detect both. The slope for the curve for GLY II was greater than for GLY I. This is shown
in figure 2.5. The differences in the calibration curves were attributed to the efficiency
with which the two different compounds ionize when injected into the mass spectrometer.
It was theorized that GLY III would exhibit similar behavior. Because of differences in
ionization efficiencies for GLY I, II, and III, the detection of total GLY in this method
should be considered semi-quantitative.
Figure 2.5. Calibration curve comparison of Glyceollin I racemic, Glyceollin I (-), Glyceollin II (-), and a mixture of Glyceollin I, II, and III.
The response for the total GLYs was found to be linear from 1-10,000 ng/ml with
a correlation greater than 0.99. Amounts of GLY found in each plant part were calculated
using log-log (Power equation) regression of the calibration curve. Figure 2.6 shows a
020000400006000080000
100000120000
0 5000 10000 15000
Peak
Are
a
Concentration (ng/ml)
Calibration Curve comparison
Glyceollin I racGlyceollin I (-)Glyceollin II (-)Glyceollin mix

19
representative calibration curve for total glyceollin and Table 2.2 shows the statistical
results for the calibration curve and the QC samples.
Figure 2.6. Representative calibration curve for total glyceollin.
Using a Power equation calibration curve to predict the concentrations in the
standards produces a relative error of less than 10%. The calibration curve predicts the
concentrations of the QC samples with less than 10% error at the mid and high level, but
the low QC has a relative error larger than 20%. This shows that there would be a large
y = 7.1516x0.9482
R² = 0.9998
01000020000300004000050000
0 5000 10000 15000
Peak
Are
a
Concentration (ng/ml)
Calibration and Control samples of Glyceollin I
Standards
Control
Table 2.2. Calibration Curve and QC Results.
Concentration (ng/ml)
Peak Area std dev
calculated conc.
(ng/ml) % CV % RE
Stan
dard
s
1 6.97 0.73 0.97 10.45% -2.68% 5 32.29 0.83 4.90 2.58% -1.96% 25 149.61 3.06 24.70 2.05% -1.20% 100 591.45 23.55 105.26 3.98% 5.26% 500 2808.85 68.18 544.32 2.43% 8.86%
3,000 13973.26 2277.04 2955.93 16.30% -1.47% 10,000 41828.66 470.67 9394.79 1.13% -6.05%
QC
2 17.01 1.88 2.49 11.03% 24.71% 300 1743.78 51.11 329.24 2.93% 9.75%
7,000 30656.21 281.52 6769.52 0.92% -3.29%

20
amount of error associated with the extraction samples that had a concentration of 2
ng/ml or less. For the purposes of this study, this larger error at the low end of the curve
will not significantly affect the determination of relative GLY levels in different plant
parts.
Using the calibration curve from the same run, the concentration of total GLY
was calculated in each sample. Equations 2.1 and 2.2 were used to calculate the amount
of total GLY found per 100 mg of each plant part. A summary of these results are shown
in Table 2.3.
(eq. 2.1)
(eq. 2.2)
Table 2.3. Amount of Total Glyceollin Found in 100 mg of Dry Plant Material.
Seed Type (resistance package)
Seeds (ng)
Stems (ng)
Leaves (ng)
Pods (ng)
Roots (ng)
Peking (SC9288) 207 ± 22
14,084 ± 1,695
7,057 ± 1,069
8,739 ± 2,167
73,557 ± 3,426
Gries (PI88788) 178 ± 5
5,969 ± 492
10,729 ± 1,361
13,125 ± 1,900
57,734 ± 5,802
L2620RX (CystX) 21 ± 4
21,277 ± 1,909
9,380 ± 50
4,714 ± 516
56,233 ± 7,764
S32-E2 (PI88788) 29 ± 2
17,245 ± 471
3,806 ± 174
12,970 ± 1,330
44,481 ± 6,443
S30-D4 (Susceptible) 165 ± 15
10,309 ± 509
7,676 ± 400
6,175 ± 913
64,394 ± 7,775

21
Figure 2.7 shows a comparison of the total amount of the GLYs found in each of
the different seed types. This graph shows that the amount of total GLY produced by the
plant is generally the same regardless of the resistance of the strain to the CRN infection.
Figure 2.7. Total GLY accumulation in ng/100 mg of soybean plant material from several different cultivars harvested from CRN infected research fields. A paper published in 1991 by Huang and Baker reported the amount of GLY I
found in the roots of soy plants infected with CRN under the controlled conditions of a
laboratory [Huang and Baker, 1991]. Extraction of total GLY was conducted using a
method similar to the one described in this Chapter, and detection of the three GLY
isomers was achieved using an HPLC based separation method. Total GLY was extracted
from the roots of the soy plants 2, 4, 6, and 8 days post penetration of the CRN. The seed
types used for these experiments were a resistant cultivar, Centennial and a susceptible
cultivar, Ransom. The amount of GLY I found in these plants is shown in Table 2.4.
GLY II was not found to be present in any of the extracts, and GLY III was found at low
levels only in the Centennial seed type, 8 days post penetration.
0
20000
40000
60000
80000
100000
120000
SC9288 (Peking)
Gries (PI88788)
L2620RX (Cyst X)
S32-E2 (PI88788)
S30-D4 (Susceptible)
Tota
l GLY
(ng)
Comparison of Total Gly found in soy plants to Seed Type and Resistance

22
Table 2.4. Amount of GLY I Extracted From the Roots of Soy Plants on Different Days Post CRN Penetration [Haung and Baker, 1991].
2 days 4 days 6 days 8 days Ransom 5.5 7.5 7 6.5 Centennial 12 19 23 16 Amount is µg of GLY I/gram root material
What these findings seem to indicate is that once the CRN penetrates the roots,
GLY I production increases for a period of time and then begins to decrease. This could
mean that there is a period of time post CRN penetration during which the plant is
producing the maximum amount of GLY I. The studies conducted in this Chapter
harvested plants 120 days post planting, or well after CRN penetration, which means
there may be a potential for extracting a larger amount of GLY I from plants harvested
earlier in the growing season. A new set of studies are being planned to look at the
amount of GLY I present in plants harvested in the early, mid and late parts of the
growing season.
2.3.2 Incubation Studies With β-Glucosidase Table 2.5 shows the initial peak areas for all three compounds during the enzyme
incubation study. These peak areas were calculated with a 95% confidence interval by
averaging the peak areas of the three individual tests that were performed on the root
extract samples.

23
Table 2.5. Initial Peak Areas of Glyceollins, Daidzin, and Daidzein For Each of the Samples Used For Incubation Testing, Represented By Mean ± 95% CI.
Sample Glyceollins Peak Area
Diadzin Peak Area Daidzein Peak Area
1 2658 ± 93 5479 ± 234 3175 ± 83
2 2658 ± 227 7811 ± 460 5986 ± 144
3 3363 ± 97 3509 ± 415 2989 ± 321
Statistical analyses were performed by two-way ANOVA, with p < 0.05 used as
the criteria for significant differences. As seen in the graphs in figure 2.8, none of the
incubations exhibited statistically significant differences versus initial peak area without
added enzyme. Daidzin and daidzein peak areas were significantly different than initial
peak areas for all incubation times with added enzyme, with daidzin peak areas
decreasing and daidzein peak areas increasing as the enzyme converted glycosylated
daidzin to aglycone daidzein. Daidzin and daidzein peak areas with enzyme were also
significantly different than the corresponding incubation samples without enzyme at all
tested incubation times. Incubation of glyceollin with enzyme exhibited no significant
differences in peak areas versus the initial peak area or versus the corresponding
incubation without enzyme.
Based on a POWER analysis using the measured average glyceollin peak area
coefficient of variation (CV%) of 2.3%, these tests should have been able to detect an
enzyme-induced change in glyceollin peak area with p < 0.05 at a POWER of 0.800 if the
level of glycosylated glyceollins was 4.8% or higher. Thus, these results strongly indicate
that, if present at all, the levels of glycosylated glyceollins are less than 5% in these soy
extract samples.

24
0
20
40
60
80
100
120
0 2 4 6 8 10 12 14 16
Glyceollins
Per
cent
of I
nitia
l Pea
k A
rea
(%)
Incubation Time (min)
0
40
80
120
160
0 2 4 6 8 10 12 14 16
Daidzein
Per
cent
of I
nitia
l Pea
k A
rea
(%)
Incubation Time (min)
*^*^
*^ *^ *^
0
20
40
60
80
100
120
0 2 4 6 8 10 12 14 16
Daidzin
Per
cent
of I
nitia
l Pea
k A
rea
(%)
Incubation Time (min)
*^
*^*^
*^ *^
Figure 2.8. Percent of initial peak areas for the glyceollins in soy extract samples incubated at 37°C with β-glycosidase (solid circles, solid line) and without enzyme (open squares, dashed line). * indicates a significant difference (p < 0.05) versus corresponding initial peak area, while ^ indicates significant difference (p < 0.005) versus corresponding peak area without enzyme.

25
2.4 Conclusion
Based on the results of the extraction of GLY from the different plant parts, it is
clear that the roots of the plant after attack by CRNs provide the most concentrated
source of GLY I. From an agricultural stand point this finding is most ideal in that the
roots of the soybean plant are left in the field after harvest by the farmer. If a use for this
part of the plant is identified, it would make the soybean plant a much more lucrative
crop, especially for farm fields in the Midwest United States which are plagued by the
presence of the cyst root nematode found in the soil in this part of the country.
While these experiments provide some early indication about the possibility of
attaining GLY I (-) after harvest of soybean plant parts, additional work is needed to
more fully define the usefulness of this source for future scale-up production of GLYs.
Efforts are underway to develop a better detection method in order to distinguish between
GLY I, II and III. Once that method is developed, it will provide a way of distinguishing
how much of the total GLY detected is actually GLY I (-).
A study of the amount of GLY I (-) present in plants harvested at different times
during the growing season could indicate the potential for extracting a larger amount of
total GLY than what was presented here.
The next step would then be to identify a method of isolating and purifying these
three compounds from the mixture of molecules present in the source material. Once that
is accomplished, larger-scale production and further testing the anti-cancer effects of
GLY I (-) could begin.
The results of the β-hydrolase incubation studies done with the soy extract
samples answer an important question. They show that it is unlikely that the GLYs are

26
stored in a glycosylated form in the plant. This makes our measurement of the amount of
total GLY that could be extracted from the roots of the plant that much more meaningful.
The potential for finding glycosylated GLY still exists in the extractions taken from other
parts of the plant. In order verify completely that no glycosylated forms of the glyceollins
are present, the extractions taken from the other parts of the plant would need to be
testing using the incubation study conducted here.

27
Chapter 3-Development of a Screening Assay For Analyzing Carboxylesterase Activity 3.1 Introduction
According to the FDA draft guidance on drug interaction studies, an adequate
assessment of the safety and effectiveness of a drug includes a description of its
metabolism and the contribution of metabolism to overall elimination [Food and Drug,
2006]. The function of the metabolism (or biotransformation) of a xenobiotic agent such
as a drug is to change the chemical structure of the compound so it can be more readily
excreted from the body. Metabolites are typically less active than their precursor forms.
For some drugs, however, metabolites can be the primary therapeutic form, with the
starting drug having little or no beneficial activity without biotransformation [Sanghani,
et al., 2003]. Drug agents that utilize this type of bioactivation are known as prodrugs.
Medicinal chemists design some molecules to utilize this prodrug bioactivation process in
order to overcome problems associated with direct delivery of the active form, such as
making a prodrug that is more readily absorbed from the intestines to improve the
bioavailability [Erhardt, et al., 2010]. Once the drug is in the body, the prodrug is
converted into the therapeutic chemical structure by drug metabolizing enzymes. Note
that for both drugs and prodrugs, some biotransformation processes can also change the
chemical structure of the compound into an undesired inactive or even toxic metabolite.
It is common for a doctor to prescribe more than one drug for a patient at the
same time while in treatment. Because of this frequent practice, an understanding of how

28
two or more drugs will interact in the body is needed to avoid loss of efficacy or toxic
exposure for one or the other drug. If two drugs are given concomitantly and share the
same elimination pathway, one might compete with the other during the elimination
process causing one or both of the drugs to deviate from their normal pharmacokinetic
profile [Quinney, et al., 2005]. This could result in the drug concentration reaching toxic
levels that cause undesired side effects including possible death of the patient, or the drug
not achieving the concentration needed to elicit its therapeutic effect. Identifying the
enzyme or enzymes involved in the metabolism of a drug can help to not only
characterize the elimination pathway of that drug, but also in identifying metabolites that
have the potential for causing toxic effects or additional drug interactions.
Drug metabolizing enzymes are a broad group of proteins that are typically
expressed at the highest levels in the liver, and are involved in the clearance of not only
xenobiotics including drugs and environmental pollutants, but also endogenous
compounds such as steroids and fatty acids [Guengerich, 1995]. The enzymes involved
in the metabolism of drugs belong to one of two groups, phase I or phase II enzymes.
These categories describe the type of biotransformation reaction the enzyme performs on
substrates. Phase I enzymes use functionalization reactions, which include oxidation,
reduction, or hydrolysis [EC.3.1.1.1, (n.d.)]. Phase II enzymes use biosynthetic reactions
which are conjugation reactions [EC.3.1.1.1, (n.d.)].
This chapter focuses on the phase I enzyme carboxylesterase (CES), which is a
hydrolytic enzyme present in many tissues throughout the body, but predominately in the
liver [Satoh and Hosokawa, 1998]. It is responsible for the metabolism of a vast number
of structurally diverse drugs that contain an ester or amide bond [Ross and Boraziani,

29
2007]. Although five different forms of this enzyme are known to be expressed in human
liver, drug metabolism is largely associated with only two of these isozymes, namely
carboxlyesterase I (CES1) and carboxylesterase II (CES2).
The conditions in which the activity of an enzyme is measured directly affect the
performance of the enzyme. During in vitro assays these conditions include the
temperature at which the reaction is maintained and the pH of the reaction mixture.
Enzymes typically work best within a pH range between 6 to 8 [Campbell, 1996].
If the environment is too acidic or too alkaline, the enzyme can shift to a less active
conformation or it might be less able to produce intermediates. It could also begin to
denature. The pH can also have an effect on the compounds present in the reaction
mixture that is used to measure the activity of the enzyme. A balance between enzyme
activity and compound stability is important when measuring the activity of the enzyme.
Temperature is another important factor to consider. In general as the temperature
of the reaction mixture increases the activity of the enzyme increases. However if the
temperature becomes too high, the enzyme may change conformation or begin to
denature, at which point the enzymatic reaction rate can drop sharply. Biological
enzymes generally have an optimal temperature at which the reaction rate is the fastest,
typically between 35°C and 40°C for mammalian enzymes [Campbell, 1996].
The intention of the studies conducted in this chapter was to identify an
optimized, simple, robust and reproducible in vitro assay for characterizing the activity of
the CES enzyme with new drug products in the non-clinical phase of development.
To begin selecting the study conditions for the assay, some preliminary work was
conducted in order to identify known substrates of the CES enzyme and to determine

30
proper storage conditions for the enzyme to prevent or minimize loss of activity. The
substrates chosen for the studies conducted here included 4-methylumbelliferyl acetate
(4-MBA) for the optimization of the buffer pH. It was discovered during preliminary
testing that this substrate was the only one soluble across the range of pH tested. For
assays in which the temperature of the reaction was optimized, p-nitrophenyl acetate was
chosen based on its solubility at both room temperature and at 37°C. Once these assay
conditions were optimized the substrate procaine was used in order to characterize the
enzyme kinetics of CES.
Procaine is a local anesthetic drug with the trade name Novocain ®, which has
been on the market for many years. Because this drug has been around for so long, a vast
number of studies have been conducted identifying many aspects of its pharmacokinetic
profile. The amount of information available about procaine made it the drug of choice
for this assay in an attempt to add another important level of standardized utility, namely
direct comparison to actual clinical results Once the kinetic properties of procaine were
measured using this assay, they could then be used as a basis of comparison when this
assay is performed with a new drug product and, in turn potentially better extrapolated to
predicted clinical behavior.
The kinetic parameters measured when trying to characterize the activity of an
enzyme with a substrate are Km and Vmax. Km is a measure of the affinity of a substrate
for an enzyme and Vmax refers to the maximum rate at which the enzyme converts the
substrate to its product. These two parameters define the kinetic behavior of an enzyme
as a function of substrate concentration [S]. This relationship is defined by Michaelis-
Menten kinetics shown in equation 3.1.

31
(eq. 3.1)
Measurements of these values are calculated by incubating different
concentrations of substrate with enzyme and measuring the rate at which this reaction
takes place. The results are then plotted as reaction rate versus substrate concentration.
This plot takes the form of a hyperbolic curve. The mathematics involved in trying to
define a relationship between points presented in this way become difficult. Several
different ways of linearizing this equation have long been used to estimate the values of
Km and Vmax, each method having its advantages and disadvantages. The most accurate
measurement of Km and Vmax is done using non-linear regression. This method does the
best job of reducing the overall error associated with defining a relationship between all
of the data points. Non-linear regression works by making systematic changes to the
estimates of the values given for Km and Vmax in order to produce a curve that gives the
best prediction of the reaction rate at any given substrate concentration. It is important to
have the most accurate measurement of these two parameters if this assay will be used to
help define a relationship between a new drug product and this enzyme.
In order to determine the length of time the enzyme could be stored without losing
significant activity, a stability test was conducted. The assay developed was based on the
one published on the Sigma-Aldrich website [EC.3.1.1.1, (n.d.)]. Sigma uses this assay to
determine and define the activity of the rabbit CES that they sell, which is greater than or
equal to 75 units per milligram protein. The unit definition based on this reaction is one
unit of enzyme will hydrolyze 1 µmole of ethyl butyrate to butyric acid and ethanol per
minute at pH 8.0 at 25°C. Stability of the enzyme was determined by verifying that our

32
assay could measure the same activity that was defined on the label of rabbit CES
purchased from Sigma. Once that was established, the enzyme was stored at 4°C and the
activity was measured at various time points up to 6 months. This conversion is shown in
figure 3.1.
O
O CE
OH
O+ EtOH
Figure 3.1. Conversion of ethyl butyrate to butyric acid and ethanol by the CES enzyme.
When developing an assay that is intended to be used for screening purposes, the
more readily it can be accomplished, the better chance it has at being useful. Several
different types of methods are used to monitor enzyme activity, including titrametric,
spectrophotometric (SPEC), and HPLC [Zhou, et al., 1995]. All of these methods are
useful and necessary when considering the large number of possibilities the structure of a
drug could possess. Titrametric methods are useful but are limited to neutral substrates
that produce an acidic or basic metabolite. SPEC assays are inherently more simplistic
than HPLC based assays because of the need for chromatographic method development
for HPLC drug detection. For this reason, the assay we chose to design to screen drugs
for enzyme activity was spectrophotometric-based. One consideration that would need to
be addressed before using this assay to determine enzyme activity would be if the new
drug product being tested has an absorbance or if a derivitization step would be needed in
order for detection to be possible.
In order to determine the optimum pH for testing activity of this enzyme, 4-
methylumbelliferyl acetate (4-MBA) was used as a substrate. Carboxylesterase converts

33
4-MBA to 4-methylumbelliferone (4-MBO) by cleaving the ester linkage of the acetate
group from the compound, this conversion is shown in figure 3.2.
O O
Me
AcO CE O O
Me
HO
+ AcOH
Figure 3.2. Conversion of 4-MBA to 4-MBO by the CES enzyme. The last assay condition tested was the optimum temperature to use for testing the
activity of this enzyme. To test this parameter, p-nitrophenyl acetate (pNPA) was used as
a substrate. The latter is converted to p-nitrophenol (pNP) by carboxylesterase. This
conversion is shown in figure 3.3.
OAc
NO2
CE
OH
NO2
+ AcOH
Figure 3.3. Conversion of 4-nitrophenyl acetate to 4-nitophenol by the carboxylesterase enzyme.
Once these assay conditions were determined, procaine was used to measure Km
and Vmax for the carboxylesterase enzyme. The conversion of procaine to para-amino
benzoic acid (PABA) by carboxylesterase is shown in figure 3.4.

34
H2N
CEO
ON
H2N
O
HON
OH+
Figure 3.4. Conversion of Procaine to PABA by the carboxylesterase enzyme. 3.2 Materials and Methods 3.2.1 Reagents and Equipment All of the reagents used in these experiments were purchased from Sigma-Aldrich
(St.Louis, MO, USA). Rabbit carboxylesterase (CES) was purchased as a lyophilized
powder containing 12.5 mg of protein or 1,000 units. The enzyme was reconstituted in
cold deionized water at a concentration of 1,000 U/ml and was kept at 4°C for no more
than two months. A fresh dilution from this stock was made for each experiment or set of
experiments.
Stock solutions were prepared for 4-MBA and 4-MBO in DMSO at 50 mM.
Stocks of pNPA were prepared in methanol while pNP was prepared in water both at 50
mM. Procaine and PABA were both prepared in water at 10 mM. Working solutions were
prepared by appropriate dilution of the stock just before use. All weighings were done on
an XS205 analytical balance from Mettler Toledo (Columbus, OH, USA).
A 10 mM Borate buffer was made while citrate and tris buffer was prepared at
100 mM. The pH for the borate buffer was adjusted to 8, citrate buffer pH was 4,5 and 6
and TRIS buffer pH was 6,7,7.4 and 8. All pH adjustments were made using 1N
hydrochloric acid or 1N sodium hydroxide. Buffer pH was measured using an Accumet
Excel XL15 pH meter from Cole-Parmer (Vernon Hills, IL, USA).

35
3.2.2 Spectrophotometric Readings
The enzymatic conversion of 4-MBA was monitored at a wavelength of 350 nm
and the absorbance was measured every minute for thirty minutes. For the substrate
pNPA, an absorbance reading was taken every fifteen seconds for five minutes at 450
nm. Two wavelengths were used to monitor for procaine and PABA at 265 nm and 290
nm, respectively. Measurement were taken every minute for thirty minutes. All SPEC
assays were performed on a Molecular Devices (Sunnyvale, CA, USA) Spectramax M5
spectrophotometer. Softmax Pro v 5.3 software supplied by Molecular Devices was used
for data collection.
3.2.3 Enzyme Stability Tests
200 ml of a 0.1% (v/v) ethyl butyrate solution was made by adding 200 µl of ethyl
butyrate to 199.8 ml of 10 mM borate buffer. On the first day of testing the rabbit CES
was taken up in 1 ml of cold water to make a concentration of enzyme at 1,000 U/ml.
This stock was kept at 4°C for the duration of the stability testing. The activity was
measured on day one and again 2, 4, 8, 16 and 26 weeks after stock preparation. A
dilution of this stock was made on each day of testing at 50 U/ml by adding 5 µl of the
1,000 U/ml stock to 995 µl of cold 10 mM borate buffer. The stability tests were
performed on a Radiometer Analytical (Lyon, France) TitraLab TIM856 titration
manager.
A total of 25 ml of the 0.1% ethyl butyrate solution (containing 25 µl of ethyl
butyrate) was added to a titration vessel and the pH was adjusted to 8.1 using 10 mM
sodium hydroxide. 100 µl of the 50 U/ml enzyme solution was then added and the pH
was monitored until it reached a pH of 8.0 at which time the pH Stat titrator was started.

36
The instrument was set to maintain the pH at 8.0 by small additions of 10 mM sodium
hydroxide for 2 minutes. The instrument recorded the amount of sodium hydroxide it
added over this time period in order to maintain the set pH value at 8.0. The activity of
the enzyme was calculated using equations 3.2 and 3.3 and reported in units/mg protein.
(eq. 3.2)
(eq. 3.3)
3.2.4 Calibration Curve Validation
Calibration curves of both the substrates and the products were developed on the
spectrophotometer to determine linearity of these compounds in each buffer and at each
pH. Standards were prepared for each compound by making dilutions from the stocks
described earlier. The standards prepared for 4-MBA covered the range of 0.2-1 mM and
for 4-MBO from 0.02-0.4 mM. The buffers loaded with these two compounds were 100
mM citrate with pH 4, 5 and 6 and TRIS buffer with pH 6, 7, 7.4 and 8. Standards for
pNPA were prepared from 0.4-2 mM and pNP from 0.010-0.2 mM. The buffers loaded
with these compounds were 100 mM TRIS at pH 6, 7, 7.4 and 8. Standards for procaine
were from 10-600 µM and PABA from 2-50 µM. The buffer loaded with these
compounds was 200 mM TRIS at pH 7.4. Blank solutions or “vehicle” solutions were

37
made for each substrate and product based on the diluents used for stock preparation. The
vehicle solution for 4-MBA and 4-MBO was 2% DMSO in water, for pNPA it was 2%
ethanol in water and the vehicle solution for pNP, procaine, and PABA was water. The
vehicle solutions were used for background subtraction. A 96-well plate was loaded with
100 µl of blank solution or the calibration standards and 100 µl of buffer and the plant
was read on the SPEC.
2.2.5 Enzyme Concentration Test
In order to insure linear kinetics, an enzyme concentration test was conducted.
Several different concentrations of enzyme were incubated with the substrate, and the
reaction rates were measured. All of the concentrations described for substrate, product,
enzyme and buffer represent the incubation concentration once loaded on the plate.
Substrate and product concentrations were 4-MBA at 0.5 mM, 4-MBO at 0.2 mM, pNPA
at 1 mM, pNP at 0.1 mM, procaine at 100 µM and PABA at 25 µM. TRIS buffer at pH
7.4 was used at a concentration of 50 mM. The enzyme concentrations in the reaction
mixture with 4-MBA and pNPA were 0.1, 0.05, 0.025 and 0.01 U/ml and for procaine
were 12.5, 6.25 and 3.125 U/ml.
Vehicle solutions for each substrate and product were prepared as described in
Section 2.2.4. A blank solution for wells containing enzyme were prepared by adding the
appropriate amount of enzyme to each vehicle solution. Control wells were prepared
without enzyme to monitor spontaneous hydrolysis of either substrate or product in
buffer. Once the plate was loaded with buffer and substrate, enzyme was quickly added
and the SPEC was started.

38
3.2.6 Selecting Assay Buffer pH
In order to determine the optimum buffer pH, a set of tests were conducted from a
pH of 4 to a pH of 8. The enzyme activity was measured at each pH using 4-MBA as a
substrate for rabbit CES. The incubation concentrations for substrate, product, enzyme
and buffer were as follows; 4-MBA at 0.5 mM, 4-MBO at 0.1 mM, CES at 0.05 U/ml and
citrate buffer (pH 4, 5, 6) and TRIS buffer (pH 6, 7, 7.4, 8) at 50 mM. Vehicle solutions
for both substrate and product were prepared as described in section 2.2.4. A blank
solution for wells containing enzyme were prepared by adding the appropriate amount of
enzyme to each vehicle solution. Control wells were prepared without enzyme to monitor
spontaneous hydrolysis of either substrate or product in buffer. Once the plate was loaded
with buffer and substrate, enzyme was quickly added and the spectrophotometer readings
were started.
3.2.7 Selecting Assay Temperature
In order to determine the effect of temperature on the enzyme activity tests were
performed at room temperature and 37°C. The enzyme activity was measured at each
temperature using pNPA as a substrate for rabbit CES. The concentration of substrate,
product, enzyme and buffer in the reaction mixture were pNPA at 1 mM, pNP at 0.1 mM,
CES at 0.05 U/ml and TRIS buffer (pH 6, 7, 7.4, 8) at 50 mM. Vehicle, blank and control
solutions for both substrate and product were prepared as described in section 2.2.4. Once
the plate was loaded with buffer and substrate, enzyme was quickly added and the SPEC
data collection was started. For the testing that was performed at 37°C, after the plate
was loaded with buffer, substrate and product it was placed in the plate reader for 15 min
so the reaction mixture could equilibrate to 37°C before the enzyme was added.

39
3.2.8 Assay For Measuring Km and Vmax In order to measure the Km and Vmax of the enzyme the optimized assay
conditions were used. Procaine was used as a substrate with TRIS buffer at pH 7.4 at a
temperature of 37°C. The incubation concentrations of substrate, product, enzyme and
buffer were procaine from 3.125-300 µM, PABA at 25 µM, CES at 6.25 U/ml and TRIS
buffer (pH 7.4) at 50 mM. Vehicle, blank and control solutions for both substrate and
product were prepared as described in section 2.2.4. Once the plate was loaded with
buffer, substrate and product it was equilibrated to 37°C in the plate reader, enzyme was
quickly added and the SPEC data collection was started.
2.2.9 Method For Calculating Compound Concentration If the absorption of the compound being measured by the spectrophotometer is
proportional to the concentration as described by Beer‟s law, then equation 3.4 can be
applied where: “A “ is the absorbance, “a” is the molar absorptivity, “b” is the path length
of the cell in cm, and “c” is the concentration of the compound.
A = a*b*c (eq. 3.4)
For our experiments the pathlength was constant, and since the molar absorptivity
was also constant, the relationship between absorbance at a given wavelength and the
concentration of the compound could be represented by equation 3.5. The slope of a plot
of c vs. A is represented as M.
c = A*M (eq. 3.5)
Equation 3.5 can be expanded upon in order to calculate the concentration of two
compounds occurring in the same mixture. This is shown in equations 3.6 and 3.7, where
A1 is the absorbance at one of the wavelengths that you are measuring and A2 is the

40
absorbance at the other wavelength. Ms1 is the slope of compound 1 at the first
wavelength and Ms2 is the slope of compound 1 at the second wavelength. Mp1 is the
slope of compound 2 at the first wavelength and Mp2 is the slope of compound 2 at the
second wavelength. The concentration of the first compound is represented as c1 and c2
represents the concentration of the second compound.
A1 = Ms1*C1 + Mp1*C2 (eq. 3.6)
A2 = Ms2*C1 + Mp2*C2 (eq. 3.7)
Solving these two equations for the two unknowns, C1 and C2, give you equations
3.8 and 3.9.
C1 =
(eq. 3.8)
C2 =
(eq. 3.9)
3.3 Results 3.3.1 Enzyme Stability Tests
Figure 3.5 is a graphical representation of the stability of rabbit CES stored at
1,000 U/ml in water for six months at 4°C. Each point represents the mean of three
experiments with the standard deviation.
41
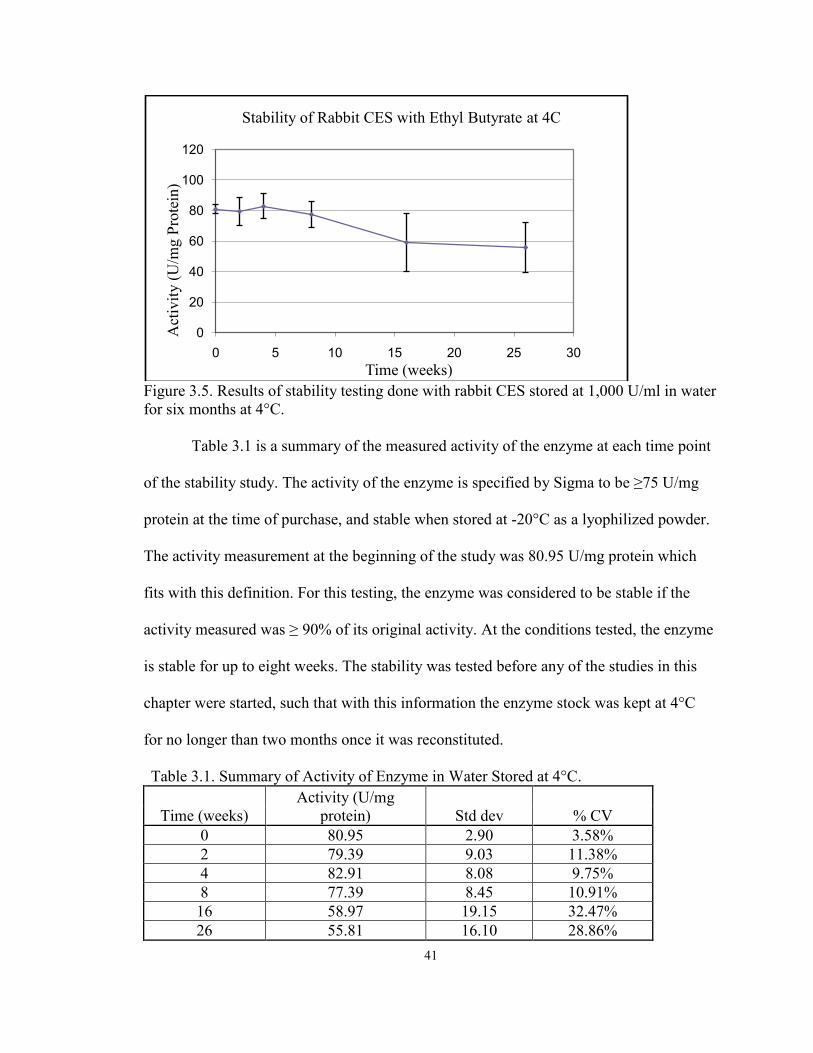
Figure 3.5. Results of stability testing done with rabbit CES stored at 1,000 U/ml in water for six months at 4°C. Table 3.1 is a summary of the measured activity of the enzyme at each time point
of the stability study. The activity of the enzyme is specified by Sigma to be ≥75 U/mg
protein at the time of purchase, and stable when stored at -20°C as a lyophilized powder.
The activity measurement at the beginning of the study was 80.95 U/mg protein which
fits with this definition. For this testing, the enzyme was considered to be stable if the
activity measured was ≥ 90% of its original activity. At the conditions tested, the enzyme
is stable for up to eight weeks. The stability was tested before any of the studies in this
chapter were started, such that with this information the enzyme stock was kept at 4°C
for no longer than two months once it was reconstituted.
Table 3.1. Summary of Activity of Enzyme in Water Stored at 4°C.
Time (weeks) Activity (U/mg
protein) Std dev % CV 0 80.95 2.90 3.58% 2 79.39 9.03 11.38% 4 82.91 8.08 9.75% 8 77.39 8.45 10.91% 16 58.97 19.15 32.47% 26 55.81 16.10 28.86%
0
20
40
60
80
100
120
0 5 10 15 20 25 30
Act
ivity
(U/m
g Pr
otei
n)
Time (weeks)
Stability of Rabbit CES with Ethyl Butyrate at 4C

42
3.3.2 Calibration Curve Validation
Calibration curves for both the substrate and the product were made in each buffer
and at each pH used for testing. Figure 3.6 represents the calibration curves made for 4-
MBA. The curves do not appear to be linear and the absorbance changes dramatically for
pH 4-6. The low amount of absorbance at these pH levels could indicate that the
absorbance of 4-MBA is not strong enough to overcome interference by the buffer
components. All absorbance readings for all concentrations are less than 1 absorbance
unit (AU).
Figure 3.6. Representative calibration curves in citrate buffer (pH 4-6) and TRIS buffer (pH 6-8) for the substrate 4-MBA. Curves at low pH are superimposed on this graph.
Figure 3.7 represents the calibration curves made for 4-MBO. These curves
appear to be linear for all pH levels. The absorbances at all pH levels are close to 1 AU.
00.10.20.30.40.50.60.7
0 0.1 0.2 0.3 0.4 0.5 0.6
Abs
orba
nce
Concentration (mM)
Calibration Curves for 4-MBA
citrate pH 4
citrate pH 5
citrate pH 6
tris pH 6
tris pH 7
tris pH 7.4
tris pH 8

43
Figure 3.7. Representative calibration curves in citrate buffer (pH 4-6) and TRIS (pH 6-8) for the product 4-MBO. Curves at low pH are superimposed on this graph. Table 3.2 summarizes the correlation coefficients for both 4-MBA and 4-MBO at
each pH. A correlation coefficient of 0.9 or greater indicates an acceptable level of
linearity in the data. The curves for 4-MBA at the low pH range had a correlation of
0.8961, 0.8563 and 0.8741 which was caused by the very low absorbance readings
measured at those levels. The linearity of the calibration data for 4-MBO on-the-other-
hand, had a correlation of at least 0.9 across the entire pH range. For this reason it was
decided to just measure the formation of this product during the testing for selecting the
buffer pH. This decision eliminated the problem of monitoring the substrate at the low
pH levels. Since the absorbance of 4-MBO was proportional to the concentration, a one-
point standardization was justified in place of calibration curves for the buffer pH assay.
Table 3.2. Correlation Coefficient Values for the Calibration Curves.
Compound Citrate Buffer Tris Buffer
pH 4 pH 5 pH 6 pH 6 pH 7 pH 7.4 pH 8 4-MBA 0.8961 0.8563 0.9172 0.8741 0.9337 0.9263 0.9816 4-MBO 0.9708 0.9713 0.9739 0.9600 0.9657 0.9665 0.9602
0
0.2
0.4
0.6
0.8
1
1.2
1.4
0 0.05 0.1 0.15 0.2 0.25
Abs
orba
nce
Concentration (mM)
Calibration Curves for 4-MBO
citrate pH 4
citrate pH 5
citrate pH 6
tris pH 6
tris pH 7
tris pH 7.4
tris pH 8

44
Figure 3.8 represents the calibration curves made for pNPA. The curves do not
appear to be linear especially at pH 6 and 7. The absorbance readings at the higher pH
are well above 1AU. It is typical for linearity of curves to change when the absorbance
readings go beyond this measurement. This could be corrected for by changing the
wavelength that is being used to one in which the compound has less absorbance.
Figure 3.8. Representative calibration curves in TRIS buffer (pH 6-8) for the substrate pNPA. Figure 3.9 represents the calibration curves made for pNP. These curves appear to
be very linear for all pH. The absorbances at all pH are less than 1 AU.
0
0.5
1
1.5
2
2.5
3
3.5
4
0 0.2 0.4 0.6 0.8 1 1.2
abso
rban
ce
Concentration (mM)
Calibration Curve for pNPA
tris pH 6
tris pH 7
tris pH 7.4
tris pH 8

45
Figure 3.9. Representative calibration curves in TRIS buffer (pH 6-8) for the product pNP. Table 3.3 summarizes the correlation coefficients for both pNPA and pNP at each
pH. The correlation coefficients for pNPA at pH 7.4 and 8 are 0.613 and 0.4124, which
do not show good correlation in these measurements. The curves for pNP showed
excellent linearity across the entire pH range. For this reason it was decided to just
measure the formation of this product during the testing for the selection of optimal
temperature. Measuring the reaction rate based on product formation eliminates the need
to adjust the wavelength to one that is better for substrate detection. Since the absorbance
of pNP was proportional to the concentration, a one-point standardization was justified in
place of calibration curves to calculate product formation during the assay.
Table 3.3. Correlation Coefficient Values For the Calibration Curves. Compound pH 6 pH 7 pH 7.4 pH 8
pNPA 0.9493 0.952 0.613 0.4124 pNP 0.9997 0.9997 0.9997 0.9984
Wavescans of procaine and PABA were performed in order to decide what
wavelength would give the best detection of these compounds. A wavelength of 265 nm
0
0.1
0.2
0.3
0.4
0.5
0.6
0.7
0.8
0.9
1
0 0.02 0.04 0.06 0.08 0.1 0.12
abso
rban
ce
Concentration (mM)
Calibration Curve for pNP
tris pH 6tris pH 7tris pH 7.4tris pH 8

46
was optimum for the detection of PABA over procaine, while a wavelength of 290 nm
was optimum for the detection of procaine over PABA. Figure 3.10 shows the calibration
curves for both of these compounds at the 265 nm wavelength. Both of these compounds
prove to be linear at these conditions. The absorbance of procaine does go slightly over 1
AU but the curves for both compounds appear to remain linear, so this was not seen as a
problem.
Figure 3.10. Representative calibration curve for the substrate procaine and the product PABA in TRIS buffer pH 7.4 at 265 nm.
Figure 3.11 shows the calibration curves for both procaine and PABA at the 290
nm wavelength. The absorbance for procaine at this wavelength goes slightly further
above 1 AU, but again the readings appear to remain linear.
0.00
0.20
0.40
0.60
0.80
1.00
1.20
1.40
0 50 100 150 200 250 300 350
abso
rban
ce
Concentration (uM)
Calibration Curve in Tris at pH 7.4 and wavelength 265nm
ProcainePABA

47
Figure 3.11. Representative calibration curve for the substrate procaine and the product PABA in TRIS buffer pH 7.4 at 290 nm. Table 3.4 is a summary of the correlation curves for both compounds at both
wavelengths. Since the concentration of both compounds remained proportional to the
absorbance, a simplified method of calculating the concentrations of each compound in
the reaction mixture was used. It required that only one concentration of each compound
be loaded on the plate during the enzyme assay.
Table 3.4. Correlation Coefficient Values for the Calibration Curves.
Compound Wavelength
265 nm 290 nm procaine 0.9987 0.998 PABA 0.9998 0.9997
3.3.3 Enzyme concentration tests Figure 3.12 shows the results of the enzyme concentration test performed with
different concentrations of rabbit CES using 4-MBA as the substrate. The kinetics
appeared to be linear across the time period tested, so it was decided to use an enzyme
concentration of 0.05 U/ml for the assay used to select buffer pH.
0.0000
0.5000
1.0000
1.5000
2.0000
2.5000
3.0000
0 50 100 150 200 250 300 350
abso
rban
ce
Concentration (uM)
Calibration Curve in Tris at pH 7.4 and wavelength 290nm
Procaine
PABA

48
Figure 3.12. CES enzyme concentration testing using 4-MBA as a substrate. The enzyme concentration test with rabbit CES using pNPA as a substrate is
shown in figure 3.13. The kinetics remained linear at each enzyme concentration tested. It
was decided to use an enzyme concentration of 0.05 U/ml for the assay in which the
effects of temperature on enzyme activity were measured.
Figure 3.13. CES enzyme concentration testing using pNPA as a substrate.
00.010.020.030.040.050.060.070.080.09
0.1
0 5 10 15 20 25 30 35Con
cent
ratio
n of
4-M
BO
(mM
)
Time (min)
Enzyme concentration test for 4-MBA with rabbit CES
no enzyme
0.1 U/ml
0.05 U/ml
0.025 U/ml
0.01 U/ml
0.0000
0.0500
0.1000
0.1500
0.2000
0.2500
0.3000
0 50 100 150 200 250 300
Con
cent
ratio
n of
pN
P (m
M)
Time (sec)
Enzyme concentration test for pNPA with rabbit CES
no enzyme
0.1 U/ml
0.05 U/ml
0.025 U/ml
0.01 U/ml

49
The results of the enzyme concentration test performed with rabbit CES using
procaine as a substrate is shown in figure 3.14. At the highest enzyme concentration
tested the concentration of the product, PABA at the start of the test was already 2 mM.
The test was repeated with the same result. Initially we thought that the delay between
loading the enzyme and starting the SPEC program was long enough and the reaction rate
was fast enough, then this could explain the starting concentration of PABA. Once the
reaction rate was calculated the delay would have to have been almost 10 minutes. A
rough estimate of the delay is closer to 1 minute so this theory does not seem to explain
the observation. Because of this starting condition issue, the higher enzyme concentration
was not used and an enzyme concentration of 6.25 U/ml was selected for the Km and
Vmax measurement.
Figure 3.14. CES enzyme concentration testing using procaine as a substrate.
-2.00
0.00
2.00
4.00
6.00
8.00
10.00
12.00
0 5 10 15 20 25 30
Con
cent
ratio
n of
PA
BA
(mM
)
Time (min)
Enzyme concentration test for procaine with rabbit CES
no enzyme
3.125 U/ml
6.25 U/ml
12.5 U/ml

50
3.3.4 Effect of Buffer pH
Figure 3.15 represents the results of the testing done with rabbit CES using 4-
MBA as a substrate. The points represent the mean of three experiments with the
standard deviation.
Figure 3.15. Results of the testing done to study the effects of buffer pH on enzyme activity using 4-MBA as a substrate. In order to compare the activity of the enzyme at each condition, the rate of
conversion at each pH was calculated. The rate was based on the mM of 4-MBO created
per minute of reaction time. The standard condition was chosen to be pH 7.4 and the rate
at each pH was divided by the rate calculated at the standard condition. Table 3.5
summarizes these results.
0%20%40%60%80%
100%120%140%160%
4 5 6 7 8 9
% o
f sta
ndar
d co
nditi
on
pH
Activity of Rabbit CES at Various Buffer pH
CitrateTris

51
Table 3.5. Summary of Assay pH Testing With 4-MBA.
Buffer pH % of Std condition Std dev
Citr
ate 4 17.57% 0.027
5 71.30% 0.062 6 78.33% 0.029
Tris
6 63.26% 0.056 7 100.90% 0.061
7.4 100.00% 0.000 8 129.35% 0.057
The rate of enzyme conversion increases as pH increases, with pH 8 having the
largest conversion rate. During testing, control wells were made at each pH that
contained substrate without enzyme. The rate of substrate conversion was measured in
these wells, and from pH 4 to 7.4. This conversion rate was relatively insignificant. At
pH 8 the conversion rate was much higher, which indicated that the substrate was
unstable at that pH. For this reason the buffer pH chosen for the Km and Vmax
measurement assay was 7.4.
3.3.5 Effect of Temperature
Figure 3.16 represents the results of the testing done with using pNPA as a
substrate for rabbit CES. Each point on the graph represents the mean of three tests with
the standard deviations.

52
Figure 3.16. Results of the temperature optimization assay using pNPA as a substrate in tris buffer. The rate of enzyme activity was measured in mM of pNP created per second at
each pH at both room temperature and at 37°C. The comparison in this assay was done
the same as in the buffer optimization assay. The hydrolysis rates measured at each pH
were divided by the rates at the standard condition, which is summarized in Table 3.6. All
of the rates measured at room temperature fell below those measured at 37°C. The
highest measured rate of CES activity at both temperatures was at a pH of 7.4, which is in
agreement with the assay in which buffer pH effects were studied. Based on the measured
temperature and pH effects on CES, the selected conditions to measure the rate of rabbit
CES activity are a buffer pH of 7.4 and a temperature of 37°C.
Table 3.6. Summary of Assay Temperature Testing With pNPA. 37°C Room Temperature
Buffer pH Ave % Std SD Buffer pH Ave % Std SD 7.4 100 0 7.4 66.52 5.36 7 78.89 6.08 7.00 52.63 6.01 6 48.31 2.98 6.00 36.18 0.44
0
20
40
60
80
100
5.5 6 6.5 7 7.5 8
% o
f Std
con
ditio
n
pH
Activity of Rabbit CES with PNPA as a substrate
37°C
Room Temperature

53
3.3.6 Assay For Measuring Km and Vmax The results of the assay in which the concentration of procaine was varied with
rabbit CES, and the reaction rate was measured by monitoring the appearance of product
and the disappearance of substrate, are shown in figure 3.17. Each point represents the
mean of three experiments with the standard deviation. This graph shows that our enzyme
followed Michaelis-Menten kinetics with procaine as a substrate.
Figure 3.17. Saturation curve for rabbit CES showing the relationship between substrate concentration and reaction rate. In order to use non-linear regression to estimate the value of Km and Vmax, an
initial guess of these values needed to be made. To do this the Eadie-Hofstee method, of
calculating these values was used. To use the Eadie-Hofstee method a plot of reaction
rate (v) versus the reaction rate divided by the substrate concentration (v/[S]) was made,
as shown in Figure 3.18.
0.000.050.100.150.200.250.300.350.400.450.50
0 100 200 300
reac
tion
rate
(uM
/min
)
[S] (uM)
Michaelis-Menten Curve
ProcainePABA

54
Figure 3.18. Eadie-Hofstee plot used to calculate the initial guess of Km and Vmax. From this plot the initial guess of Km and Vmax for both procaine and PABA
were made by performing a linear regression on the data points and relating the slope and
intercept to these parameters.
Km = -slope
Vmax = y-intercept
Kaleidagraph Synergy Software (Reading, PA, USA) was used to perform non-
linear regression of the data. A plot of the results is shown in figure 3.19. The triangles in
the plot represent the consumption of procaine and the open squares represent the
formation of PABA. The error bars represent the standard deviation associated with the
reaction rate measurements made at each substrate concentration.
0.000.050.100.150.200.250.300.350.40
0 0.001 0.002 0.003 0.004 0.005
v
v/[S]
Eadie Hofstee Plot
Procaine
PABA

55
Figure 3.19. Reaction rate vs. substrate concentration plot for both procaine and PABA showing the non-linear regression fit. Table 3.7 shows the initial guess for Km and Vmax from the Eadie-Hofstee
method, and the optimized values for these parameters made using non-linear regression.
The values measured for Km and Vmax using procaine vary somewhat from the values
measured using PABA. However, the difference is small enough that these differences
are most likely related to experimental error.
Table 3.7. Measurements of Km and Vmax. Eadie Hofstee Non-linear Regression Procaine PABA Procaine PABA
Km † 134.64 98.61 143.82 ± 18.71 94.97 ± 5.50 Vmax ‡ 0.0115 0.0077 0.0120 ± 0.0007 0.0072 ± 0.0002
† Km was measured in µM of substrate or product respectively ‡ Vmax was measured in µmol/min/mg protein of substrate or product respectively These Km and Vmax measurements seem to be in line with what is published in
0.00
0.10
0.20
0.30
0.40
0.50
0 50 100 150 200 250 300 350
Procaine ConsumptionPABA Formation
Rea
ctio
n R
ate
(uM
/min
)
Substrate Concentration (uM)

56
the literature about the relationship between procaine and the CES enzyme. Arndt and
Krisch and later Mentlein and Heymann measured the Vmax of procaine with purified rat
liver CES as having a value 20x larger than the one found here [Breast-Ovarian, (n.d.),
Arndt and Krisch, 1973]. In the literature, hydrolysis rates for rabbit CES with procaine
have been measured to be 2-5x faster than the hydrolysis rates measured for rat CES [Lee
and Livett, 1967; Short, et al., 1988]. The reason the rates measured here were smaller
than what was expected can be explained by the preparation of the enzyme being used.
Vmax is directly affected by the amount of enzyme present in the reaction mixture, the
rabbit CES used for these experiments was a crude mixture of protein, while the rat liver
enzyme used was purified enzyme. This meant that all of the protein used to measure the
activity in rat liver was all or mostly all enzyme, where the preparation of rabbit CES was
known to contain at least 15 % of protein identified as not being the CES enzyme.
The Km values measured with rat liver CES were similar to what were measured
here. Arndt and Kirsch measured a value of 0.132 mM, Mentlein and Heymann measured
the Km value to be 0.070 mM [Arndt and Krisch, 1973; Mentlein and Heymann, 1984].
This means that the binding affinity of procaine to rat CES is comparable to rabbit CES.
In 1997 Takai et al. measured the Km and Vmax of procaine with purified human
CES reporting values of 3.33 mM and 0.029 µmol/min/mg protein, respectively [Gram,
et al., 1991]. While a direct comparison of the Vmax of rabbit CES measured here cannot
be made with the purified human enzyme used in those experiements, the Km value
shows that procaine has a 20 to 30 times greater binding affinity to rabbit CES than to
human CES.

57
3.4 Conclusion By conducting the stock stability test of rabbit CES, we were able to determine
the length of time this enzyme could be stored without any significant changes in its
activity. This was important not only for the studies conducted here but also in
establishing appropriate storage conditions to be used during future work. Determining
the effects of temperature and pH allowed selection of the conditions that provided the
most accurate and reproducible measurement of the kinetic properties of this enzyme
with procaine. CES being a mammalian enzyme present in the body, the conclusion that
the optimal pH is 7.4 and the optimal temperature is 37°C is fitting with what would be
expected from this type of enzyme.
The usefulness of this assay lies in the ability of the researcher in making
correlations between the results found here and the results of this assay performed on a
candidate drug still having an unknown profile. For example, the literature has
established a list of drug interactions procaine has with other marketed pharmaceuticals,
some relating to procaine‟s metabolite PABA, but others are indicated because of the
common elimination pathway that they share, specifically metabolism by CES enzymes
[EC.3.1.1.1, (n.d.)]. The results of using this assay to measure the Km provides an
indication of the extent of possible drug-drug interactions the unknown compound might
exhibit.
The other parameter measured in this assay Vmax, also could be used for insights
into a new drug‟s behavior clinically. The half-life when procaine is injected
intravenously into humans is less than 10 minutes, which is a result of its rapid
metabolism by the esterase enzymes [Casarett, et al., 2008].Measuring Vmax for other

58
test agents by this same assay method would provide an early indication of whether the
agent‟s half-life will be longer or shorter than procaine. A good initial study design prior
to in vivo testing helps to minimize the amount of experiments needed to obtain a good
understanding of the pharmacokinetic profile of the drug.
Another valuable piece of information that can be gained from the use of this
assay would be to establish whether an unknown compound is a substrate for the esterase
enzymes. Since the way in which the esterase enzymes metabolize substrates is well
defined, an educated guess can then be made as to the metabolites this compound will
produce. This would be useful in ascertaining any potential metabolite-related side
effects.
The usefulness of this assay could be expanded upon by characterizing other
marketed pharmaceuticals with this method. Comparison between a range of compounds
all having well understood drug profiles would be much more informative and helpful in
designing studies for a new drug candidate in the beginning stages of development. With
the optimized conditions described here, a standard HPLC method could also be designed
for the analysis of compounds that do not lend themselves to this spectrophotometric-
based assay.

59
References Arndt R, Krisch K. (1973) Catalytic Properties of an Unspecific Carboxylesterase (E1) from Rat-Liver Microsomes, Eur. J. Biochem., 36, 129-134. Bhattacharyya MK and Ward EWB. (1986). Resistance, susceptibility and accumulation of glyceollins I-III in soybean organs inoculated with Phytophthora megasperma f. sp. g/ycinea, Physio.l and Mol. Plant Pathol., 29, 227-237. Boué SM, Carter CH, EhrlichKC and Cleveland TE. (2000). Induction of the Soybean Phytoalexins Coumestrol and Glyceollin by Aspergillus. J. Agric. Food Chem., 48 (6), 2167–2172. breast-ovarian, page 1. (n.d.) National Cancer Institute. Retrieved from http://www.cancer.gov/cancertopics/types/breast. Burden RS and Bailey A. (1975). The structure of the phytoalexin from soybean. Phytochemistry, 14, 1389-1390. Burow ME, Boue SM, Collins-Burow BM, Melnik LI, Duong BN, Carter-Wientjes CH, Li S, Wiese TE, Cleveland TE and McLachlan JA. (2001). Phytochemical Glyceollins, Isolated from Soy, Mediate Antihormonal Effects through Estrogen Receptor and ß. J. of Clin. Endo. & Meta., 86 (4), 1750-1758. Campbell, Biology 4th edition, The Benjamin/Cummings publishing company, inc., Menlo park California 1996 pp100-101. Casarett LJ, Klaassen CD, Doull J, Toxicology: The Basic Science of Poisons 7th edition,McGraw-Hill companies, Inc, 2008. EC3.1.1.1. (n.d.). iubmb enzyme reference. Retrieved from www.chem.qmul.ac.uk/iubmb/enzyme/EC3/2/1/21.html

60
Erhardt PW, Khupse R, Sarver JG, Trendel JA. (2010). Chapter entitled “Prodrugs: Strategic Deployment, Metabolic Considerations and Chemical Design Principles”, in Burger’s Medicinal Chemistry and Drug Discovery (7th Ed.), edited by D.J. Abraham, Wiley-Interscience Fakim AG. (2006) Medicinal plants: Traditions of yesterday and drugs of tomorrow, Mol. Aspec. of Med. 27,1-93. Food and Drug Administration; FDA guidance for Industry; Drug Interaction Studies- Study Design, Data Analysis, and Implication for Dosing and Labeling; Sept 2006. Gram TL, Gram MY. (1991). Glyceollin elicitors induce major but distinct shifts in isoflavonoid metabolism in proximal and distal soybean cell populations. Mol. Plant-Microbiol. Interact., 4, 60-68. Grifo F, Newman D, Fairfield AS, Bhattacharya B & Grupenhoff JT (1997) The Origins of Prescription Drugs. Washington D.C.: Island Press. Guengerich FP. (1995). Cytochrome P450: Structure, Mechanism, and Biochemistry (Second Edition), Chapter 14, edited by Paul R. Ortiz de Montellano, Plenum Press, New York. Historical background. (n.d.). In University of Georiga- Center for Drug Discovery website. Retrieved from http://www.uga-cdd.org/background.php. Home. (n.d.). Phytochemicals website. Retrieved from http://www.phytochemicals.info. Huang JS and Barker KR. (1991) Glyceollin I in Soybean-Cyst Nematode Interactions. Plant Physiol., 96, 1302-1307. Ionescu C, Caira MR, Drug metabolism, Springer ,AA Dordrecht, the Netherlands 2005 Isoflavones. (2010). Isoflavone website. Retrieved from http://www.isoflavones.info.

61
Keen NT, Sims JJ, Eewin DC, Rice E and Partridge E. (1971). 6a-Hydroxyphaseollin: an antifungal chemical induced in soybean hypocotyls by hytophthora megasperma var. sojae. Phytopathology, 61,1084-1089. Lee RM, Livett BH. (1967) A method for the colorimetric estimation of local anaesthetics containing an ester link, and its use in the determination of esterase activity. Biochem. Pharmacol.,16,1757-1765. Matsuura M, Obata A. (1993). -glucosidases from soybeans hydrolyse daidzin and genistin. J. of Food Sci., 58(1), 144-147. Mentlein R, Heymann E. (1984) Hydrolysis of ester- and amide- type drugs by the purified isoenzymes of nonspecific carboxylesterase from rat liver, Biochem. Pharmacol., 33 (8), 1243-1248. Mueller SO, Simon S, Chae K, Metzler M and Korach KS. (2004). Phytoestrogens and Their Human Metabolites Show Distinct Agonistic and Antagonistic Properties on Estrogen Receptor α (ERα) and ERβ in Human Cells. Toxicol. Sci., 80 (1), 14- 25. Oliver Y, Shi J, Hession AO, Maxwell CA, McGonigle B, Odell JT. (2003). Metabolic engineering to increase isoflavone biosynthesis in soybean seed. Phytochemistry, 63, 753–763. Payton-Stewart F, Khupse RS, Boué SM, Elliott S,Zimmermann MC, Skripnikova EV, Ashe H, Tilghman SL, Beckman BS, Cleveland TE, McLachlan JA, Bhatnagar D, Wiese TE, Erhardt PW, Burow ME. (2010). Glyceollin I enantiomers distinctly regulate ER-mediated gene expression. Steroids, 75, 870–878. Payton-Stewart F, Schoene NW, Kim YS, Burow ME, Cleveland TE, Boue SM and Wang TT. (2009) Molecular effects of soy phytoalexin glyceollins in human prostate cancer cells LNCaP. Mol. Carcinog., 48, 862-871. Plaxton WC. (1996). The organization and regulation of plant glycolysis. Annu. Rev. Plant Physiol. Plant Mol. Biol., 47, 185–214.

62
Quinney SK, Sanghani SP, Davis WI, Hurley TD, Sun Z, Murry DJ, Bosron WF. (2005). Hydrolysis of capecitabine to 5'-deoxy-5-fluorocytidine by human carboxylesterases and inhibition by loperamide. J. Pharmacol. Exp. Ther., 313 (3), 1011-16. Ross MK, Boraziani A. (2007). Enzymatic activity of human carboxylesterase. Retrieved from http://www.currentprotocols.com/protocol/tx0424. Salvo VA, Boue SM, Fonseca JP, Elliott S, Corbitt C, Collins-Burow BM, Curiel TJ, Srivastav SK, Shih BY, Carter-Wientjes CH, Wood CE, Erhardt PW, Beckman BS, Mclachlan JA, Cleveland TE, Burow ME (2006). Antiestrogenic glyceollins suppress human breast and ovarian carcinoma tumorigenesis. Clin. Cancer Res., 12 (23), 7159-7164. Sanghani SP, Quinney SK, Fredenburg TB, Sun Z, Davis WI, Murry DJ, Cummings OW, Seitz DE, Bosron WF. (2003). Carboxylesterases expressed in human colon tumor tissue and their role in CPT-11 hydrolysis. Clin. Cancer Res., 9 (13), 4983-91. Satoh T and Hosokawa M. (1998). The Mammalian Carboxylesterase: From Molecules to Functions. Annu. Rev. Pharmacol. Toxicol. 38, 257-88. Schmid D, Zulli F (2002). Topically applied soy isoflavones increase skin thickness. Cosmetics & Toiletries magazine, 117 (6), 45-50. Short CR, Flory W, Hsieh LC, Aranas T, Ou SP, Weissinger J. (1988) Comparison of hepatic drug metabolizing enzyme activities in several agricultural species, Comp. Biochem. Physiol., 91C (2), 419-424. Sneader, WE (2001). History of Drug Discovery-Encyclopedia of Life Sciences. published online: Wiley online library. Retrieved from http://onlinelibrary.wiley.com. Takai S, Matsuda A, Usami Y, Adachi T, Sugiyama T, Katagiri Y, Tatematsu M, Hirano K. (1997) Hydrolytic Profile for Ester- or Amide- linkage by Carboxylesterases pI 5.3 and 4.5 from Human Liver. Biol. Pharm. Bull., 20 (8), 869-873.

63
Tilghman SL, Boué SM, and Burow ME. (2010). Glyceollins, a Novel Class of Antiestrogenic Phytoalexins. Mol. Cell Pharmacol., 2 (4), 155-160. Wood CE, Clarkson TB, Appt SE, Franke AA, Boue SM, Burow ME, McCoy T and Cline JM. (2006). Effects of Soybean glyceollins and Estradiol in Postmenopausal Female Monkeys, Nutri. and Cancer, 56 (1), 74–81. Zhou J, Ain RJ, Riley CM, Schowen RL. (1995). Spectrophotometric assay for porcine liver esterase activity. Anal. Biochem., 231 (1), 265-7.