analysis of statistics 2012 - council of europe
TRANSCRIPT

Analysis of statistics 2012
January 2013

ECHR – Analysis of Statistics 2012 2/60
Table of contents
Overview of the Court’s statistics in 2012 ................................................................. 4 A. Number of new applications ............................................................................ 4
B. Applications disposed of judicially and pending applications ................................. 4
C. Processing of applications ............................................................................... 4
1. Pre-allocation ............................................................................................ 4
2. Inadmissibility or strike out decisions ........................................................... 4
3. Communicated applications ......................................................................... 4
4. Judgments ................................................................................................ 5
5. Requests for interim measures (Rule 39 of the Rules of Court) ........................ 5
D. Priority policy ................................................................................................ 5
General information ............................................................................................... 6 Number of applications allocated to a judicial formation ......................................... 7
Processing of applications ................................................................................... 9
Country-specific information .................................................................................. 14 Albania ............................................................................................................ 14
Andorra ........................................................................................................... 15
Armenia .......................................................................................................... 16
Austria ............................................................................................................ 17
Azerbaijan ....................................................................................................... 18
Belgium ........................................................................................................... 19
Bosnia and Herzegovina .................................................................................... 20
Bulgaria .......................................................................................................... 21
Croatia ............................................................................................................ 22
Cyprus ............................................................................................................ 23
Czech Republic ................................................................................................. 24
Denmark ......................................................................................................... 25
Estonia ............................................................................................................ 26
Finland ............................................................................................................ 27
France ............................................................................................................. 28
Georgia ........................................................................................................... 29
Germany ......................................................................................................... 30
Greece ............................................................................................................ 31
Hungary .......................................................................................................... 32
Iceland ............................................................................................................ 33
Ireland ............................................................................................................ 34
Italy ................................................................................................................ 35
Latvia ............................................................................................................. 36
ECHR – Analysis of Statistics 2012 3/60
Liechtenstein ................................................................................................... 37
Lithuania ......................................................................................................... 38
Luxembourg .................................................................................................... 39
Malta .............................................................................................................. 40
Republic of Moldova .......................................................................................... 41
Monaco ........................................................................................................... 42
Montenegro ..................................................................................................... 43
Netherlands ..................................................................................................... 44
Norway ........................................................................................................... 45
Poland ............................................................................................................. 46
Portugal .......................................................................................................... 47
Romania .......................................................................................................... 48
Russia ............................................................................................................. 49
San Marino ...................................................................................................... 50
Serbia ............................................................................................................. 51
Slovakia .......................................................................................................... 52
Slovenia .......................................................................................................... 53
Spain .............................................................................................................. 54
Sweden ........................................................................................................... 55
Switzerland ...................................................................................................... 56
“The former Yugoslav Republic of Macedonia” ...................................................... 57
Turkey ............................................................................................................ 58
Ukraine ........................................................................................................... 59
United Kingdom ................................................................................................ 60

ECHR – Analysis of Statistics 2012 4/60
Overview of the Court’s statistics in 2012
A. Number of new applications
In 2012 65,150 applications were allocated to a judicial formation, an overall increase of
1% compared with 2011 (64,400). 48,350 of these were identified as Single-Judge cases
likely to be declared inadmissible (an increase of 1% in relation to 2011). 16,800 were
identified as Chamber or Committee1 cases (an increase of 3%).
B. Applications disposed of judicially and pending applications
87,879 applications were disposed of judicially, an increase of 68% in relation to 2011
(52,188). The number of cases disposed of therefore exceeded those allocated by
approximately 22,700 (i.e. a monthly surplus of almost 1,900). As a result, and for the
first time since 1998, the stock of allocated applications pending before the Court
decreased over the year, by 16% from 151,600 to 128,100.
C. Processing of applications
1. Pre-allocation
Before a case is allocated to a judicial formation applicants are required to complete the
application form and submit the necessary supporting documents on pain of
administrative disposal. As at 31 December 2012 the number of applications pending at
this pre-judicial stage stood at 20,300, a decrease of 10% in relation to the same date
the previous year (22,600). The number of applications disposed of administratively in
2012 was 18,700, an increase of 39%.
2. Inadmissibility or strike out decisions
In 2012 86,201 applications were declared inadmissible or struck out of the list of cases
by a Single Judge, a Committee or a Chamber, a 70% increase compared with 2011
(50,677). The Single-Judge formation decided 81,764 cases in 2012, an increase of 74%
compared with 2011 (46,930). This increase is due to the introduction of new working
methods and to the fact that in 2012 more judges were appointed Single Judges. The
number of applications struck out, in a decision or a judgment, following a friendly
settlement or a unilateral declaration, increased by 25% in 2012 (1,532 in 2011).
Friendly settlements increased by 57%, but there were 14% fewer unilateral
declarations.
3. Communicated applications
Where an application is not on its face inadmissible, it is communicated to the
respondent Government. In 2012 5,238 applications were communicated (a decrease of
2% in relation to 2011 when 5,360 applications were communicated). This decrease can
be explained by efforts to concentrate on more time-consuming priority applications, a
higher number of which were communicated to the governments (see D. below).
1 Committee competence provided for in Article 28 § 1 b) of the Convention.

ECHR – Analysis of Statistics 2012 5/60
4. Judgments
Judgments were delivered in respect of 1,678 applications (compared with 1,511 in 2011
– an increase of 11%). A significant proportion of these applications were joined with the
result that the number of judgments actually delivered was 1,093, a decrease of 6%. 206
judgments were adopted by a three-judge Committee formation under the new
procedure introduced by Protocol 14.
5. Requests for interim measures (Rule 39 of the Rules of Court)
The total number of decisions on interim measures (1,973) decreased by 29% compared
with 2011 (2,782). The Court granted requests for interim measures in 103 cases (a
decrease of 70% compared with 342 in 2011) and dismissed them in 1,203 cases (33%
less than the 1,807 in 2011). The remainder fell outside the scope of Rule 39 of the Rules
of Court.
D. Priority policy2
In June 2009 the Court adopted a priority policy establishing seven different categories.
The essence of this policy is to concentrate more resources on the most important cases,
namely the cases falling within the top three categories (“priority applications”). At
31 December 2012 there were 6,568 applications in these categories.
The number of priority applications dealt with in 2012 increased by 30% compared to
2011. 16% more priority applications were communicated to the respondent
Governments in comparison with 2011. The number of priority applications declared
inadmissible or struck out of the list of cases by a Chamber or Committee increased by
61%. The number of priority applications struck out following a friendly settlement or a
unilateral declaration rose from 146 in 2011 to 158 in 2012. The number of priority
applications giving rise to a judgment increased by 33% in 2012 and represented 33% of
the total number of applications dealt with by judgments in 2012 (compared to 27% in
2011).
2 An explanation of the Court’s priority policy can be found on the Court’s internet site http://www.echr.coe.int/ECHR/EN/Header/The+Court/How+the+Court+works/Case+processing/ .
ECHR – Analysis of Statistics 2012 6/60
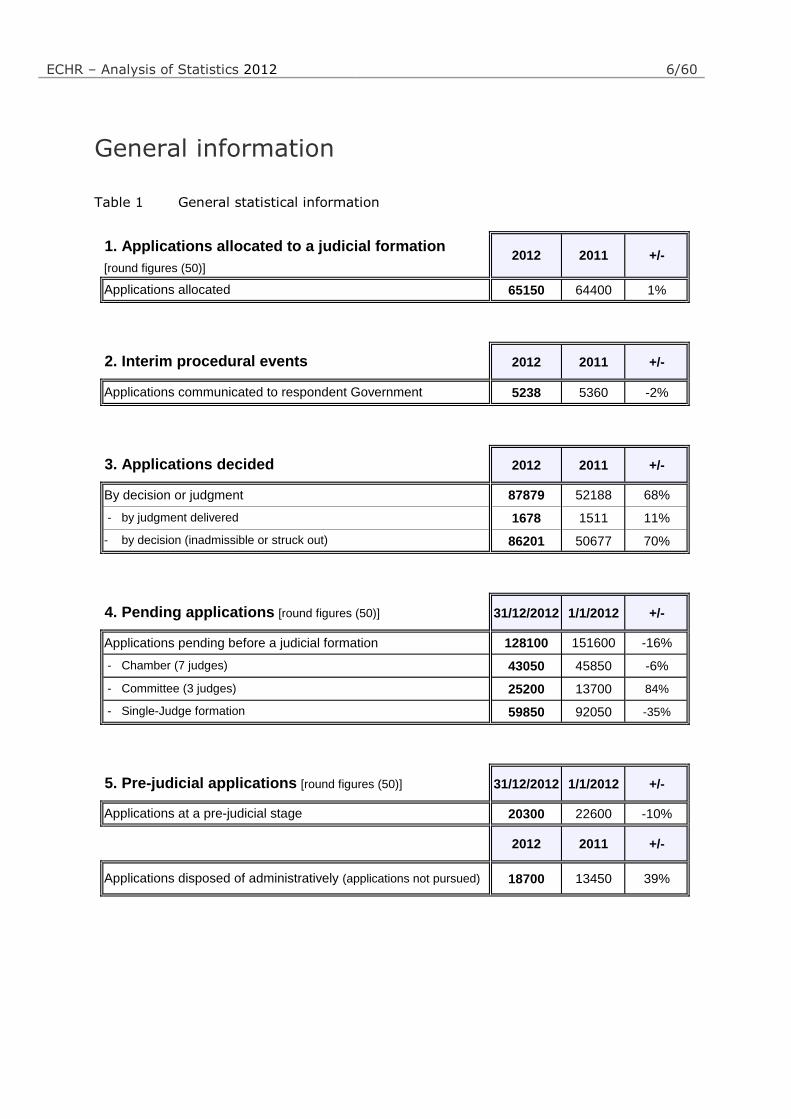
General information
Table 1 General statistical information
65150 64400 1%
2012 2011 +/-
5238 5360 -2%
2012 2011 +/-
87879 52188 68%
1678 1511 11%
86201 50677 70%
31/12/2012 1/1/2012 +/-
128100 151600 -16%
43050 45850 -6%
25200 13700 84%
59850 92050 -35%
31/12/2012 1/1/2012 +/-
20300 22600 -10%
2012 2011 +/-
18700 13450 39%
2. Interim procedural events
2012 2011 +/-[round figures (50)]
Applications at a pre-judicial stage
Applications communicated to respondent Government
1. Applications allocated to a judicial formation
By decision or judgment
Applications pending before a judicial formation
- Chamber (7 judges)
- Committee (3 judges)
Applications allocated
Applications disposed of administratively (applications not pursued)
3. Applications decided
4. Pending applications [round figures (50)]
5. Pre-judicial applications [round figures (50)]
- by judgment delivered
- by decision (inadmissible or struck out)
- Single-Judge formation

ECHR – Analysis of Statistics 2012 7/60
Number of applications allocated to a judicial formation3
Figure 1 Applications allocated to a judicial formation per year
840010500
13800
28200 27200
3250035400
3935041700
49850
57100
6130064400 65200
0
10000
20000
30000
40000
50000
60000
70000
1999 2000 2001 2002 2003 2004 2005 2006 2007 2008 2009 2010 2011 2012
Figure 2 Applications pending before a judicial formation
1260015900
19800
29400
38500
5000056800
66500
128100
151600
97300
79400
139650
119300
0
20000
40000
60000
80000
100000
120000
140000
160000
1999 2000 2001 2002 2003 2004 2005 2006 2007 2008 2009 2010 2011 2012
3 Figures represent the total number of applications, including joined applications. The document generally gives round figures. The upsurge in applications allocated in 2002 was due to a change in working methods, transferring much of the screening of inadmissible applications from the administrative, pre-judicial phase to the judicial stage.

ECHR – Analysis of Statistics 2012 8/60
Figure 3 High case-count States (more than 3,000 applications pending before a
judicial formation)
Russia
28600
22,3%
Italy
14200
11,1%
Bulgaria
3850
3,0%
United Kingdom
3300
2,6%
Poland
3100
2,4%
Republic of Moldova
3250
2,5%
remaining 37 States
25700
20,1%
Turkey
16900
13,2%
Ukraine
10450
8,2%
Serbia
10050
7,8%
Romania
8700
6,8%
Total number of pending applications: 128,100
Figure 4 The Court’s total caseload by stage of proceedings and judicial formation4
Communicated
11214
8,8%
Pending Government
action
4555
3,6%
Admissible
846
0,7%
Chamber or Committee -
awaiting first examination
(cat. I - V)
51483
40,2%
Single Judge or
Committee
(cat. VI - VII)
60013
46,8%
Total applications
128,100
4 The “Pending Government action” category was created to monitor applications following a judgment applying
the pilot procedure.

ECHR – Analysis of Statistics 2012 9/60
Figure 5 The Court’s total caseload by category
Cat. IV
20578
16,1%Cat. III
5417
4,2%
Cat. II
265
0,2%
Cat. I
886
0,7%
Cat. VI-VII
60013
46,8%
Cat. V
40945
32,0%
Total applications
128,100
Processing of applications
Figure 6 Major procedural steps in processing of applications
0
10000
20000
30000
40000
50000
60000
70000
80000
90000
100000
Applications
judgment delivered
241 757 934 889 736 816 1208 1719 1734 1880 2393 2607 1511 1678
Applications
communicated
1656 1463 1573 1686 1717 2447 2956 3232 3456 4416 6203 6674 5360 5238
Applications
inadmissible
or struck out
3520 6779 8992 17865 17272 20350 27612 28160 27059 30163 33067 38575 50677 86201
1999 2000 2001 2002 2003 2004 2005 2006 2007 2008 2009 2010 2011 2012

ECHR – Analysis of Statistics 2012 10/60
Figure 7 Number of judgments since 1999
177
695
888844
703 718
1105
1560 1503 15431625
1499
11571093
0
200
400
600
800
1000
1200
1400
1600
1800
1999 2000 2001 2002 2003 2004 2005 2006 2007 2008 2009 2010 2011 2012
Figure 8 Applications in categories I, II and III processed in 2011 and 2012
1194
537495
1342
573
412
1563
921
546
0
200
400
600
800
1000
1200
1400
1600
2010 2011 2012
communicated
decision
judgment

ECHR – Analysis of Statistics 2012 11/60
Table 2 Applications allocated per Contracting State and population
State
2009 2010 2011 2012 1.1.2009 1.1.2010 1.1.2011 1.1.2012 2009 2010 2011 2012
Albania 99 96 85 111 3185 3185 2832 3195 0,31 0,30 0,30 0,35
Andorra 6 8 8 6 87 85 85 85 0,69 0,94 0,94 0,71
Armenia 125 197 173 238 3238 3249 3263 3274 0,39 0,61 0,53 0,73
Austria 410 439 387 376 8355 8375 8404 8443 0,49 0,52 0,46 0,45
Azerbaijan 361 337 527 342 8897 8998 9111 9235 0,41 0,37 0,58 0,37
Belgium 256 304 252 268 10753 10840 11001 11041 0,24 0,28 0,23 0,24
Bosnia and
Herzegovina621 658 508 430 3844 3844 3843 3829 1,62 1,71 1,32 1,12
Bulgaria 1194 1348 1200 1276 7607 7564 7369 7327 1,57 1,78 1,63 1,74
Croatia 755 992 1192 1912 4435 4426 4412 4398 1,70 2,24 2,70 4,35
Cyprus 59 118 69 79 797 819 840 862 0,74 1,44 0,82 0,92
Czech Republic 726 606 522 547 10468 10507 10487 10505 0,69 0,58 0,50 0,52
Denmark 63 96 111 103 5511 5535 5561 5581 0,11 0,17 0,20 0,18
Estonia 204 265 346 301 1340 1340 1340 1340 1,52 1,98 2,58 2,25
Finland 489 377 432 317 5326 5351 5375 5401 0,92 0,70 0,80 0,59
France 1589 1619 1598 1347 64350 64694 65048 65398 0,25 0,25 0,25 0,21
Georgia 2122 375 395 367 4385 4436 4469 4498 4,84 0,85 0,88 0,82
Germany 1515 1683 1758 1494 82002 81802 81752 81844 0,18 0,21 0,22 0,18
Greece 518 585 668 722 11260 11305 11310 11291 0,46 0,52 0,59 0,64
Hungary 449 436 656 738 10030 10014 9986 9958 0,45 0,44 0,66 0,74
Iceland 10 15 10 10 319 318 318 320 0,31 0,47 0,31 0,31
Ireland 62 62 54 55 4450 4468 4570 4583 0,14 0,14 0,12 0,12
Italy 3624 3852 4714 3253 60045 60340 60626 60821 0,60 0,64 0,78 0,53
Latvia 326 271 291 286 2261 2248 2075 2042 1,44 1,21 1,40 1,40
Liechtenstein 14 15 9 16 36 36 36 36 3,92 4,17 2,50 4,44
Lithuania 261 242 305 373 3350 3329 3053 3008 0,78 0,73 1,00 1,24
Luxemburg 29 44 24 31 493 502 512 525 0,59 0,88 0,47 0,59
Malta 14 23 22 26 414 414 415 416 0,34 0,56 0,53 0,63
Republic of Moldova 1322 945 1021 938 3568 3564 3560 3560 3,71 2,65 2,87 2,63
Monaco 9 13 8 5 33 33 33 36 2,73 3,94 2,42 1,39
Montenegro 269 305 314 180 630 616 618 618 4,27 4,95 5,08 2,91
Netherlands 500 727 800 675 16486 16575 16656 16730 0,30 0,44 0,48 0,40
Norway 79 86 155 101 4799 4858 4920 4986 0,16 0,18 0,32 0,20
Poland 4986 5777 5023 4077 38136 38167 38530 38538 1,31 1,51 1,30 1,06
Portugal 152 186 164 217 10627 10638 10572 10542 0,14 0,17 0,16 0,21
Romania 5260 5992 5130 6790 21499 21462 21414 21356 2,45 2,79 2,40 3,18
Russia 13666 14309 12455 10755 141904 141915 142857 143056 0,96 1,01 0,87 0,75
San Marino 2 4 0 1 31 31 32 32 0,65 1,29 0,00 0,31
Serbia 1576 1566 3726 4900 7335 7307 7276 7241 2,15 2,14 5,12 6,77
Slovak Republic 569 568 553 531 5412 5425 5392 5404 1,05 1,05 1,03 0,98
Slovenia 598 837 424 422 2032 2047 2050 2055 2,94 4,09 2,07 2,05
Spain 641 689 807 694 45828 45989 46153 46196 0,14 0,15 0,17 0,15
Sweden 367 901 1942 545 9256 9341 9416 9483 0,40 0,96 2,06 0,57
Switzerland 471 368 358 325 7702 7786 7870 7955 0,61 0,47 0,45 0,41
"The former Yugoslav
Republic of Macedonia"489 422 376 354 2049 2053 2057 2060 2,39 2,06 1,83 1,72
Turkey 4474 5821 8668 9098 71517 72561 73723 74724 0,63 0,80 1,18 1,22
Ukraine 4693 3962 4618 7796 45963 45783 45598 45453 1,02 0,87 1,01 1,72
United Kingdom 1133 2766 1547 1734 61595 62027 62499 62990 0,18 0,45 0,25 0,28
Total 57157 61307 64405 65162 813640 816202 819319 822271 0,70 0,75 0,79 0,79
SOURCES 2011 et 2012: Internet sites of the Eurostat service (“Population and social conditions” ) or from the United Nations Statistics Division.
Applications allocated to a
judicial formation
Population
(1000)
Allocated/population
(10000)
The Council of Europe member States had a combined population of about 822 million
inhabitants on 1 January 2012. The average number of applications allocated per 10,000
inhabitants was 0.79 in 2012.

ECHR – Analysis of Statistics 2012 12/60
Table 3 The Court’s total caseload by stage of proceedings and judicial formation
State
Single Judge
or Committee
(cat. VI - VII)
Chamber or
Committee -
awaiting first
examination
(cat. I - V)
Communicated
Pending
Government
action
Admissible TOTAL
Albania 117 160 95 7 379
Andorra 3 1 1 1 6
Armenia 145 745 53 7 950
Austria 236 93 70 8 407
Azerbaijan 168 1036 87 8 1299
Belgium 25 286 40 8 359
Bosnia and Herzegovina 1151 228 42 22 1443
Bulgaria 2804 872 126 27 3829
Croatia 667 477 73 15 1232
Cyprus 100 43 46 1 190
Czech Republic 739 149 54 19 961
Denmark 16 5 5 1 27
Estonia 590 33 16 0 639
Finland 116 38 31 3 188
France 1050 337 137 15 1539
Georgia 400 2305 168 10 2883
Germany 1880 100 29 4 2013
Greece 114 745 200 19 1078
Hungary 1276 466 94 13 1849
Iceland 11 0 2 0 13
Ireland 10 6 8 1 25
Italy 1954 11219 965 49 14187
Latvia 318 120 83 12 533
Liechtenstein 11 2 1 0 14
Lithuania 99 76 67 4 246
Luxembourg 5 0 2 0 7
Malta 4 14 13 6 37
Republic of Moldova 2373 613 211 42 17 3256
Monaco 1 1 4 0 6
Montenegro 676 137 30 5 848
Netherlands 705 295 61 1 1062
Norway 46 6 8 1 61
Poland 393 2363 306 43 3105
Portugal 98 59 56 4 217
Romania 3021 1345 1330 2971 45 8712
Russia 22322 3982 2013 210 71 28598
San Marino 0 1 1 0 2
Serbia 2986 6105 928 34 10053
Slovakia 264 142 58 17 481
Slovenia 1972 109 122 15 2218
Spain 497 88 63 5 653
Sweden 20 27 58 5 110
Switzerland 790 172 63 5 1030
"The former Yugoslav
Republic of Macedonia"375 235 124 2 736
Turkey 3430 11446 1935 65 16876
Ukraine 5357 2284 1243 1332 230 10446
United Kingdom 678 2517 92 21 3308
ALL STATES 60013 51483 11214 4555 846 128111

ECHR – Analysis of Statistics 2012 13/60
Table 4 Unilateral declarations and friendly settlements in 2011 and 2012
State
2011 2012 2011 2012
Albania 1 2 0 1
Andorra 0 0 0 0
Armenia 6 2 0 0
Austria 0 0 8 1
Azerbaijan 1 0 2 1
Belgium 1 0 0 0
Bosnia and Herzegovina 0 3 78 43
Bulgaria 5 28 9 85
Croatia 0 6 11 18
Cyprus 0 0 0 0
Czech Republic 0 7 10 4
Denmark 0 0 0 6
Estonia 0 0 2 0
Finland 1 4 2 8
France 1 4 7 2
Georgia 0 1 2 4
Germany 0 1 1 2
Greece 0 0 14 3
Hungary 0 2 45 53
Iceland 0 0 0 0
Ireland 0 0 2 1
Italy 0 0 7 117
Latvia 1 1 3 1
Liechtenstein 1 0 0 0
Lithuania 1 0 0 0
Luxembourg 0 0 0 0
Malta 0 2 0 0
Republic of Moldova 62 5 15 13
Monaco 0 0 0 1
Montenegro 0 0 0 1
Netherlands 0 0 0 1
Norway 0 0 0 0
Poland 44 40 154 111
Portugal 5 1 12 10
Romania 30 61 21 35
Russia 205 100 12 3
San Marino 1 1 1
Serbia 10 3 69 415
Slovakia 2 3 29 9
Slovenia 2 0 0 1
Spain 0 0 0 0
Sweden 0 0 0 1
Switzerland 0 0 0 0The former Yugoslav Republic
of Macedonia' 12 1 28 67
Turkey 39 14 115 99
Ukraine 262 313 161 178
United Kingdom 10 2 9 7
Grand Total 703 606 829 1303
Unilateral declaration Friendly settlement

ECHR – Analysis of Statistics 2012 14/60
Country-specific information
Albania
Figure 9 The Court’s caseload by stage of proceedings and decision body
Chamber or Committee -
awaiting first examination
(cat. I - V)
160
42%
Communicated
95
25%
Admissible
7
2%
Single Judge or
Committee
(cat. VI - VII)
117
31%
Total applications
379
Figure 10 Major procedural steps in processing applications
96
2017
9
85
46
17
5
111
58
39
10
0
20
40
60
80
100
120
2010 2011 2012
Applications allocated to a judicialformation
Applications declared inadmissibleor struck out
Applications communicated to theGovernment
Applications in which judgmentsdelivered

ECHR – Analysis of Statistics 2012 15/60
Andorra
Figure 11 The Court’s caseload by stage of proceedings and decision body
Admissible
1
17%
Chamber or Committee -
awaiting first examination
(cat. I - V)
1
17%
Communicated
1
17%
Single Judge or
Committee
(cat. VI - VII)
3
49%
Total applications
6
Figure 12 Major procedural steps in processing applications
8
3
1
0
8
4
2
0
6
15
0
2
0
2
4
6
8
10
12
14
16
2010 2011 2012
Applications allocated to a judicialformation
Applications declared inadmissibleor struck out
Applications communicated to theGovernment
Applications in which judgmentsdelivered

ECHR – Analysis of Statistics 2012 16/60
Armenia
Figure 13 The Court’s caseload by stage of proceedings and decision body
Chamber or Committee -
awaiting first examination
(cat. I - V)
745
78%
Communicated
53
6%
Admissible
7
0,7%Single Judge or
Committee
(cat. VI - VII)
145
15%
Total applications
950
Figure 14 Major procedural steps in processing applications
197
81
155
173
144
16
5
238229
11 16
0
50
100
150
200
250
2010 2011 2012
Applications allocated to a judicialformation
Applications declared inadmissibleor struck out
Applications communicated to theGovernment
Applications in which judgmentsdelivered
ECHR – Analysis of Statistics 2012 17/60
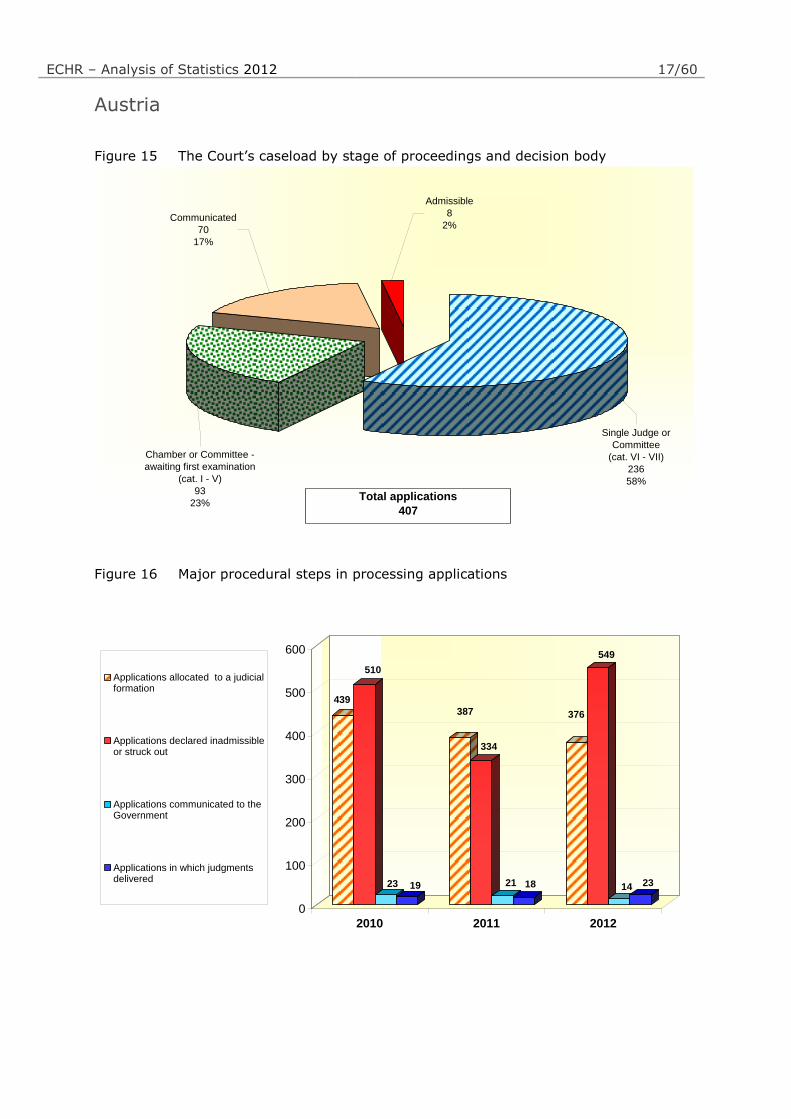
Austria
Figure 15 The Court’s caseload by stage of proceedings and decision body
Single Judge or
Committee
(cat. VI - VII)
236
58%
Chamber or Committee -
awaiting first examination
(cat. I - V)
93
23%
Communicated
70
17%
Admissible
8
2%
Total applications
407
Figure 16 Major procedural steps in processing applications
439
510
23 19
387
334
21 18
376
549
14 23
0
100
200
300
400
500
600
2010 2011 2012
Applications allocated to a judicialformation
Applications declared inadmissibleor struck out
Applications communicated to theGovernment
Applications in which judgmentsdelivered

ECHR – Analysis of Statistics 2012 18/60
Azerbaijan
Figure 17 The Court’s caseload by stage of proceedings and decision body
Chamber or Committee -
awaiting first examination
(cat. I - V)
1036
79,8%
Communicated
87
6,7%
Admissible
8
0,6%
Single Judge or
Committee
(cat. VI - VII)
168
12,9%
Total applications
1 299
Figure 18 Major procedural steps in processing applications
337
167
49 23
527
6245
25
342
694
34 37
0
100
200
300
400
500
600
700
2010 2011 2012
Applications allocated to a judicialformation
Applications declared inadmissibleor struck out
Applications communicated to theGovernment
Applications in which judgmentsdelivered

ECHR – Analysis of Statistics 2012 19/60
Belgium
Figure 19 The Court’s caseload by stage of proceedings and decision body
Chamber or Committee -
awaiting first examination
(cat. I - V)
286
80%
Communicated
40
11%
Admissible
8
2%
Single Judge or
Committee
(cat. VI - VII)
25
7%
Total applications
359
Figure 20 Major procedural steps in processing applications
304
69
30
4
252265
189
268
468
276
0
50
100
150
200
250
300
350
400
450
500
2010 2011 2012
Applications allocated to a judicialformation
Applications declared inadmissibleor struck out
Applications communicated to theGovernment
Applications in which judgmentsdelivered

ECHR – Analysis of Statistics 2012 20/60
Bosnia and Herzegovina
Figure 21 The Court’s caseload by stage of proceedings and decision body
Single Judge or
Committee
(cat. VI - VII)
1151
79%
Chamber or Committee -
awaiting first examination
(cat. I - V)
228
16%
Communicated
42
3%
Admissible
22
2%
Total applications
1 443
Figure 22 Major procedural steps in processing applications
658
1393
142
1
508
410
79 33
430 361
29 12
0
200
400
600
800
1000
1200
1400
2010 2011 2012
Applications allocated to a judicialformation
Applications declared inadmissibleor struck out
Applications communicated to theGovernment
Applications in which judgmentsdelivered

ECHR – Analysis of Statistics 2012 21/60
Bulgaria
Figure 23 The Court’s caseload by stage of proceedings and decision body
Chamber or Committee -
awaiting first examination
(cat. I - V)
872
23%
Communicated
126
3%
Admissible
27
1%
Single Judge or
Committee
(cat. VI - VII)
2804
73%
Total applications
3 829
Figure 24 Major procedural steps in processing applications
1348
525
92 84
1200
543
14173
1276
1425
85 72
0
200
400
600
800
1000
1200
1400
1600
2010 2011 2012
Applications allocated to a judicialformation
Applications declared inadmissibleor struck out
Applications communicated to theGovernment
Applications in which judgmentsdelivered

ECHR – Analysis of Statistics 2012 22/60
Croatia
Figure 25 The Court’s caseload by stage of proceedings and decision body
Chamber or Committee -
awaiting first examination
(cat. I - V)
477
39%
Communicated
73
6%
Admissible
15
1%
Single Judge or
Committee
(cat. VI - VII)
667
54%
Total applications
1 232
Figure 26 Major procedural steps in processing applications
992
357
55 21
1192
1014
65 49
1912
2392
59 22
0
500
1000
1500
2000
2500
2010 2011 2012
Applications allocated to a judicialformation
Applications declared inadmissibleor struck out
Applications communicated to theGovernment
Applications in which judgmentsdelivered
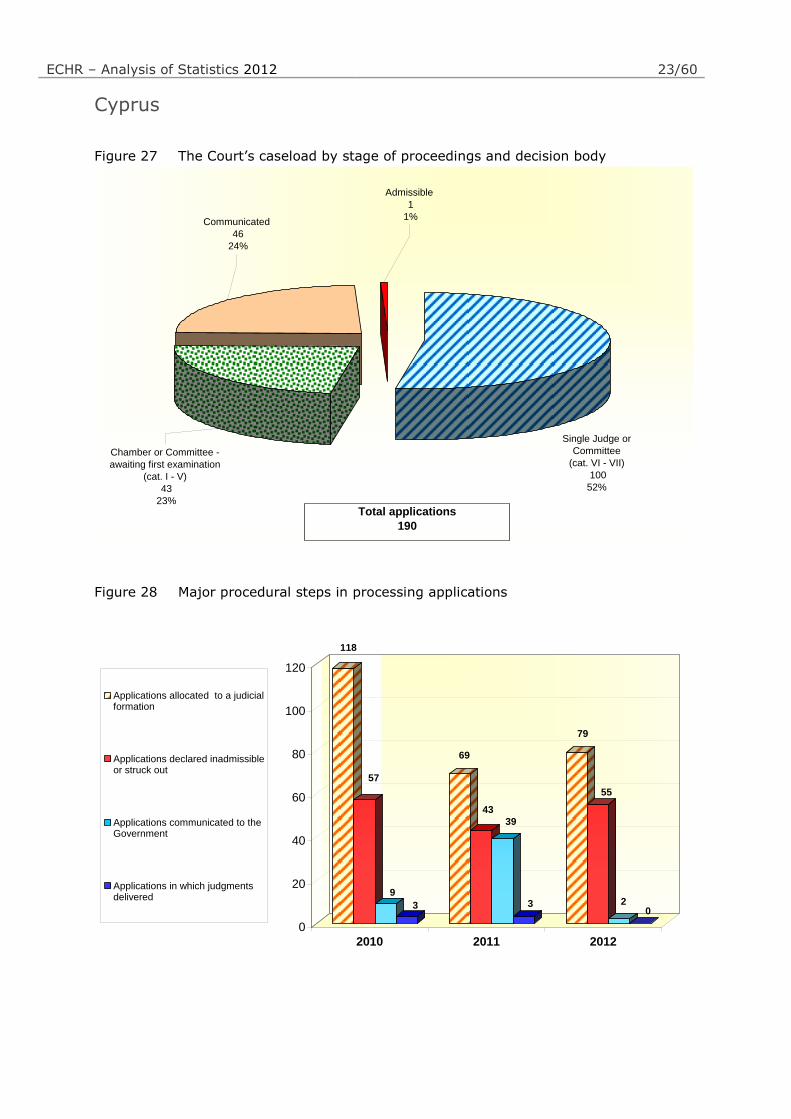
ECHR – Analysis of Statistics 2012 23/60
Cyprus
Figure 27 The Court’s caseload by stage of proceedings and decision body
Single Judge or
Committee
(cat. VI - VII)
100
52%
Admissible
1
1%Communicated
46
24%
Chamber or Committee -
awaiting first examination
(cat. I - V)
43
23%Total applications
190
Figure 28 Major procedural steps in processing applications
118
57
9
3
69
43
39
3
79
55
20
0
20
40
60
80
100
120
2010 2011 2012
Applications allocated to a judicialformation
Applications declared inadmissibleor struck out
Applications communicated to theGovernment
Applications in which judgmentsdelivered

ECHR – Analysis of Statistics 2012 24/60
Czech Republic
Figure 29 The Court’s caseload by stage of proceedings and decision body
Admissible
19
2%
Communicated
54
6%Chamber or Committee -
awaiting first examination
(cat. I - V)
149
16%
Single Judge or
Committee
(cat. VI - VII)
739
76%Total applications
961
Figure 30 Major procedural steps in processing applications
606
1367
5912
522
588
46 29
547
773
43 30
0
200
400
600
800
1000
1200
1400
2010 2011 2012
Applications allocated to a judicialformation
Applications declared inadmissibleor struck out
Applications communicated to theGovernment
Applications in which judgmentsdelivered

ECHR – Analysis of Statistics 2012 25/60
Denmark
Figure 31 The Court’s caseload by stage of proceedings and decision body
Communicated
5
19%
Chamber or Committee -
awaiting first examination
(cat. I - V)
5
19%
Single Judge or
Committee
(cat. VI - VII)
16
58%
Admissible
1
4%
Total applications
27
Figure 32 Major procedural steps in processing applications
96
36
26
0
11199
166
103
201
8 1
0
50
100
150
200
250
2010 2011 2012
Applications allocated to a judicialformation
Applications declared inadmissibleor struck out
Applications communicated to theGovernment
Applications in which judgmentsdelivered
ECHR – Analysis of Statistics 2012 26/60
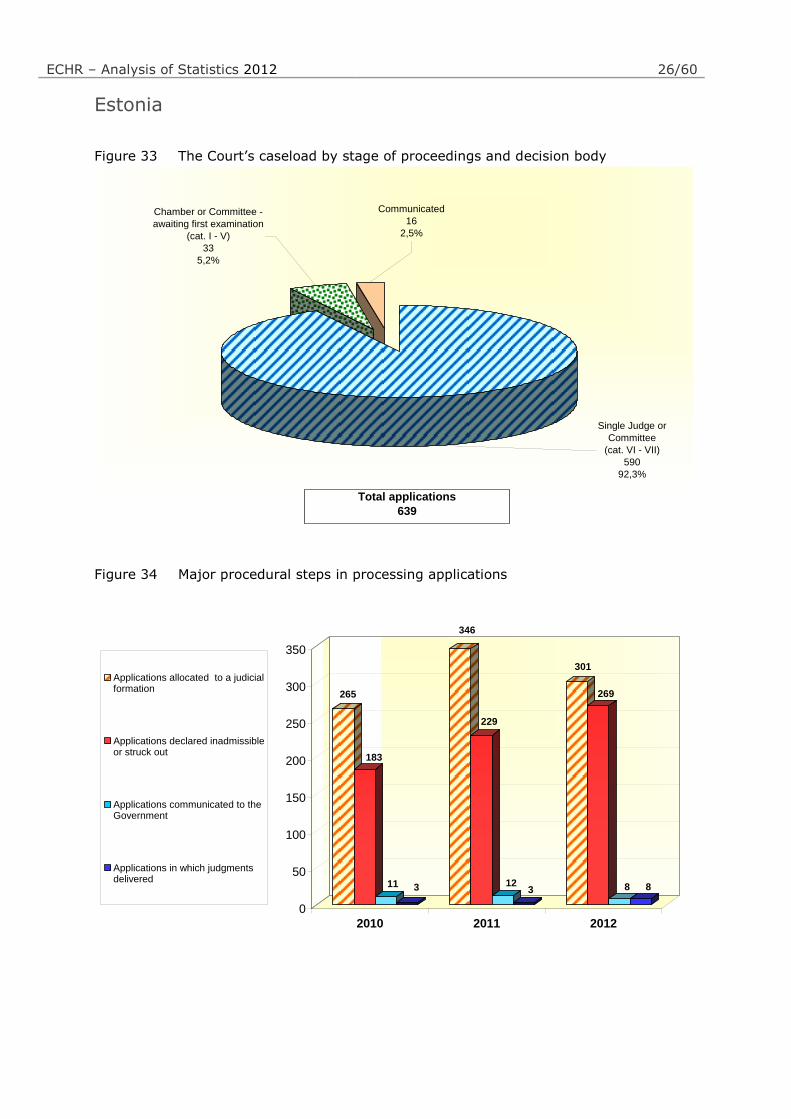
Estonia
Figure 33 The Court’s caseload by stage of proceedings and decision body
Single Judge or
Committee
(cat. VI - VII)
590
92,3%
Chamber or Committee -
awaiting first examination
(cat. I - V)
33
5,2%
Communicated
16
2,5%
Total applications
639
Figure 34 Major procedural steps in processing applications
265
183
11 3
346
229
123
301
269
8 8
0
50
100
150
200
250
300
350
2010 2011 2012
Applications allocated to a judicialformation
Applications declared inadmissibleor struck out
Applications communicated to theGovernment
Applications in which judgmentsdelivered

ECHR – Analysis of Statistics 2012 27/60
Finland
Figure 35 The Court’s caseload by stage of proceedings and decision body
Single Judge or
Committee
(cat. VI - VII)
116
61,7%
Chamber or Committee -
awaiting first examination
(cat. I - V)
38
20,2%
Communicated
31
16,5%
Admissible
3
1,6%
Total applications
188
Figure 36 Major procedural steps in processing applications
377
214
29 17
432
485
247
317
615
24 5
0
100
200
300
400
500
600
700
2010 2011 2012
Applications allocated to a judicialformation
Applications declared inadmissibleor struck out
Applications communicated to theGovernment
Applications in which judgmentsdelivered
ECHR – Analysis of Statistics 2012 28/60
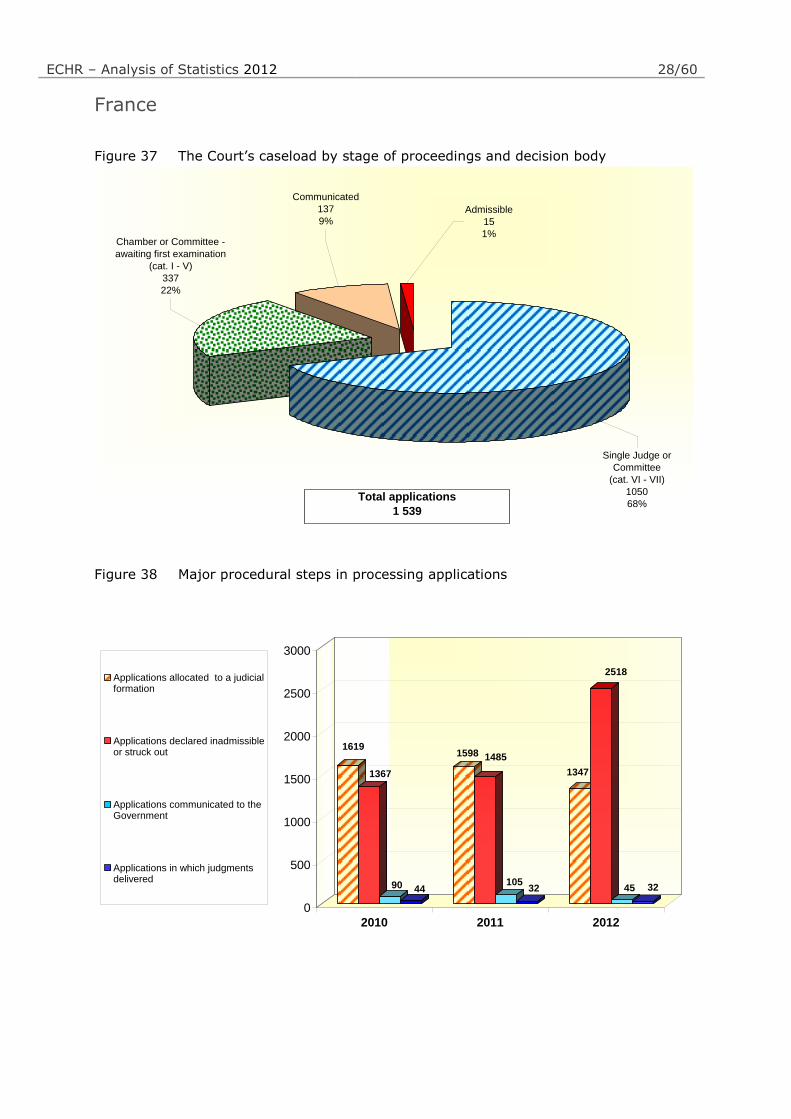
France
Figure 37 The Court’s caseload by stage of proceedings and decision body
Single Judge or
Committee
(cat. VI - VII)
1050
68%
Chamber or Committee -
awaiting first examination
(cat. I - V)
337
22%
Communicated
137
9%Admissible
15
1%
Total applications
1 539
Figure 38 Major procedural steps in processing applications
1619
1367
90 44
1598 1485
10532
1347
2518
45 32
0
500
1000
1500
2000
2500
3000
2010 2011 2012
Applications allocated to a judicialformation
Applications declared inadmissibleor struck out
Applications communicated to theGovernment
Applications in which judgmentsdelivered

ECHR – Analysis of Statistics 2012 29/60
Georgia
Figure 39 The Court’s caseload by stage of proceedings and decision body
Chamber or Committee -
awaiting first examination
(cat. I - V)
2305
80%
Communicated
168
6%
Admissible
10
0,3%
Single Judge or
Committee
(cat. VI - VII)
400
14%
Total applications
2 883
Figure 40 Major procedural steps in processing applications
375
1608
44 4
395
160
51 4
367
521
30 12
0
200
400
600
800
1000
1200
1400
1600
1800
2010 2011 2012
Applications allocated to a judicialformation
Applications declared inadmissibleor struck out
Applications communicated to theGovernment
Applications in which judgmentsdelivered

ECHR – Analysis of Statistics 2012 30/60
Germany
Figure 41 The Court’s caseload by stage of proceedings and decision body
Single Judge or
Committee
(cat. VI - VII)
1880
94%
Chamber or Committee -
awaiting first examination
(cat. I - V)
100
5%
Communicated
29
1%
Admissible
4
0%
Total applications
2 013
Figure 42 Major procedural steps in processing applications
1683
1544
45 47
1758
1095
32 46
1494
2468
22 23
0
500
1000
1500
2000
2500
2010 2011 2012
Applications allocated to a judicialformation
Applications declared inadmissibleor struck out
Applications communicated to theGovernment
Applications in which judgmentsdelivered

ECHR – Analysis of Statistics 2012 31/60
Greece
Figure 43 The Court’s caseload by stage of proceedings and decision body
Single Judge or
Committee
(cat. VI - VII)
114
11%
Chamber or Committee -
awaiting first examination
(cat. I - V)
745
68%
Communicated
200
19%
Admissible
19
2%
Total applications
1 078
Figure 44 Major procedural steps in processing applications
585
383
128
60
668
179
112 73
722
861
93
58
0
100
200
300
400
500
600
700
800
900
2010 2011 2012
Applications allocated to a judicialformation
Applications declared inadmissibleor struck out
Applications communicated to theGovernment
Applications in which judgmentsdelivered

ECHR – Analysis of Statistics 2012 32/60
Hungary
Figure 45 The Court’s caseload by stage of proceedings and decision body
Chamber or Committee -
awaiting first examination
(cat. I - V)
466
25%
Communicated
94
5%
Single Judge or
Committee
(cat. VI - VII)
1276
69%
Admissible
13
0,7%
Total applications
1 849
Figure 46 Major procedural steps in processing applications
436
240
79
21
656
224
99
34
738
840
106
27
0
100
200
300
400
500
600
700
800
900
2010 2011 2012
Applications allocated to a judicialformation
Applications declared inadmissibleor struck out
Applications communicated to theGovernment
Applications in which judgmentsdelivered

ECHR – Analysis of Statistics 2012 33/60
Iceland
Figure 47 The Court’s caseload by stage of proceedings and decision body
Single Judge or
Committee
(cat. VI - VII)
11
85%
Communicated
2
15%
Total applications
13
Figure 48 Major procedural steps in processing applications
15
8
2
1
10
14
0 0
10 10
2 2
0
2
4
6
8
10
12
14
16
2010 2011 2012
Applications allocated to a judicialformation
Applications declared inadmissibleor struck out
Applications communicated to theGovernment
Applications in which judgmentsdelivered

ECHR – Analysis of Statistics 2012 34/60
Ireland
Figure 49 The Court’s caseload by stage of proceedings and decision body
Single Judge or
Committee
(cat. VI - VII)
10
40%
Chamber or Committee -
awaiting first examination
(cat. I - V)
6
24%
Communicated
8
32%
Admissible
1
4%
Total applications
25
Figure 50 Major procedural steps in processing applications
62
76
22
54
77
42
55
63
8
2
0
10
20
30
40
50
60
70
80
2010 2011 2012
Applications allocated to a judicialformation
Applications declared inadmissibleor struck out
Applications communicated to theGovernment
Applications in which judgmentsdelivered

ECHR – Analysis of Statistics 2012 35/60
Italy
Figure 51 The Court’s caseload by stage of proceedings and decision body
Chamber or Committee -
awaiting first examination
(cat. I - V)
11219
79%
Communicated
965
7%
Single Judge or
Committee
(cat. VI - VII)
1954
14%
Admissible
49
0,3%
Total applications
14 187
Figure 52 Major procedural steps in processing applications
3852
687220 668
4714
556
21484
3253
2693
149 122
0
500
1000
1500
2000
2500
3000
3500
4000
4500
5000
2010 2011 2012
Applications allocated to a judicialformation
Applications declared inadmissibleor struck out
Applications communicated to theGovernment
Applications in which judgmentsdelivered
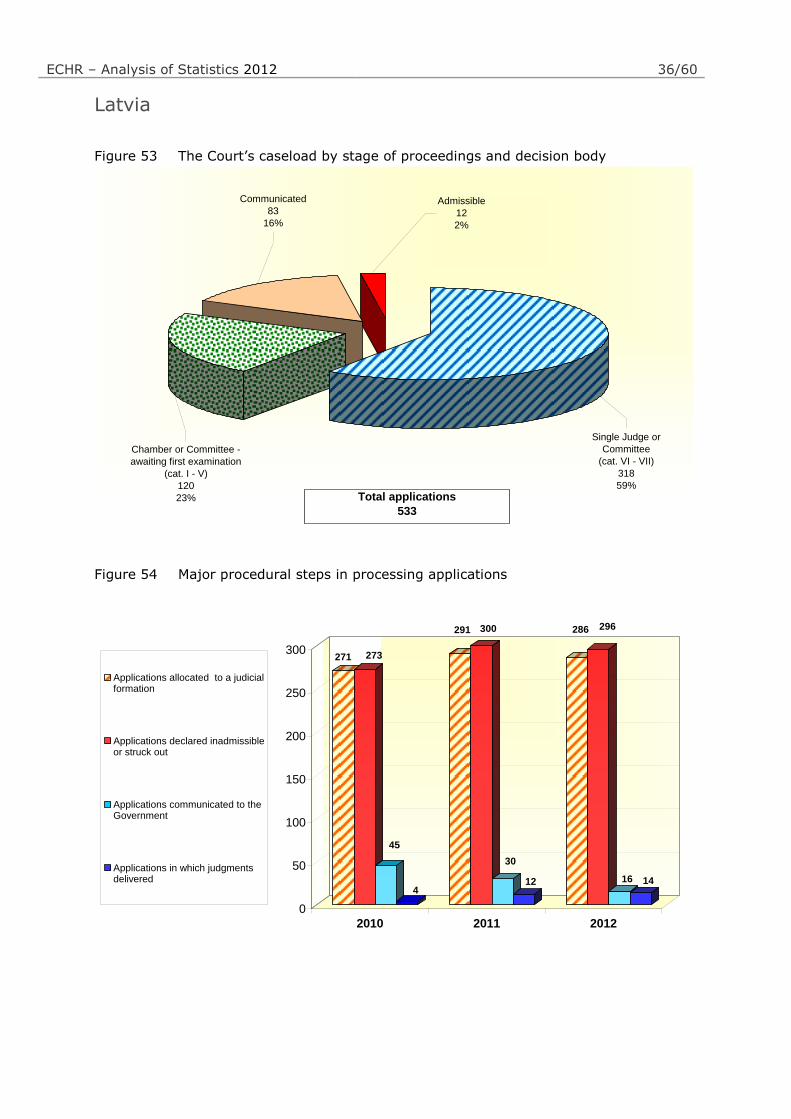
ECHR – Analysis of Statistics 2012 36/60
Latvia
Figure 53 The Court’s caseload by stage of proceedings and decision body
Single Judge or
Committee
(cat. VI - VII)
318
59%
Chamber or Committee -
awaiting first examination
(cat. I - V)
120
23%
Communicated
83
16%
Admissible
12
2%
Total applications
533
Figure 54 Major procedural steps in processing applications
271 273
45
4
291 300
30
12
286 296
16 14
0
50
100
150
200
250
300
2010 2011 2012
Applications allocated to a judicialformation
Applications declared inadmissibleor struck out
Applications communicated to theGovernment
Applications in which judgmentsdelivered

ECHR – Analysis of Statistics 2012 37/60
Liechtenstein
Figure 55 The Court’s caseload by stage of proceedings and decision body
Single Judge or
Committee
(cat. VI - VII)
11
79%
Chamber or Committee -
awaiting first examination
(cat. I - V)
2
14%
Communicated
1
7%
Total applications
14
Figure 56 Major procedural steps in processing applications
15 15
01
9
10
2
0
16
15
0 0
0
2
4
6
8
10
12
14
16
2010 2011 2012
Applications allocated to a judicialformation
Applications declared inadmissibleor struck out
Applications communicated to theGovernment
Applications in which judgmentsdelivered

ECHR – Analysis of Statistics 2012 38/60
Lithuania
Figure 57 The Court’s caseload by stage of proceedings and decision body
Single Judge or
Committee
(cat. VI - VII)
99
40%
Chamber or Committee -
awaiting first examination
(cat. I - V)
76
31%
Communicated
67
27%
Admissible
4
2%
Total applications
246
Figure 58 Major procedural steps in processing applications
242
153
15 8
305
152
22 10
373
705
26 12
0
100
200
300
400
500
600
700
800
2010 2011 2012
Applications allocated to a judicialformation
Applications declared inadmissibleor struck out
Applications communicated to theGovernment
Applications in which judgmentsdelivered

ECHR – Analysis of Statistics 2012 39/60
Luxembourg
Figure 59 The Court’s caseload by stage of proceedings and decision body
Single Judge or
Committee
(cat. VI - VII)
5
71%
Communicated
2
29%
Total applications
7
Figure 60 Major procedural steps in processing applications
44
39
4 7
24
66
2 3
3130
1 2
0
10
20
30
40
50
60
70
2010 2011 2012
Applications allocated to a judicialformation
Applications declared inadmissibleor struck out
Applications communicated to theGovernment
Applications in which judgmentsdelivered

ECHR – Analysis of Statistics 2012 40/60
Malta
Figure 61 The Court’s caseload by stage of proceedings and decision body
Admissible
6
16%
Single Judge or
Committee
(cat. VI - VII)
4
11%
Communicated
13
35%
Chamber or Committee -
awaiting first examination
(cat. I - V)
14
38%Total applications
37
Figure 62 Major procedural steps in processing applications
23
14
12
4
22
6
4
13
26
20
13
3
0
5
10
15
20
25
30
2010 2011 2012
Applications allocated to a judicialformation
Applications declared inadmissibleor struck out
Applications communicated to theGovernment
Applications in which judgmentsdelivered

ECHR – Analysis of Statistics 2012 41/60
Republic of Moldova
Figure 63 The Court’s caseload by stage of proceedings and decision body
Chamber or Committee -
awaiting first examination
(cat. I - V)
613
19%
Communicated
211
6%
Single Judge or
Committee
(cat. VI - VII)
2373
73%
Admissible
17
1%
Pending Government
action
42
1%
Total applications
3 256
Figure 64 Major procedural steps in processing applications
945
434
135
29
1021
550
11842
938
1905
56 32
0
200
400
600
800
1000
1200
1400
1600
1800
2000
2010 2011 2012
Applications allocated to a judicialformation
Applications declared inadmissibleor struck out
Applications communicated to theGovernment
Applications in which judgmentsdelivered

ECHR – Analysis of Statistics 2012 42/60
Monaco
Figure 65 The Court’s caseload by stage of proceedings and decision body
Single Judge or
Committee
(cat. VI - VII)
1
17%
Chamber or Committee -
awaiting first examination
(cat. I - V)
1
17%
Communicated
4
66%
Total applications
6
Figure 66 Major procedural steps in processing applications
13
7
0 0
8
14
1
0
5
7
5
0
0
2
4
6
8
10
12
14
2010 2011 2012
Applications allocated to a judicialformation
Applications declared inadmissibleor struck out
Applications communicated to theGovernment
Applications in which judgmentsdelivered

ECHR – Analysis of Statistics 2012 43/60
Montenegro
Figure 67 The Court’s caseload by stage of proceedings and decision body
Single Judge or
Committee
(cat. VI - VII)
676
79%
Chamber or Committee -
awaiting first examination
(cat. I - V)
137
16%
Communicated
30
4%
Admissible
5
1%
Total applications
848
Figure 68 Major procedural steps in processing applications
305
45
28
2
314
135
24
8
180 181
415
0
50
100
150
200
250
300
350
2010 2011 2012
Applications allocated to a judicialformation
Applications declared inadmissibleor struck out
Applications communicated to theGovernment
Applications in which judgmentsdelivered

ECHR – Analysis of Statistics 2012 44/60
Netherlands
Figure 69 The Court’s caseload by stage of proceedings and decision body
Chamber or Committee -
awaiting first examination
(cat. I - V)
295
28%
Communicated
61
6%
Single Judge or
Committee
(cat. VI - VII)
705
66%
Admissible
1
0,1%
Total applications
1 062
Figure 70 Major procedural steps in processing applications
727
299
314
800
485
27 6
675
859
37 7
0
100
200
300
400
500
600
700
800
900
2010 2011 2012
Applications allocated to a judicialformation
Applications declared inadmissibleor struck out
Applications communicated to theGovernment
Applications in which judgmentsdelivered
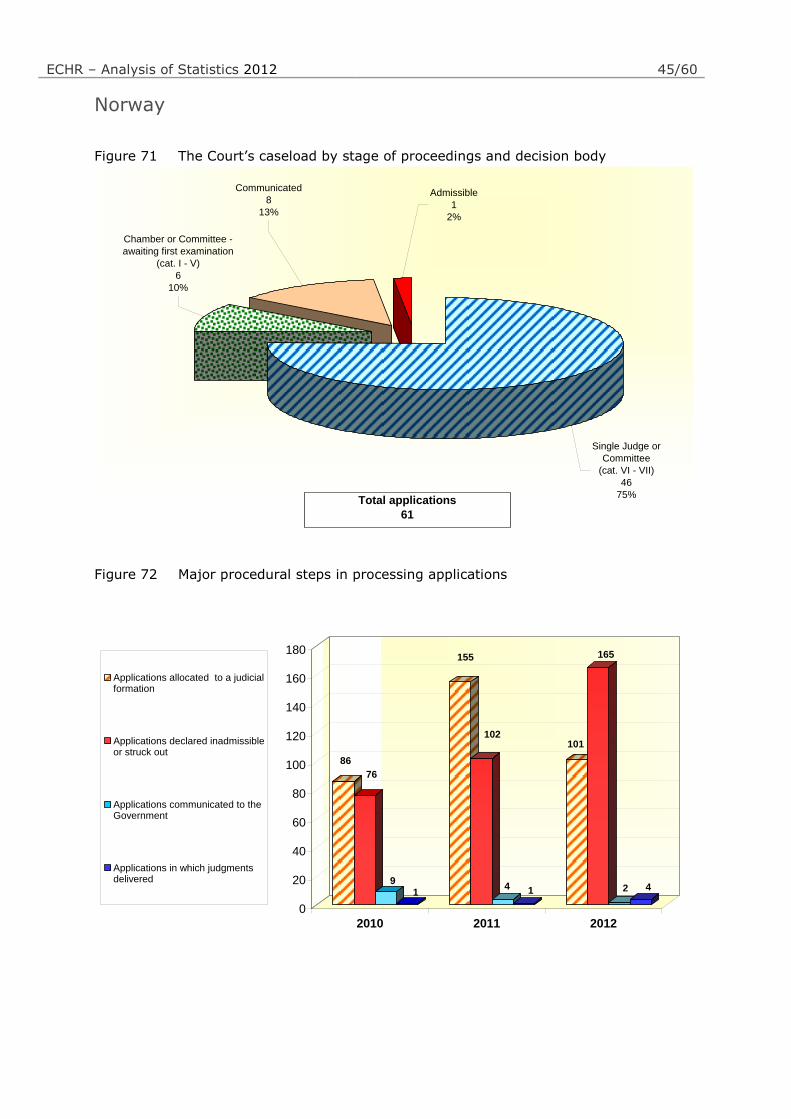
ECHR – Analysis of Statistics 2012 45/60
Norway
Figure 71 The Court’s caseload by stage of proceedings and decision body
Single Judge or
Committee
(cat. VI - VII)
46
75%
Chamber or Committee -
awaiting first examination
(cat. I - V)
6
10%
Communicated
8
13%
Admissible
1
2%
Total applications
61
Figure 72 Major procedural steps in processing applications
86
76
91
155
102
4 1
101
165
2 4
0
20
40
60
80
100
120
140
160
180
2010 2011 2012
Applications allocated to a judicialformation
Applications declared inadmissibleor struck out
Applications communicated to theGovernment
Applications in which judgmentsdelivered

ECHR – Analysis of Statistics 2012 46/60
Poland
Figure 73 The Court’s caseload by stage of proceedings and decision body
Single Judge or
Committee
(cat. VI - VII)
393
12,7%
Chamber or Committee -
awaiting first examination
(cat. I - V)
2363
76,1%
Communicated
306
9,9%
Admissible
43
1,4%
Total applications
3 105
Figure 74 Major procedural steps in processing applications
5777
3924
315108
5023 5038
24772
4077
7283
192 74
0
1000
2000
3000
4000
5000
6000
7000
8000
2010 2011 2012
Applications allocated to a judicialformation
Applications declared inadmissibleor struck out
Applications communicated to theGovernment
Applications in which judgmentsdelivered

ECHR – Analysis of Statistics 2012 47/60
Portugal
Figure 75 The Court’s caseload by stage of proceedings and decision body
Single Judge or
Committee
(cat. VI - VII)
98
45%
Chamber or Committee -
awaiting first examination
(cat. I - V)
59
27%
Communicated
56
26%
Admissible
4
2%
Total applications
217
Figure 76 Major procedural steps in processing applications
186
116
61
35
164
123
35
48
217
239
37
25
0
50
100
150
200
250
2010 2011 2012
Applications allocated to a judicialformation
Applications declared inadmissibleor struck out
Applications communicated to theGovernment
Applications in which judgmentsdelivered

ECHR – Analysis of Statistics 2012 48/60
Romania
Figure 77 The Court’s caseload by stage of proceedings and decision body
Admissible
45
0,5%
Single Judge or
Committee
(cat. VI - VII)
3021
35%
Pending Government
action
2971
34%
Communicated
1330
15%
Chamber or Committee -
awaiting first examination
(cat. I - V)
1345
15%Total applications
8 712
Figure 78 Major procedural steps in processing applications
5992
3650
422150
5130
4585
916
105
6790
10066
439155
0
2000
4000
6000
8000
10000
12000
2010 2011 2012
Applications allocated to a judicialformation
Applications declared inadmissibleor struck out
Applications communicated to theGovernment
Applications in which judgmentsdelivered
ECHR – Analysis of Statistics 2012 49/60
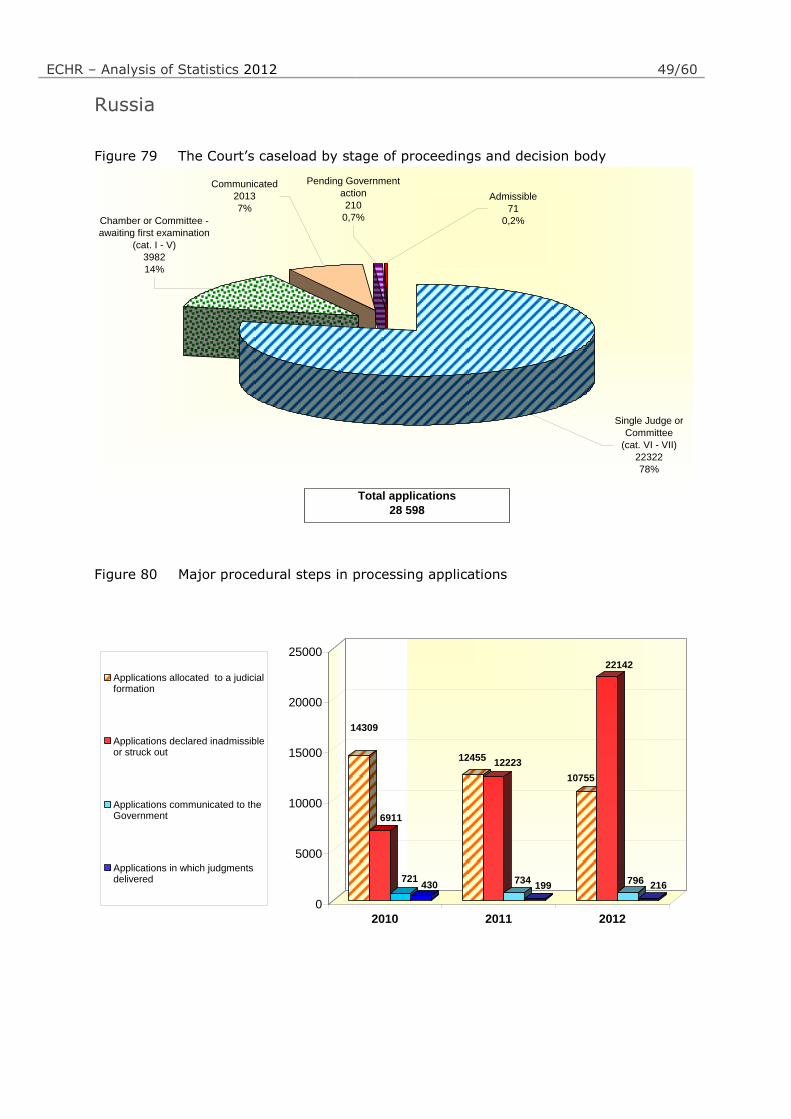
Russia
Figure 79 The Court’s caseload by stage of proceedings and decision body
Admissible
71
0,2%
Pending Government
action
210
0,7%Chamber or Committee -
awaiting first examination
(cat. I - V)
3982
14%
Communicated
2013
7%
Single Judge or
Committee
(cat. VI - VII)
22322
78%
Total applications
28 598
Figure 80 Major procedural steps in processing applications
14309
6911
721430
1245512223
734199
10755
22142
796216
0
5000
10000
15000
20000
25000
2010 2011 2012
Applications allocated to a judicialformation
Applications declared inadmissibleor struck out
Applications communicated to theGovernment
Applications in which judgmentsdelivered

ECHR – Analysis of Statistics 2012 50/60
San Marino
Figure 81 The Court’s caseload by stage of proceedings and decision body
Communicated
1
50%
Chamber or Committee -
awaiting first examination
(cat. I - V)
1
50%
Total applications
2
Figure 82 Major procedural steps in processing applications
4
5 5
0 0
3 3
1 1 1
0
1
0
0,5
1
1,5
2
2,5
3
3,5
4
4,5
5
2010 2011 2012
Applications allocated to a judicialformation
Applications declared inadmissibleor struck out
Applications communicated to theGovernment
Applications in which judgmentsdelivered

ECHR – Analysis of Statistics 2012 51/60
Serbia
Figure 83 The Court’s caseload by stage of proceedings and decision body
Single Judge or
Committee
(cat. VI - VII)
2986
30%
Admissible
34
0,3%
Communicated
928
9%
Chamber or Committee -
awaiting first examination
(cat. I - V)
6105
61%
Total applications
10 053
Figure 84 Major procedural steps in processing applications
1566
1195
132 38
3726
449451
12
4900
1599
905
39
0
500
1000
1500
2000
2500
3000
3500
4000
4500
5000
2010 2011 2012
Applications allocated to a judicialformation
Applications declared inadmissibleor struck out
Applications communicated to theGovernment
Applications in which judgmentsdelivered

ECHR – Analysis of Statistics 2012 52/60
Slovakia
Figure 85 The Court’s caseload by stage of proceedings and decision body
Single Judge or
Committee
(cat. VI - VII)
264
54%
Chamber or Committee -
awaiting first examination
(cat. I - V)
142
30%
Communicated
58
12%
Admissible
17
4%
Total applications
481
Figure 86 Major procedural steps in processing applications
568
664
129
41
553
694
96
21
531
1079
4323
0
200
400
600
800
1000
1200
2010 2011 2012
Applications allocated to a judicialformation
Applications declared inadmissibleor struck out
Applications communicated to theGovernment
Applications in which judgmentsdelivered

ECHR – Analysis of Statistics 2012 53/60
Slovenia
Figure 87 The Court’s caseload by stage of proceedings and decision body
Chamber or Committee -
awaiting first examination
(cat. I - V)
109
5%
Communicated
122
6%Admissible
15
0,7%
Single Judge or
Committee
(cat. VI - VII)
1972
88%
Total applications
2 218
Figure 88 Major procedural steps in processing applications
837
581
328
6
424
517
90
16
422
1517
90
22
0
200
400
600
800
1000
1200
1400
1600
2010 2011 2012
Applications allocated to a judicialformation
Applications declared inadmissibleor struck out
Applications communicated to theGovernment
Applications in which judgmentsdelivered

ECHR – Analysis of Statistics 2012 54/60
Spain
Figure 89 The Court’s caseload by stage of proceedings and decision body
Single Judge or
Committee
(cat. VI - VII)
497
76%
Chamber or Committee -
awaiting first examination
(cat. I - V)
88
13%
Communicated
63
10%
Admissible
5
1%
Total applications
653
Figure 90 Major procedural steps in processing applications
689
454
11 16
807
871
4615
694
895
26 11
0
100
200
300
400
500
600
700
800
900
2010 2011 2012
Applications allocated to a judicialformation
Applications declared inadmissibleor struck out
Applications communicated to theGovernment
Applications in which judgmentsdelivered

ECHR – Analysis of Statistics 2012 55/60
Sweden
Figure 91 The Court’s caseload by stage of proceedings and decision body
Chamber or Committee -
awaiting first examination
(cat. I - V)
27
25%
Communicated
58
52%
Admissible
5
5%
Single Judge or
Committee
(cat. VI - VII)
20
18%
Total applications
110
Figure 92 Major procedural steps in processing applications
901
283
13 6
1942
2586
384
545
894
32 15
0
500
1000
1500
2000
2500
3000
2010 2011 2012
Applications allocated to a judicialformation
Applications declared inadmissibleor struck out
Applications communicated to theGovernment
Applications in which judgmentsdelivered

ECHR – Analysis of Statistics 2012 56/60
Switzerland
Figure 93 The Court’s caseload by stage of proceedings and decision body
Single Judge or
Committee
(cat. VI - VII)
790
77%
Chamber or Committee -
awaiting first examination
(cat. I - V)
172
17%
Communicated
63
6%
Admissible
5
0,5%
Total applications
1 030
Figure 94 Major procedural steps in processing applications
368
305
30
11
358
130
13 11
325
341
238
0
50
100
150
200
250
300
350
400
2010 2011 2012
Applications allocated to a judicialformation
Applications declared inadmissibleor struck out
Applications communicated to theGovernment
Applications in which judgmentsdelivered

ECHR – Analysis of Statistics 2012 57/60
“The former Yugoslav Republic of Macedonia”
Figure 95 The Court’s caseload by stage of proceedings and decision body
Single Judge or
Committee
(cat. VI - VII)
375
51%
Chamber or Committee -
awaiting first examination
(cat. I - V)
235
32%
Communicated
124
17%
Admissible
2
0,3%
Total applications
736
Figure 96 Major procedural steps in processing applications
422 456
95
15
376 380
38
6
354
618
155
8
0
100
200
300
400
500
600
700
2010 2011 2012
Applications allocated to a judicialformation
Applications declared inadmissibleor struck out
Applications communicated to theGovernment
Applications in which judgmentsdelivered

ECHR – Analysis of Statistics 2012 58/60
Turkey
Figure 97 The Court’s caseload by stage of proceedings and decision body
Single Judge or
Committee
(cat. VI - VII)
3430
20%
Chamber or Committee -
awaiting first examination
(cat. I - V)
11446
69%
Communicated
1935
11%
Admissible
65
0%
Total applications
16 876
Figure 98 Major procedural steps in processing applications
5821
3296
1311
501
8668
7527
458229
9098
7914
422134
0
1000
2000
3000
4000
5000
6000
7000
8000
9000
10000
2010 2011 2012
Applications allocated to a judicialformation
Applications declared inadmissibleor struck out
Applications communicated to theGovernment
Applications in which judgmentsdelivered

ECHR – Analysis of Statistics 2012 59/60
Ukraine
Figure 99 The Court’s caseload by stage of proceedings and decision body
Chamber or Committee -
awaiting first examination
(cat. I - V)
2284
22%
Communicated
1243
12%
Pending Government
action
1332
13%Single Judge or
Committee
(cat. VI - VII)
5357
51%
Admissible
230
2,2%
Total applications
10 446
Figure 100 Major procedural steps in processing applications
3962
3311
1587
119
4618
4647
743
107
7796
7305
1032
301
0
1000
2000
3000
4000
5000
6000
7000
8000
2010 2011 2012
Applications allocated to a judicialformation
Applications declared inadmissibleor struck out
Applications communicated to theGovernment
Applications in which judgmentsdelivered

ECHR – Analysis of Statistics 2012 60/60
United Kingdom
Figure 101 The Court’s caseload by stage of proceedings and decision body
Single Judge or
Committee
(cat. VI - VII)
678
20%
Chamber or Committee -
awaiting first examination
(cat. I - V)
2517
76%
Communicated
92
3%
Admissible
21
1%
Total applications
3 308
Figure 102 Major procedural steps in processing applications
2766
1175
68 23
1547
1028
60 30
1734
2047
48 35
0
500
1000
1500
2000
2500
3000
2010 2011 2012
Applications allocated to a judicialformation
Applications declared inadmissibleor struck out
Applications communicated to theGovernment
Applications in which judgmentsdelivered