analysis of suspended sediments and flow under sub
TRANSCRIPT
Analysis of suspended sediments and flow under sub-tropical
environment of Taiwan
SAMKELE S. TFWALA1, YU-MIN WANG
2*, AND YU-CHIEH LIN
2
1Department of Agriculture and International Cooperation
2Department of Civil Engineering
National Pingtung University of Science and Technology
1 Shuefu Road, Neipu, Pingtung, 91201
TAIWAN *Email: [email protected]
Abstract: - The total amount of suspended load carried by a stream during a year is usually transported during
one or more extreme events related to high river flows and intense rainfall, leading tohigh-suspended sediment
concentrations (SSC). Therefore, the purpose of the study is to build a model to estimate sediment discharge
based on observed flow and SSCfrom torrential rainfallevents.Price meter and depth-integrating suspended-
sediment sampler, model DH-59, are used to measure flow velocity and SSC, respectively during sixevents in
Shi-wen River, southern Taiwan. These data were collected every two hours in the period, July 2011 to
August2012.The results evidenced that sampling high flows is sufficient to generate SRC’s with higher
confidence (R2=0.87) in estimating sediment loadas it underestimated sediment load from Typhoon Nanmadol
by 18% compared to 73% from the 10-day interval SRC (R2=0.26) developed using data collected January,
2011 to August, 2012.
Key-Words: - suspended sediment, sediment discharge, flow, torrential rain, Shi-wen River, sub-tropical
1 Introduction Being located in a sub-tropic area, Taiwan faces
serious attacks from torrential rains accompanied
with typhoons during a summer-autumn season
(June to August), and has a mean precipitation of
2500 mm/year and reaches 3000-5000 mm/year in
the mountainous regions. The frequency of typhoon
with torrential rainfall happened one time for every
two years before year of 2000, once a year after
2000 and three to four times since 2008 [1]. These
typhoons induce severe hazards in the form of
flooding [2,3]. By comparing the rivers around the
world, the ones in Taiwan have the steepest slopes,
largest discharge per unit drainage area and the
shortest time of concentration [4]. The watersheds
are formed by fragile sandstone, and downstream
reaches of rivers have heavy deposits from the poor
geologic upstream catchments by these extreme
events. Consequently, sediment concentrations are
large, as evidenced by the fact that 7 of the 10
global rivers with the highest sediment yields are
Taiwanese [5]. These high sediment concentrations
worsen the severity of these disasters as illustrated
by [6] and [2]. In addition, damage caused by
typhoon Morakot in 2009 was mostly due to
sediment related disasters [1].
In the wake of such events, the ability to
accurately quantify sediment loads in rivers is
essential. However, measuring and estimating
suspended sediments concentrations (SSC) in rivers
have long been subject to confusion and uncertainty.
Many methods have been developed for collecting
data and estimating sediment discharge in rivers,
which suggests complexity in river studies.
According to [7], river study is necessary for
reliable forecasting, but it is a difficult task due to
the complexity and inherent non-linearity of its
hydrological system. Regardless of the complexity,
correct estimation of SSC is becoming more and
more essential in engineering design, planning,
maintenance, and operation of water resources [8].
In addition, suspended sediment has been identified
by [9] as a leading direct cause of river impairments.
For example, high concentration of suspended
sediment can increase cost of water treatment;
damage pumps and turbines; fill reservoirs; impede
navigation and increase frequency and severity of
floods by reducing channel capacities. The
sediments in a river are usually caused by erosion
on upstream section, washing of soil within
catchment area or because of man interfering with
riverbed.
There are two common approaches for
estimating suspended load; first one being the
interpolation procedure [10]. This requires regular
sediment sampling over a relatively long period.
Recent Advances in Energy and Environment Integrated Systems
ISBN: 978-1-61804-181-4 86
The load is estimated as a product of mean sediment
concentration and water discharge over some time
such as 1 hr, 1 day, or 1 month. The second
approach is the regression analysis (Walling and
Webb 1981), the most popular of which is the
sediment-rating curve (SRC) [11, 12]. A sediment-
rating curve is an empirical relationship between
suspended sediment concentration, C (mg/L) and
the associated discharge Q (m3/s), and since SSC
and sediment discharge often vary over several
orders of magnitude the rating curve is expressed in
a form of a power function:
C=aQb (1)
Where C is the suspended sediment
concentration; Q is water discharge; and a, b are
coefficients. The coefficients a and b are dependent
on each river and are determined by mechanism of
transport. The rating curve is assumed to represent a
continuous relationship over the entire range of
water discharge. Thus one can apply a full range of
Q records to interpolate (sometimes extrapolate)
suspended loads over a given time period. Using the
established SRC and the available continuous
discharge data, sediment load for a given period
maybe calculated by summing daily loads or by the
magnitude frequency method [13]. The main
advantage of the rating curve method is that long-
term historical data can be stratified and more than
one rating curve for specific time intervals can be
constructed [14].
Most suspended sediments move during
infrequent high flows that collectively account for
only a small portion of the measurement period [15].
According to [16], one variability in the sediment
transport that should be considered is the season of
the year and the relative magnitude of the
precipitation. [11] earlier report this when they
demonstrated a decrease of the coefficient of
determination (R2) from 0.85 in summer to 0.39 in
winter. The associated high transport rates and
variances dictates that most data be collected during
high flows as suggested by [17] in his study on
concentration and transport in Slovene rivers.
However, the infrequency and brevity of the high
flow periods combined with measurement and
access cause acute problems in collecting data.
Nonetheless, data collected during high flows are
still essential to the development of good rating
curves. Hence, the purpose of the paper is to
estimate sediment discharge through rating curves
developed from data collected during torrential
rainfall events.
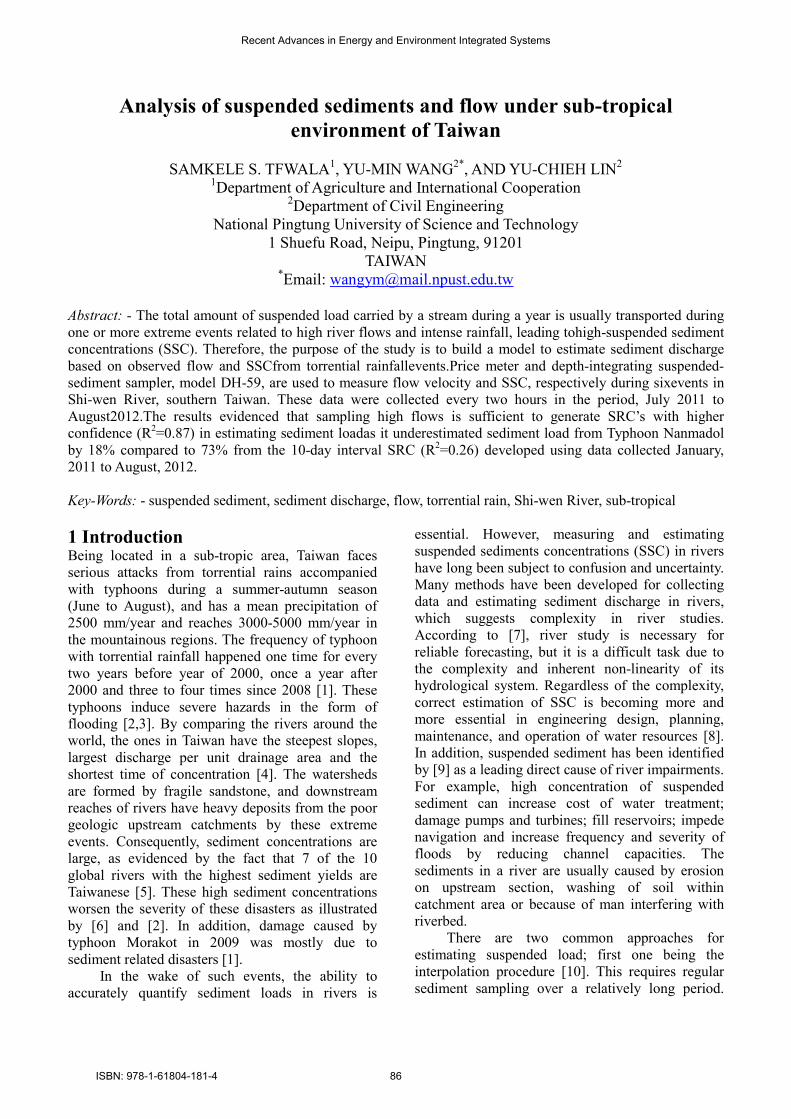
2 MATERIALS AND METHODS 2.1 Study Area Our study area was in Shiwen River, located (21°34
48 North latitude and 120°47 56 East longitude)
in the southern part of Taiwan (Fig.1). The length of
the main stream is about 22.3 km and the basin
covers 89.61 km2. The average slope is about 0.03
with a design flood at 1300 m3/s.
Fig.1 Shi-wen river basin
2.2 Monitoring suspended sediment
concentration The Taiwan Water Resources Agency (WRA)
manually measures discharge and corresponding
concentrations of suspended sediment three times a
month (10 days interval) at Shiwen River as part of
river management. Based on these measurements,
rating curves of flow discharge and sediment
discharge were obtained. For the same station, we
collected the same data during six torrential rainfall
events for estimating sediment discharge through
establishment of a sediment-rating curve. These
events included four typhoons, namely, Nanmadol
(28 August to 31 August 2011), Talim (20 June to 21
June 2011), Saola (2 August to 3 August 2012) and
Tembin (24-25 August and 28 August 2012). During
these events, samples were collected every two
hours using DH-59 and price meter for SSC and
flow velocity respectively. [18] give the operation
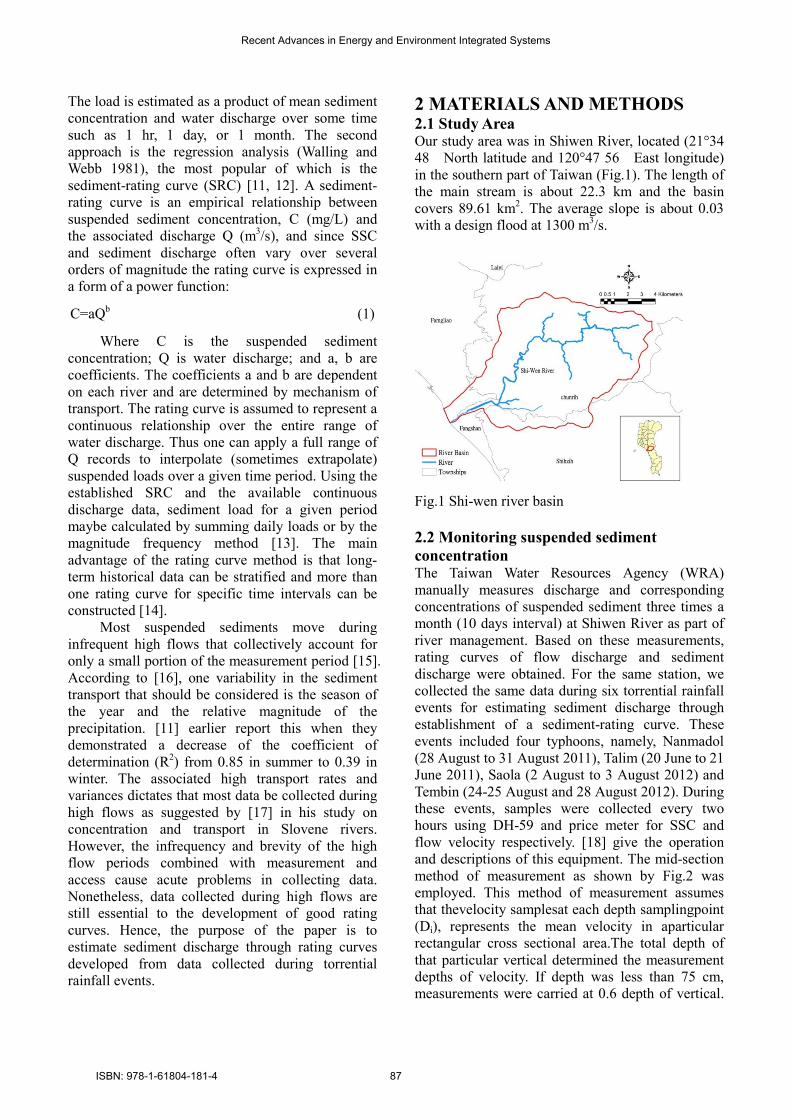
and descriptions of this equipment. The mid-section
method of measurement as shown by Fig.2 was
employed. This method of measurement assumes
that thevelocity samplesat each depth samplingpoint
(Di), represents the mean velocity in aparticular
rectangular cross sectional area.The total depth of
that particular vertical determined the measurement
depths of velocity. If depth was less than 75 cm,
measurements were carried at 0.6 depth of vertical.
Recent Advances in Energy and Environment Integrated Systems
ISBN: 978-1-61804-181-4 87
If depths were more than 75 cm, measurements
were done at 0.2 and 0.8 depths of verticals.The
partial area extends laterally from half the distance
from the preceding meter location to half the
distance to the next, and vertically from the water
surface to the measured
Fig.2 Sketch of mid-section method for computing
cross-sectional area for discharge
depth and the computations are done using equation
2 to equation 4 based on Fig.2.
� � ��� � ���… . . ���� � ��� (2)
� 0.68 � � � 0.005 (3)
� � � � � ��� ��� � � � ��� (4)
Where A is area (m2), W is width of each segment
(m), D is depth (m), V is velocity (m2/s), and N
(rev/s) Q is discharge (m3/s).
The collected samples were subsequently
taken to the Hydraulic laboratory at National
Pingtung University of Science and Technology
(NPUST) and their sediment concentrations were
measured using the evaporation method. Units of
measurement of sediment concentration are reported
in the USGS field methods measurement of fluvial
sediment [18] as follows: Milligrams of sediment
per litre of water. However, as a matter of
convenience, we determined it in the laboratory in
parts per million (ppm), which is the dry weight of
suspended material per million equal weights of
water-sediment mixture, or milligrams (mg) per
kilogram (kg). It is found by the formulae: parts per
million = (weight of sediment * 1000000)/ (weight
of water-sediment mixture).
The observed sediment discharge is obtained
by multiplying the corresponding water discharge
by SSC. Water discharge (Q) at the sampling cross
section was measured using the velocity area
method and computed by equation 4. We compared
the sediment-rating curve from the 10 days interval
and that from the torrential rainfall events.
Regression analysis is employed for the analysis of
sediment discharge and flow.
3 Results and discussion 3.1 Behaviour of suspended sediment during
the torrential events In this study, suspended sediment samples were
collected every two hours during torrential events.
The sediment discharge was estimated accordingly.
The important hydraulic characteristics of the six
torrential events are given in Table 1. Among the six
events, event 3 (Typhoon Nanmadol) had the
highest duration (64 hours). Thus, observed
concentration of suspended sediments were
extremely high, with maximum observed value at
50014 ppm. The least SSC was observed in event 5
(Typhoon Saola), having 6920 ppm in a duration of
24 hours. Event 1, which was not a typhoon,
resulted to a peak discharge (Q) of 72 cubic metre
per second (cms) and maximum SSC of 16547 ppm.
Table 1 shows that maximum Q does not always
coincide with maximum Qs. For example, maximum
Q for event 1 was 72 cms, but maximum Qs
occurred when Q was 70 cms. The same happened
for event 2. Similarly, discharge does not always
coincide with SSC. The maximum values of SSC
preceded those of discharge for events 1, 2 and 3
(Fig.4). It was concluded that some soil sediments
accumulated in the watershed during the dry season
or some were deposited on the riverbed during the
fall of river discharge from previous floods. Hence,
the first events even though they had less peak
discharge compared to other events, they resulted to
increased values of SSC and Qs due to readily
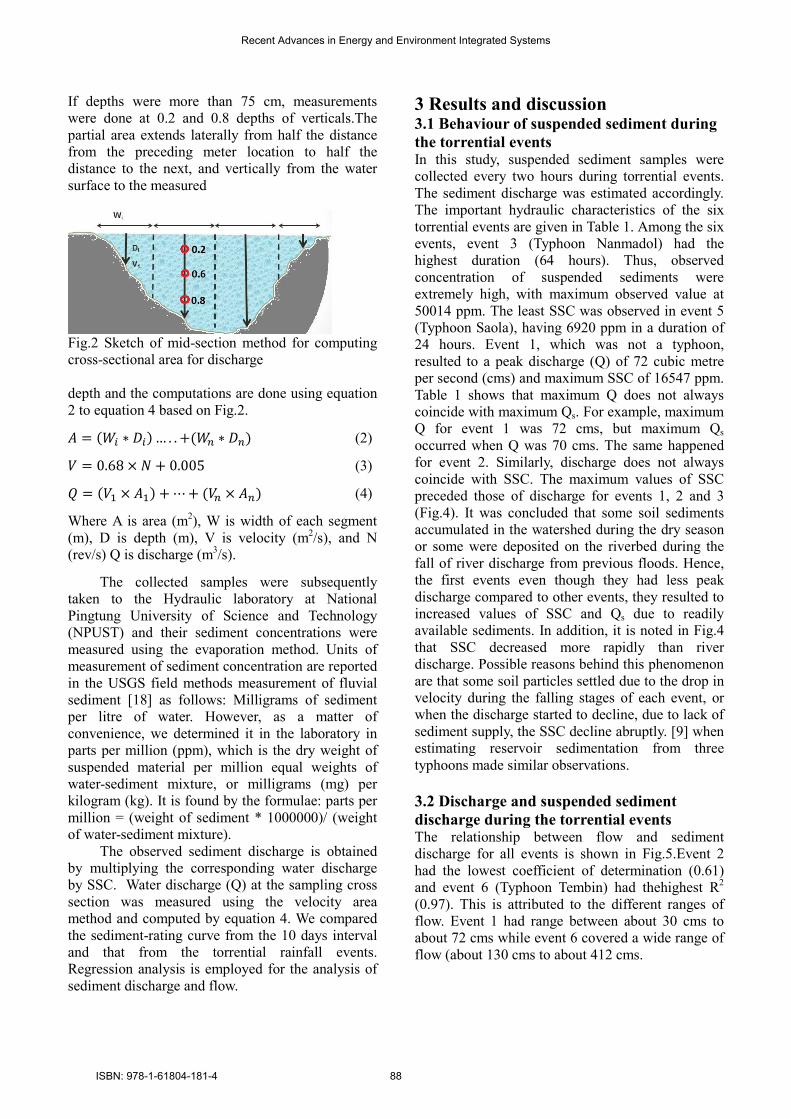
available sediments. In addition, it is noted in Fig.4
that SSC decreased more rapidly than river
discharge. Possible reasons behind this phenomenon
are that some soil particles settled due to the drop in
velocity during the falling stages of each event, or
when the discharge started to decline, due to lack of
sediment supply, the SSC decline abruptly. [9] when
estimating reservoir sedimentation from three
typhoons made similar observations.
3.2 Discharge and suspended sediment
discharge during the torrential events The relationship between flow and sediment
discharge for all events is shown in Fig.5.Event 2
had the lowest coefficient of determination (0.61)
and event 6 (Typhoon Tembin) had thehighest R2
(0.97). This is attributed to the different ranges of
flow. Event 1 had range between about 30 cms to
about 72 cms while event 6 covered a wide range of
flow (about 130 cms to about 412 cms.
Recent Advances in Energy and Environment Integrated Systems
ISBN: 978-1-61804-181-4 88
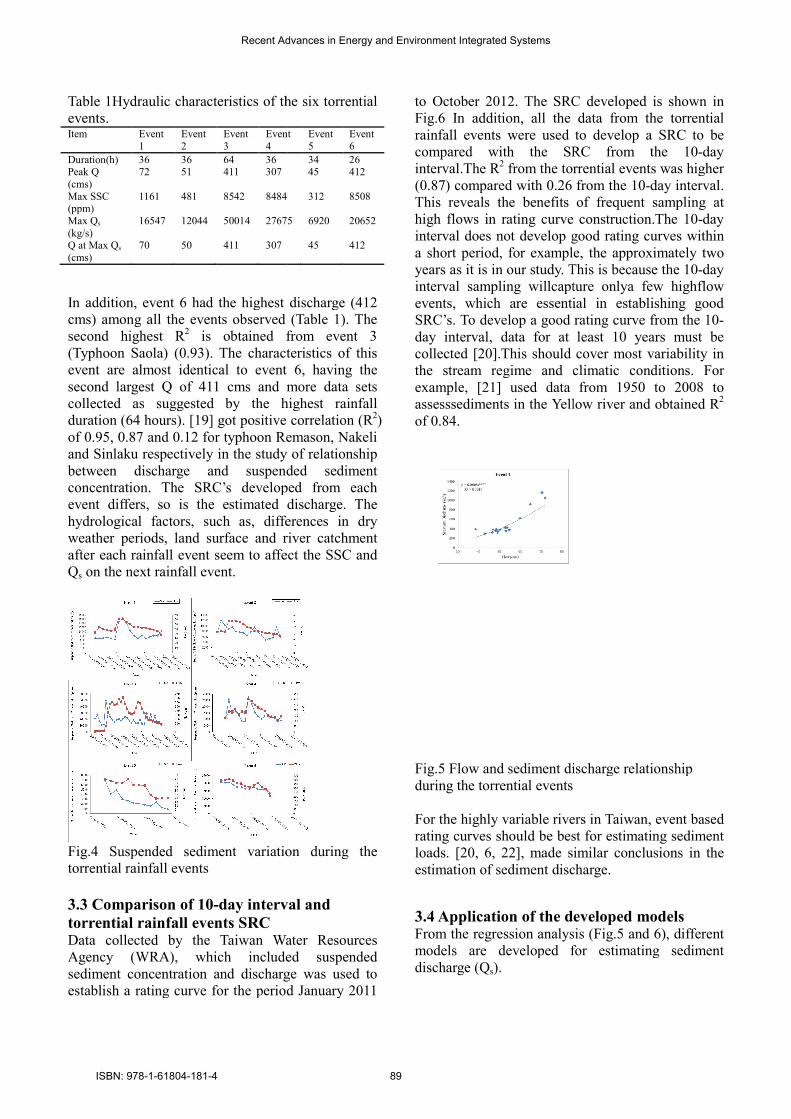
Table 1Hydraulic characteristics of the six torrential
events. Item Event
1
Event
2
Event
3
Event
4
Duration(h) 36 36 64 36 Peak Q
(cms)
72 51 411 307
Max SSC (ppm)
1161 481 8542 8484
Max Qs
(kg/s)
16547 12044 50014 27675
Q at Max Qs
(cms)
70 50 411 307
In addition, event 6 had the highest discharge (412
cms) among all the events observed (Table 1). The
second highest R2 is obtained from event 3
(Typhoon Saola) (0.93). The characteristics of this
event are almost identical to event 6, having the
second largest Q of 411 cms and more data sets
collected as suggested by the highest rainfall
duration (64 hours). [19] got positive correlation (R
of 0.95, 0.87 and 0.12 for typhoon Remason, Nakeli
and Sinlaku respectively in the study of relationship
between discharge and suspended sediment
concentration. The SRC’s developed from each
event differs, so is the estimated discharge. The
hydrological factors, such as, differences in dry
weather periods, land surface and river catchment
after each rainfall event seem to affect the SSC and
Qs on the next rainfall event.
Fig.4 Suspended sediment variation during the
torrential rainfall events
3.3 Comparison of 10-day interval and
torrential rainfall events SRC Data collected by the Taiwan Water Resources
Agency (WRA), which included suspended
sediment concentration and discharge was used to
establish a rating curve for the period January 2011
Hydraulic characteristics of the six torrential
Event Event
5
Event
6
34 26 45 412
8484 312 8508
27675 6920 20652
45 412
In addition, event 6 had the highest discharge (412
cms) among all the events observed (Table 1). The
is obtained from event 3
(Typhoon Saola) (0.93). The characteristics of this
event are almost identical to event 6, having the
rgest Q of 411 cms and more data sets
collected as suggested by the highest rainfall
got positive correlation (R2)
of 0.95, 0.87 and 0.12 for typhoon Remason, Nakeli
and Sinlaku respectively in the study of relationship
scharge and suspended sediment
concentration. The SRC’s developed from each
event differs, so is the estimated discharge. The
hydrological factors, such as, differences in dry
weather periods, land surface and river catchment
to affect the SSC and
4 Suspended sediment variation during the
day interval and
Data collected by the Taiwan Water Resources
Agency (WRA), which included suspended
sediment concentration and discharge was used to
establish a rating curve for the period January 2011
to October 2012. The SRC developed is shown in
Fig.6 In addition, all the data from the torrential
rainfall events were used to develop a SRC to be
compared with the SRC from the 10
interval.The R2 from the torrential events was higher
(0.87) compared with 0.26 from the 10
This reveals the benefits of frequ
high flows in rating curve construction.
interval does not develop good rating curves within
a short period, for example, the approximately two
years as it is in our study. This is because the 10
interval sampling willcapture
events, which are essential in establishing good
SRC’s. To develop a good rating curve from the
day interval, data for at least 10 years must be
collected [20].This should cover most variability in
the stream regime and climatic conditions. For
example, [21] used data from 1950 to 2008 to
assesssediments in the Yellow river and obtained R
of 0.84.
Fig.5 Flow and sediment discharge relationship
during the torrential events
For the highly variable rivers in Taiwan, event based
rating curves should be best for estimating sediment
loads. [20, 6, 22], made similar conclusions in the
estimation of sediment discharge.
3.4 Application of the developed modelsFrom the regression analysis (
models are developed for estimating sediment
discharge (Qs).
to October 2012. The SRC developed is shown in
the data from the torrential
rainfall events were used to develop a SRC to be
compared with the SRC from the 10-day
from the torrential events was higher
(0.87) compared with 0.26 from the 10-day interval.
This reveals the benefits of frequent sampling at
high flows in rating curve construction.The 10-day
interval does not develop good rating curves within
a short period, for example, the approximately two
This is because the 10-day
capture onlya few highflow
events, which are essential in establishing good
SRC’s. To develop a good rating curve from the 10-
interval, data for at least 10 years must be
This should cover most variability in
the stream regime and climatic conditions. For
used data from 1950 to 2008 to
assesssediments in the Yellow river and obtained R2
Flow and sediment discharge relationship
For the highly variable rivers in Taiwan, event based
rating curves should be best for estimating sediment
, made similar conclusions in the
estimation of sediment discharge.
3.4 Application of the developed models the regression analysis (Fig.5 and 6), different
models are developed for estimating sediment
Recent Advances in Energy and Environment Integrated Systems
ISBN: 978-1-61804-181-4 89

Fig.6 SRC from the 10-days interval and all the
torrential rainfall events
To evaluate their applicability, we applied Q from
all the events to each of the developed models and
results are shown in Fig.7. Models from events 1
and 5 shows over estimation of Qs mainly because
the flow data used to develop these models is small
and is comprised of low flows (30 to 80 cms) as
seen in Fig.5. The 10-days interval shows
underestimation of Qs since when there is no
typhoon or torrential event, very limited sediments
will be washed to river bodies. Further, to evaluate
applicability, we selected models from low
discharge (Event 1, having 30 to 80 cms), high
discharge (Event 6, having 200 to 412 cms), 10 days
interval and all torrential events to compare with the
observed sediment load for Typhoon Nanmadol
(Table 2). From the table, we can observe as already
illustrated by Fig.7 that Event 1 overestimates
(224%) and the model from the 10 days interval
underestimates suspended load by 73%. The model
from all the torrential events shows better estimation
when compared to all events though it
underestimates suspended load by 17%. In addition,
the results further reveal that to develop a good
relationship between Q and Qs we need more data to
capture most variation, one storm event and of low
variation are insufficient as illustrated by event 1
and 6. These further justify the use of rating curves
developed from combined torrential events such as
Typhoons.
Table 2 Observed and estimates of suspended load
for Typhoon Nanmadol. Item Sediment
load (MT)
Difference
from
observed
(MT)
Observed 0.94 0
Event 1 3.04 2.10
Event 6 0.07 0.86
10-days
interval
0.25 0.69
All torrential
events
0.77 0.17
days interval and all the
To evaluate their applicability, we applied Q from
all the events to each of the developed models and
7. Models from events 1
mainly because
the flow data used to develop these models is small
is comprised of low flows (30 to 80 cms) as
days interval shows
since when there is no
typhoon or torrential event, very limited sediments
will be washed to river bodies. Further, to evaluate
lected models from low
discharge (Event 1, having 30 to 80 cms), high
discharge (Event 6, having 200 to 412 cms), 10 days
interval and all torrential events to compare with the
observed sediment load for Typhoon Nanmadol
bserve as already
7 that Event 1 overestimates
(224%) and the model from the 10 days interval
underestimates suspended load by 73%. The model
from all the torrential events shows better estimation
when compared to all events though it
derestimates suspended load by 17%. In addition,
the results further reveal that to develop a good
we need more data to
capture most variation, one storm event and of low
variation are insufficient as illustrated by event 1
d 6. These further justify the use of rating curves
developed from combined torrential events such as
Observed and estimates of suspended load
Difference
(%)
0
224
-92
-73
-18
Fig.7 Comparison of the developed models
4Conclusions Developing a reliable and consistent method of
computing suspended sediment discharge within a
river is one of the most important practical
objectives of river studies. From the above analysis
and discussions, we can conclude that a suspended
sediment concentration is highly correlated to flow.
When the flow is high, chances of transporting huge
sediments are large. Estimating sediment discharge
from rating curves established from 10
yields lower correlation (R
rating curve from the combined torrential rainfall
events (R2 = 0.87). In addition, the 10
SRC underestimated observed sediment load for
Typhoon Nanmadol by 73% while the torrential
event SRC underestimated by 18%. We conclude
that sediment discharge should be estimated from
high rainfall events, because high a
attained within a few high rainfall events, unlike the
10 day-intervals, which may require long
to attain high accuracy.
5 AcknowledgementsThe authors gratefully acknowledge the financial
support from NSC Taiwan under the grant
NSC101-2625-M-020-003.
department of Civil engineering are thanked for
their assistance with collection of data.
References:
[1] Environmental Protecti
Typhoon Morakot. Retrieved on October 2,
2012 from the World
Web,http://www.epa.gov.tw
[2] S.L Yang,J.D. Milliman
dams later: erosion of the Yangtze
delta,Global and Planet Change
pp. 14-20
[3] S.L. Chen, G.A. Zhang
Shi, Temporal variations of fine suspended
sediment concentration in the Changjiang River
estuary and adjacent coastal waters,
7 Comparison of the developed models
Developing a reliable and consistent method of
suspended sediment discharge within a
river is one of the most important practical
objectives of river studies. From the above analysis
and discussions, we can conclude that a suspended
sediment concentration is highly correlated to flow.
high, chances of transporting huge
sediments are large. Estimating sediment discharge
from rating curves established from 10-day interval
yields lower correlation (R2 = 0.26) compared to
rating curve from the combined torrential rainfall
. In addition, the 10-day interval
SRC underestimated observed sediment load for
Typhoon Nanmadol by 73% while the torrential
event SRC underestimated by 18%. We conclude
that sediment discharge should be estimated from
high rainfall events, because high accuracy can be
attained within a few high rainfall events, unlike the
intervals, which may require long-term data
Acknowledgements The authors gratefully acknowledge the financial
support from NSC Taiwan under the grant of
. Colleagues from the
department of Civil engineering are thanked for
their assistance with collection of data.
Environmental Protection Administration-EPA,
Typhoon Morakot. Retrieved on October 2,
2012 from the World Wide
http://www.epa.gov.tw, 2009.
Milliman,P. Li, and K. Xu, 50000
dams later: erosion of the Yangtze River and its
Global and Planet Change,Vol.75, 2011,
G.A. Zhang, S.L. Young, and J.Z.
Temporal variations of fine suspended
sediment concentration in the Changjiang River
adjacent coastal waters,
Recent Advances in Energy and Environment Integrated Systems
ISBN: 978-1-61804-181-4 90
China,Journal of Hydrology,Vol.331, 2006, pp.
137-145.
[4] W.H. Teng, M.H. Hsu, C.H. Wu, and A.S. Chen,
Impact of flood disasters on Taiwan in the last
quarter century,Natural Hazards,Vol.37,
2006,pp. 191-207.
[5] J.D. Milliman, and J.P.M. Syvitski,
Geomorphic/tectonic control of sediment
discharge to the ocean: the importance of small
mountain rivers, Journal of Geology, Vol.100,
1992, pp. 525-544.
[6] J.D. Milliman, and S.J. Kao, Hypercpycnal
discharge of fluvial sediment discharge to the
ocean: impact of super typhoon Herb (1996) on
Taiwanese Rivers,Journal ofGeolology,Vol.113,
No.5, 2005,pp. 503-516.
[7] Y.M. Wang,S.M. Chen, and I. Tsou, Using
Artificial Neural network approach for
modelling rainfall-runoff,Journalof Earth
System Sciences, 2012, (in press).
[8] A. Altunkaynak, Sediment load prediction by
generic algorithms,Advanced Engineering
Software,Vol.40, No.9, 2009, pp. 928-934.
[9] H.Y. Lee, Y.T. Lin, and Y.J. Chiu, Quantitative
estimation of reservoir sedimentation from three
typhoon events,Journal of Hydrologic
Engineering,Vol.4, 2006,pp. 362-370.
[10] D.E. Walling, and B.W. Webb, The
reliability of suspended sediment load data; In:
Erosion and sediment transport measurement,
IAHS Publishers,Vol.133, 1981, pp. 177-194.
[11] A.J. Horowitz, An evaluation of sediment
rating curve for estimating suspended sediment
concentration for subsequent flux
calculations,Hydrological Processes,Vol.17,
2003, pp. 3387-3409.
[12] V. Mano, J. Némery, P. Belleudy, and A.
Poirel, Suspended Particle Matter dynamics in
four alpine watersheds (France): influence of
climatic regime and optimization of flux
calculation,Hydrological Processes,Vol.23,
2009, pp. 777-792.
[13] D.W. Crowder,M. Demissie, and M. Markus
M, The accuracy of sediment loads when log-
transformation produces nonlinear sediment
load discharge relationships,Journal of
Hydrology,Vol.336, 2007, pp. 250-268.
[14] S.J. Kao, and K.K. Liu, Estimating the
suspended load by using the historical
hydrometric record from the Lanyang-Hsi
watershed,Terrestrial, Atmosphericand Oceanic
Sciences,Vol.12, 2001,pp. 401-414.
[15] Y.M. Wang,T. Kerh, and S. Traore, Neural
Network Approach for Modelling River
Suspended Sediment Concentration Due to
Tropical Storms,Journal of Global Nest,Vol.11,
2009, pp. 457-466.
[16] P. Gao, and M. Josefson, Temporal
variations of suspended sediment transport in
Oneida Creek watershed, central New
York,Journal of Hydrology,Vol.426, 2012,pp.
17-27.
[17] F. Ulaga, Concentration and transport of
suspended sediment in Slovene
rivers,Geoenvironment,Vol.52, No.1, 2005,pp.
131-135.
[18] T.K. Edwards, and G.D.
Glysson,Techniques of water resources
investigations of the US-Geological survey:
Chapter 2 Field methods measurement of fluvial
sediment. Virginia, US, 1999.
[19] Y.T. Chu, and M.L. Hsu,The Relationship
between Discharge and Suspended Sediment
Concentration at Typhoon Events in Yu-Feng
Catchment,Journal of Geographic
Sciences,Vol.49, 2007, pp. 1-22.
[20] D.R. Moliere, K.G. Evans,M.J. Saynor, and
W.D. Erskine, Estimation of suspended
sediment loads in seasonal stream in the wet-dry
tropics, Australia,Hydrological Processes,Vol.18,
2004,pp. 531-544.
[21] P. Gao,X.M. Mu,F. Wang, and R. Li,
Changes in stream flow and sediment discharge
and the response to human activities in the
middle reaches of the Yellow river,Hydrology
and Earth System Sciences,Vol.15, 2011, pp. 1-
10.
[22] S.J. Kao,S.C. Chan, C.H. Kuo, and K.K. Liu,
Transport dominated sediment loading in
Taiwanese Rivers: A case study from the Ma-an
Stream,Journal of Geology,Vol.113, 2005, pp.
217-225.
Recent Advances in Energy and Environment Integrated Systems
ISBN: 978-1-61804-181-4 91