analysis of the droplet size reduction in a pmdi to the
TRANSCRIPT

Rochester Institute of Technology Rochester Institute of Technology
RIT Scholar Works RIT Scholar Works
Theses
2002
Analysis of the droplet size reduction in a pMDI to the addition of Analysis of the droplet size reduction in a pMDI to the addition of
a turbulence generating nozzle a turbulence generating nozzle
Michael Medlar
Follow this and additional works at: https://scholarworks.rit.edu/theses
Recommended Citation Recommended Citation Medlar, Michael, "Analysis of the droplet size reduction in a pMDI to the addition of a turbulence generating nozzle" (2002). Thesis. Rochester Institute of Technology. Accessed from
This Thesis is brought to you for free and open access by RIT Scholar Works. It has been accepted for inclusion in Theses by an authorized administrator of RIT Scholar Works. For more information, please contact [email protected].

ANALYSIS OF THE DROPLET SIZEREDUCTION IN A pMDI DUE TO THE
ADDITION OF A TURBULENCE GENERATINGNOZZLE
by
Michael P. Medlar
A Thesis Submitted inPartial Fulfillment of the
Requirement for the
MASTER OF SCIENCEIN
MECHANICAL ENGINEERING
Approved by:
Dr. Risa RobinsonDepartment ofMechanical Engineering
Mr. John WellinDepartment ofMechanical Engineering
Dr. Jeffrey KozakDepartment ofMechanical Engineering
Dr. Edward C. HenselDepartment Head ofMechanical Engineering
(Thesis advisor)
DEPARTMENT OF MECHANICAL ENGINEERINGROCHESTER INSTITUTE OF TECHNOLOGY
November, 2002

THESIS REPRODUCTION PERMISSION STATEMENT
Permission granted
ANALYSIS OF THE DROPLET SIZE REDUCTION IN ApMDI DUE TO THE ADDITION OF A TURBULENCE
GENERATING NOZZLE
I, Michael P. Medlar, hereby grant pennission to the Wallace Library of theRochester Institute of Technology to reproduce my thesis in whole or in part.Any reproduction will not be for commercial use or profit.
Date: /11/'·-;/200 2, Signature of Author: _

Abstract
Pharmaceutical inhalation aerosol technology has become an important therapy for the
treatment of both respiratory and non-respiratory illness. Targeting therapeutic aerosols to
the small airways of the lung can effectively treat many of these diseases. Delivery of the
therapeutic agent directly to the site of action, for cases involving respiratory diseases,
ensures an adequate therapeutic level of the drug is reached, without leading to side effects
due to high systemic concentrations. For non-respiratory diseases, the periphery of the lung
offers enormous surface area (approximately 100m2) for rapid absorption into circulation. In
either case, the appropriate spray characteristics (0.5 um<MMAD<5 um and a low velocity)
are vital to targeting the lung periphery.
In inhalation technology, specifically pressurized metered dose inhalers (pMDI),
many factors lead to the break-up or atomization of the formulation. These could include the
nozzle geometry, volatilization of the propellant (cavitation), and turbulence in the nozzle.
The purpose of this study was to design and analyze turbulence generating nozzles for the
improvement of existing pressurized metered dose inhaler therapy. The existence of
turbulence within the inhaler nozzle is one mechanism that leads to the production of the
aerosol in this device. The current inhaler internal flow passage was analyzed on a
turbulence basis and a baseline median representative droplet size was predicted using the
Huh atomization model. The analysis of this atomization model led to the conclusion that
changing the turbulence exit conditions in the inhaler through the addition of a nozzle could
lead to a reduced median secondary droplet size. To investigate this, simple nozzles were
designed to produce a turbulent flow condition on exit from the orifice. The flow condition
was analyzed using computational fluid dynamics software (CFD). The average turbulent
kinetic energy (kavg) and turbulent kinetic energy dissipation rate (savg) on exit from the
orifice were related to a representative secondary droplet size distribution using the Huh
atomization model. The nozzle with the largest potential (i.e. lowest median secondary drop
size) was optimized in 3D and a resulting median secondary drop size was predicted.
Development of the proper turbulence characteristics with this add-on nozzle led to a 15.5%
improvement of the representative secondary median droplet size based on turbulence effects
alone.

Table ofContents
Figures and Tables vi
Variables and Abbreviations viii
Chapter 1 -I introduction 1
1.1 Overview 1
1 .2 Review ofMedical Inhalation Therapy 1
1.2.1 Respiratory Disease Treatment 2
1 .2.2Non-respiratoryDisease Treatment 3
1 .3 Review ofCurrent Inhalation Devices 3
1.3.1 PressurizedMetered-Dose Inhaler (pMDI) 4
1 . 3 . 2 Dry Powder Inhaler (DPI) 5
1.3.3 Nebulizers 5
1 .4 Research Gaps 7
1.5 Scope of the Present Study 7
Chapter 2-Turbulence 9
2. 1 Introduction 9
2.2What is Turbulence? 9
2.3 Characteristics ofTurbulence 10
2.4 Turbulence Generation Mechanisms 1 1
2 . 5 Turbulence Modeling 12
2.5.1 Standard k-s Turbulence Model 14
Chapter 3-Atomization Process 16
3.1 Introduction 16
3 .2 General Atomization Process 1 6
3.2.1 Mechanisms ofAtomization 1 7
3.3 Atomizers 21
3.3.1 Pressure Atomizers 2 1
3.3.2 Rotary Atomizers 23
3.3.3 Air-Assist Atomizers 23
3.3.4 Airblast Atomizers 23
3.3.5 Other Atomizers 24
3 .4 AtomizationModels 24
3.4.1 Huh AtomizationModel 25
3 .4.2 Huh AtomizationModel Analysis 29
IV

Chapter 4-Modeling 33
4.1 Introduction 33
4.2 BaselineModel of Inhaler Internal Flow Passage 33
4.2. 1 BaselineModel Results 35
4.3 Design ofAdd-on Nozzles 39
4.3.1 NozzleModels 39
4.3 .2 Comparison ofAdd-on Nozzle Results 47
4.3.3 Optimization ofMulti-inlet Nozzle 1 48
4.3.4 3DModel ofMultiple Inlet Nozzle 1 51
4.4 Summary ofResults 55
Chapter 5-Conclusions 56
References 59
AppendixA-Manufacturing Process 64

Figures and Tables
Figures
Chapter 1
Figure 1.1. pMDI Schematic 4
Figure 1.2. Rotary planer DPI 5
Figure 1.3. Jet Nebulizer 6
Figure 1.4. Ultrasonic Nebulizer 6
Chapter 2
Figure 2.1. Transition from laminar to turbulent flow 1 0
Figure 2.2. Rapid fluid flow past a wall 1 1
Figure 2.3. Velocity gradients between fast and slow moving fluid streams 1 1
Figure 2.4. Fluid flow past a sharp angularity or corner 1 1
Chapter 3
Figure 3 . 1 . Jet breakup modes 1 8
Figure 3.2. Jet stability curve 20
Figure 3.3. Turbulence energy spectrum vs. drop diameter for decreasing Le 30
Figure 3.4. Turbulence length scale vs. average turbulent kinetic energy
dissipation rate with average turbulent kinetic energy as a parameter 3 1
Figure 3.5. Median droplet size vs. kavg/Savg ratio with kavg as a parameter 32
Chapter 4
Figure 4. 1 . Schematic ofbaseline inhaler model boundary conditions 34
Figure 4.2. Inhaler internal flow passage-contours of turbulent kinetic
energy, kavg=5.8 m2/s 35
Figure 4.3. Inhaler internal flow passage-contours of turbulent kinetic
energy dissipation rate, saVg=7.0e+04m2/s3
36
Figure 4.4. Inhaler internal flow passage-2D section of3D velocity contours 37
Figure 4.5. PDF for the baseline inhaler internal flow passage 37
Figure 4.6. Cumulative secondary drop size distribution 38
Figure 4.7. Schematic of add-on nozzle boundary conditions 40
Figure 4.8. Multiple inlet nozzle 1-four straight inlets, one angled
outlet-h=150um 41
Figure 4.9. Multiple inlet nozzle 1 mesh-inlet and h section (left), outlet
section (right) 41
Figure 4.10. Multiple inlet nozzle 2-version 1-two angled square inlets
and one outlet-h=150 um 42
Figure 4.1 1. Multiple inlet nozzle 2-version 2-two offset angled inlets
and one outlet- h=150 um 42
Figure 4.12. Multiple inlet nozzle 3 -version 1-two straight square inlets
and oneoutlet- h=l 50 urn 43
Figure 4.13. Multiple inlet nozzle 3-version 2-two straight square inlets
VI

and one outlet-h=100 um 43
Figure 4.14. W-nozzle-version 1-one angled rectangular inlet and one
ouflet-h=150 um 44
Figure 4.15. W-nozzle-version 2-one angled rectangular inlet and one
outlet-h=100 um 45
Figure 4.16. Mesh nozzle-twelve square inlets, one angledoutlet-h= 150 pm 45
Figure 4.17. Simple contraction nozzle-square inlet and
outlet-h=100 um 46
Figure 4.18. Stepped nozzle-square steps 46
Figure 4. 19. Combination multiple inlet and stepped nozzle-h=100 um 47
Figure 4.20. Multi-inlet nozzle 1 schematic 49
Figure 4.21 . Optimization results for geometric parameter, h 50
Figure 4.22. Optimization results for geometric parameter, s 50
Figure 4.23. 3D schematic ofmultiple inlet nozzle 1 51
Figure 4.24. Multiple inlet nozzle 1 -turbulent kinetic
energy, kavg on exit =60.8m2/s2
52
Figure 4.25. Multiple inlet nozzle 1 -turbulent kinetic
energy dissipation, savg on exit=8. 13e+06m2/s3
53
Figure 4.26. Secondary droplet size distribution for optimized
multiple inlet nozzle 1 54
Figure 4.27. Cumulative secondary drop size distribution for
optimized multiple inlet nozzle 1 54
Tables
Table 4. 1 . Initial 2D nozzle modeling results 48
Table 4.2. Initial 3D nozzle modeling results 48
vn

Variables and Abbreviations
Variables
C Normalization constant
Mc, L-n, (-E, V--E1, L,e2 Constants in the k-e turbulence model
D Any relevant diameter
F(x) Cumulative distribution function
g Gravitational acceleration
h Any relevant parameter or dimensionI Turbulent intensityk Turbulent kinetic energyL Any relevant length scaleOh Ohnesorge number
P Pressure
P Mean Pressure
P(x) Probability density functionRe Reynolds number
s Any relevant parameter or dimension
t Time
U Any mean velocityu Instantaneous velocity component
u Mean velocity componentu'
Fluctuating velocity component
X Independent variable, secondary drop diameter
4)(x) Turbulence energy spectrum
Turbulent kinetic energy dissipation rate
X Wave number
n Dynamic viscosity
p DensityX Shear stress, any relevant time scale
T Mean shear stress
'
Reynolds stress
Abbreviations and Subscripts
Avg Average
CF Cystic Fibrosis
CFD Computational Fluid Dynamics
DPI Dry Powder Inhaler
MMAD Mass Median Aerodynamic Diameter
Multi Multiple
PDF Probability Density Function
pMDI Pressurized Metered-Dose Inhaler
Vlll

Ver Version
A Atomizatione
Eddyf Fluid
8 Gas
0 Initial
* Turbulencew Wave growth
IX

M. P. Medlar
Chapter 1-Introduction
1.1 Overview
In the treatment of both respiratory and non-respiratory diseases, aerosol administration
represents a valuable means by which a therapeutic agent may be delivered. To manage
these illnesses effectively, the drugs must be targeted to the appropriate therapeutic or
biological site of action. In many cases, the suitable site of action is the small airways of the
lung. To target the lung periphery, the therapeutic aerosol must have the appropriate spray
characteristics (mass median aerodynamic diameter between 0.5 urn and 5um(1'2'3'4)
and as
low a velocity as possible). The objective of this study is to design and analyze an atomizing
nozzle for the purposes of improving Pharmaceutical Aerosol Inhalation Technology.
Existing means of inhalation devices include PressurizedMetered-Dose Inhalers (pMDI),
Dry Powder Inhalers (DPI), and Nebulizers. In this investigation, an add-on atomizing
nozzle was designed based on the concepts behind turbulence generation and the Huh
AtomizationModel(5)
to improve existing pMDI therapy. A computational fluid dynamic
analysis was done using a commercial software package to ensure that the atomizing nozzle
design enhanced the spray characteristics from the pMDI (namely, reduced the median
droplet size at a similar exit velocity).
1.2 Review ofMedical Inhalation Therapy
Pharmaceutical Inhalation Aerosol Technology has become an important therapy for the
treatment of both respiratory and non-respiratory illness. Targeting therapeutic aerosols to
the small airways of the lung can effectively treat many of these diseases. Delivery of the
therapeutic agent directly to its site of action, which is the case in respiratory diseases,
ensures that an adequate therapeutic level of the drug is reached, without leading to side
effects due to high systemic concentrations. For non-respiratory diseases, the periphery of
the lung offers enormous surface area (approximately 100m2) for rapid absorption into
circulation.(6)
In either case, this route of delivery represents a valuable means by which
diseases may be treated.

M. P. Medlar
1.2.1 Respiratory Disease Treatment
In respiratory diseases, the small airways are prone to a variety of diseases. Small airway
disease is a significant component of obstructive airway pathology. Emphysema, asthma,
bronchiectasis, extrinsic allergic alveolitis, sarcoidosis, cancer, and bacterial infections due to
Cystic Fibrosis can all involve the small airways.(7'8'9) To treat these diseases, drugs must be
effectively delivered to the small airways.
The treatment of asthma is a valid example. As indicated by Howarth(10), asthma is a
chronic inflammatory disease characterized by airway obstructions of varying degrees and
bronchial hyper-responsiveness. Thus, it can be treated with corticosteroids that have anti
inflammatory activity and bronchodilators. Inhaled bronchodilator therapies are targeted at
certain drug receptors called B2-adrenoceptors. These receptors are not evenly distributed
throughout the respiratory tract. The highest density of B2 receptors are found in the alveolar
walls in the lungperiphery/11)
In order to treat asthma effectively with bronchodilators, the
drugmust be delivered to the lower airways.
Cystic Fibrosis, CF, is another good example. According to Toso, Williams, and
Noone( )CF is a heterogeneous, autosomal recessive genetic disorder characterized by
abnormalities in exocrine gland function. The disease affects multiple organ systems,
including gastrointestinal, pulmonary, and reproductive systems. Progressive pulmonary
disease is a major cause of death. Bacterial infections play a central role in the progression
of lung disease in CF. They lead to progressive lung destruction, deterioration in lung
function, and eventual respiratory failure. Given this fact, antibiotics are a primary
component of therapy. Systemic antibiotic therapy usually leads to clinical improvement, but
the effect on bacterial colonization is variable and often transient. Direct delivery of
antibiotics to the lower airways by aerosol administration has a number of theoretical
advantages over the systemic route. First, inhalation allows for deposition of antibiotics at
the site of infection where high drug concentrations are needed to inhibit bacterial growth.
And second, aerosols permit lower drug doses without a compromise in efficacy, and this
may reduce systemic side effects and ultimately be more cost effective.
The lungs are a common site for primary malignancies or cancer. Sharma etal(7)
suggests that one potential treatment approach is targeted dose intensification using inhaled
chemotherapy for regional therapy. This type of therapy could achieve high levels of the

M. P. Medlar
drugs in pulmonary tissues without subjecting the patients to major surgical procedures and
keeping systemic side effects low. The total amount of drug required to adequately expose
the entire lung by inhalation is a small fraction of that required by the oral route. Drugs
delivered to the lung will most likely reach their tumors through the local bloodsupply.(7)
Pulmonary vasculature forms a separate circuit from the systemic circulation. The main
pulmonary artery starts in the right ventricle and then divides into two branches for the right
and left lungs. The branching continues until a fine capillary bed is formed at the level of the
alveolarwalls.(12)
So, to treat lung cancer effectively, in this context, drugs must be delivered
to the alveoli or the lung periphery.
1.2.2 Non-respiratory Disease Treatment
For non-respiratory disease treatment, pulmonary drug delivery offers two distinct
advantages for certain scenarios. First, pulmonary delivery offers a non-invasive option for
systemic therapy with large molecules such as insulin, growth hormone, interferons,
calcitonin, anderythropoietin.^
Often times, these drugs are injected and can't be taken
orally because enzymes in the stomach destroy the drugs. The inhalation route provides an
alternative to injections. Second, inhalation delivery can provide more rapid absorption into
systemic circulation than can be achieved by other non-invasive routes of delivery. The
lungs are efficiently permeable for delivering these macromolecules intocirculation.(6)
The
alveolar region is the target area for the deposition of drugs intended to have a rapid systemic
effect because absorption from this region is soefficient.(13)
This region has an effective
surface area of around100m2.(6)
Large drug particles are transported fairly rapidly across the
impermeable cell membrane of this region by a bucket brigade of tiny membrane bubbles, or
transcytotic vesicles, formed by invagination of the cellmembrane.(6)
The alveolar space in
the lung is used as a portal to systemic circulation and drugs must be delivered effectively to
this region to treat non-respiratory diseases appropriately.
1.3 Review ofCurrent InhalationDevices
There are three major categories ofmedical inhalation devices currently in use. All of them
have their advantages and drawbacks. They consist of the PressurizedMetered-Dose Inhaler
(pMDI), the Dry Powder Inhaler (DPI), and the Nebulizer.

M. P. Medlar
1.3.1 Pressurized Metered-Dose Inhaler (pMDI)
The fundamental components of the pMDI are illustrated in Figure 1.1. They include an
actuator, metering chamber, and a pressurized container or canister that contains the drug
suspension or solution, propellant, and surfactant. This device is relatively small, easy to
handle, portable, and inexpensive however, it has certain limitations. Often there is poor
coordination between actuation and inhalation in some patients leading to poor drug delivery.
Also, these devices initially release large droplets at high velocities. The droplets/particles
start with aMMAD around 35 urn and a velocity of 15-30 m/s on exit from theinhaler/1'14,15'
1'17)
It isn't until a distance of around 10-12 cm downstream from the nozzle that they reach
a mass median aerodynamic diameter (MMAD) of 2-6pjn.(14'18)
This leads to high
oropharyngeal impaction of the droplets with only about ten percent of the dose ending up in
the pulmonaryairways.(1'14'18'19)
There are certain accessory devices that have been
developed to overcome many of these limitations. Spacers and valved holding chambers,
when properly designed, reduce oropharyngeal deposition of the drug and reduce drug loss
associated with poor hand-breathcoordination/14'20*
Actuator
MeteringChamber
Actuator Orifice
Mouthpiece
Figure 1.1. pMDI Schematic

M. P. Medlar
1.3.2 Dry Powder Inhaler (DPI)
The drug in a dry powder inhaler is in the form of a finely milled powder in large aggregates,
either alone or in combination with a carrier substance. These devices can be breath
activated or take the form of a rotary planar configuration as in Figure 1.2. If breath
activated, they rely on the patient's inspiratory flow to deaggregate and deliver the drug for
inhalation. There is a need to generate a relatively high inspiratory flow (30-120 L/min) to
release particles of a respirable size (MMAD < 5 pm) and achieve deposition in the alveolar
space.(1-2-14-21'22-23-24)
xhe high inspiratory flows required for optimal delivery have raised
concerns about DPI effectiveness for patients with severe airwayobstructions/14*
Due to
their illness, these patients have difficulty developing the large flows. Also, dry powder
inhalation is hindered by aggregation of small particles, which is exacerbated by the
hygroscopic nature of the drug and its electrostatic charge. DPI's are only available with a
few anti-asthma drugs and they are relativelyexpensive/1*
Compression
Spring
Powder
Compact
Duct
Airway
Helical Blade
Reservoir
Mouthpiece
Figure 1.2. Rotary planerDPI'(25)
1.3.3 Nebulizers
There are two types of nebulizers used to create an inhalation aerosol. They consist of the
air-jet and ultrasonic types. Both nebulizer types require power sources to operate, they
require a relatively large amount of time todeliver the drugs, and are also
expensive/17*
Jet Nebulizers work on a stream of compressed air or oxygen that is forced through a
narrow tube that lies just above the surface of the liquid to be nebulized. The liquid is drawn
M. P. Medlar
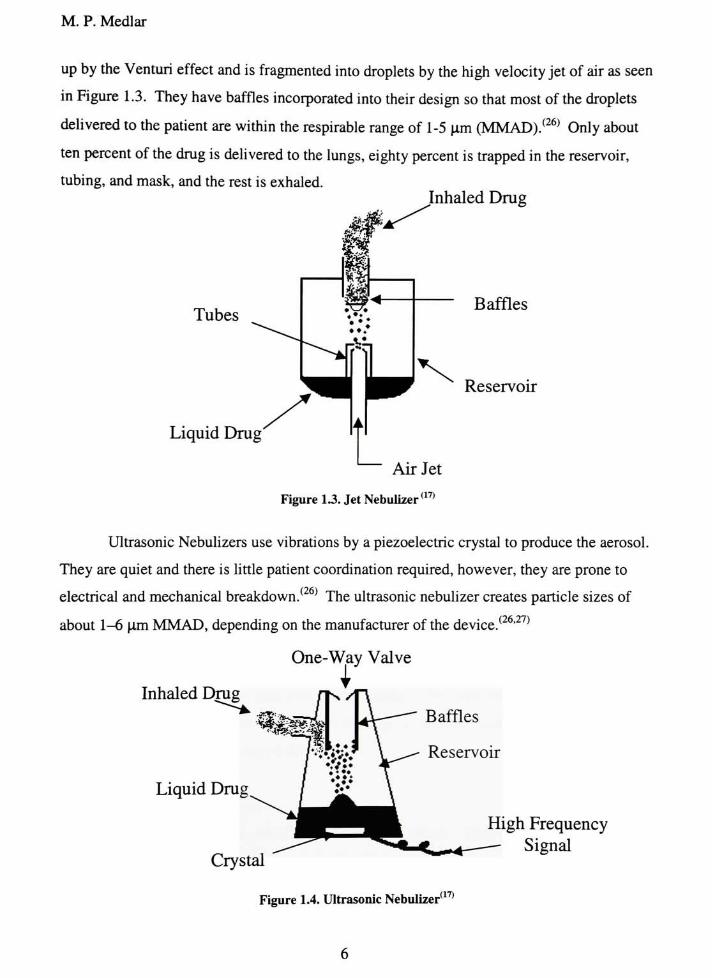
up by the Venturi effect and is fragmented into droplets by the high velocity jet of air as seen
in Figure 1.3. They have baffles incorporated into their design so that most of the droplets
delivered to the patient are within the respirable range of 1-5 um(MMAD)/26*
Only about
ten percent of the drug is delivered to the lungs, eighty percent is trapped in the reservoir,
tubing, andmask, and the rest is exhaled.
Inhaled Drug
Tubes
Liquid Drug
Baffles
Reservoir
Air Jet
Figure 13. Jet Nebulizer(17)
Ultrasonic Nebulizers use vibrations by a piezoelectric crystal to produce the aerosol.
They are quiet and there is little patient coordination required, however, they are prone to
electrical andmechanicalbreakdown/26*
The ultrasonic nebulizer creates particle sizes of
about 1-6 urnMMAD, depending on the manufacturer of thedevice/26'27*
Inhaled Drug
One-Way Valve
I
Liquid Drug
Crystal
Baffles
Reservoir
High FrequencySignal
Figure 1.4. UltrasonicNebulizer1,(17)

M. P. Medlar
Of the three inhalation devices described above, the pMDI is the most commonly
prescribed method of aerosoldelivery/14-28*
The pMDI is inexpensive, portable, and at least
as effective as other systems of aerosol generation for drug delivery, if properlyused/14,29)
Thus, with further improvements, it could become the most optimal and desirable means of
drug delivery to the lungs.
1.4 Research Gaps
Pressurized Metered-Dose Inhalers have been around since the 1950's. Since their inception,
numerous studies have been done to characterize their sprays using experimental techniques.
These experimental techniques can be summarized as inertial impaction methods
(impingers(30)and cascade impactors(31'32,33*), imagingmethods (microscopy(34), high-speed
photography *, and holography(36)), and optical techniques (aerodynamic particle
sizers*37"38,39*
and laser light diffraction*40'41'42,43*). These experimental investigations are
valuable, but they do not attempt to theoretically describe or model the pMDI spray. The
literature suggests that analytical spray prediction models for the pMDI are not very
abundant.Clark(44'45)
has done work to study the atomization processes in the pMDI. More
recently, Dunbar, Watkins, andMiller(46)
have developed a theoretical model for the resulting
spray from the pMDI. These investigations consider the flash evaporation of the propellant
in the actuator nozzle as the primary atomization process.
This study is concerned with the positive results that turbulence generation can have
on the spray resulting from the pMDI, thus, turbulence was considered as one of the factors
contributing to the aerosol production in this device. The investigators mentioned previously
did not consider turbulence in their pMDI spray model. They were not concerned with
inducing additional turbulence into the flow (through an add-on nozzle) to improve the spray
characteristics from the existing pMDI.
1.5 Scope of the Present Study
The aerosol production in the pMDI depends on many factors. They include volatilization
(flashing) of propellant, formulation properties, flow passage geometry, and the turbulence
characteristics at the nozzle exit. This study improves the pMDI by focusing on one of the

M. P. Medlar
above processes in the nozzle design, namely, the turbulence characteristics at the nozzle
exit. An add-on atomizing nozzle was designed to produce more favorable turbulence exit
conditions than exist in current inhaler flow passages and reduce the resulting median droplet
size. A computational fluid dynamic analysis was done to ensure that the atomizing nozzle
design enhanced the turbulence exit characteristics. The Huh AtomizationModel(5)
was used
to predict the spray distribution and illustrate a reduction in the median droplet size resulting
from the add-on nozzle.

M. P. Medlar
Chapter 2-Turbulence
2.1 Introduction
Turbulence can be defined as irregular fluid motion that results from the growth of
disturbances and instability in laminar flow. Atomization is a disturbance growth process
that converts a bulk liquid into a spray. So, it follows that development of the proper
turbulence characteristics within our nozzle is a key factor in promoting greater atomization.
In light of that fact, this chapter deals with turbulent internal flow, its characteristics,
turbulence generation methods, and turbulent flow modeling.
2.2What is Turbulence?
Turbulence is irregular fluid motion in which flow properties vary randomly in time at any
given location in the flow field. Turbulent flow can be considered to consist of a fluctuating
motion superimposed onto a mean one. Turbulence occurs via instabilities in laminar flow
due to perturbations or disturbances. Turbulence arises at high Reynolds numbers due to
greater tendency toward flowinstability/47*
Perturbations and disturbances can only lead to
turbulence if they are not damped out and allowed to grow. At higher Reynolds numbers
viscosity's damping effects diminish so disturbances grow and break down into chaotic,
sustained motion. Figure 2.1 shows the transition of the flow regime from laminar to
turbulent with increasing Reynolds number. As Reynolds number is increased, fluctuations
with the velocity in time grow as the flow enters a transitional state. Further increases in the
Reynolds number lead to random velocity fluctuations and the onset of fully turbulent flow.

M. P. Medlar
$ 2-
4000
2000
4, %*:
Figure 2.1. Transition from laminar to turbulentflow<48)
2.3 Characteristics of Turbulence
Every turbulent flow field is different. According to Richardson(48), the characteristics of
each turbulent flow field depend on the conditions of the local environment in which the
turbulence is generated. Most turbulent flows exhibit some general characteristics. First,
turbulent flow is random and irregular. It is time and space dependent with a very large
number of spacial degrees of freedom. A flow is not turbulent unless random velocity
fluctuations are present at any given point. Second, turbulent flow is also three-dimensional
and rotational. Turbulent flow contains intense, random vorticity fluctuations. Related to
this concept of vorticity is the presence of eddies. An eddy is a large group of fluid particles
that move laterally in the flow field while rotating, stretching, or breaking into more eddies.
Turbulence involves the flow of eddies. Third, turbulent flow is inherently diffusive. The
diffusivity of turbulence is what promotes mixing and increases momentum, heat, and mass
transfer. Fourth, turbulent flow is dissipative. The kinetic energy of the turbulent flow
dissipates into internal energy and eventually thermal energy due to the action of high
viscous shear stresses on the fluid. Lastly, turbulent flow is a continuum. No section of the
turbulent flow can be readily distinguished from its neighboring section.
The concepts of dissipation, diffusivity, and the flow of energy-containing eddies are
important mechanisms in the atomization process detailed in the Huh atomizationmodel(5)
presented in Chapter 3.
10

M. P. Medlar
2.4 Turbulence Generation Mechanisms
In internal fluid flow, there are three possible ways in which a turbulent flow condition can
be created. First, rapid fluid flow past a wall can lead to unstable self-amplifying velocity
fluctuations that form near the wall and spread to the remainder of the flow. Figure 2.2
illustrates how disturbances in the vicinity of the wall can upset the rest of the flow.
//////////
Wall
Figure 2.2. Rapid fluid flow past a wall
Second, velocity gradients between slow and fast moving fluid streams cause a shearing
action leading to the production of turbulent eddies, as shown in Figure 2.3.
Fast Fluid Stream
t ^P^^
'
**> -'i. -*T ^
Figure 2.3. Velocity gradients between fast and slow moving fluid streams
Third, fluid flow past a sharp angularity can lead to internal turbulent flow. This causes
separation of the flow and eddies to set-up in the wake region. This disturbs the flow and
induces fluctuations of the velocity components in time.
-5*
>
Figure 2.4. Fluid flow past a sharp angularity or corner
11

M. P. Medlar
The above situations induce disturbances and instability into the fluid flow. This can
ultimately generate turbulent fluid flow and aid in the atomization process. Due to this fact,
these generation mechanisms were used in the design of the add-on nozzles. Geometries
were created to separate the flow and create regions of vorticity and rotation. These regions
hold energy-containing turbulent eddies of various sizes that can ultimately be related to the
atomization process and resulting spray distribution.
2.5 TurbulenceModeling
Turbulent flows are relatively easy to describe. However, the analysis and modeling of the
turbulent flow situation is a bit more difficult. Any fluid flow is regulated by three governing
equations. These consist of the continuity equation (conservation ofmass), theNavier-
Stokes equations (Newton's second law), and the energy equation. The postulations involved
in the derivation of these equations make no mention about the exclusion of turbulent flows.
Therefore, they must be valid for the turbulent flow condition. One can attempt to solve
these equations, numerically, for instantaneous quantities from the given boundary
conditions. However, this isn't a practical alternative as far as memory and computing time
is concerned. A more practical approach to describing turbulent flow is to model averaged
turbulent transport quantities because the turbulent flow properties fluctuate and vary in
time/49*
The time averaged continuity and Navier-Stokes equations are as follows:
-r-5- = 0 (2.1)ox.
Dut _ dP dTij Wjn - = pg + - + - (2.2)PDt
**'3bc, dxj dXj
where, p is the fluid density, w is the mean velocity component, g is the gravitational
acceleration, P is the mean pressure term, tv= /j,
rdut duj77 \
dx, dx;
Ty=
-putUj (Reynolds
j
Stress), n is the fluid viscosity,w'
is the fluctuating component of velocity, and the
instantaneous velocity u = u+u\
12

M. P. Medlar
In the averaging of the governing equations, fluctuating properties enter the picture
(i.e. u '). We don't know theirmagnitudes so we must model these quantities with ones we
can determine. This problem is called turbulence closure. Additional equations for closure
are proposed on the premise that quantities such as turbulent kinetic energy, eddy size, and
turbulent stress are transported by turbulent motion. Thus, additional differential equations
are obtained from their equations ofmotion/50*
These equations, together with the time-
averaged governing equations, called Reynolds time-averaged equations, are solved
numerically. So, by the term turbulence model, one means a set of equations, when solved
with the mean flow equations, allows calculation of relevant correlations and, hence, helps in
simulating the behavior of realfluids/50*
There are certain general postulations involved in turbulence modeling. Chen and
Jaw(49)proposed the following: First, the Reynolds averagedNavier-Stokes equations can
properly describe the turbulent mean motion and turbulent transport properties.
Instantaneous fluid motions are averaged and detailed information about fluid motions is lost.
A model is required to recover the lost information. Second, diffusion of turbulent transport
properties is proportional to the gradient of transport properties. Third, small turbulent
eddies are isotropic (non-direction dependent). Fourth, turbulent transport quantities are
local functions ofReynolds stress, turbulent kinetic energy, rate of dissipation of turbulent
kinetic energy, mean flow variables, and thermodynamic variables. Fifth, modeled turbulent
phenomena must be consistent in symmetry, invariance, permutation, and physical
observations. Sixth, turbulent phenomena can be characterized by one turbulent scale (either
velocity (u), length (1), or time (t)) on the basis of turbulent kinetic energy (k) and its rate of
dissipation (e); u=k1/2, l=k3/2/e, t=k/e. And last, all turbulence model constants require
experimental calibration and determination. For a turbulence model to be complete, the
model constants should be unique and valid for any turbulent flow geometry and conditions.
At present, no such turbulence model is available. Therefore many variations on turbulence
models exist to account for many different situations.
The classification of turbulence models is quite simple. They are classified by the
number of differential equations used in addition to the Reynolds averaged governing
equations. They consist of zero-equation, one-equation, and two-equation models. Accuracy
13

M. P. Medlar
increases with additional equations but the computational time is also increased. For the
purposes of this investigation the standard k-e model was chosen.
2.5.1 Standard k-e TurbulenceModel
This model falls under the category of two equation models. It uses two additional
differential equations for the transport of turbulent kinetic energy, k, and its dissipation rate,
e. The transport of turbulent kinetic energy is defined as
Dt dx,{*
dxl+Vdxl\ "'"'d*,- (23)
where, k =[uu +vv +ww J, u ,v
, and w are the fluctuating velocity components,
e = v-^-^-, v,=C , and
Ck= 0.09 to 0.11.
dxj dxtM
The transport of the turbulent kinetic energy dissipation rate is given as
D=
d
Dt dx,
'( k2 ^
Ce + vd
dxt
t3;
-C^-u^^-C^k ox, k
(2.4)
where, Ce=0.07, Cei=1.45, and Ce2=1.92.
This model has proven to be relatively accurate for the solution of certain general
turbulent flows. It's superior to one-equation models and doesn't require a lot of
computational time. It does however have certain limitations. It is only valid for fully
turbulent flows and assumes the same eddy viscosity for all the Reynolds stresses. Also, the
model is not valid in the region of the wall boundary layerwhere molecular and turbulence
effects are of comparablemagnitude/51*
Due to this fact, the model uses a wall function
representation of the boundary layer behavior. There are certain assumptions based on this
wall function representation^1*. First, variations in velocity and other properties are
14

M. P. Medlar
predominantly normal to the wall, leading to one-dimensional behavior. Second, effects of
pressure gradients and body forces are negligibly small, leading to uniform shear stress in the
layer. Third, shear stress and velocity vectors are aligned and unidirectional throughout the
layer. Fourth, a balance exists between turbulent energy production and its dissipation. And
last, there is a linear variation of the turbulence length scale.
The standard k-e model was chosen for this investigation in order to remain
consistent with the theory behind the Huh Atomization Model(5). The equations in this model
were numerically solved with the mean flow equations for given nozzle geometries using a
commercially available CFD software package (Fluent). The turbulent quantities output
from Equations 2.3 and 2.4, namely k and e, were input to the Huh AtomizationModel(5)
to
relate the turbulent flow variables at the nozzle exit to a resulting secondary drop size
distribution.
15

M. P. Medlar
Chapter 3-Atomization Process
3.1 Introduction
Atomization is the process by which a volume of liquid is converted into smaller particles or
droplets. It occurs when internal and external applied forces tend to disrupt the consolidating
effects of surface tension. Breakup of the liquid transpires when these applied disruptive
forces overcome the action of surface tension. In essence atomization is a growth
disturbance process. External forces applied to an emerging stream of liquid (either a jet or
sheet) tend to produce disturbances on the surface of the stream. Ultimately, it is the growth
of such wavelike disturbances that leads to disintegration of the stream into droplets and then
to a spray.
In a pMDI, a number of factors influence the atomization of the formulation. They
include volatilization (flashing) of propellant, formulation properties, flow passage geometry,
and the turbulence characteristics at the nozzle exit. No single atomization model has been
developed to account for all of these factors. Models have been developed to account for the
flashing of the propellant as the primary atomizationmechanism/45'46*
This study was
concerned with the effects of turbulence so, the Huh AtomizationModel(5)
was used to
predict the droplet size distribution resulting from certain nozzle exit conditions. This model
considers both turbulence and wave growth as important processes in atomization. The
general atomization process, certain atomizers, and atomization models are considered in this
chapter.
3.2 General Atomization Process
The atomization process is affected by many different factors. Issues ranging from atomizer
geometry to the ambient conditions into which the flow is injected eventually determine the
resulting spray characteristics.
Atomizer geometry and size greatly impact atomization. The final drop diameter
achieved for a certain atomizer is almost always related to the square root of a certain critical
dimension associated with the atomizer. This critical diameter or dimension could be the
diameter of the discharge orifice, as in a plain orifice pressure atomizer, or the thickness of
16

M. P. Medlar
the emerging liquid sheet, as in a pressure swirl atomizer. Also, the atomizer internal
geometry has a large influence on the turbulent flow conditions at the nozzle exit.
Liquid Properties such as surface tension and viscosity also affect the spray
production process. Surface tension tends to pull the liquid together to resist the action of
disruptive forces. Viscosity tends to affect nozzle flow rate and spray pattern. It acts as a
stabilizing force that opposes changes in geometry. Highly viscous fluids tend to hinder the
onset of turbulent flow and the development of natural instabilities associated with this
turbulence.
The velocity of the emerging fluid has a profound influence on the spray
characteristics. Ultimately turbulence is a desired factor and leads to better atomization.
Turbulent velocity profiles produce higher shear stress at the walls of the atomizer along with
larger components of radial velocity. Both of these serve to disrupt surface tension and lead
to a finer spray. As we will see later, the development of the proper turbulent conditions is
crucial to producing a finer spray.
The ambient conditions into which a spray is injected can greatly affect the
atomization process. The pressure, density, and temperature of the external gas all can lead
to changes in aerodynamic and other external forces on the droplets. This can lead to
alterations in median drop size along with other spray characteristics.
3.2.1 Mechanisms ofAtomization
Atomization involves the conversion of a bulk liquid into a distribution of small drops. Most
often, a stream of liquid emerges from an atomizer in the form of a liquid jet or sheet. In the
case of a pMDI, the emerging flow is in the form of a jet. This section is devoted to the
various mechanisms used to account for the manner in which these jets are disintegrated into
droplets as described by Lefebvre(52).
Disintegration of Liquid Jets
As a jet emerges from a nozzle as a continuous body, the interactions between cohesive and
disruptive forces give rise to oscillations and disturbances on the jet surface. The oscillations
and disturbances lead to the breakup of the jet. As the Reynolds number increases we see an
increase in disturbances due to an increase in the aerodynamic forces or dynamic pressure
from the ambient air. This leads to a classification of different modes of disintegration based
17

M. P. Medlar
on the Ohnesorge number vs. the Reynolds number. The Ohnesorge number is a
dimensionless group obtained by dividing the square root of the Weber number by the
Reynolds number and it is a measure of jet stability. Ohnesorge(53)proposed an early
classification of the different modes. A more recent study byReitz(54)
attempted to solve
some of the uncertainties surrounding the Ohnesorge chart. Reitz came up with four regimes
of breakup encountered as the liquid jet velocity increases, as shown in Figure 3.1.
10'
10"
yj10"'
-l
*.
H
nr*
10*
ATOMIZATION
RALEIGH
MECHANISM
iDs
Figure 3.1. Jet breakupmodes(52)
The first is the Rayleigh jet breakup regime. It is caused by the growth of axisymmetric
oscillations of the jet surface induced by surface tension. The drop diameters exceed the jet
diameter in this region. Second is the First Wind Induced Breakup region. In this region, the
surface tension is now augmented by the relative velocity between the jet and ambient gas.
Dynamic pressure is now a factor and the final drop diameter is similar to the jet diameter.
Third is Second Wind Induced Breakup. In this region, drops are produced by the unstable
growth of surface waves on the jet surface caused by the dynamic pressure of the ambient air.
The growth is once again opposed by surface tension and the drop size is much less than the
initial jet diameter. The last regime of breakup is atomization. In this region, the jet disrupts
completely at the nozzle exit. The drop diameters are much, much less than the jet diameter
and the predominantmechanism of breakup is unknown.
18

M. P. Medlar
Influence ofJet Velocity Profile on Breakup
For a given nozzle, the state of flow in the nozzle is defined by the flow upstream of the
orifice and by disturbances produced in the approach passages. The nature of the flow is
characterized by the Reynolds number and has a profound effect on the breakup of the jet.
Laminar Flow is a very layered flow in which the liquid particles flow in streams
parallel to the axis of the tube. The velocity profile of the jet, immediately downstream of
the orifice, varies in a parabolic manner. Further downstream, momentum transfer occurs
between the layers of the flow and a process of velocity profile relaxation occurs. This leads
to a flatter profile with the same mean velocity as the original. Air friction and surface
tension forces combine to create irregularities and lead to disintegration.
Semi-turbulent Flow is characterized by an annulus of laminar flow surrounding a
turbulent core. Initially particles of the core are prevented from reaching the surface of the
jet. Further downstream, the profile relaxes. This brings liquid particles with radial
components of velocity to the surface. These liquid particles lead to disturbances and
disintegration of the jet.
Turbulent and high velocity flow is characterized by high momentum, random flow
with large radial components of velocity. These large components, along with higher shear
stress and aerodynamic forces, produce disturbances that lead to breakup. The exact
turbulent flow condition is described by k and e and these turbulent quantities dictate the
spray characteristics described by the Huh Atomization Model .
Stability Curve
The stability curve, shown in Figure 3.2, illustrates the relationship between the jet velocity
profile and the length of the continuous portion of the jet. This is known as the breakup
length and it is measured from the nozzle to the point of drop formation.
19

M. P. Medlar
rOfilWIUG FLO*
-L,
AM INA R FLOW REGION
TRANSITION REGION
/-TURBULENT FLDi RE5IQN
FULLV-OEVELOPEO"
SPRAY REQCW
JET VELOtITt
Figure 3.2. Jet stabilitycurve(S2)
As the jet velocity is increased the flow regime changes from dripping to laminar to
turbulent flow. The jet breakup length increases as the flow changes from dripping to
laminar. As the jet transitions from laminar to turbulent the breakup length tends to decrease.
The breakup length again increases as the jet velocity increases in the turbulent flow region.
Further increases in the jet velocity lead to a maximum breakup length after which the spray
becomes fully developed.
Breakup ofDrops
The breakup of a single liquid drop in air is the result of its aerodynamic interaction with the
air. In general the deformation of a drop is determined by the ratio of aerodynamic forces to
surface tension forces. This ratio is known as theWeber number. Larger deforming forces
correspond to a higherWeber number and lead to greater breakup. This breakup can occur in
stagnant air as well as in flowing air.
Breakup in stagnant air
This breakup occurs as a result of interaction between a falling drop and the surrounding air.
Two things can occur under the action of aerodynamic forces. First, equilibrium between
20

M. P. Medlar
aerodynamic and internal forces can be reached. The criticalWeber number characterizes
this point when drag is equal to surface tension. This is a stable condition and the drop will
remain stable as long as a change in air pressure on the surface can be compensated by a
corresponding change in the pressure due to surface tension. If the combination of surface
tension and aerodynamic forces remains constant stability will be maintained. Second,
aerodynamic forces deform the drop until breakup occurs. Breakup will occur if a change in
pressure due to aerodynamic forces is not compensated by the change in the surface tension
forces. Drops will breakup until they reach a critical stable size.
Breakup inflowing air
This breakup occurs as a result of the interaction between a droplet and a flowing air stream.
This breakup can occur in three ways. First, the drop if flattened by aerodynamic forces into
an ablate ellipsoid. This is called lenticular deformation and it is produced by parallel and
rotation flows. Second, the drop is elongated to form a ligament. This is known as cigar
deformation and it is produced by plane hyperbolic and Couette flows. And last, local
deformations on drop surface create bulges and protuberances, which form smaller drops.
This deformation is due to irregular flow patterns.
33 Atomizers
Sprays may be produced in a variety ofways. Depending on the applications, different types
of atomizers may be better suited to produce the desired spray characteristics. Atomizers are
characterized by the method in which they produce a spray, and the various types are
summarized according toLefebvre(52)
as follows.
3.3.1 Pressure Atomizers
As their name suggests, pressure atomizers rely on the conversion of pressure into kinetic
energy to achieve a relatively high velocity flow. It is this high relative velocity between the
liquid and the surrounding gas that leads to atomization.
In a Plain Orifice Pressure Atomizer, liquid is passed through a small circular orifice
to produce atomization. A pMDI is essentially a plain orifice pressure atomizer. Thehigh-
pressure propellant provides the energy to disintegrate the flow through the plain circular
orifice. Atomization is promoted by an increase in flow velocity, which leads to turbulence
21

M. P. Medlar
and increased aerodynamic drag. In essence, the flow in the Plain Orifice Pressure Atomizer
is similar to the flow in a pipe, thus it is characterized by the Reynolds number. The flow
number is the ratio of the nozzle throughput to the square root of the injection pressure
differential. The spray is more rapidly dispersed at high Reynolds number due to transition
from laminar to turbulent flow. The proper turbulent flow condition leads to greater
atomization. The discharge coefficient is often used to characterize flow on exit from the
atomizer. It is defined as the ratio of the actual flow rate to the theoretical value. The
discharge coefficient is influenced by many factors including Reynolds Number, length to
diameter ratio of the orifice, injection pressure, ambient pressure, inlet chamfer, and
cavitation.
In the Simplex or Pressure Swirl Atomizer, a swirling motion is imparted to the liquid
so that, under the action of centrifugal force, it spreads out in the form of a conical sheet as
soon as it leaves the orifice. There are two types of simplex nozzles consisting of the solid
cone and the hollow cone. The solid cone forms a spray comprised of drops distributed
uniformly throughout its volume. The hollow cone issues drops concentrated at the outer
edge of the spray pattern. Development of the spray in the simplex atomizer passes through
several stages as liquid injection pressure is increased from zero. The simplex is able to
achieve wider cone angles than the plain orifice and can produce good atomization over wide
ranges with the use ofwide range nozzles.
ADuplex Pressure Atomizer is similar to the simplex, but its swirl chamber employs
two sets of tangential ports. The primary port is utilized for low flows where the main or
secondary passage is used for larger flows.
The Dual Orifice Pressure Atomizer essentially comprises two simplex nozzles that
are fitted concentrically on the atomizer. The primary nozzle is located on the inside with the
secondary on the outside. The primary and secondary nozzles aresituated such that the
individual sprays don't interfere with each other.
The Spill Return Pressure Atomizer is basically a modified simplex atomizer. The
rear wall of the swirl chamber contains a passage through which liquid can be"spilled"
away
from the atomizer. The atomizer uses a relatively high constant pressure to ensure adequate
swirl and efficient atomization at low flow rates.
22

M. P. Medlar
3.3.2 Rotary Atomizers
In this type of atomizer, liquid is fed onto a rotating surface where it spreads out fairly
uniformly under the action of centrifugal forces. The rotating surface may take the form of a
flat disk, vaned disk, cup, or slotted wheel. There are several mechanisms involved in this
type of atomization. Ligament formation at the rim leads to formation of discrete drops. An
increase in flow rate leads to the formation of a sheet at the rim that disintegrates into drops.
Atomization quality is improved with an increase in RPM, a decrease in liquid flow rate or
viscosity, and serration of the outer edge.
3.3.3 Air-Assist Atomizers
As their name also suggests, Air-Assist Atomizers use flowing air to aid in the disintegration
of a liquid jet or sheet. These atomizers are comparable to jet nebulizers. Some of these
atomizers use air to supplement the atomization process at low flow rates, while others
require air to achieve the atomization process at any flow rate.
Air-Assist Atomizers are comprised of Internal and ExternalMixing, the Parker-
Hamifin and Lezzon Nozzles, and the Y-Jet types. The Internal Mixing Air-Assist Atomizer
is suitable for highly viscous liquids and uses airflow to assist atomization at low flow rates.
The spray cone angle is minimum formaximum airflow and widens as the airflow rate
decreases. The External Mixing atomizer also uses air to supplement atomization at low
flow rates and a constant spray cone angle is achievable at all flow rates. The Parker-
Hamifin Nozzle uses inner and outer airstreams to achieve a shearing action on an annular
liquid sheet at the nozzle tip. Airflow is necessary for atomization in this atomizer. In the
Lezzon Nozzle, inner and outer airflows are used to achieve a shearing action. The
difference between this and the Parker-Hamifin Nozzle is the fact that air and liquid interact
before issuing from the nozzle. The Y-Jet atomizer utilizes a number of jets arranged in an
annular fashion to provide a hollow conical spray.
3.3.4 Airblast Atomizers
In principle, these atomizers are the same as the Air-Assist class. However, a main
difference lies in the quantity and velocity of air supplied.Air-Assist Atomizers use small
23

M. P. Medlar
quantities of high velocity air while Airblast Atomizers use much larger amounts of air for
atomization.
The three categories ofAirblast Atomizers include the Prefilming, Piloted, and Plain-
jet types. The Prefilming-AirblastAtomizer achieves atomization by subjecting a thin liquid
sheet to high velocity air. The Piloted or Hybrid Airblast Atomizer combines the Prefilming
type with the action of a simplex nozzle. This was designed to overcome poor atomization at
low air velocities. The Plain Jet Airblast Atomizer utilizes liquid injected into the air stream
in one or more discrete jets to produce an atomized spray.
3.3.5 Other Atomizers
Three other atomizer types exist. They consist of Effervescent, Electrostatic, and Ultrasonic
Atomizers.
In Effervescent Atomizers, the air or gas used in atomization is introduced directly
into the bulk liquid at a point upstream of the nozzle. This produces good atomization at low
injection pressures and flow rates. Electrostatic Atomizers use the mutual repulsion of like
charges that have accumulated on the surface of the liquid. These charges produce an
electrical pressure, which acts to disrupt surface tension. In the Ultrasonic Atomizer
(Nebulizer), the liquid is introduced onto a rapidly vibrating surface leading to wave patterns
formed on the liquid. Atomization occurs when the amplitude of the waves become high
enough to become unstable and collapse. This leads to formation of a mist of small drops to
be ejected from the surface. Low flow rates are required for atomization and droplet sizes
are sufficiently small for inhalation.
3.4 Atomization Models
Atomization models are developed according to the type of atomizer used to produce the
spray. The models contain empirical equations that express the relationship between the
mean drop size in a spray and the variables of liquid properties, gas properties, flow
conditions, and atomizerdimensions/52*
This study is concerned with the spray issued from the pMDI. A pMDI is essentially
a plain orifice pressure atomizer. Within the scope of the atomization process in this device
lies the influence of the turbulent flow condition. Changes in the turbulent flow condition
24

M. P. Medlar
due to alterations in nozzle geometry can greatly affect the spray distribution. The Huh
AtomizationModel(5)
was chosen to predict the spray distribution resulting from certain
nozzle geometries because it links turbulent flow characteristics at the nozzle exit to the
exterior atomization process.
3.4.1 Huh Atomization Model(5)
The Huh Atomization Model(5)considers the two independent mechanisms of turbulence and
wave growth in an attempt to provide a logical framework for coupling the flow inside the
nozzle to the exterior spray productionprocess/5*
The turbulent fluctuating motions
developed within the nozzle provide initial perturbations on the ensuing jet surface. These
perturbations undergo a wave growth process due to interaction with the surrounding air and
cause the jet to breakup into a spray.
In this model, the spray computation is divided into two groups, primary and
secondary parcels. The primary parcel is the one injected from the nozzle, whereas the
secondary parcel is generated from the primaryone/5*
Primary droplets ultimately breakup
entirely into secondary ones. Thus, the probability density function (PDF) for the diameter
of the secondary droplet (p(x)) will be able to adequately represent the characteristics of the
spray at a chosen time. p(x) is proportional to the turbulence energy spectrum and inversely
proportional to the atomization time scale given by Huh etal(5)
as
p(x)=C-^- (3.1)
rA(x)
where <p(x) is the turbulence energy spectrum, rA (x) is the atomization time scale, and C is a
constant.
The constant C is determined by the normalization condition given by
jp(x)dx = 1.0 (3.2)
25

M. P. Medlar
The turbulence energy spectrum is given as
*(*) = C
(a/A)2
[i+(wr(3.3)
where, the wave number X, is the inverse of the drop diameter, x. The wave number
associated with the maximum energy in the turbulent energy spectrum, Xe is obtained from
i -J_
'~L.(3.4)
where Le is the size of the eddies with the maximum energy in the turbulence energy
spectrum given as
Le = (3S)e
0.75
L is the turbulence length scale and is expressed as
Lt(t) = Lt 1 +0.082&
-10.457
(3.6)
where t is the time since injection from the nozzle andL
andt
are the initial turbulence
length and time scales, respectively, defined as
Lt=CM^.(3.7)
avg
26

M. P. Medlar
T=CU^-(3.8)
avg
where kavg and eaVg are the average turbulent kinetic energy and energy dissipation rate,
respectively. They are calculated at the nozzle exit from the standard k-e model for turbulent
fluid flow. Cu is a constant given in this model for turbulence and is equal to 0.09.
Combining equations 3.4, 3.5, 3.6, 3.7, and 3.8 yields the following equation for Xe.
A = (3.9)
Substituting Equation 3.9 into Equation 3.3 and noting that X=l/x, theturbulence energy
spectrum becomes
0(x) = USCC2Mk2avf65Jvlx
(3.10)
(0.0828
A
kavg + n
Eavgt
0.914
2x2 +USClk2xm
avg'
'M avg
( 0.0828A
kavg + n
Eavgt
0.914-11/6
Referring back to Equation 3.1, xA wasdefined as the atomization time scale. It is expressed
as a linear sum of the turbulence and wave growth time scales asfollows:
ta=\.2t,+Q.5tw (3.11)
Tt is the turbulence time scale expressed as
27

M. P. Medlar
t,= r,+ 0.0828* (3.12)
where t is time. tw is the wave growth time scale given as
r =
1
pfK
(3.13)
where pg is the gas density, Pf is the density of the fluid to be atomized, U is the mean
injection velocity from the nozzle, and Lw is the wave growth length scale.
Lw is equal to twice the atomization length scale, La. It is assumed that the length scale of
turbulence is the dominant length scale of atomization so that La = 2Lt. Thus,
Lw = 4L, (3.14)
Combining Equations 3.6, 3.7, 3.8, and 3.14, Lw becomes
1.3/2
M0 = 4C-=s-
avg
-10.457
1 +0.0828r
avg
(3.15)
Uniting Equations 3.8, 3.11, 3.12, 3.13, and 3.15, the atomization time scalebecomes
r. = 1.2C -SS- + 0.09936? +M
avg
C?nsp?k%u(cMkmt+0.O82SteY
P*U*e
2285
(3.16)
gw
~avg
28

M. P. Medlar
Using Equations 3.1, 3.2, 3.10, and 3.16 the probability density function for the secondary
drop size distribution can be determined. The variables required to determine the PDF are
kavg, eavg, U, pg, Pf, and t. kaVg and eavg are determined through the application of the standard
k-e turbulence model to the given nozzle geometry using a commercially available CFD
package. U was determined through the application of the conservation of mass using the
flow rate for the standard inhaler. pg and pf are properties of given fluids; in this case air and
water were used. The time, t, was calculated from U and a given distance from the nozzle
exit. The distance chosen was approximately three inches from the nozzle exit. This length
was picked to simulate the time when the aerosol would reach the back of the throat (in
actuality, any time could have been chosen to compare the secondary droplet distributions
from the corresponding nozzles as long as it remained consistent throughout the analysis).
This model was developed on the basis that atomization is a combined process of
turbulent fluctuating motions producing initial perturbations and subsequent breakup by
wave growth. These concepts concur with the reasoning this study was based on and thus
this model was chosen to predict droplet size distributions from turbulence conditions on exit
from the resulting nozzle. These results are described later in this report in Chapter 4.
3.4.2 Huh AtomizationModel(5)
Analysis
The goal of this study was to improve the spray characteristic of the pMDI through the use of
an add-on turbulence generating nozzle. An analysis of the Huh AtomizationModel(5)
was
needed to determine the range of exit turbulence parameters that lead to a reduction in the
median secondary drop size.
The PDF for the secondary drop size distribution is directly related to the turbulence
energy spectrum and inversely related to the atomization time scale, as seen from Equation
3.1. In actuality, the atomization time scale is constant for a given k, e, U, and time so the
PDF is directly dependent on the turbulence energy spectrum. One of the characteristics of
turbulent flow is the presence of eddies, or rotational fluid chunks that are transported with
the flow. These eddies come in various sizes from small to large. The turbulence energy
spectrum is a measure of the distribution of turbulent energy within the eddy system of the
flow field. It describes how much energy is associatedwith eddies of varying sizes and holds
the key to the prediction of the PDF. If we refer back to Equation 3.3, we see that the
29

M. P. Medlar
turbulence energy spectrum (<|>(x)) is dependent on X and A,e. Ifwe impose the definitions of
A and Xe, ty(x) becomes,
<Kx) = C{Ljxf
llHkMT(3.17)
Equation 3.17 was derived to show that a decrease in Le would shift both (j)(x) and p(x)
toward the left thus decreasing the median droplet size. This is illustrated in Figure 3.3.
0.25
O- 0.15
0.05
0.0002 0.0004 0.0006 0.0008 0.001 0.0012
x, drop diameter, m
0.0014 0.0016 0.0018 0.002
16=0.000010
- - 1(3=0.000041
-16=0.000144
- - -
le=0.000216
Ie=0.000430
Figure 3.3. Turbulence energy spectrum vs. drop diameter for decreasing Le
Le is the average length of the energy containing eddies and is directly related to the
turbulence length scale (Lt) through Equation 3.5. So, a reduction in the turbulence length
scale ultimately reduces the median droplet size. From equations 3.6, 3.7, and 3.8 we can see
that Lt is related to kavg and eaVg as,
3/2
M0 = c-=-
avg
x |0.0828fgflVg
CMkavg
0.457
(3.18)
30

M. P. Medlar
Figure 3.4 shows a plot of the turbulence length scale as a function of eavg for different kavg
values. Cu and t are kept constant at 0.09 and 0.0045s respectively.
1.40E-03
1.20E-03
1.00E-03
J"
8.00E-04
6.00E-04
4.00E-04
2.00E-04
0.O0E+O0
k=10
k=20
-
-k=30
k=40
k=50
O.OOE+00 2.00E+05 4.00E+05 6.00E+05 8.00E+05 1.O0E+O6 1.20E+06 1.40E+06 1.60E+06 1.80E+06
Eavg
Figure 3.4. Turbulence length scale vs. average turbulent kinetic energy dissipation rate with average
turbulent kinetic energy as a parameter
From Figure 3.4, we can see that a lower kavg value with a higher eavg value leads to a lower
turbulence length scale. A reduced value forL leads to a smaller Le and a shift in the
turbulence energy spectrum toward the origin, thus producing a lowermedian droplet size.
Figure 3.5 demonstrates that the median droplet size decreases as the kaVg/eavg ratio
decreases for decreasing values of kavg. This reinforces the conclusions drawn from Figure
3.4.
31

M. P. Medlar
2000
1800 -
1600
1400
g 1200
2.
1000
kavg=10
- kavg=20
-kavg=30
kavg=40
kavg=50
0.O0E+O0 5.00E-05 1.00E-04 1.50E-04 2.00E-O4 2.50E-04 3.00E-04 3.50E-04 4.00E-04
Kavg'Eavg
Figure 3.5. Median droplet size vs. ka, /eaTg ratio with kavg as a parameter
In conclusion, the above analysis shows that producing a low kavg/eavg ratio at a
relatively low value of kaVg can reduce the median droplet size. In practical terms, increasing
e^g for a constant value of k^g produces a shift in the energy containing eddies from larger to
smaller sizes. Smaller eddies are more efficient in dissipating energy than largerones(50)
so
the turbulent kinetic energy is concentrated in eddies of smaller sizes, which ultimately
produces a reduced median secondary droplet size.
32

M. P. Medlar
Chapter 4-Modeling
4.1 Introduction
To improve upon the turbulence characteristics of the existing inhaler, the current flow
passage was modeled and a baseline set for the median droplet size based on turbulence. The
examination into the Huh Atomization Model(5), completed in section 3.4.2, confirmed that a
low kavg/eavg ratio at a relatively low value of kavg at the nozzle exit could reduce the median
droplet size. Following this examination, new nozzles were designed in an effort to develop
these proper turbulence conditions. The nozzle with the most potential was chosen and
subsequently optimized to produce the lowest median secondary droplet size obtainable and
thus the biggest improvement over the baseline value.
4.2 BaselineModel of Inhaler Internal Flow Passage
Dimensions of the inhaler actuator device were determined and used to create a three
dimensional geometric model and mesh of the internal flow passage using Gambit, Fluent,
Inc. The geometry dictated that the tetrahedral/hybrid mesh be used. The mesh was
generated using an interval count method. This method divides all of the geometric entities
of the model into the same number of intervals or elements in order to discretize the solution
domain. The grid quality, namely the equiangle skew, was checked using the mesh check
tool in Gambit, Fluent, Inc. This mesh was imported into Computational Fluid Dynamics
Software (Fluent, Fluent, Inc.) where the turbulence model, boundary conditions, and fluid
properties were assigned. As mentioned previously, the standard k-e model was used for the
turbulence model. A volumetric flow rate of 5.0e-06 m3/s was used for all of the nozzles.
This was calculated from a 100 uL output volume and 20 ms aerosol production time for the
pMDl/14*
Using an inlet area of 2.138e-06 m2, this led to a velocity inlet boundary condition
of 2.338 m/s, based on mass conservation. The turbulent boundary conditions at the inlet
were estimated using the turbulent intensity and length scale. The turbulent intensity, I is
estimated using Reynolds number, Re as,
33

M. P. Medlar
/ = 0.16/?e^ (4.1)
where Re is,
Re=^L^-(4.2)
M
in which pf is the fluid density, U is the mean velocity at the inlet, D is the inlet diameter, and
H is the fluid viscosity. Using pf = 1000 kg/m3, U = 2.338 m/s, D = 0.00165 m, and
\i = 0.001 Pa-s the Reynolds number at the inlet is 3857. This leads to an inlet turbulent
intensity of 5.7%. The turbulent length scale, / is estimated as
I = 0.07D (43)
resulting in a turbulent length scale of 1.155e-04 m.
This investigation was concerned mainly with the comparison of the turbulent
characteristics of the existing flow passage with that of new nozzles; so, water was chosen as
the fluid to simulate the flow of the drug. It is assumed that the resulting relative
improvement will not be changed for different fluid properties. A zero normal-gradient
boundary condition was used at the nozzle exit for all of the flow properties except pressure.
This condition is used when outlet conditions aren't known and want to be determined.
Figure 4.1 illustrates the boundary conditions used in the inhaler baseline model.
Inlet B.C.'s
V=2.34 m/s (normal to boundary)
1=5.7 % (turbulent intensity)
l=1.155e-04 m (turbulent length scale)
Fluid Properties
pf=1000kg/m3
u = 0.001 Pa-s
Outlet B.C.'s
Outflow condition-assumes zero normal
gradient for all flow properties except
pressure (used when oudet conditions
aren't known and want to be determined)
Figure 4.1. Schematic of baseline inhaler model boundary conditions
34

M. P. Medlar
4.2.1 BaselineModel Results
The main results of this analysis include the turbulent kinetic energy (k), the turbulent kinetic
energy dissipation rate (e), and the velocity (u). The results of the computational flow
analysis of the baseline model are shown as contour plots in Figures 4.2, 4.3, and 4.4.
Figure 4.2 shows the contours of k throughout the inhaler. The main point of interest
is on exit from the nozzle.
1.14e+01
1.03e+O1
9.13e+O0
7.99e+00
6.8Se+00
5.71 e+OO
4.57e+O0
3.43e+00
2.29e+O0
1.15e+O0Y
z X5.83e-03
Figure 4.2. Inhaler internal flow passage-contours of turbulent kinetic energy, ka,g=5.8mVs2
An average value of k at the nozzle exit was needed to input into the Huh Atomization
Model(5)to predict a median secondary droplet size. A vertex average was used to calculate
this quantity. This type of average uses the values of k at the nodes on the exit face to
determine the average. The results of this computation are ^^=5.8 m2/s2.
The contours of e are shown if Figure 4.3. Again, the area of concern for this
investigation is at the outflow location.
35

M. P. Medlar
I7.1Se+05
6.44e+05
S.72e+05
S.01e+05
I4.29e+05
3.58e+0S
2.86e+05
2.15e+05
1 .43e+0S
7.15e+04
4.18e+00
Figure 4.3. Inhaler internal flow passage-contours of turbulent kinetic energy dissipation
rate, eavg=7.0e+04mVs3
An average value of e at the nozzle exit was also needed to input into the Huh Atomization
Model(5)to predict a median secondary droplet size. The results of this computation are
eavg=7.0e+04 m2/s3.
The velocity contours were plotted in Figure 4.4. As a check to see that the results
were close to what was expected, the mean velocity at the exit was calculated and compared
to the computational result. The mean velocity with a nozzle exit diameter of 0.0006 m is
expected to be around 17.7 m/s based on mass conservation. The computational result is
approximately 17.8 m/s. This result agrees with the previous calculation.
36

M. P. Medlar
I1 .94e+01
1 7Se+01
1.S5e+01
1 .36e+01
1.16e+01
9.71 e+OO
7.76e+O0
5 .8 2e+OO
3.88e+O0
1.94e+00
0.00e+O0,u
Figure 4.4. Inhaler internal flow passage-2D section of 3D velocity contours
The turbulence exit conditions of the nozzle were used to find the probability density
function (PDF) andmedian secondary droplet size. The PDF for the secondary drop sizes
was predicted from the Huh AtomizationModel(5)
for kavg=5.8m2/s2
and eaVg=7.0e+04m2/s3
and is shown in Figure 4.5.
i 1500
800 1000 1200
x, droplet diameter, nm
Figure 4.5. PDF for the baseline inhaler internal flow passage
37
M. P. Medlar
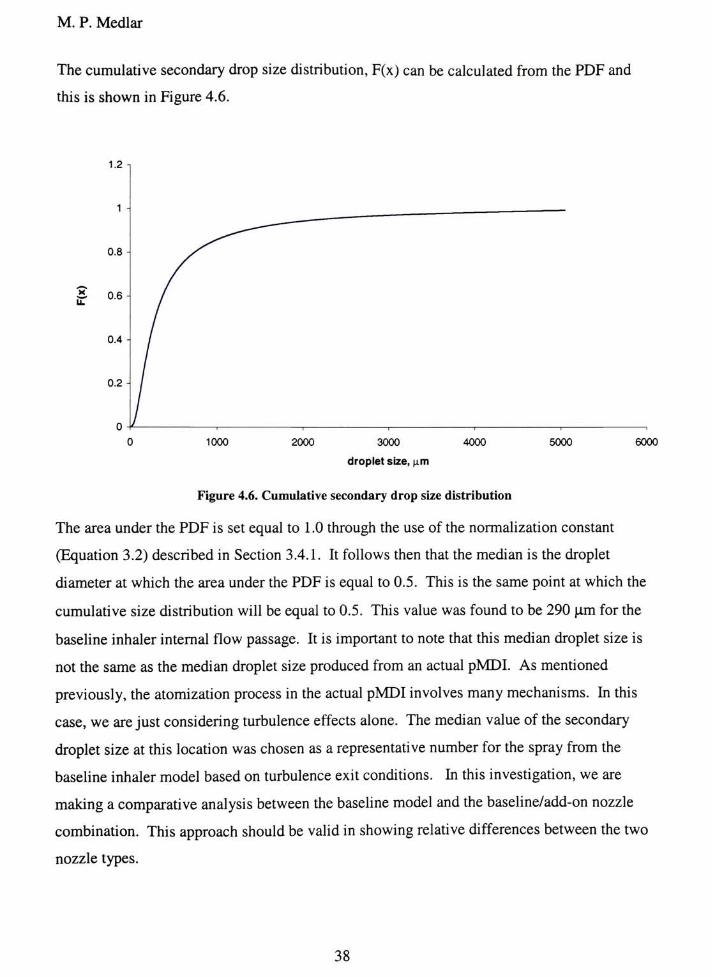
The cumulative secondary drop size distribution, F(x) can be calculated from the PDF and
this is shown in Figure 4.6.
1-2 i
C- 0.6
1000 2000 3000
droplet size, |im
4000 5000 6000
Figure 4.6. Cumulative secondary drop size distribution
The area under the PDF is set equal to 1.0 through the use of the normalization constant
(Equation 3.2) described in Section 3.4.1. It follows then that the median is the droplet
diameter at which the area under the PDF is equal to 0.5. This is the same point at which the
cumulative size distribution will be equal to 0.5. This value was found to be 290 pm for the
baseline inhaler internal flow passage. It is important to note that this median droplet size is
not the same as the median droplet size produced from an actual pMDI. As mentioned
previously, the atomization process in the actual pMDI involves many mechanisms. In this
case, we are just considering turbulence effects alone. The median value of the secondary
droplet size at this location was chosen as a representative number for the spray from the
baseline inhalermodel based on turbulence exit conditions. In this investigation, we are
making a comparative analysis between the baselinemodel and the baseline/add-on nozzle
combination. This approach should be valid in showing relative differences between the two
nozzle types.
38

M. P. Medlar
4.3 Design ofAdd-on Nozzles
The add-on nozzles were designed with turbulence, simplicity, and the manufacturing
process in mind. The manufacturing process, discussed in Appendix A, imposed certain
restrictions on the nozzle dimensions including the nozzle thickness and the etch angles
possible. The goal was to reduce the median secondary droplet size while maintaining an
exit velocity similar to that of the current inhaler internal flow passages (approximately 17.8
m/s). Analysis of the Huh Atomization Model(5)(Section 3.4.2) showed that the turbulence
exit conditions that produce a reduced median secondary droplet size are a low kavg/eavg ratio
at a relatively low value of kavg. It is very difficult to get a physical feel for exactly what
geometric factors lead to these conditions. It is somewhat easier to get a feel for what factors
lead to general internal turbulent flow. As mentioned earlier, these include rapid fluid flow
past sharp corners, angularities, or obstructions of some type and the mixing of different fluid
streams. So, the improved nozzle design and analysis process consisted ofmodeling
suspected turbulent generating nozzles and subsequent testing of these nozzles using the Huh
Atomization Model(5). This was done to determine if they possessed the proper turbulence
exit conditions needed to produce an improvement over the baseline median secondary
droplet size.
4.3.1 NozzleModels
The add-on nozzles were modeled in amanner similar to the inhaler flow passages. The
analysis tools and conditions were the same as the baseline inhaler internal flow passage.
The grid generation method was consistent with all the models. The turbulent inlet
conditions were set equal to the exit conditions of the inhaler internal flow passage model as
seen in Figure 4.7. Water was chosen to simulate the flow of the drug as before. A zero
normal-gradient boundary condition was used at the nozzle exit for all of the flow properties
except pressure.
39

M. P. Medlar
Inlet B.C.'s for add-on nozzle
Correspond to exit conditions of
inhaler baseline model
Q=5.0e-06 m3/s
k=5.8m2/s2
e=7.0e+04m2/s3
Outlet B.C.'s for add-on nozzle
Outflow condition-assumes zero normal
gradient for all flow properties except
pressure (used when outlet conditions
aren't known and want to be solved for)
Figure 4.7. Schematic of add-on nozzle boundary conditions
In all of the add-on nozzle models, symmetry boundary conditions were used to speed up
computational time and allow for an increased number of cells in the computational domain.
The add-on nozzle models contain a consistent number of triangular cells (approximately
40,000). An example mesh fromMultiple Inlet Nozzle 1 is shown in Figure 4.9. Again, the
results of importance were the average k and e values at the exit. These values were
imported into the Huh AtomizationModel(5)
and a median secondary droplet size was
predicted.
The nozzle types are classified into six different groups based on their geometric
characteristics. The six groups are as follows:
Multiple InletNozzles
These nozzles consist of two or four square or rectangular inlets that lead to a single outlet.
Both the inlets and outlets could be straight or angled. The attempt was to get the flow to
separate on inlet but converge to produce a single turbulent outlet. This nozzle would be
produced out of two 500 pm chips that would be fused together after individual processing.
40

M. P. Medlar
The h-parameter is classified as the gap from the exit of the inlet chip to the inletof the outlet
chip.
Inlet
-? Outlet
Line of
symmetry
Figure 4.8.Multiple inlet nozzle 1-four straight inlets, one angledoutlet-h=150 um
'j..':.':.'' '' "
~J^-
Figure 4.9. Multiple inlet nozzle 1 example mesh-inlet and hsection (left), outlet section (right)
41
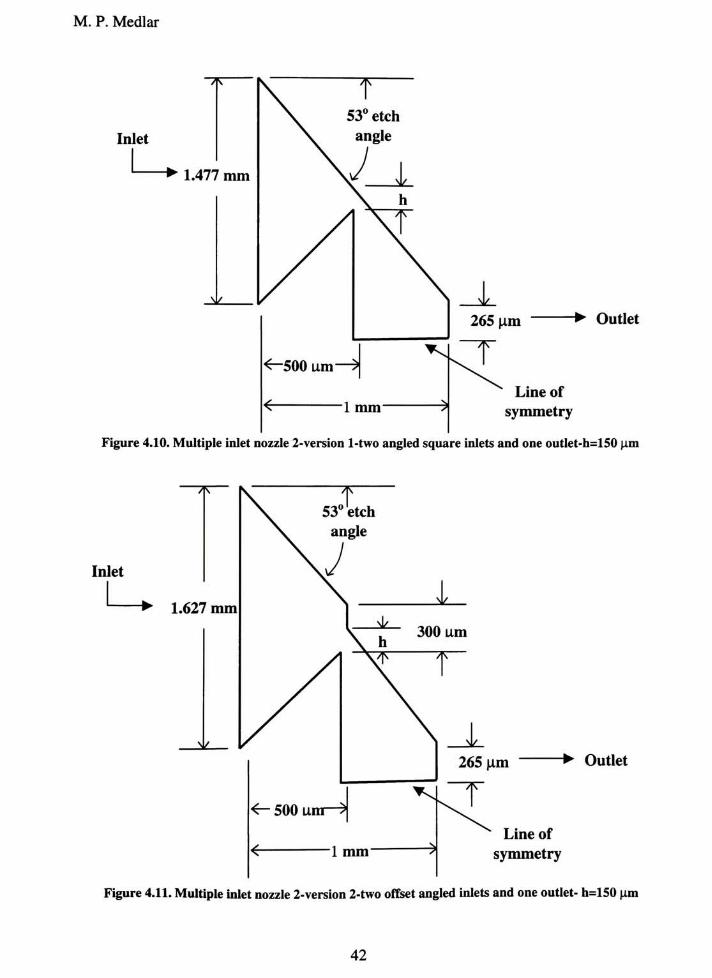
M. P. Medlar
Inlet
"? 1.477 mm
> Outlet
Line of
symmetry
Figure 4.10. Multiple inlet nozzle 2-version 1-two angled square inlets and one outlet-h=150 urn
Inlet
-*
1.627 mm
265 urn ? Outlet
Line of
symmetry
Figure 4.11.Multiple inlet nozzle 2-version 2-two offset angled inlets and one outlet- h=l50 um
42

M. P. Medlar
Inlet
"? 450 um
500 um
1 mm
265 um > Outlet
Line of
symmetry
Figure 4.12. Multiple inlet nozzle 3-version 1-two straight square inlets and one outlet- h=150 um
Inlet
"? 450 um
500 um
1 mm
265 um > Outlet
Line of
symmetry
Figure 4.13.Multiple inlet nozzle 3-version 2-two straight square inlets and one outlet- h=100 um
43

M. P. Medlar
W-Nozzle
This type of nozzle consists of one angled, rectangular inlet that forces the flow over a
triangular-type obstruction into a single outlet. This nozzle would be produced out of two
500 um chips that would be fused together after individual processing. The inlet chip
geometry would be produced using an overlapping and angled etching strategy. This would
hopefully lead to the desired geometry. Again, the attempt was to get the flow to separate
over the obstruction but converge to produce a single turbulent outlet. The h-parameter is
classified as the gap from the edge of the triangular obstruction to the side of the straight
outlet.
Inlet
"? 814 um
Line of
symmetry
Figure 4.14.W-nozzle-version 1-one angled rectangular inlet and one outlet-h=150 um
44

M. P. Medlar
Inlet
+ 814 um
-? Outlet
Line of
symmetry
Figure 4.15.W-nozzle-version 2-one angled rectangular inlet and one outlet-h=100 um
Mesh Nozzle
This nozzle is similar to the multiple inlets, however it would have many more inlets. The
model shown in Figure 4.16 was designed with twelve inlets in mind. This design disturbs
the flow and leads to turbulent conditions at the exit.
Inlets
1.23 mm
Outlet.
Line of
symmetry
Figure 4.16.Mesh nozzle-twelve square inlets, one angled outlet-h= 150 um
45

M. P. Medlar
Simple Contraction Nozzle
This nozzle consists of a square inlet that converges to a throat and then flows into a
divergent outlet. The throat distance is equal to 200 pm.
Inlet
? Outlet
Line of
symmetry
Figure 4.17. Simple contraction nozzle-square inlet and outlet-h=100 um
Stepped Nozzle
This nozzle consists of a series of step down sections that lead to square outlet. In this case,
the step length was 500 um.
S 1.5 mm ^
1 mm
500 um-^|
Inlet
Line of
symmetry
7fr 1.265 mm
765 um
265 umOutleI
Figure 4.18. Stepped nozzle-square steps
46

M. P. Medlar
CombinationMultiple Inlet and Stepped Nozzle
This nozzle consists of a series of offset square sections that step down to the outlet. It
would most likely contain two inlets.
Inlet
615 um
OutleI
1 mm
Line of
symmetry
Figure 4.19. Combination multiple inlet and stepped nozzle-h=100 um
4.3.2 Comparison ofAdd-on Nozzle Results
The results from the two-dimensional modeling of the initial add-on nozzles are shown in
Table 4.1.
Nozzle V.V09 ill /S eaVg, m /s Kavg/Cavg rcltlO Projectedmedian
sec. drop size, um
Multi-inlet 1 9.3 1.67e+06 5.57e-06 85
Multi-inlet 2,ver. 1 5.8 2.80e-fO5 2.07e-05 137
Multi-inlet 2,ver. 2 5.6 2.14e405 2.62e-05 155
Multi-inlet 3,ver. 1 22.8 1.88e-r06 1.21e-05 200
Multi-inlet 3,ver. 2 45.45 5.38e+06 8.45e-06 233
W-Nozzle,ver. 1 5.87 3.95e+05 1.49e-05 115
W-Nozzle,ver. 2 5.65 3.21e+05 1.76e-05 123
Mesh Nozzle 5.98 3.27e+05 1.83e-05 130
Simple Contract. 11.1 4.27e+05 2.59e-05 213
SteppedNozzle 3.44 4.02e+04 8.56e-05 227
47

M. P. Medlar
Multi-inlet & Step 140 3.18e+07 4.40e-06 285
Inhaler 2D Model 2.52 3.76e+04 6.70e-05 170
Table 4.1. Initial 2D nozzle modeling results
To ensure that the two-dimensional models captured the trend of the three-dimensional flow
effects, three of the above nozzles were modeled in three dimensions and the results are
shown in Table 4.2.
Nozzle J\Y&) rxi /o7 "}
OQvg? Ill '& *^avg' ^avg 1*3.110 Exit
Velocity, m/s
Projected
median sec.
drop size, um
Multi-inlet 1 47.15 4.03e+06 1.17e-05 17.86 285
Inhaler 5.80 7.0e+04 8.29e-05 17.8 290
Multi-inlet
2,ver. 1
184 3.28e+07 5.61e-06 17 370
Table 4.2. Initial 3D nozzle modeling results
From the above results in can be seen that the lowest projected value for the median occurs in
theMulti-inlet nozzle 1. This nozzle produces a low kaVg/eawg ratio at a relatively low value
of kavg on exit from the nozzle. As seen earlier, this type of turbulence exit condition leads to
the best results.
4.3.3 Optimization ofMulti-inlet Nozzle 1
TheMulti-inlet nozzle 1 gives the lowest secondary median droplet size among the add-on
nozzles considered thus it was optimized. This involved changing two geometric parameters
on the nozzle and quantifying the effects. These parameters were classified asthe h and s
dimensions. They were the only ones that could be changed since both the chip thickness
and etch angles were fixed at 500 um and 53, respectively, due to the fabrication process
(Appendix A). Also, the exit area was kept the same as the baseline inhalermodel exit area
to insure that the exit velocity was kept constantat around 17 m/s. The important dimensions
are shown in Figure 4.20.
48

M. P. Medlar
Inlet
Separation
Point
Outlet-fixed to keep*"
outlet velocity same as
baseline
Line of
symmetry
Figure 4.20. Multi-inlet nozzle 1 schematic
The h-parameterwas varied from 150 um down to 25 um with the inlet velocity and
outlet dimensions held constant. This optimization was modeled in both two and three-
dimensions to ensure that the trend was consistent. The projected median was calculated for
each h value considered. From Figure 4.21 we see that as the h value is increased beyond
100 um the projectedmedian tends to increase. This tendency continues as the h value is
decreased below 100 um. Thus, the optimum value for h occurs around 100 um. This result
is consistent in both the two-dimensional and three-dimensional analysis.
49

M. P. Medlar
a
oV
E 190
1o
O*
140
30 Optiroation
-2D Optimization
80 100 120 140 160
h, )im
Figure 4.21. Optimization results for geometric parameter, h
The s-dimension was varied from 100 um to 450 um at three different constant values
of h, namely 150 u,m, 100 um, and 50 um. These results are shown in Figure 4.22. The
three curves exhibit the same behavior. There is an s value associated with a minimum
median droplet size for each h curve. As s is increased above and below this value, the
projectedmedian increases. It is seen that the optimum value for s occurs at approximately
350 um at an h value of 100 um. These results are consistent with the previous h
optimization.
E 120-
h=150
- - - h=50
250
Figure 4.22. Optimization results for geometric parameter, s
50

M. P. Medlar
TheMultiple Inlet Nozzle 1 contains four straight inlets on one chip leading to a
single angled outlet on the second chip. It seems that this combination dissipates k rapidly
and doesn't allow for the transport of large values of k to the exit of the nozzle (i.e. low
kavg/eavg ratio at a low value of kavg). The presence of the angled wall immediately after the
inlet section acts to rapidly change the fluctuating components of velocity and thus k (leads
to high e). The turbulent eddies that are set up following the separation point are broken up
into eddies ofmuch smaller size due to the confining effect of the angled outlet (i.e. high eaVg
and lower kaVg on exit). An h value of 100 um and an s value of 350 um produce the
optimum results. At larger h values, the turbulent eddies don't seem to impact the confining
wall enough to break up into the proper size (e is not high enough). At smaller h values, the
localized velocity is too high to allow for break up against the wall before the turbulent
eddies are transported downstream to the exit (k is too high).
4.3.4 3D Model ofMultiple Inlet Nozzle 1
The optimum values for the h and s parameters had been determined to be 100 um and 350
um, respectively, from Section 4.3.3. A three-dimensional version of the optimumMultiple
Inlet Nozzle 1 was modeled and an improved median secondary droplet size was predicted.
The modeling procedure was the same as the previous nozzles. The model consists of four
square inlets with an inlet area of 2.025e-07m2
each. A schematic of the 3D model is shown
in Figure 4.23.
Inlets
'Outflow
Figure 4.23. 3D schematic ofmultiple inlet nozzle 1
51

M. P. Medlar
With a flow rate of 5.0e-06 m3/s and the inlet area mentioned above, this leads to an inlet
velocity of 6. 17 m/s. Theturbulent inlet conditions were set equal to the exit conditions of
the inhaler internal flow passage model (kavg=5.8 m2/s2, eavg=7.0e+04 m2/s3). The exit area
was kept equal to that of the baseline inhaler exit area of 2.83e-07 m2. This was to keep the
outflow velocity approximately the same. This nozzle is symmetric about two planes of
symmetry so, only one fourth of the nozzle was actually modeled. The results were checked
for grid independence and the final mesh contains approximately 230,000 triangular volume
elements.
The results of importance from this analysis include the turbulent kinetic energy (k)
and the turbulent kinetic energy dissipation rate (e). Flow contours of the computational
results are shown in Figures 4.24 and 4.25.
Figure 4.24 illustrates the contours of turbulent kinetic energy. The main point of
interest is at the outflow location.
12.288+02
2.0Se+02
'<!*S 1.82e+02
1 .59e+02
1 37e+02
1.14e+02
9.11e+01
6.83e+01
4.55e+01
2.28e+01
1 .030-02
Velocity Inlet
6.17 m/s
Symmetry Plane
Velocity Inlet
6.17 m/s
^h=100 urn
s=350 um
Outflow 17.7 m/s
2/2
Figure 4.24.Multiple inlet nozzle 1-turbulent kinetic energy, kaVg on exit =60.8 m /s
.2,2
From a vertex average on outflow of the nozzle, kaVg =60.8 m /s
Figure 4.25 shows the flow contours of e for theMultiple InletNozzle 1. Again, the
area of concern is at the nozzle exit.
52

M. P. Medlar
1 .71 e+09
1 .54e+09
1 .37e+09
1 20e+09
1 ,03e+09
8.54e+08
6.83e+08
5.13e+08
3.42e+08
1.71e+08
2.59e+02*L
Figure 4.25. Multiple inlet nozzle 1 -turbulent kinetic energy dissipation, Eavg on exit=8.13e+06m2/s3
From a vertex average on exit of the nozzle, eaVg= 8.13e+06 m2/s3. This leads to a kavg/eavg
ratio of 7.48e-06.
The turbulence exit conditions (kavg and eaVg) of the nozzle were used to find the
probability density function (PDF) and median secondary droplet size from the Huh
Atomization Model(5). Figure 4.26 illustrates the PDF for kavg = 60.8m2/s2
and eaVg=
8.13e+06m2/s3.
53

M. P. Medlar
800 1000 1200
x, droplet diameter, \im
Figure 4.26. Secondary droplet size distribution for optimized multiple inlet nozzle 1
The cumulative secondary drop size distribution, F(x) can be calculated from the PDF and
this is shown in Figure 4.27.
2000 3O00
x, droplet diameter, nm
Figure 4.27. Cumulative secondary drop size distribution for optimized multiple inlet nozzle 1
The area under the PDF is set equal to 1.0 through the use of the normalization constant
(Equation 3.2) described in Section 3.4.1. It follows then that the median is the droplet
diameter at which the area under the PDF is equal to 0.5. This is the same point at which the
54

M. P. Medlar
cumulative size distribution (F(x)) will be equal to 0.5. The median secondary droplet size
resulting from the optimizedMultiple Inlet Nozzle 1 was 245 um.
4.4 Summary ofResults
The purpose of this study was to design and analyze turbulence generating nozzles for the
improvement of existing pressurized metered dose inhaler therapy. The existence of
turbulence within the inhaler nozzle is one mechanism that leads to the production of the
aerosol in this device. The current inhaler internal flow passage was analyzed on a
turbulence basis and a baseline median secondary droplet size of 290 um was predicted. The
analysis of the Huh AtomizationModel(5)
led to the conclusion that changing the turbulence
exit conditions in the inhaler through the addition of a nozzle could lead to a reduced median
secondary droplet size. The existence of a low k^Jz^% ratio at a relatively low value of kavg
on exit from the nozzle produces the desired results. This means that the majority of the
turbulent energy of the flow is contained in eddies of a small size. Eleven different nozzles
were tested in an effort to achieve these results. It was found that a nozzle of the type of
Multiple Inlet Nozzle 1 had the most potential and was thus optimized to generate the best
results. The addition of theMultiple Inlet Nozzle 1 leads to a 15.5% reduction in the median
secondary droplet size based on the development of the proper turbulence exit conditions
alone. It is important to note again that this analysis was based solely on generation of
turbulence within the nozzles. The relative improvement achieved with the new add-on
nozzles compared with that of the baseline inhalermodel was the main objective. The actual
droplet size is expected to be smaller due to the influence of the other atomization
mechanisms (flashing of propellant and formulation properties) associated with spray
formation in the pMDI.
55

M. P. Medlar
Chapter 5-Conclusions
Pharmaceutical inhalation aerosol technology has become an important therapy for the
treatment of both respiratory and non-respiratory illness. Targeting therapeutic aerosols to
the small airways of the lung can effectively treat many of these diseases. Delivery of the
therapeutic agent directly to the site of action, for cases involving respiratory diseases,
ensures an adequate therapeutic level of the drug is reached, without leading to side effects
due to high systemic concentrations. For non-respiratory diseases, the periphery of the lung
offers enormous surface area (approximately 100m2) for rapid absorption intocirculation/17*
In either case, the appropriate spray characteristics (0.5 um<MMAD<5um(1'2,3'4*
and as low
velocity as possible) are vital to targeting the lung periphery.
There are threemajor categories ofmedical inhalation devices currently in use. All
of them have their advantages and drawbacks. They consist of the PressurizedMetered-Dose
Inhaler (pMDI), the Dry Powder Inhaler (DPT), and the Nebulizer. Of the three inhalation
devices described above, the pMDI is the most commonly prescribed method of aerosol
delivery/14'28*The pMDI is inexpensive, portable, and at least as effective as other systems
of aerosol generation for drug delivery, if properlyused/14'29*
Thus, with further
improvements, it could become the most optimal and desirable means of drug delivery to the
lungs.
Within pressurized metered dose inhalers (pMDI), many factors lead to the break-up
or atomization of the formulation. These include the nozzle geometry, volatilization of the
propellant (cavitation), and turbulence in the nozzle. No single atomization model has been
developed to account for all of these factors. Models have been developed to account for the
flashing of the propellant as the primary atomizationmechanism/45'46*
This study was
concerned with the positive effects of turbulence generation so, the Huh Atomization
Model(5)was used to predict the droplet size distribution resulting from certain nozzle exit
conditions. This model considers both turbulence and wave growth as important processes in
atomization.
The purpose of this study was to design and analyzeturbulence generating add-on
nozzles for the improvement of existing pressurized metered doseinhaler therapy (namely,
56

M. P. Medlar
reducing the median droplet size at a similar exit velocity). The development of the proper
turbulence characteristics on exit from the nozzles was a key factor in promoting greater
atomization and reducing the median droplet size. Geometries were created to separate the
flow and create regions of vorticity and rotation in the nozzles. These regions holdenergy-
containing turbulent eddies of various sizes that are vital to the atomization process and
resulting spray distribution. Analysis of the Huh AtomizationModel(5)
showed that
producing a low kavg/eavg ratio at a relatively low value of kavg could reduce the median
droplet size. In practical terms, increasing eavg for a constant value of kavg produces a shift in
the energy containing eddies from larger to smaller sizes. Smaller eddies are more efficient
in dissipating energy than larger ones(50), so the turbulent kinetic energy is concentrated in
eddies of smaller sizes, which ultimately produces a reduced median secondary droplet size.
Eleven different nozzles were tested in an effort to achieve these results. The
Multiple Inlet Nozzle 1 had the most potential and was thus optimized to generate the best
outcome (i.e. lowest median secondary drop size). This nozzle contains four straight inlets
leading to a single angled outlet. It seems that this combination dissipates k rapidly and
doesn't allow for the transport of large values of k to the exit of the nozzle (i.e. low k^g/e^
ratio at a low value of kavg). The presence of the angled wall immediately after the inlet
section acts to rapidly change the fluctuating components of velocity and thus k (leads to
high e). The turbulent eddies that are set up following the separation point are broken up into
eddies of much smaller size due to the confining effect of the angled outlet (i.e. high eavg and
lower kavg on exit). The optimization ofMultiple Inlet Nozzle 1 was based on two geometric
parameters, namely h and s. An h value of 100 um and an s value of 350 um produce the
most favorable results. At larger h values, the turbulent eddies don't seem to impact the
confining wall enough to break up into theproper size (e is not high enough). At smaller h
values, the localized velocity is too high to allow for break up against the wall before the
turbulent eddies are transported downstream to the exit (k is too high). Development of these
proper turbulence characteristics with the addition ofMultiple Inlet Nozzle 1 led to a 15.5%
reduction of the representative secondary median droplet size resulting from the pMDI based
on turbulence effects alone.
This thesis was the preliminary work in the investigation into the positive impacts
that the addition of a turbulence-generating nozzle could have on the resulting pMDI spray.
57

M. P. Medlar
Follow-up work will be needed to complete the investigation and some suggestions for that
work are as follows:
First, the fabrication of the turbulence generating nozzles in this study followed by
subsequent experimentation is a logical next step. This will also involve the design of the
interface between the add-on nozzle and the existing inhaler. Second, modeling of the other
factors involved in the aerosol production from the pMDI is a noteworthy task. This could
include the primary atomization mechanism of volatilization of the propellant, which is
related to evaporation or cavitation effects. Third, many drug formulations are suspensions
of drug particles and not solutions. Modeling of this fact might involve setting up a two-
phase Lagrangian flow of drug particles within the inhaler. And lastly, the design,
development, and testing of other turbulence generating nozzles not mentioned in this
investigation could prove to be of importance.
58

M. P. Medlar
References
1. Suarez S, Hickey AJ. Drug Properties Affecting Aerosol Behavior. Respir Care
2000;45(6):652-666.
2. Byron PR, Patton JS. Drug Delivery Via the Respiratory Tract. J Aerosol Med
1994;7(l):49-75.
3. Brain JD, Valberg PA. Deposition ofAerosols in the Respiratory Tract (review). Am
Rev RespirDis 1979;120(6):1325-1373.
4. Zainudin BM. Therapeutic Aerosol: Principles and Practices. Med J Malaysia
1993;48(3):259-268.
5. Huh KY, Lee EJ, Koo JY. Development of a Diesel Spray Atomization Model
Considering Nozzle Exit Turbulence Conditions. Atomization and Sprays
1998;8(4):453-469.
6. NewhouseMT. Tennis Anyone? The Lungs as a New Court for Systemic Therapy.
CMAJ November 1999;161(10): 1287-1288.
7. Sharma S, White D, Imondi AR, PlackeME, Vail DM, Kris MG. Development of
Inhalational Agents for Oncologic Use. J Clin Oncol 2001;19(6):1839-1847.
8. Toso C, Williams DM, Noone PG. Inhaled Antibiotics in Cystic Fibrosis: A Review.
Ann Pharmacother 1996;30(7-8):840-50.
9. Thompson PJ. Drug Delivery to the Small Airways. Am J Respir Crit Care Med
1998;157(5):S199-S202.
10. Howarth PH. Why Particle Size Should Affect Clinical Response to Inhaled Therapy.
J Aerosol Med 2001;14(1):27(8 pages).
11. Gonda I, Byron P. Aerosols forDelivery ofTherapeutic andDiagnostic Agents to the
Respiratory Tract. Critical Reviews in Therapeutic Drug Carrier Systems
1990;6(4):273-300.
12. Mandal T. Module 8: Miscellaneous Preparations. Available From:
<http://xavier.xula.edu/tmandal/phairnaceutics/aerosols.html> [Accessed August
2001].
59

M. P. Medlar
13. Sanjar S, Matthews J. Treating Systemic Diseases via the Lung. J Aerosol Med
2001;14(1):51(8 pages).
14. Fink JB. Metered-Dose Inhalers, Dry Powder Inhalers, and Transitions. Respir Care
2000;45(6):623-635.
15. Wiener MV. How to Formulate Aerosols to Obtain theDesired Spray Pattern. Soc
Cos Chem 1958;9:289-297.
16. Dhand R, Malik SK, BalakrishnanM, Verma SR. High Speed Photographic Analysis
ofAerosols Produced byMetered-Dose Inhalers. J Pharm Pharmacol 1988;40(6):429-
430.
17. Ariyananda PL, Agnew IE, Clarke SW. Aerosol Delivery Systems for Bronchial
Asthma. PostgradMed J 1996;72(845): 15 1-156.
18. Newman SP. Aerosol Generators and Delivery Systems. Respir Care 1991;36(9):939-
951.
19. DolovichM, Ruffin RE, Roberts R, NewhouseMT. Optimal Delivery ofAerosols
fromMetered Dose Inhalers. Chest 1981;80(6 Suppl):91 1-915.
20. Berg E. In Vitro Properties of Pressurized MeteredDose Inhalers with and without
Spacer Devices. J Aerosol Med 1995;8(3):S3-S11.
21. DolovichM, Rheim R, Rashid F, Coates G, Hill M, Bowen B. Measurement of the
Particle Size and Dosing Characteristics of a Radiolabelled Albuterol-Sulphate
Lactose Blend used in the SPIROS Dry Powder Inhaler. In: Dalby RN, Byron P, Farr
SY, editors. Respiratory Drug Delivery V. Buffalo Grove: Interpharm
Press;1996:332-335.
22. Engel T, Heinig JH,Madsen F, Nikander K. Peak Inspiratory Flow and Inspiratory
Vital Capacity of Patients with AsthmaMeasured with and without a New Dry-
Powder InhalerDevice (Turbuhaler). Eur Respir J 1990;3(9): 1037-1041.
23. Brian JD, Valberg PA. Deposition ofAerosols in the Respiratory Tract (Review). Am
Rev Respir Dis 1979;120(6):1325-1373.
24. Zainudin BM. Therapeutic Aerosols: Principles and Practices. Med JMalaysia
1993;48(3):259-268.
25. WolffRK, Niven RW. Generation of Aerosolized Drugs. J AerosolMed
1994;7(1):89-103.
60

M. P. Medlar
26. Hess DR. Nebulizers: Principles and Performance. Respir Care 2000;45(6):609-622.
27. Greenspan BJ. Ultrasonic and Electrohydrodynamic Methods for Aerosol Generation.
In: Hickey AJ, editor. Inhalation Aerosols: Physical and Biological Basis for Therapy.
New York: Marcel Decker; 1996:313-335.
28. Fink JB, Dhand R. Aerosol Therapy. In: Fink JB, Hunt G, editors. Clinical Practice in
Respiratory Care. Philadelphia: Lippincott Raven; 1998.
29. AARC Clinical Practice Guideline: Selection of and Aerosol Delivery Device. Respir
Care 1992;37(8):891-897.
30. Atkins PJ. Aerodynamic Particle-Size Testing-ImpingerMethods. Pharm Tech
1992;16:26-32.
31. Milosovich SM. Particle-SizeDetermination via Cascade Impaction. Pharm Tech
1992;16:82-86.
32. Mitchell JP, Nagel MW, Archer AD. Performance Testing of a New Low Flow
Marple-Miller Cascade Impactor. Respiratory Drug Delivery VI 1998;38 1-383.
33. Mitchell JP. The Next Generation Impactor (NGI): Results from the Evaluation of
Prototype Instruments with Pressurized Metered Dose Inhaler (pMDI)-Based
Formulations. DrugDelivery to the Lungs XI. J Aerosol Med 2001;14(1):133.
34. Evans R. Determination ofDrug Particle Size andMorphology Using Optical
Microscopy. Pharm Tech 1993;17:146-152.
35. Dhand R,Malik SK, Balakrishnan M, Verma SR. High Speed Photographic Analysis
ofAerosols Produced byMetered Dose Inhalers. J Pharm Pharmacol 1988;40:429-
430.
36. GormanWG, Carroll FA. Aerosol Particle Size Determination Using Laser
Holography. Pharm Tech 1993;17:34-37.
37. Niven RW. Aerodynamic Particle Size Testing Using a Time-of-Flight Aerosol Beam
Spectrometer. Pharm Tech 1993;17:72-78.
38. Mitchell JP, Nagel MW, Archer AD. Size Analysis of a Pressurized Metered Dose
Inhaler (pMDI)-Delivered Suspension Formulation by the API Aerosizer Time-of-
Flight Aerodynamic Particle Size Analyzer. J Aerosol Med 1999;12(4):255-264.
61

M. P. Medlar
39. Myrdal PB, Gupta A, Stein SW, Gabrio BJ, Beck TJ. Evaluation of a New
Aerodynamic Particle Sizer for MDI Size Distribution Measurements. Respiratory
Drug Delivery VUI Volume H 2002;663-666.
40. Ranucci J. Dynamic Plume-Particle Size Analysis Using Laser Diffraction. Pharm
Tech 1992;16:109-114.
41. Dunbar CA, Watkins AP,Miller JF. An Experimental Investigation of the Spray
Issued from a pMDI Using LaserDiagnostic Techniques. J Aerosol Med
1997;10(4):351-368.
42. de Boer AH, GjaltemaD,WittW, Frijlink HW. The Use of a Laser Diffraction
Technique for the Characterization of the Aerosol Cloud from Inhalation Devices.
RespiratoryDrug Delivery VU Volume H 2000;585-588.
43. Wachtel H, Ziegler J. Improved Assessment of InhalerDevice Performance Using
LaserDiffraction. Respiratory Drug Delivery Vm Volume U 2002;379-382.
44. Clark AR. MDIs: Physics ofAerosol Formation. J Aerosol Med 1996;9 Suppl:S19-
S26.
45. Clark AR. Metered Atomization for Respiratory Drug Delivery. PhD Thesis 1991.
Loughborough University of Technology, Loughborough, UK.
46. Dunbar CA, Watkins AP,Miller JF. Theoretical Investigation of the Spray from a
PressurizedMetered Dose Inhaler. Atomization and Sprays 1997;7:417-436.
47. Mathieu J, Scott J. An Introduction to Turbulent Flow. New York: Cambridge U.
Press, 2000.
48. RichardsonWP. The Influence ofUpstream Flow Conditions on the Atomization
Performance of a Low Pressure Port Fuel Injector. Masters Thesis 1991. Michigan
Technical University.
49. Chen CJ, Jaw SY. Fundamentals ofTurbulence Modeling.Washington, DC: Taylor
& Francis, 1998.
50. Garde RJ. Turbulent Flow. John Wiley & Sons, 1994.
51. Star-CD UsersManuals. Methodology Guide V3-10.
52. Lefebvre AH. Atomization and Sprays. Bristol, PA: Taylor & Francis, 1989.
53. OhnesorgeW. Formation ofDrops by Nozzles and the Breakup of Liquid Jets. Z
Angew Math Mech 1936;16:355-358.
62

M. P. Medlar
54. Reitz RD. Atomization and Other Breakup Regimes of a Liquid Jet. PhD Thesis
1978. Princeton University, Princeton, NJ.
55. Groover MP. Fundamentals ofModem Manufacturing: Materials. Processes, and
Systems. Upper Saddle River, NJ: Prentice-Hall, 1996.
63

M. P. Medlar
Appendix A-Manufacturing Process
It was clear to me that the new nozzles would contain holes and passageways of a small
nature. So, it became apparent that etching in a silicon chip in a manner similar to Integrated
Circuit production on a microchip would be a feasiblemanufacturing process. This process
imposed certain restrictions on the nozzle designs (namely max thickness of 500um for one
chip, and an etch angle of either53.4
or 90). It was vital to keep this manufacturing
process in mind in the thought process for the design of the add-on nozzles. The basic steps
to this process are as follows:
First, a silicon wafer is cut from a large silicon ingot. These wafers are typically 500
um thick. Second, the surface of the silicon wafer is oxidized to produce of barrier layer of
Si02. Third, the surface is prepared and photoresist is applied. A photoresist is an organic
polymer that is sensitive to light radiation in a certain wavelengthrange/55*
It comes in both
positive and negative types. The type of photoresist refers to what happens to the material
after it is exposed. The positive type becomes more soluble in a developing solution and the
negative type is less soluble. Fourth, after a soft bake, a pattern mask is aligned to the wafer
and the resist is exposed to a certain type of light. This process basically transfers an image
onto the surface of the photoresist material. Fifth, the resist is then developed. This means
the exposed wafer is brought into contact with a developing solution. For positive resist, the
exposed areas are dissolved in the developer and for negative resist, the unexposed areas are
dissolved leaving the Si02 surface uncovered in these areas. Sixth, after a hard bake, an
etching process is used to remove the Si02 layer at selected regions where the resist has been
removed. Two basic types of etching are chemical etching and plasma etching. Seventh,
after stripping the resist, a hole or passageway is etched in the silicon wafer itself at the
location where the Si02 has been removed. This can be done using a chemical etch
consisting of a mixture of nitric acid and hydrofluoricacid/55*
It is important to note that
holes can be various shapes and sizes. Depending on the orientation of the crystal planes in
the silicon, holes with53.4
wall angles are possible as well as holes with vertical walls. And
lastly, the individual chips are then cut from the circular silicon wafer. The square or
rectangular chips can range from 5 to 15 mm on aside/55*
Also, it is possible to fuse two or
more chips together after they have been individually processed.
64