the deformation and failure response of closed-cell pmdi
TRANSCRIPT

ilable at ScienceDirect
Polymer Testing 44 (2015) 112e124
Contents lists ava
Polymer Testing
journal homepage: www.elsevier .com/locate/polytest
Material properties
The deformation and failure response of closed-cell PMDIfoams subjected to dynamic impact loading
Behrad Koohbor a, Silas Mallon a, Addis Kidane a, *, Wei-Yang Lu b
a Department of Mechanical Engineering, University of South Carolina, 300 Main Street, Columbia, SC 29208, USAb Sandia National Laboratories, Livermore, CA 94551-0969, USA
a r t i c l e i n f o
Article history:Received 6 February 2015Accepted 21 March 2015Available online 7 April 2015
Keywords:Polymeric foamPMDIDynamic loadingDigital image correlationShock tube
* Corresponding author. Department of MechUniversity of South Carolina, 300 Main Street, ColuTel.: þ1 (803) 777 2502; fax: þ1 (803) 777 0106.
E-mail address: [email protected] (A. Kidane).
http://dx.doi.org/10.1016/j.polymertesting.2015.03.00142-9418/© 2015 Elsevier Ltd. All rights reserved.
a b s t r a c t
The present work aims to investigate the bulk deformation and failure response of closed-cell Polymeric Methylene Diphenyl Diisocyanate (PMDI) foams subjected to dynamicimpact loading. First, foam specimens of different initial densities are examined andcharacterized in quasi-static loading conditions, where the deformation behavior of thesamples is quantified in terms of the compressive elastic modulus and effective plasticPoisson's ratio. Then, the deformation response of the foam specimens subjected to directimpact loading is examined by taking into account the effects of material compressibilityand inertia stresses developed during deformation, using high speed imaging inconjunction with 3D digital image correlation. The stress-strain response and the energyabsorption as a function of strain rate and initial density are presented and the bulk failuremechanisms are discussed. It is observed that the initial density of the foam and theapplied strain rates have a substantial influence on the strength, bulk failure mechanismand the energy dissipation characteristics of the foam specimens.
© 2015 Elsevier Ltd. All rights reserved.
1. Introduction
Foam materials have recently gained attention in engi-neering applications, particularly in those where light-weight structural design and/or energy dissipation areessential design parameters [1]. Polymer foams are widelyused in applications such as sandwich structures, auto-motive industries and packaging. Many of these applica-tions inherently entail high loading rates, such as highspeed vehicle accidents or impacts on packaged items. Dueto unavailability of a well-defined material model at suchhigh loading rates, these structures are usually designedbased on their quasi-static behavior. However, materialproperties obtained from quasi-static testing may not
anical Engineering,mbia, SC 29208, USA.
16
accurately characterize the material response in real situ-ations at extremely high strain rate loading conditions, asthe material response might be highly sensitive to the rateof deformation. The effect of strain rate on the materialproperties could be also depend on some of the materialcharacteristics, such as the foam density and the cellstructure [2e6]. At cellular scale, the deformation mecha-nism of foam materials include cell wall bending andstretching followed by post-yield wall buckling, whilethese microscale mechanisms contribute to the overallstiffness and strength of the material at larger scales. Thus,varying the cell structure and pore geometry in a foamspecimen not only can change thematerial's bulk density, itwill also substantially influence the stiffness, strength andbulk failure response of the material [1].
Researchers have been looking to understand thedeformation behavior of foams at high strain rate loadingconditions. So far, there have been both experimental and

B. Koohbor et al. / Polymer Testing 44 (2015) 112e124 113
numerical efforts to characterize the dynamic deformationand fracture behavior of foam structures consideringvarious material parameters, such as the material cellstructure and density [7e10]. However, owing to the highlevel of complexity encountered in the study of high strainrate deformation of these structures, a thorough exami-nation of the deformation response at elevated strain rateshas been very difficult to achieve. One of the more signifi-cant difficulties in the investigation of high strain ratedeformation of foam structures arises from the low wavepropagation speed in these materials [11]. During dynamicloading conditions, such low wave propagation speed re-sults in difficulties in achieving equilibrium state, particu-larly at the earlier stages of deformation [12e18]. In such acondition, conventional measurement of load and defor-mation using only sensors located at the specimen ends caninduce significant errors in the calculations. The problembecomes more pronounced in the presence of compress-ibility, the situation exist during deformation of polymericfoams [1].
The effects of nonhomogeneous deformation and inertiapresent during dynamic deformationofmaterials havebeena subject of study fromearly 1960's [19]. In the earlierworks,great efforts were taken in order to include the influence ofinertia into the measurements, accounting for the non-equilibrium state of deformation in high strain rate exper-iments. A survey within the literature of 1960's to 1990'sindicates that researchers have attempted to consider theeffect of inertia in their measurements by proposingsimplified mathematical formulations, such as those docu-mented by Samanta [12], Kukurema andHutchings [20] andGorham [21,22]. However,more recently, with the advent offull-field measurement techniques such as digital imagecorrelation (DIC) [23,24], and the development of powerfulhigh speed imaging devices, more accurate determinationof inertia forces and, consequently, a more realistic study ofthe deformation of specimens exposed to dynamic loadingconditions has been facilitated [25].
The main objective of the preset work is to study theconstitutive behavior of polymeric foams with differentmass densities subjected to direct impact loading using fullfield deformation measurements and inverse method.Foam specimens of different initial densities are charac-terized under quasi-static and direct impact loading con-ditions and their deformation response as well as their bulkfailure mechanisms is investigated by accounting for theeffects of compressibility and inertia stress. A simple one-dimensional mathematical model was used for the deter-mination of instantaneous density of the material over theentire duration of loading. The full-field displacement andstrain distributions obtained within the field of interestwere used to calculate the local acceleration, and hence theinertia stress. Finally, the local stress-strain response of thespecimens and the apparent global failure mechanism ofthe specimens exposed to direct impact loading conditionswere captured, while efforts were made to correlate thedifferent deformation and failure mechanisms to the cellstructure of the specimens. To the best of the authors'knowledge, no research has so far been conducted to takeinto account the concurrent influences of the materialcompressibility and inertia loading in the dynamic loading
of polymeric foamswith different cell structures. This couldpotentially open new ways for more accurateexperimental-based understanding of the deformationresponse of porous structures.
2. Materials and methods
2.1. Material and specimen geometry
Rigid closed-cell PMDI (Polymeric Methylene DiphenylDiisocyanate) foams of 160 kg/m3, 320 kg/m3 and 640 kg/m3 nominal densities were subjected to quasi-static anddynamic loading conditions. Nominal densities of the foamspecimensweremeasured in-house bymeasuring themassand the volume of each specimen, and were confirmed tobe within 97% agreement with the values reported by otherresearchers [9]. The differences in the cell structure of thefoam specimens were exemplified in the SEM images takenfrom each specimen. The pore structures are vastlydifferent in both size and regularity, as shown in Fig. 1.Cubic specimens of 25.4 � 25.4� 25.4 mm3 for quasi-staticcompression experiments, were extracted from the originalcylindrical billets using a milling machine. Cylindricalspecimens of 25.4 mm diameter and 25.4 mm height werealso fashioned from the as-received billets for dynamicloading experiments. Note that all specimenswere cut fromthe as-received billets along the same direction. To facili-tate the use of digital image correlation, it is necessary toapply a high contrast random speckle pattern on the sur-face of the specimens. Accordingly, a thin layer of whitepaint was first manually applied on the specimen surface.Then a fine pattern of random black speckles was appliedon top of the white paint using an airbrush, resulting in awell-defined contrast exhibited by the pattern. A typicalcubic specimen with the speckle pattern applied on itssurface is shown in Fig. 2.
2.2. Quasi-static loading
Quasi-static experiments were performed on specimensusing a 250 kN MTS load frame. Loading was appliedmonotonically under displacement control mode at a rateof 1.5 mm.min�1, corresponding to an average strain rate of10�3 s�1. During testing, images were captured at a rate 1frame per second using a 5 megapixel stereo camera sys-tem equipped with 55 mm lenses. These images were ac-quired to facilitate the use of 3D DIC, and to enable thedetermination of the exact instant at which specimenfailure takes place. The arrangement of the cameras, spec-imen and the load frame used in the quasi-static experi-ments is illustrated in Fig. 3. The distance between thecameras and the specimen was about 525 mm, and theangle between the two cameras was 24.4�. Further detailson the cameras system parameters are listed in Table 1.
2.3. Direct impact loading
A shock tube apparatus was used to apply direct impactloading to the specimens at different loading rates. A shocktube is basically a thick-walled tube, made entirely of 6061-T6 aluminum extruded tubes of 75mm inside diameter and

Fig. 1. Scanning electron microscope images of the foam specimen with nominal densities of (a) 160 kg/m3, (b) 320 kg/m3 and (c) 640 kg/m3.
Fig. 2. (a) Typical speckled cubic specimen, with the grey scale histogram of the speckle pattern shown in (b).
B. Koohbor et al. / Polymer Testing 44 (2015) 112e124114
125 mm outside diameter in this case, consisting of twosections, driver and driven sections, which are separated bya stretched polyester film. The section existing at the closedend opposite the specimen, referred to as driver section, ispressurized with helium gas. The pressurization continuesuntil the separating polyester diaphragm ruptures. Withthe burst of this diaphragm, the pressurized trapped heli-um gas expands rapidly from the high pressure driversection into the atmospheric pressure zone, referred to asdriven section. As the helium gas expands through the
driven section, a shock wave is formed by the highlycompressed gas. The velocity and magnitude of pressurewave can be manipulated by varying the number of poly-ester diaphragms used to separate driver and driven sec-tions or by reducing the end of the driven section. A 1meterlong reducing segment was added as the last segment ofthe driven section, nearest to the specimen, in this workwith a tapered inside wall, reducing the inside diameter ofthe tube from 75 mm to 50 mm. The pressure ratio indriver/driven section of the tube in this work achieved

Fig. 3. (a) The experimental setup used to test the foam specimens in quasi-static loading conditions, with a higher magnification image of the cubic specimenbetween the machine platens in (b).
Table 1System parameters obtained from calibration of the stereo camera arrangements used in the quasi-static and dynamic loading conditions.
Parameter Quasi-static testing Dynamic testing
Camera 1 Camera 2 Camera 1 Camera 2
Center e x (pixels) 1202 1221 �190 �178Center e y (pixels) 919 1027 �176 �185Focal length e x (pixels) 17706 17758 5366 5384Focal length e y (pixels) 17705 17761 5368 5385Skew (�) �0.99 �1.23 0.097 0.026
Alpha (�) �0.345 13.872Beta (�) 24.402 �1.186Gamma (�) �0.149 �1.084Tx (mm) �238.61 21.32Ty (mm) �0.56 253.38Tz (mm) 60.28 �1.05
B. Koohbor et al. / Polymer Testing 44 (2015) 112e124 115
using 2 sheets of 0.18 mm thick polyester diaphragms(Mylar sheets) is 2000KPa/101 KPa. The pressure profilesachieved using different number of polyester diaphragmsand further details on the utilized shock tube can be foundelsewhere [26,27]. A schematic view of the shock tube canbe seen in Fig. 4a.
In this particular experiment, the specimen was sub-jected to direct impact loading utilizing a projectile. Theprojectile was placed inside the shock tube in the drivensection. The projectile was machined from 7068 aluminumalloy as a cylinder, hollowed from one end (to reduce themass). The dimensions of the projectile were 72 mm inlength and 49 mm in diameter, to fit into the reducingsection. The projectile was also speckled in order to enable
the measurement of its velocity at incidence with the foamspecimen.
Specimen load data was measured using a custommadeloading fixture incorporating three piezotronic load cellsplaced behind the specimen (See Fig. 4b). These three loadcells were mounted on a specially fabricated fixture onwhich the specimen was affixed with the use of lithiumgrease serving also as lubricant. Use of three load cells fa-cilitates examination of the load distribution and results ina higher level of accuracy during measurements. An oscil-loscope was utilized to acquire data from the load cells, aswell as to trigger data and image acquisition. Images werecaptured using a Photron SAX-2 high speed stereo camerasystem at a rate of 1.8 � 105 frames per second. Similar to

Fig. 4. Schematic view of (a) shock tube and (b) the loading fixture.
B. Koohbor et al. / Polymer Testing 44 (2015) 112e124116
the quasi-static experiments, the acquired images wereused as the input for digital image correlation analyses,explained in detail in the following section. The experi-mental setup including the shock tube and the stereovisioncamera arrangement system is shown in Fig. 5.
Fig. 5. The experimental setup used to apply dy
2.4. Digital image correlation
Displacement and strain data were extracted from im-ages captured during the loading process in both quasi-static and dynamic experiments. This data was acquired
namic impact loading on the specimens.

B. Koohbor et al. / Polymer Testing 44 (2015) 112e124 117
through the use of 3D digital image correlation, asmentioned earlier. Camera resolutions of 2448 � 2048 pix2
and 256 � 168 pix2 were used to capture the full-fieldspecimen deformation response in quasi-static and dy-namic loading conditions, respectively. Images were thenexported to the commercial DIC software Vic-3D® forfurther quantitative analysis. System parameters obtainedfrom calibration of the stereo camera arrangement for bothquasi-static and dynamic loading conditions are detailed inTable 1. The analysis of the images in the software Vic-3D®
was performed using subset and step sizes of 47 and 15pixels for quasi-static loading conditions, respectively;while these parameters were selected to be 25 and 3 pixels,respectively, for the case of dynamic loading. Note that theresolutions of measurements in the current study werecalculated as 20.4 pix/mm and 18.5 pix/mm for quasi-staticand dynamic loading conditions, respectively.
Fig. 6. (a) The stress-strain curves obtained from quasi-static loading of thespecimens, with a high magnification of the initial elastic region shown in(b).
3. Determination of the dynamic stress-stainresponse
In order to study the flow behavior of a material underuniaxial loading, the stress and strains are conventionallyextracted from boundary measurements. In particular, thestress developed within the material is usually calculatedbased on the force measured at the specimen ends; whilestrain is also acquired using the displacement of the spec-imen ends [17]. Such method of analysis is valid as long asthe deformation takes place homogeneously within thematerial. However, in the case of dynamic loading condi-tions, and particularly dynamic loading of low impedancematerials, force equilibrium is belatedly achieved, resultingin substantial error in the calculation of stress-strainresponse, provided that merely the boundary measure-ments are performed [15,17]. To overcome this limitationand improve the accuracy of the measurements, the stress-strain response of the foam specimens in this work isdetermined by accounting for the effect of inertia.
The stress on the specimen at any given time, t, and anylocation z along the length can be calculated as:
s1ðz; tÞ ¼ F1ð0; tÞAðz; tÞ þ
Zx¼z
x¼0
rðx; tÞ v2u1
vt2ðx; tÞdx (1)
where F1(0,t) is the force at any time t, measured by theload cells located at the specimen end. A(z,t) denotes thecross sectional area of the specimen at time t and position z.Note that the subscript “1” denotes the axial direction inthis work. The second part in the right side of Eq. (1) rep-resents the inertia term and can be calculated form theinstantaneous acceleration and density at any given pointin space and time. Due to the fact that polymeric foamspecimens examined in this work are considered to becompressible solids, the effects of material compressibilityand change of mass density during deformation needs to betaken into account. A simple mathematical model is used tocalculate the material's instantaneous density as a functionof its initial density, and the measured full-field straincomponents. The model was proposed based on the prin-ciple of mass conservation and assuming that the density
only varies along the axial direction. The derivation andformulation of the model is out of the scope of this work,and thus only the final mathematical formula is given as[28]:
rðz; tÞ ¼ r0ðexpðε1ðz; tÞÞÞ2yðz;tÞ�1 (2)
here, r0 and ε1 are the initial density and the local axialstrain component, and y is the local effective plastic Pois-son's ratio at position z and time t. Similar mathematicalexpressions to determine the variation of density withdeformation in polymeric foams are currently available inthe literature [29]. However, the basic assumption inexisting mathematical models is that no significant lateralexpansion occurs during plastic deformation, i.e. assumezero Poisson's ratio. However, the full-field measurementsperformed in the present work, as discussed in detail in thefollowing sections, indicated that the foam specimens

B. Koohbor et al. / Polymer Testing 44 (2015) 112e124118
examined exhibit a noticeable lateral expansion whenexposed to both quasi-static and dynamic loading condi-tions. Accordingly, a modified mathematical expressiongiven by Eq. (2), was proposed in the present work whichenables to calculate the density at any given loading stageby taking the magnitude of local plastic Poisson's ratio intoaccount.
The significance of such a simple mathematicalexpression is that the variables ε1 and y can be obtainedfrom the experimental observations throughout the entireduration of the test, as discussed in detail in the followingsections. The local Poisson's ratio in a cylindrical specimencan be calculated as the ratio of the local radial straincomponent to the axial strain, as given in Eq. (3):
yðz; tÞ ¼ �εrðz; tÞεzðz; tÞ (3)
For cubic specimens:
yðz; tÞ ¼ �εxðz; tÞεzðz; tÞ ¼ �εyðz; tÞ
εzðz; tÞ (4)
Fig. 7. The initial and failed specimens with (a) 160 kg/m3, (b) 320 kg/m3 and (c) 6which failure was first detected have been marked.
where x, y and z represent the normal directions of a cubicspecimen, compressed along the z-direction, within a Car-tesian coordinate system.
Noe that setting the value of y as 0.5 results in a changein density equal to zero, i.e. the condition considered to bethe general case in plastic deformation of incompressiblesolids, e.g. metals.
By introducing the instantaneous density equation, thefinal stress equation can be expressed as:
s1ðz; tÞ ¼ F1ð0; tÞAðz; tÞ þ
Zx¼z
x¼0
hr0ðexp½ε1ðx; tÞ�Þ2y�1
i v2u1
vt2ðx; tÞdx
(5)
4. Results and discussion
4.1. Quasi-static deformation and failure response
The quasi-static stress-strain curves obtained for spec-imens of different nominal densities are shown in Fig. 6a. Inall cases, a linear stress-strain response is observed in the
40 kg/m3 initial densities, under quasi-static loading conditions. Regions on

Fig. 9. Variation of transverse strain and normalized density with respect tothe applied axial strain for the specimen with initial density of 320 kg/m3.
Table 2Effective plastic Poisson's ratio, y, and the strain energy calculated for thespecimens of different initial densities subjected to quasi-static loadingconditions.
Initial density (kg/m3) 160 320 640
Effective plastic Poisson's ratio 0.362 0.284 0.377Strain energy (J) 20.1 43.6 88.1
Fig. 8. Evolution of shear strain on the surface of the specimen with 640 kg/m3 initial density. The corresponding axial strain at which each image was taken isshown on the top left corner of each image.
B. Koohbor et al. / Polymer Testing 44 (2015) 112e124 119
initial deformation stage, corresponding to linear elasticbehavior of the specimens at lower compressive loads. Theeffective compressive elastic moduli, E, were also obtainedby fitting the best line to the stress-strain curves prior tothe elastic limits. The effective elastic moduli measured inthis work show a significant sensitivity to the specimendensity, as shown in Fig. 6b.
The elastic deformation is followed by a constantdecrease in the stiffness to reach a plateau. Such plateausare common in foam specimens and correspond to the highenergy absorption characteristics of these materials underquasi-static loading conditions [1,30,31]. A final densifica-tion stage in the quasi-static stress-strain response of allspecimens occurs, being most prominent for the case of320 kg/m3 specimen after 30% strain. At this stage, thestress levels in the 320 kg/m3 specimen slightly rises fromits plateau at 7 MPa to 11.5 MPa at failure after the densi-fication stage.
Different quasi-static mechanical responses observedfor specimens with different nominal densities can beexplained through the differences between their cellstructures. As documented by Gibson and Ashby [1] andMills and Zhu [7], the failure in closed cell foams takes placeas the axially compressed cell walls undergo buckling. Asobserved in the SEM images of the specimens in this work(Fig. 1), the size of cell walls changes remarkably withdensity such that, for instance, a significantly larger amountof solid structure constitutes the cell structure of the640 kg/m3 specimen, compared to significantly thinner cellwalls in the 160 kg/m3 specimen. Such thin sections pre-sent within the material's cell structure make it moresusceptible to micro-buckling in these regions, noticeablylowering the compressive strength of the material.
Failure was observed to take place at multiple shearplanes within the specimens with 320 kg/m3 and 640 kg/m3 initial densities, as shown in Fig. 7. The shear bandfailure mechanism observed for these specimens is verysimilar to those observed in case of solid non-porousstructures. The evolution of shear strain on the surface ofthe 640 kg/m3 density specimen, shown in Fig. 8, supportsthe above statement. For the specimenwith lowest density,on the other hand, no shear band formation was observed.The failure of this specimen occurred followed by crushingof the specimen, with no significant shear strain.
Finally, the effective plastic Poisson's ratio, y, theinstantaneous density and the energy dissipation during
deformation of the specimens in quasi-static conditions aredetermined. Typical variation of the transverse straincomponent and the specimen density vs. axial strain isshown in Fig. 9 for the specimen with initial density of320 kg/m3. Note that, due to the homogeneous distributionof strain in quasi-static loading conditions, the local andglobal average Poisson's ratios in each case were calculatedto obtain very similar values. Therefore, in the quasi-staticloading conditions, only a single value for the effectiveplastic Poisson's ratio, i.e. average value of the parameterover the entire region of interest, was reported for eachspecimen.
Based on the stress-strain curves obtained from quasi-static tests and the instantaneous change of densitycalculated for different specimens, the strain energy
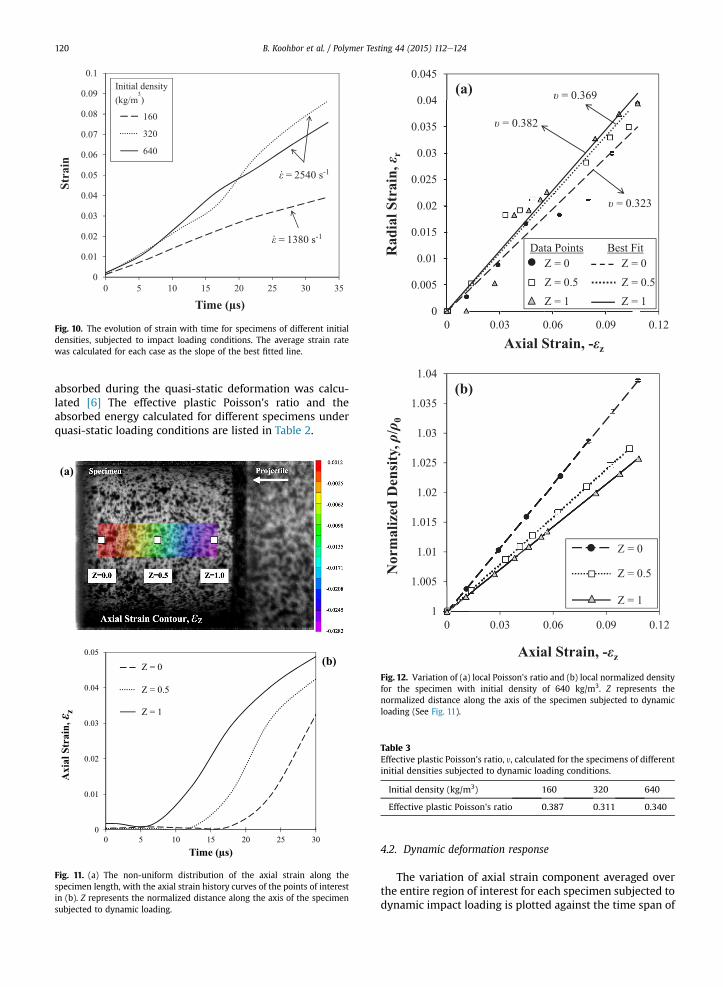
Fig. 10. The evolution of strain with time for specimens of different initialdensities, subjected to impact loading conditions. The average strain ratewas calculated for each case as the slope of the best fitted line.
B. Koohbor et al. / Polymer Testing 44 (2015) 112e124120
absorbed during the quasi-static deformation was calcu-lated [6] The effective plastic Poisson's ratio and theabsorbed energy calculated for different specimens underquasi-static loading conditions are listed in Table 2.
Fig. 11. (a) The non-uniform distribution of the axial strain along thespecimen length, with the axial strain history curves of the points of interestin (b). Z represents the normalized distance along the axis of the specimensubjected to dynamic loading.
Fig. 12. Variation of (a) local Poisson's ratio and (b) local normalized densityfor the specimen with initial density of 640 kg/m3. Z represents thenormalized distance along the axis of the specimen subjected to dynamicloading (See Fig. 11).
Table 3Effective plastic Poisson's ratio, y, calculated for the specimens of differentinitial densities subjected to dynamic loading conditions.
Initial density (kg/m3) 160 320 640
Effective plastic Poisson's ratio 0.387 0.311 0.340
4.2. Dynamic deformation response
The variation of axial strain component averaged overthe entire region of interest for each specimen subjected todynamic impact loading is plotted against the time span of
B. Koohbor et al. / Polymer Testing 44 (2015) 112e124 121
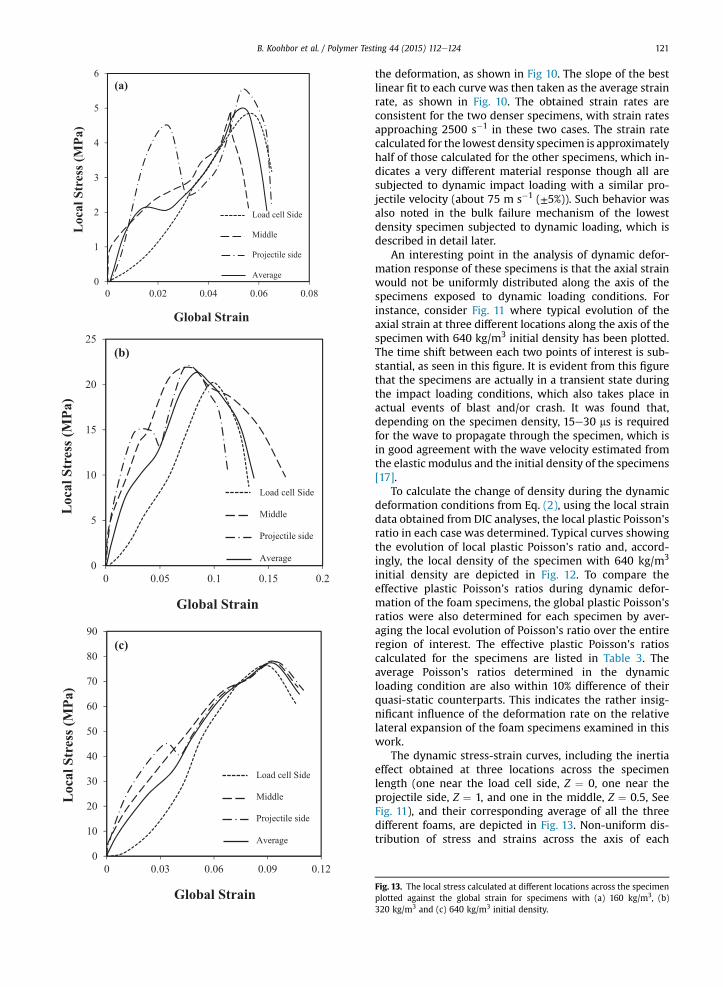
the deformation, as shown in Fig 10. The slope of the bestlinear fit to each curve was then taken as the average strainrate, as shown in Fig. 10. The obtained strain rates areconsistent for the two denser specimens, with strain ratesapproaching 2500 s�1 in these two cases. The strain ratecalculated for the lowest density specimen is approximatelyhalf of those calculated for the other specimens, which in-dicates a very different material response though all aresubjected to dynamic impact loading with a similar pro-jectile velocity (about 75 m s�1 (±5%)). Such behavior wasalso noted in the bulk failure mechanism of the lowestdensity specimen subjected to dynamic loading, which isdescribed in detail later.
An interesting point in the analysis of dynamic defor-mation response of these specimens is that the axial strainwould not be uniformly distributed along the axis of thespecimens exposed to dynamic loading conditions. Forinstance, consider Fig. 11 where typical evolution of theaxial strain at three different locations along the axis of thespecimen with 640 kg/m3 initial density has been plotted.The time shift between each two points of interest is sub-stantial, as seen in this figure. It is evident from this figurethat the specimens are actually in a transient state duringthe impact loading conditions, which also takes place inactual events of blast and/or crash. It was found that,depending on the specimen density, 15e30 ms is requiredfor the wave to propagate through the specimen, which isin good agreement with the wave velocity estimated fromthe elastic modulus and the initial density of the specimens[17].
To calculate the change of density during the dynamicdeformation conditions from Eq. (2), using the local straindata obtained from DIC analyses, the local plastic Poisson'sratio in each case was determined. Typical curves showingthe evolution of local plastic Poisson's ratio and, accord-ingly, the local density of the specimen with 640 kg/m3
initial density are depicted in Fig. 12. To compare theeffective plastic Poisson's ratios during dynamic defor-mation of the foam specimens, the global plastic Poisson'sratios were also determined for each specimen by aver-aging the local evolution of Poisson's ratio over the entireregion of interest. The effective plastic Poisson's ratioscalculated for the specimens are listed in Table 3. Theaverage Poisson's ratios determined in the dynamicloading condition are also within 10% difference of theirquasi-static counterparts. This indicates the rather insig-nificant influence of the deformation rate on the relativelateral expansion of the foam specimens examined in thiswork.
The dynamic stress-strain curves, including the inertiaeffect obtained at three locations across the specimenlength (one near the load cell side, Z ¼ 0, one near theprojectile side, Z ¼ 1, and one in the middle, Z ¼ 0.5, SeeFig. 11), and their corresponding average of all the threedifferent foams, are depicted in Fig. 13. Non-uniform dis-tribution of stress and strains across the axis of each
Fig. 13. The local stress calculated at different locations across the specimenplotted against the global strain for specimens with (a) 160 kg/m3, (b)320 kg/m3 and (c) 640 kg/m3 initial density.

Table 5The strain energy calculated for the specimens of different initial densitiessubjected to dynamic loading conditions.
Initial density (kg/m3) 160 320 640
Strain energy (J) 2.17 23.8 51.1
B. Koohbor et al. / Polymer Testing 44 (2015) 112e124122
specimen observed in each case is attributed to the signif-icant influence of the inertia loads developed [17]. Also, thelevel of heterogeneity of the stress was found to be higherduring the earlier stages of deformation. This observation isin agreement with previously published results, and isinferred to be due to the effect of dynamic non-equilibriumat the earlier moments of deformation [15,17,25].
The comparison of the average stress-strain curves forspecimens of different initial densities are plotted in Fig. 14.Remarkably different behavior is observed between speci-mens of different densities subjected to impact loadingconditions. To make a quantitative comparison betweenthe strength of the foam specimens subjected to quasi-static and dynamic loading conditions, the achieved peakstress values are listed for different specimens in Table 4.An increase in the maximum stress values are observedcomparing the maximum stress levels achieved in quasi-static and dynamic loading conditions. This indicates astronger, yet relatively more brittle material response athigher strain rates. The strain energy absorbed during thedeformation of the foam specimens in dynamic loadingconditions were also calculated using an approach similarto that used for quasi-static loading, by integrating the areaunder the stress-strain curve. The calculated values arelisted in Table 5. Comparing the data shown in Table 5 withthose listed earlier in Table 2, it is indicated that the
Fig. 14. Dynamic stress-strain curves determined for specimens of differentinitial density.
Table 4Variation of peak stress with the initial density for the foam specimenssubjected to quasi-static and dynamic loading conditions.
Initial density (kg/m3) 160 320 640
Peak stress (MPa) Quasi-static 2.6 11.6 30.9Dynamic 5.0 21.3 77.3
decrease in the magnitude of the absorbed strain energy ismost prominent for the lowest density specimen (89%decrease in the absorbed energy). On the other hand, thefoam specimens with 320 kg/m3 and 640 kg/m3 initialdensity exhibit substantially lower decrease in the strainenergy absorbed in dynamic loading conditions (~43%decrease in the magnitude of the absorbed strain energy).
4.3. Dynamic local and bulk failure modes
The bulk failure behavior of the two denser specimens,i.e. specimens with 320 kg/m3 and 640 kg/m3 initial den-sities, was characterized as being associated with the for-mation of multiple shear planes within the specimen, asshown in Fig. 15. The shear planes in highest densityspecimen form at more locations across the specimen axis,indicating that kink band formation is the primary failuremode. On the other hand, for the case of the lowest densityspecimen, no significant shear deformation and failure wasobserved. The dynamic failure of this specimen wasobserved with the specimen being crushed, indicating thatelastic/plastic buckling is the primary failure mode. Thisobservation indicates that as the density of the foam in-creases, the failure mode changes from elastic/plasticbuckling to kink band formation.
The microstructural studies of cellular materials in theliterature also supports the observation made in the cur-rent study. For instance, the study by Vural and Ravichan-dran [32] reveals that failure mode transition in cellularmaterials subjected to compression loading, from elastic/plastic buckling to kink band formation, occurs as thedensity increases. For the case of the lowest density spec-imen examined in this work, its bulk failure response isgoverned by buckling due to the very thin cell walls of thematerial's cellular structure. The thin cell walls are not ableto sustain a large impulse type load and collapse due toelastic/plastic buckling without any significant resistanceto the exerted load. On the other hand, the two denserspecimens, with relatively thicker walls, can tolerate sub-stantially larger applied loads without buckling, and laterfailed by kink band formation. The shear band formation inthe two high density foammaterials is illustrated in Fig. 15.Videos of the deformation and failure of the specimensexposed to dynamic impact loading are available as sup-plementary material.
Supplementary video related to this article can be foundat http://dx.doi.org/10.1016/j.polymertesting.2015.03.016.
5. Conclusions
Deformation and bulk failure mechanisms of closed-cellPMDI foams with different initial densities were studiedusing high speed photography in conjunction with 3D

Fig. 15. The bulk failure mechanism of specimens subjected to direct impact loading for specimens with (a) 160 kg/m3, (b) 320 kg/m3 and (c) 640 kg/m3 initialdensities. Multiple shear planes, in the case of the two denser specimens, were observed as marked with dotted lines.
B. Koohbor et al. / Polymer Testing 44 (2015) 112e124 123
digital image correlation. The effects of change of materialdensity as well as the inertia stresses developed duringhigh strain rate loading of the specimens were included inthe analysis, using the full-field measurements facilitatedby DIC. The foam specimens exhibited substantial strainrate sensitivity in terms of compressibility, stress-strainbehavior and failure response. The effect of inertiastresses were shown to be remarkable in the examinedmaterials, due to their low impedance properties. Theinertia effect was also demonstrated to be more pro-nounced for the case of lower density (with lower elasticmodulus) specimen. The bulk failure mechanism of thespecimen with lowest initial density was also indicated tobe significantly different from the other specimens, both inquasi-static and dynamic loading conditions. The differ-ences observed in deformation and failure response of thefoams examined in this work were explained through thedifferent pore structures of the specimens.
Acknowledgements
Sandia National Laboratories is a multi-program labo-ratory managed and operated by Sandia Corporation, awholly owned subsidiary of Lockheed Martin Corporation,for the U.S. Department of Energy's National Nuclear Se-curity Administration under contract DE-AC04-94AL85000.
References
[1] L.J. Gibson, M.F. Ashby, Cellular Solids: Structure and Properties,second ed., 1997. Oxford.
[2] B. John, C.P.R. Nair, K.A. Devi, K.N. Ninan, Effect of low-density filleron mechanical properties of synthetic foams of cyanate ester, J.Mater. Sci. 42 (14) (2007) 5398.
[3] E. Woldesenbet, N. Gupta, A. Jadhav, Effects of density and strain rateon properties of synthetic foams, J. Mater. Sci. 40 (15) (2005) 4009.
[4] V.R. da Silva, M.A. Mosiewicki, M.I. Yoshida, M.C. da Silva,P.M. Stefani, N.E. Marcovich, Polyurethane foams based on modifiedtung oil and reinforced with rice husk ash II: mechanical charac-terization, Polym. Test 32 (2013) 665.
[5] A. Kidane, On the failure and fracture of polymer foam containingdiscontinuities, ISRN Mater. Sci. 2013 (2013) 1.
[6] S.Mallon, A. Kidane,W.Y. Lu, in: Conference Proceedings of the Societyfor Experimental Mechanics Series, Greenville, SC, 2014, pp. 83e89.
[7] N.J. Mills, H.X. Zhu, The high strain compression of closed-cellpolymer foams, J. Mech. Phys. Solids 47 (1999) 669.
[8] L. Marsavina, E. Linul, T. Voiconi, T. Sadowski, A comparison be-tween dynamic and static fracture toughness of polyurethanefoams, Polym. Test 32 (2013) 673.
[9] W.Y. Lu, M. Nielson, K. Connelly, in: Conference Proceedings of theSociety for Experimental Mechanics Series, Greenville, SC, 2014.
[10] Y. Liu, W. Gong, X. Zhang, Numerical investigation of influences ofporous density and strain rate effect on dynamical response ofaluminum foams, Comp. Mater. Sci. 91 (2014) 223.
[11] T.H Kidd, S. Zhuang, G. Ravichandran. In situ mechanical charac-terization during deformation of PVC polymeric foams using ultra-sonics and digital image correlation. Mech. Mater. 201; 55: 82.
[12] S.K. Samanta, Dynamic deformation of aluminum and copper atelevated temperatures, J. Mech. Phys. Solids 19 (1971) 117.
[13] H. Meng, Q.M. Li, Correlation between the accuracy of a SHPB testand the stress uniformity based on numerical experiments, Int. J.Impact Eng. 28 (2003) 537.

B. Koohbor et al. / Polymer Testing 44 (2015) 112e124124
[14] B. Song, W. Chen, Dynamic stress equilibrium in split Hokinsonpressure bar tests on soft materials, Exp. Mech. 44 (2004) 300.
[15] S. Aloui, R. Othman, A. Poitou, P. Guegan, S. El-Borgi, Non-para-metric identification of non-homogeneous stress in high strain rateuni-axial experiments, Mech. Res. Commun. 35 (2008) 392.
[16] L.M. Yang, V.P.W. Shim, An analysis of stress uniformity in splitHopkinson bar test specimens, Int. J. Impact Eng. 31 (2005) 129.
[17] R. Othman, S. Aloui, A. Poitou, Identification of non-homogeneousstress fields in dynamic experiments with a non-parametricmethod, Polym. Test 29 (2010) 616.
[18] S.S. Sarva, S. Deschanel, M.C. Boyce, W. Chen, Stress-strain behaviorof a polyuria and a polyurethane from low to high strain rates,Polymer 48 (2007) 2208.
[19] E.D.H. Davis, S.C. Hunter, The dynamic compression testing of solidsby method of the split Hopkinson pressure bar, J. Mech. Phys. Solids11 (1963) 155.
[20] S.N. Kukurema, I.M. Hutchings, Yielding of engineering polymers atstrain rates of up to 500 s�1, Int. J. Mech. Sci. 26 (1984) 617.
[21] D.A. Gorham, Specimen inertia in high strain-rate compression, J.Phys. D: Appl. Phys. 22 (1989) 1888.
[22] D.A. Gorham, The effect of specimen dimensions on high strain ratecompression measurements of copper, J. Phys. D: Appl. Phys. 24(1991) 1489.
[23] T.C. Chu, W.F. Ranson, M.A. Sutton, W.H. Peters, Applications ofdigital image correlation techniques to experimental mechanics,Exp. Mech. 25 (1985) 232.
[24] M.A. Sutton, J.J. Orteu, H.W. Schrier, Image Correlation for Shape,Motion and Deformation Measurements, Springer, NY, 2009.
[25] F. Pierron, H. Zhu, C. Siviour, Beyind Hopkinson's bar, Phil. Trans. R.Soc. A 372 (2014) 2013195.
[26] S. Mallon, B. Koohbor, A. Kidane, M.A. Sutton, Fracture behavior ofprestressed composites subjected to shock loading: a DIC-basedstudy, Exp. Mech. 55 (2014) 211.
[27] S. Mallon, B. Koohbor, A. Kidane, in: Conference Proceedings of theSociety for Experimental Mechanics Series, Greenville, SC, 2014, pp.213e219.
[28] B. Koohbor, A. Kidane, We-Yan Lu, in: Conference Proceedings of theSociety for Experimental Mechanics Series, Costa Mesa, CA, 2015. Inpress.
[29] M.W. Schraad, F.H. Harlow, A stochastic constitutive model fordisordered cellular materials: finite-strain uniaxial compression, Int.J. Solids. Struct. 43 (2006) 3542.
[30] M. Avalle, G. Belingardi, R. Montanini, Characterization of polymericstructural foams under compressive impact loading by means ofenergy-absorption diagram, Int. J. Impact Eng. 25 (2001) 455.
[31] L. Cui, S. Kiernan, M. Gilchrist, Designing the energy absorptioncapacity of functionally graded foam materials, Mater. Sci. Eng. A507 (2009) 215.
[32] M. Vural, G. Ravichandran, Microstructural aspects and modeling offailure in naturally occurring porous composites, Mech. Mater. 35(2003) 523.