analysis of the economic efficiency and comparative advantage of
TRANSCRIPT
Analysis of the Economic Efficiency and Comparative Advantage of the
Sumatran Smallholder Rubber Using “PAM” Method
Prayogo U. Hadi, Gelar Setya Budhi
Southeast Asia Policy Research Working Paper, No. 4


Acknowledgement This report is part of the ASB Project in Indonesia. The Asian Development Bank, under RETA 5711, financially supported this specific work.

© Copyright ICRAF Southeast Asia Further information please contact: ICRAF SE-Asia Southeast Asian Regional Research Programme PO Box 161 Bogor 16001 Indonesia Tel: 62 251 625415, fax: 62 251 625416 Email: [email protected] ICRAF Southeast Asia website: http://www.icraf.cgiar.org/sea Cover design: Dwiati N. Rini Illustration design: Wiyono Declaimer This text is a ‘working paper’ reflecting research results obtained in the framework of ICRAF Southeast Asia project. Full responsibility for the contents remains with the authors.

i
Preface
Rubber has important roles in Indonesian economy. However, the use of scarce economic
resources like land, labor and capital for rubber should be on efficiency basis. This report
contains preliminary results of the analysis employing the methods of Policy Analysis Matrix
(PAM). Field data collection was carried out in Bungo Tebo District in Jambi province for ten
days on July 1997. Final report will be completed after discussion of this draft report.
We would like to thank every body supporting the completion of this study, especially the
International Center for Research in Agroforestry (ICRAF) which provides grants to our Center
for Agro Socio Eeconomic Research (CASER) for funding the corresponding study as specified
in research agreement.
Bogor, 24 November 1997
Dr Achmad Suryana
Director of CASER

ii
Table of Contents Page Preface.........................................................……… i Table of Contents .................................................. ii List of Table ........................................................... iii List of Appendix ……………………….……….. ............... ................................... iv 1. Introduction 1.1 The Roles of Rubber in Indonesian Economy ................................ 1 1.2 The Problems ............................... ................................................. I 2 1.3 Objectives ...................................................................................... 3 2. Methodology ...................................................................................... 5 2.1 Site Selection ................................................................................. 5 2.2 Respondents Selection ................................................................... 5 2.3 Method of Analysis ........................................................................ 7 2.4 Price Data Specification ................................................................. 8 3. Government Policies and Programs ................................................. 10 3.1 Smallholder Rubber Development Project ................................................. 10 3.2 Input and Output Price Policies ..................................................... 12 3.3 Processing Policies ........................................................................ 1 3 3.4 Macro Economic Policies .............................................................. 13 4. Brief Description of Production, Marketing and Processing Features .......................................................................... 15 4.1 Production ...................................................................................... 15 4.2 Marketing ....................................................................................... 18 4.3 Processing ...................................................................................... 21 5. PAM Analysis ......................................................................... 25 5.1 Input-Output Quantities ................................................................. 25 5.2 Input and Output Valuation ........................................................... 25 5.3 The Farm Budgets ……………………………………………….. 27 5.4 The PAM Results ........................................................................... 28 6. Conclusion and Suggestions .............................................................. 32 6.1 Conclusion .................................................................................... 32 6.2 Suggestions ................................................................................... 32 References ........................................................... .................................... 34 Appendices ........................................................... .................................... 36

iii
List of Table
Page
Table 1 The area of smallholder rubber in Indonesia and Jambi by type of project in 1995 ................................. 11
Table 2 Yield of smallholder rubber monoculture and agroforest by plant age (kg slab 50% dry
rubber content) ..................................................................... 17 Table 3 Transportation cost of rubber product (slab) from farm to crumb rubber factory, 1997
(Rp/kg) . ............................................................................. 21 Table 4 Farmer's returns and trader's profits by rubber quality in Surolangun Bangko district (Jambi), 1979…………………………………………………………… 23 Table 5 Annual production capacity of crumb rubber
factory in Jambi, 1995 ............................... I ...................... 24 Table 6 Derivation of the farmgate social price of
rubber product (slab), July 1997 ........................................ 27 Table 7 The results of PAM analysis for rubber monoculture
and rubber agroforest ......................................................... 28 Table 8 Ratio indicators of PAM analysis for rubber
monoculture and rubber agroforest .................................... 29 Table 9 Sensitivity analysis of PAM of rubber monoculture
and rubber agroforest ......................................................... 32 Table 10 Sensitivity analysis of the ratio indicators of PAM analysis for rubber monoculture and rubber
agroforest ........................................................................... 32

iv
List of Appendix
............................................................................................... Page
Appendix I Input-output for rubber monoculture farm ........................... 36
Appendix 2 Private prices for rubber monoculture farm.......................... 39
Appendix 3 Social prices for rubber monoculture farm .......................... 42
Appendix 4 Private budget for rubber monoculture farm ........................ 45
Appendix 5 Social budget for rubber monoculture farm.......................... 48
Appendix 6 Input-output for rubber agroforest farm ............................... 51
Appendix 7 Private prices for rubber agroforest farm ............................. 54
Appendix 8 Social prices for rubber agroforest farm .............................. 57
Appendix 9 Private budget for rubber agroforest farm ........................... 60
Appendix 10 Social budget for rubber agroforest farm ............................. 63

1
I Introduction
1.1. The Roles of Rubber in Indonesian Economy
Rubber plays, at least, five important roles in the Indonesian economy that pushes
economic growth through positive backward as well as forward linkages. First, as the income
source of a substantial number of rubber smallholder. Of the national rubber area of 3.50 million
hectares in 1995, 2.95 million hectares (84.5 percent) constituted smallholder rubber, involving
1.47 million farm households (DGE, 1996). In some monoculture areas, rubber farm becomes
the principal source of smallholders' income.
Second, as one of the promising business investment areas by large scale companies such
as state-owned companies (Perseroan Terbatas Perkebunan, PTP), domestic private companies
(Perkebunan Besar Swasta Nasional, PBSN), or foreign private companies (Perkebunan Besar
swasta Asing, PBSA), in addition to smallholders. In 1995, rubber area of PTP, PBSN and PBSA
respectively accounted for 248,393 hectares, 239,850 hectares and 294,824 hectares (DGE,
1996). The total value of rubber investment during the first long term development stage
(1.969-1994) was 2,153 million US dollars, 28.84 percent and 71.16 percent of which were
respectively allocated for large scale companies and smallholders (PT IDU and WHAD, 1996).
Third, as an agro-industrial development corner stone. Traditionally, primary rubber
produce has been the only source of raw material for rubber processing industries to produce
semi-finished goods for export, such as SIR (Standard Indonesian Rubber), RSS (Ribbed
Smoked Sheets), crepe, etc.
2
Fourth, as a foreign exchange generator. The value of rubber export increased from US$
171.75 million in 1969 to US$ 1,964 million in 1995 (DGE, 1996). The estimated annual growth
rate of this export value was 7. 10 percent. In international market, Indonesia currently
constitutes the second largest rubber producer and exporter, following Thailand.
Last, as a market for urban-industrial products and services, either for family
consumption such as processed foods, beverages, clothing, electronics, and other durable, or for
farm cultivation’s like farm tools, equipment and machinery, fertilizers, chemicals, transport
services, etc.
1.2. The Problems
The Indonesian agricultural policies have been focused on the simultaneous achievement
of the following three broad objectives. First, food self sufficiency for food security, especially
rice. Second, efficient use of scarce economic resources, including natural and capital resources,
for sustaining development process and strengthening global market competitiveness. Last,
improved income distribution among income groups or regions.
It is likely, however, that the promotion of one objective conflicts with one or both of the
others others. To a considerable extent, government policies often favor particular parties at the
expense of the others in the use of agricultural and natural resources, in addition to factor market
imperfections. In this situation, policy makers need to trade-off the gains in one objective against
the losses in the other(s). For instance, efficiency losses in the substantial use of land for
smallholder rubber cultivation might not be tolerated if the action could not bring about
significant improvement in food (especially rice) security, income 2
3
distribution and market competitiveness or prevents from more efficient alternative uses of
scarce land.
The essence of policy exercise is, therefore, the decision choice between these competing
objectives. But, to do so is frequently difficult because of various supply constraints in the
Indonesian economy, including, first, the limited availability of domestic resources such as land,
water, labor and capital; second, the non-existence of improved production technologies; and
last, the relatively high costs of all inputs.
To some extents, government policies depart from efficient conditions. The most
prominent examples in the rubber case are the provision of input subsidies and imposition of
tariffs on particular inputs. In addition, market failures might also exist for rubber output and
particular inputs. It is also common that market exchange rates (Rupiah per US dollar) are
over-valued that could weaken the competitiveness of Indonesia-made products like rubber in
the global markets. If such unfavorable conditions are not removed, it is alarmed to endanger the
profitability and comparative advantage of Indonesian rubber, hence the future sustainability of
smallholder rubber farms, when the markets are characterized mainly by global competition. In
this connection, it is necessary to measure the effects of efficient policies on the efficiency and
comparative advantage of Indonesian smallholder rubber farms.
1.3. Objectives
The specific objectives of the present study maybe spelled out as follows
(1) To collect primary as well as secondary data on smallholder rubber farm.
(2) To construct a 25-year farm budget for each representative type of smallholder
rubber farm using both private and social prices.
4
(3) To estimate the economic efficiency and comparative advantage of each
representative type of smallholder rubber farm.
(4) To assess the divergences in revenues and costs under efficient condition from those
under market condition for each representative type of smallholder rubber farm.
2. Methodology
2.1. Site Selection
The selected representative district for this study is Bungo Tebo which is situated in the
territory of the Jambi province. The main reason for this selection is that this province constitutes
the second largest rubber producing areas in Indonesia within which forest lands are currently
rapidly converted into other uses such as rubber and padi ladang (dry land paddy ) through slash
and burn practices, in addition to oil palm plantation and HTI (Hutan Tanaman Industri). The
Bungo Tebo district was also selected as one of the sites of ICRAF's research programmes in
1995-1996.
The selected sub-district (kecamatan) was Tebo Tengah. In this sub-district, two villages
(desa) were chosen, namely Tebing Tinggi and Aburan Batang Tebo that respectively represent
rubber monoculture and rubber agroforest areas.
2.2. Respondents Selection
Farmer :
Respondent of the present study consists of rubber farmers, village assemblers,
wholesalers and crumb rubber factory/exporter and input (fertilizers and pesticides) retailer. For
farmer respondent, in particular, there are two selected types of smallholder rubber farm, namely,
5
rubber monoculture and rubber agroforest. The representative farms for smallholder rubber
monoculture were selected from those receiving government financial assistance through Proyek
Rehabilitasi dan Peremajaan Tanaman Ekspor, PRPTE (Project of Rehabilitation and
Replanting for Export Commodities). The choice of this project is based on the duration of the
project in the sense that it is the oldest rubber project in Jambi province that commenced in 1983.
This can facilitate the analysis of lengthier rubber's life cycle. The representative farms for
smallholder rubber agroforest, on the other hand, were selected from those without government
financial assistance. Farmer respondents are not individual family but group of owner operator of
10-15 persons. Two groups were chosen for each sample village.
Trader :
The selected rubber trader consists of village assemblers and wholesaler. Local
assemblers are persons who collected thick slab from local farmers and then sell it to a large
wholesaler in Muara Bungo town. Two village assemblers were selected in each sample village.
Wholesaler is a company that collects thick slab from local assemblers from various sub-districts
and sells it to crumb-rubber factories. In the present study, a large wholesaler in Muara Bungo
called PT Sinar Jambi was selected as a sample.
Crumb Rubber Factory
One crumb rubber factory called PT Jambi Waras 11 in Bungo Tebo was selected as a
sample. It buys variety slabs from various wholesalers (such as PT Sinar Jambi), processes them
into crumb rubber (SIR-20), and exports this processed product to other countries.

6
Input Retailer
A large input shop in Muara Bungo town was chosen as a sample. It sells various kinds of
fertilizer, pesticide and other agricultural chemical inputs to farmers.

7
2.3. Method of Analysis
This analysis employs the method of "Policy Analysis Matrix" (PAM) for permanent
crop for each type of representative rubber farm. The detailed PAM procedures that entirely
follow those formulated by Monke and Pearson C(1995) may be presented below:
TC
TR TIC DFC Profits
Private A B C D
Social E F G H
Divergence I J K L
TR = total revenue (Rp) TC = total cost (Rp) TIC = tradable input cost (Rp) DFC = domestic factor cost (Rp) A = Σ(QYk. QYk
M) E = Σ(QYk.PYkS) I = A - E
B = Σ (QTli.PTliM) F = Σ (QTli.PTli
S) J = B - F C = Σ (QDFj.PDFj
M) G = Σ (QDFj.PDFjS) K = C - G
D = A - B - C H = E - F - G L = D – H = I - J - K where, V : summation QYk : quantity of output k PYk : price of output k QTli : quantity of tradable input i PTli : price of tradable input i QDFj : quantity of domestic factor j PDFj : price of domestic factor j, k : rubber, rice, chilly i : fertilizer (Urea, TSP, KCI) j : seeds, other materials, labor (family and hired) M : private S : social.

8
2.4. Price Data Specification
a. Output Price :
Thick slab with a:,50 percent dry-rubber-content is the most type of rubber output
produced by farmers. Data on the 1997 average private price of this product at the farm gate
were obtained directly through interviews with the selected farmer groups and local assemblers,
while the 1997 social prices of thick slab at the farm gate, were derived using equations as
follows :
PFYr = [PFOB.SER - (Cm + Cf)]/drc –Cr
SER = OER(I + ERP)
Where:
PFyr = social price of thick slab at the farmgate (Rp/kg)
PFOB. = FOB price of SIR-20 (US$/kg)
SER = social exchange rate (Rp/US$)
OER = official exchange rate (Rp/US$)
ERp = exchange rate premium (10 %)
Cm = marketing cost from SIR-20 factory to ship (Rp/kg)
Cf = processing cost of SIR-20 (Rp/kg)
Drc = dry rubber content of thick slab (50 %)
Cr = transport cost from farm to SIR-20 factory
b. Input Price :
Farm inputs consist of : (i) tradable inputs including only fertilizers (Urea, TSP,KC1),
and (ii) domestic factors including unskilled labor and capital. Tradable inputs were used by
rubber monoculture only, while domestic factors were used by both rubber monoculture and

9
rubber agroforest. Private price data on tradable inputs, particularly fertilizers, were gathered
directly through interviews with a large-scale input retailer in Muara Bungo town, while data on
private price of domestic factors were collected through interviews with the selected farmer
groups and local leaders.
The social price of exported input like Urea is specified using similar procedures for
social pricing of output, while for imported inputs such as TSP and KC1 follows the following
procedures :
c. Output Data
The principal output of rubber farm is thick slab (slab tebal). It is the primary rubber
product with approximately 50 percent dry rubber content. In addition, there were other outputs,
such as dry land paddy and other annual crops as intercrops cultivated during year 1-3 of' rubber
life cycle.
The salvage value of rubber wood is assumed away in this study. In fact, farmers
Have never sold their rubber wood because doing so is not beneficial as a result of : (i) low
rubber stand density per hectare; (ii) very small proportion of commercial rubber tree; (iii)
appreciably high labor and transportation costs; and (iv) unavailability of rubber wood
factory in the study sites.

10
3. Government Policies and Programs
3.1. Smallholder Rubber Development Project
Development of smallholder rubber through project assistance was initiated in the second
Five-Year Development Plan (REPELITA II). The principal development aims had been to
increase rubber productivity, farmers' income and foreign exchange.
Currently, there are five rubber development projects involving smallholders (DGE,
1996). First, plasma (plasma), that is, smallholder rubber plantations established and developed
by Estate or Private Companies incorporated into Pola Perkebunan Inti Rakyat, PIR (Nucleus
Estate and Smallholder, NES). The proportion of plasma and nucleus areas had been
standardized at 70 and 30 percent respectively.
Second, Proyek Rehabilitasi, Peremajaan dan Perluasan Tanaman Ekspor, PRPTE
(Project of Rehabilitation and Replanting for Export Commodities). This project was financed
by government using domestic public funds, commencing in 1979/1980.
Third, Unit Pelayanan Pengembangan Berbantuan (Assisted Development Service
Unit). This project has been financed by loan from foreign aids. For rubber, it included three
important projects, namely Smallholder Rubber Development Project (SRDP), latter developing
into Tree Crops Smallholder Development Project (TCSDP) and Tree Crops Smallholder Sector
Project (TCSSP).
Fourth, partial project. In this project, which is financed by government using domestic
public funds, farmers received assistance in the forms of clones, or other material inputs like
fertilizers, or plant maintenance costs. Farmers have no obligation to repay this assistance
because it is not a loan.
11
Lastly, swadaya berbantuan (assisted self-funded smallholder project). This project is financed
by government using domestic public funds for year 0 only, for which farmers do not. have to
repay. In year I and so forth, farmers receive loan from Bank/Rubber Company.
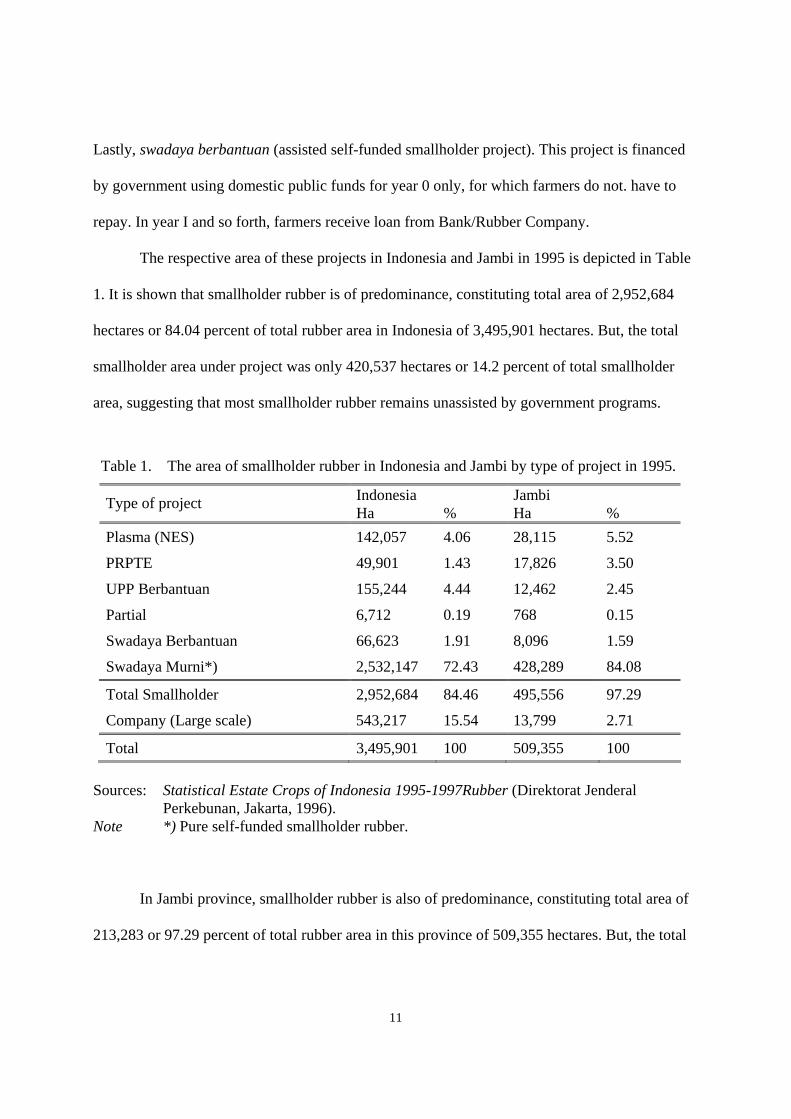
The respective area of these projects in Indonesia and Jambi in 1995 is depicted in Table
1. It is shown that smallholder rubber is of predominance, constituting total area of 2,952,684
hectares or 84.04 percent of total rubber area in Indonesia of 3,495,901 hectares. But, the total
smallholder area under project was only 420,537 hectares or 14.2 percent of total smallholder
area, suggesting that most smallholder rubber remains unassisted by government programs.
Table 1. The area of smallholder rubber in Indonesia and Jambi by type of project in 1995.
Indonesia Jambi Type of project Ha % Ha % Plasma (NES) 142,057 4.06 28,115 5.52
PRPTE 49,901 1.43 17,826 3.50
UPP Berbantuan 155,244 4.44 12,462 2.45
Partial 6,712 0.19 768 0.15
Swadaya Berbantuan 66,623 1.91 8,096 1.59
Swadaya Murni*) 2,532,147 72.43 428,289 84.08
Total Smallholder 2,952,684 84.46 495,556 97.29
Company (Large scale) 543,217 15.54 13,799 2.71
Total 3,495,901 100 509,355 100 Sources: Statistical Estate Crops of Indonesia 1995-1997Rubber (Direktorat Jenderal Perkebunan, Jakarta, 1996). Note *) Pure self-funded smallholder rubber. In Jambi province, smallholder rubber is also of predominance, constituting total area of
213,283 or 97.29 percent of total rubber area in this province of 509,355 hectares. But, the total

12
smallholder area under project was also small, namely 67,267 hectares or 13.6 percent of total
smallholder area. This also suggests that most smallholder rubber remains unassisted by
government programs. By excluding plasma rubber, PRPTE becomes the major smallholder
project involving rubber area of 17,826 hectares that constituted 26.7 percent of total smallholder
project area in this province.
3.2. Input and Output Price Policies
Price policies cover input and output. Subsidies were provided for Urea, ZA, TSP and
KCI that was initially aimed at encouraging rice production to achieve rice self sufficiency.
Crops other than rice, off course, benefit this subsidy policy. Since the achievement of rice self
sufficiency in 1984, however, subsidies for fertilizers have gradually decreased so as to reduce
government's financial burden. In 1997, subsidy is provided only for Urea and the respective
maximum retail prices (MRP) of fertilizers according to government regulation for Urea and
TSP have been Rp 400 and Rp 600 per kg, while the MRP of KCI has been no longer specified
(Hadi et al, 1997). In fact, the prices of Urea, TSP and KCI at the farm level were Rp 410, Rp
610 and Rp 490 per kg respectively.
Output price is not directly intervened by government. Rubber price is simultaneously
determined by supply and demand equilibrium in the world market. The government policy is
only aimed at preventing farmers from receiving low price of their rubber produce. It was
specified that the minimum farmgate price of rubber (100 % dry rubber content) is 70-80 percent
of the prevailing FOB price of SIR-20 equivalent.
3.3. Processing Policies

13
The development of rubber agribusiness still encounters processing problems. The tires
industry as the major natural rubber consumer (72 percent) tends to move to an automatization
system which definitely requires raw material with high quality consistencies and contamination
free. To meet this tight requirements so as to maintain the market share of Indonesian natural
rubber in the world market, the government had specified the following related policies (FPP,
1994).
First, to specify the standardized quality of rubber raw material according to the
Indonesian Agricultural Standard through the Decree of Minister of Agriculture number
701/Kpts/Ap 830/10/1987 that was revised by the Decree of Minister of Agriculture number
250/Kpts/TP.830/5/1989. According to the decree, the recommended rubber raw materials are
field latex, air-dried sheet, thin slab and fresh lumps.
Second, to specify Changes in Standard Indonesian Rubber Schemes (SIR)88 through the
Decree of Minister of Trade number 184/14/VI/1988. The core of the decree was the need for
removing low quality SIR and improve technical specification requirements of SIR with the aims
of improving SIR consistencies and purities so as to meet consumer demand and improve
farmers' income through quality improvement of raw material.
3.4. Macro Economic Policies
The macro economic policies which are relevant to smallholder rubber development are
interest rate and exchange rate policies. The annual interest rate of loan for farmers was specified
at 12 percent, but currently it has changed to 14-16 percent. It is a subsidized credit aimed at
promoting smallholder rubber to involve in development project without any harmful financial
burden for credit repayment.

14
Exchange rates have been managed by Central Bank authority using floating exchange
rate system. It is obvious that the official (market) exchange rates of Rupiah per US dollar
gradually increases from year to year. In July 1997, when data collection of this study was taking
place, the official exchange rate was Rp 2,430 per US dollar. In most developing countries, such
as Indonesia, exchange rates tend to be overvalued. According to ICRAF expert, the
overvaluation rate was approximately 10 percent. Since August 1997, the evidence shows that
monetary crises has been taking place, where the exchange rates goes up and down but never
reached below Rp 3,400.

15
4. Brief Description of Production, Marketing and Proeessing Features 4.1. Production
Production activities commence with land preparation including shrub cutting (menebas),
felling (menebang), sundrying, chopping, burning, and reburning (merun). Land clearing
generally uses traditional tools like parang (big knife), and beliung (big axe),while richer
farmers and project farmers use chainsaw either by purchase or rent. Both project and
non-project farmers usually cleared forest land for agricultural cultivation. Not many farmers
cleared their old rubber land, primarily because of their unwillingness to loose daily cash income
from tapping their old rubber trees.
Dibbling and planting activities of rubber and rice then proceed following land
preparation. During the first year, all farmers irrespective rubber monoculture or rubber
agroforest, grow dryland rice (padi ladang). Weeding and wild pig trapping were also done by
farmers. Husked dried rice (gabah kering) produce was stored as staple food stock for a couple
of month and only few farmers sold husked rice for immediate cash requirement. During second
and third year, farmers grew chilly as cash income source.
The principal material inputs used by farmers for pre-harvest rubber cultivation is seeds
of rubber, rice and chilly. Non-project (self-funded) farmers use local rubber seeds collected
from their existing rubber lands, while project farmers use clones called GT 1. Lack of
information on the comparative advantages of clones, physical unavailability and cash
constraints of non-project farmers have been the major reasons for not using clones (see also
Yusdja et al 1980; Hadi, Manurung and Purnama 1996; Barlow 1997 cited by Grist, Menz and
Amarasinghe, 1997). Project farmers, on the other hand, received seeds from the project.
16
Fertilizers were the other material inputs, but only project farmers used fertilizers. In the
case of PRPTE farmers under study, fertilizers like Urea, TSP and KCI were used in the first
year of rubber plant cycle, primarily because of inappropriate project management. Normally,
fertilizers should be used from year 0 to year 5.
During the first-five years, farmers replaced damaged trees with the new ones so as to
maintain reasonable population density of rubber stands. Afterwards, rubber replacement had no
longer taken place. According to farmers, it is not necessary because the new plants would not be
able to compete with the existing bigger and taller growing plants for soil nutrition and sunlight.
Consequently, plant density continuously decreased. The principal causes of plant damage have
been root diseases and heavy rain accompanied by typhoon.
Harvest (tapping) activities commenced when rubber plants reached 6 years old for
clonal rubber and 9 years old for non-clonal rubber. This was preceded by tapping preparation
like fixing latex cups and spout on every mature rubber plants. Other tools required for tapping
activities include tapping knife, latex bucket, slab moulder and grind ston. In average, tapping
days for project and non-project rubber were 216 and 195 days a year respectively. The higher
tapping frequency of project rubber was probably due to the obligation of project farmers to
repay their credit (principal and interest) commencing in year 6.
Small owner-operator farmers tapped their rubber by their own family members like
wife or sons. Large farmers, on the other hand, hired labors adopting a share-cropping system.
In the share-cropping system, land owner received one-third of the total output. Cup-lumps
together with other rubber output forms were mixed in wood boxes with common size in
thickness, width and length.
17
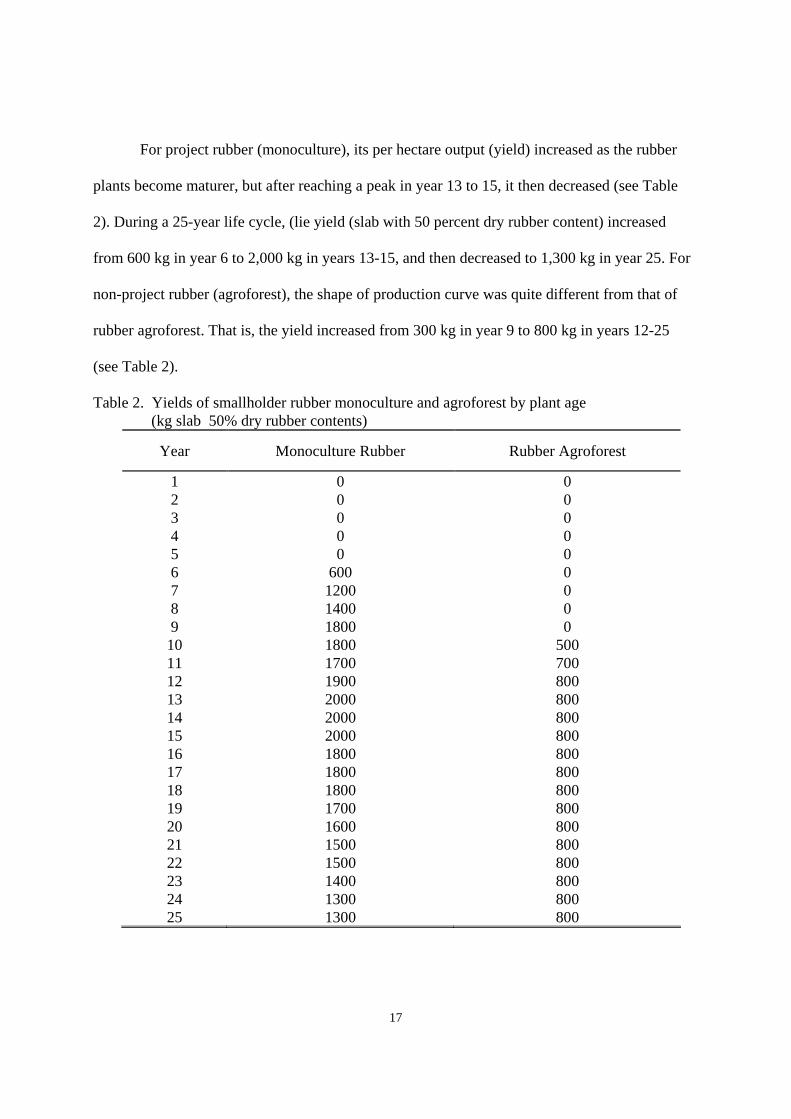
For project rubber (monoculture), its per hectare output (yield) increased as the rubber
plants become maturer, but after reaching a peak in year 13 to 15, it then decreased (see Table
2). During a 25-year life cycle, (lie yield (slab with 50 percent dry rubber content) increased
from 600 kg in year 6 to 2,000 kg in years 13-15, and then decreased to 1,300 kg in year 25. For
non-project rubber (agroforest), the shape of production curve was quite different from that of
rubber agroforest. That is, the yield increased from 300 kg in year 9 to 800 kg in years 12-25
(see Table 2).
Table 2. Yields of smallholder rubber monoculture and agroforest by plant age (kg slab 50% dry rubber contents)
Year Monoculture Rubber Rubber Agroforest
1 0 0 2 0 0 3 0 0 4 0 0 5 0 0 6 600 0 7 1200 0 8 1400 0 9 1800 0
10 1800 500 11 1700 700 12 1900 800 13 2000 800 14 2000 800 15 2000 800 16 1800 800 17 1800 800 18 1800 800 19 1700 800 20 1600 800 21 1500 800 22 1500 800 23 1400 800 24 1300 800 25 1300 800

18
4.2. Marketing
Marketing channel was very short. Farmers sold their thick slab to village assemblers
only. Village assemblers usually sold slab to large scale wholesaler in Muara Bungo town (PT
Sinar Jambi) and with smaller proportion to crumb rubber factory in Bungo Tebo. The
wholesaler in Muara Bungo, sold slab to crumb rubber factory in Bungo Tebo (PT Jambi Waras
11) or in Jambi city. Crumb rubber factory which is also rubber exporter, then exported SIR-20
to various countries. In addition to PT Jambi Waras 11 in Bungo Tebo, there were four other
crumb rubber factories/exporters, all of which are located in Jambi city.
Rubber transaction activities include price discovery and buying-selling processes.
Output prices were entirely dictated by traders for two reasons. First, the market structure is
always oligopsonistic competition. Second, farmers have a high dependence on traders because
they always borrow cash money or buy consumption goods with deferred payments using rubber
produce. The total value of these borrowings often exceeded the gross value of farmers' rubber
produce.
To obtain rubber from farmers, rubber wholesaler in Muara Bungo town provided
capital money to village assemblers who also own large rubber land or serve as local informal
leaders. Crumb rubber factories usually also provided capital money to wholesalers in the rubber
producing areas.
The prevailing average price of thick slab with approximately 50 percent dry-rubber-
content at the farmgate in July 1997 was Rp 750 per kg. This price was equivalent with Rp 1,500
per kg slab with 100 percent dry-rubber-content. In comparison with the FOB price on the same
month of Rp 2,850 per kg (i.e., US$ 1.172 x Rp 2,430/US$), the farmgate price may be said as

19
low accounting only 52,7 percent of FOB price (i.e., [1,500/2,859] x 100%). According to DGE,
it was targeted that the farmgate price would not be lower than 70-80 percent of the FOB price
for equivalent rubber quality.
This low farmers' share was because village assemblers cut the weight of rubber produce
they bought from farmers by 20 percent for two reasons. First, it is basically adjustment practices
of assemblers so as to compensate the possible weight losses due to reduced water content of
slab and decreased output quality because of the existence of non-rubber materials contained in
the slab. It is noted that there was no exact measurement of dirt and water contents using tools
that made no linear relationships between quality and price (see also Hendiarto and Muslim,
1995). Second, small farmers, generally bought basic consumption goods like rice, sugar, etc by
delayed payment from consumption goods traders who are also village assemblers who bought
farmers' slab. Such a payment system made the slab price lower and consumption good price
higher.
However, it is worth to note that the farmgate prices would change as the FOB price
change. The price of SIR-20 at FOB level may be referred in the determination of the buying
price of slab at the farmgate. The FOB price was transmitted by crumb rubber factories, which
were also SIR-20 exporters, to rubber (slab) wholesalers and eventually to farmers. In
determining the buying price of slab, the respective marketing channels like crumb rubber
factories, slab wholesalers and village slab assemblers accounted for the expenses for
transportation, rubber weight loss, etc., and minimum profit gains.
With such price transmission process, the information about changes in FOB price was
received first by traders, whereas farmers just accepted the price determined by traders. Farmers

20
are often late in receiving price information when the price went up, but quicker when the price
went down. This contributed to weak farmers' bargaining position.
Price changes in international market may be due to changes in supply and demand. But
changes in domestic price (farmgate price) could be caused by changes in both international
price in US dollar and the exchange rates of rupiah per US dollar. Even keeping FOB price
unchanged, increase in exchange rates would drive the domestic price to the higher levels. It is
likely that changes in FOB prices are transmitted into domestic market with a range of price in
ration.
For instance, when the FOB price of SIR-20 on July was US$ 1.172 per kg and the
official exchange rate was Rp 2,430 per US$, the prevailing farmgate price of rubber product
with 100 percent dry rubber content was Rp 1,500 per kg and the farmers share of FOB price
was estimated at approximately 52,7 percent. Other things being equal, it could be expected that
changes in official exchange rate into Rp 3,400, the farmgate price would move to higher level,
the change of which would be proportional with this change in exchange rate.
The transport costs from farm to crumb rubber factory were Rp 50 per kg slab for both
rubber monoculture and rubber agroforest (Table 3). The marketing costs of SIR-20 from
factory to ship for export (including transportation, port handling, etc) were estimated at Rp
53,482 per ton.

21
Table 3. Transportation cost of rubber product (slab) from farm to crumb rubber factory, 1997 (Rp/kg slab).
Transportation chain Monoculture (Tebing Tinggi)
Agroforest (Aburan Batang
Tebo) 1. F'rom farm to local assembler's house 10 10 2. From local assembler to wholesaler') 20 20 3. From wholesaler to factory2) 20 20
Total 50 50 Notes : 1) PT Sinar Jambi in Muara Bungo. 2) 2) PT Jambi Waras 11, km 50 from Muara Bungo.
4.3. Processing
At the farm level, processing activities were very simple, the output of which was thick
slab with low quality. The thick slab was characterized by its high content of nonrubber
materials like water, bark and gravel resulting in high output impurities, wide quality range and
bad smell. This practice was aimed at increasing gross weight of output. Non-project farmers did
not coagulate latex with recommended coagulant like formic acid (asam semut) but other
materials such as battery acid, fertilizer (TSP) and gadung (a kind of tubers). Project farmers, on
the other hand, used the recommended coagulant provided by the PRPTE project, though for the
first year of harvest only. At the same time, village assemblers also argued that since farmers
added non-rubber materials making the quality of slab very low, they cut the weight of rubber
they bought from farmers by 20 percent. At the trader level, either village assemblers or
wholesalers, no additional slab treatments were done.
Even though rubber development has been taking place for almost 30 years, farmers
generally remain to produce low quality rubber and unwilling to improve processing paractices.
According to farmers, these improper processing practices stemmed from the following

22
unresolved structural problems. First, the absence of output price increase that sufficiently
compensated additional costs and time spent by farmers to produce higher level of output quality
(higher dry rubber content and lower impurities). In output price discovery, traders considered
only quantity and not quality of output. This pricing behavior of traders also emanated from
crumb rubber factory behavior that depressed the price of rubber product purchased from traders.
Hendiarto and Muslim (1995)'s study in Kapuas district (Central Kalimantan) shows that
the farmgate of slab was Rp 940 per kg and to produce 1 kg smoked sheet, a 5 kg slab was
required. The farmgate value of this total weight of unprocessed slab was Rp 4.700, while the
farmgate price of smoked sheet was only Rp 3.000 per kg. Obviously, to produce 1 kg smoked
sheet, farmers lost Rp 1.700, in addition to labor costs and time. Such a case was also true for
other rubber producing areas. Yusdja et al (1980) study in Sarolangun Bangko (Jambi province)
depicts that the lower the rubber quality, the lower per kg farmgate price and trader's profit
margin, but the higher the total farner's return and trader profits (Table 4).
Second, crumb rubber factories was able to produce TSR (technically specified rubber).
This technology used since 1969, enables to appropriately remove the non-rubber materials
contained in the slabs. The blending system can mix the clean raw material with higher quality
of raw material such as smoked sheets or thin slab produced by estate companies so as to
produce standard export quality product as required by importing countries. This does not make
low quality raw material any problems for crumb rubber factories to produce particular quality
products. This rapid changes in the processing of TSR have been discouraging farmers to
produce higher rubber quality.

23
Tabel 4. Farmer' returns and trader' profits by rubber quality in Sarolangun Bangko district (Jambi), 1979.
Farmers Traders Bokar’s Quality* Bahan
(kg) Hasil (kg)
Harga (Rp/kg)
Nilai (Rp)
Untung (Rp/kg)
Nilai (Rp)
Thin slab 20 8 220 1.760 12,96 103,68 Thick slab 20 16 180 2.880 7,83 125,28 Ojol 20 20 160 3.200 6,56 131,20
Source : Yusdja et at (1980). Notes : * Thin slab (unsmoked sheet) is the highest quality, while ojol is the lowest one.
Third, the actual output quantity of crumb rubber factories is less than the available
capacity. This is an underutilization problem that causes tight competitions in raw material
procurements. This forces crumb rubber factories to collect raw material of any quality so as to
meet the full capacity requirement of the factories for reducing inefficiencies.
Fourth, the quantity of output produced by farmers was small stemming from small land
ownership that discouraged processing activities. In addition, the unfavorable economic
condition of farmers forced them to seek daily cash incomes.
At the factory level, thick slab and other rubber raw materials are processed using
automatic and more sophisticated machines. In Jambi province, there were five crumb rubber
factories with total annual production capacity of 147,000 tons of SIR-20 per (Table 5).
According to the production manager of PT Jambi Waras II (the sample of crumb rubber
factory in the present study), the processing steps in sequential orders include chopping,
washing, pressing and grinding, air drying, cutting, electrical drying, sample testing, packing and
labeling. The rubber product of this factory is only SIR-20 for export. The processing cost of
SIR-20 was estimated at Rp 147,056 per ton, including variable and fixed costs

24
Table 5. Annual production capacity of crumb rubber factory in Jambi, 1995.
Company name Location Capacity (ton SIR-20) PTJambi Waras I Jambi city 36,000 PTJambi Waras II Bungo Tebo 36,000 PT Remco Jambi city 24,000 PT Batang Hari T. Jambi city 25,000 P'I'Angkasa Raya Jambi city 14,000 Total 147,000
Source : DGE (1996).
.
25
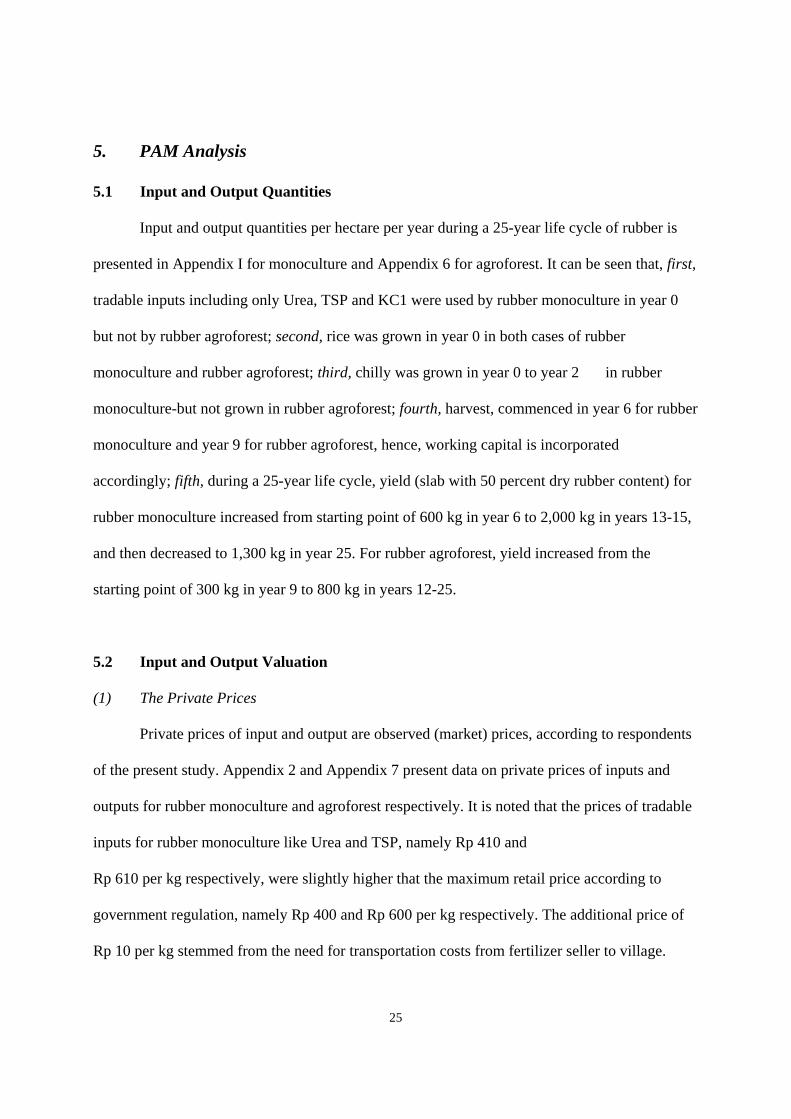
5. PAM Analysis
5.1 Input and Output Quantities
Input and output quantities per hectare per year during a 25-year life cycle of rubber is
presented in Appendix I for monoculture and Appendix 6 for agroforest. It can be seen that, first,
tradable inputs including only Urea, TSP and KC1 were used by rubber monoculture in year 0
but not by rubber agroforest; second, rice was grown in year 0 in both cases of rubber
monoculture and rubber agroforest; third, chilly was grown in year 0 to year 2 in rubber
monoculture-but not grown in rubber agroforest; fourth, harvest, commenced in year 6 for rubber
monoculture and year 9 for rubber agroforest, hence, working capital is incorporated
accordingly; fifth, during a 25-year life cycle, yield (slab with 50 percent dry rubber content) for
rubber monoculture increased from starting point of 600 kg in year 6 to 2,000 kg in years 13-15,
and then decreased to 1,300 kg in year 25. For rubber agroforest, yield increased from the
starting point of 300 kg in year 9 to 800 kg in years 12-25.
5.2 Input and Output Valuation
(1) The Private Prices
Private prices of input and output are observed (market) prices, according to respondents
of the present study. Appendix 2 and Appendix 7 present data on private prices of inputs and
outputs for rubber monoculture and agroforest respectively. It is noted that the prices of tradable
inputs for rubber monoculture like Urea and TSP, namely Rp 410 and
Rp 610 per kg respectively, were slightly higher that the maximum retail price according to
government regulation, namely Rp 400 and Rp 600 per kg respectively. The additional price of
Rp 10 per kg stemmed from the need for transportation costs from fertilizer seller to village.

26
Working capital is accounted since the first year of productive period of rubber plants,
namely year 6 for rubber monoculture and year 9 for rubber agroforest. The annual private
interest rate of working capital is specified at 20 percent.
(2) The Social Prices
The farmgate social prices of output, namely slab with 50 percent dry rubber content, and
tradable inputs (Urea, TSP, KCI) were calculated using equation specified in Chapter 2. The
results for output social price is presented in Table 6 showing that the farmgate social price of
output both in the cases of rubber monoculture and rubber agroforest was
Rp 1,416,109 per ton or Rp 1,416 per kg.
The social prices data are presented in Appendix 3 and Appendix 8 respectively for
rubber monoculture and rubber agroforest. It can seen that labor wage rate s were similar across
activities and across farm type (monoculture or agroforest), namely Rp 5,000 per man-day
(equals regional minimum wage rate regulation), and the price of chopping knife was higher in
the rubber monoculture case than in the rubber agroforest case. The social interest rate of
working capital is specified at 15 percent per annum

27
Table 6. Derivation of the farmgate social price of rubber product (slab), July 1997.
Description Value/ton
a. FOB price of SIR-20 (US$/ton) 1,172b. Market exchange rate (Rp/US$) 2,400c. Exchange rate premium = 10% x b (Rp/US$) 243d. Social exchange rate = b + c (Rp/US$) 2,673e FOB price of SIR-20 in Rupiah/ton = a x d 3,132,756f. Processing cost of SIR-20 (Rp/ton)') 147,056g. Marketing cost of SIR-20 from factory to
ship (Rp/ton)2) 53,482
h. FOB price of SIR-20 at factory ~ e-f-g (Rp/ton) 2,932,218i. FOB price of slab at factory = 50% x h (Rp/ton) 1,466,109j. Transportation cost from farm to factory (Rp/ton2)
j1. Tebing Tinggi (rubber monoculture) j2. Aburan Batang Tebo (rubber agroforest)
50,000 50,000
k. FOB price of slab at farmgate (Rp/ton) k1. Tebing Tinggi (ijl) k2. Aburan Batang Tebo (i-j2)
1,416,109 1,416,109
Notes : 1) See Table 3; 2) See Chapter 4.
5.3 The Farm Budgets
The private farm budgets for a 25-year life cycle of rubber are depicted in Appendix 5
and Appendix 9 respectively for rubber monoculture and rubber agroforest, while the
corresponding social budgets are presented in Appendix 5 and Appendix 10. It is seen that the
values of NPV were negative in most years in the case of rubber agroforest both in tenns of
private and social prices. In the case of rubber monoculture, the values of NPV for private price
were also negative in most years, but positive for social prices.
5.4 Results
The PAM tables for rubber monoculture and rubber agroforest are presented in
Table 7. In addition, the ratio indicators are shown in Table 8. These PAM results may be
interpreted as follows.
28
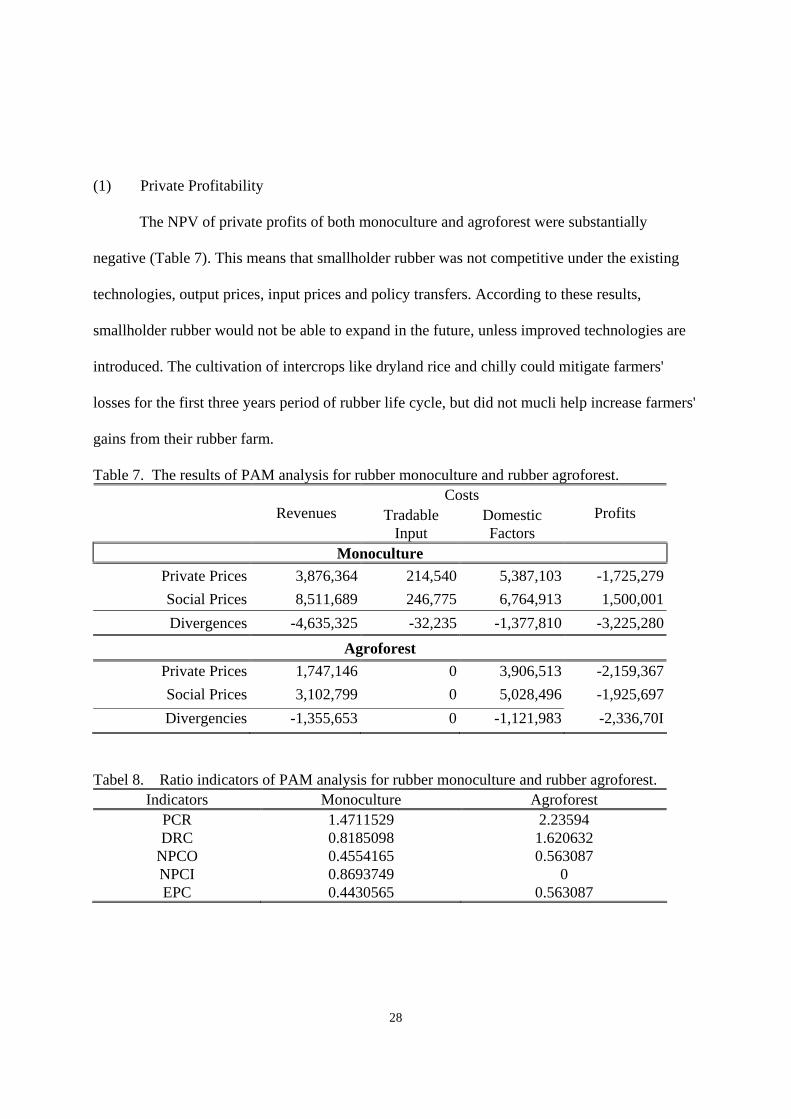
(1) Private Profitability
The NPV of private profits of both monoculture and agroforest were substantially
negative (Table 7). This means that smallholder rubber was not competitive under the existing
technologies, output prices, input prices and policy transfers. According to these results,
smallholder rubber would not be able to expand in the future, unless improved technologies are
introduced. The cultivation of intercrops like dryland rice and chilly could mitigate farmers'
losses for the first three years period of rubber life cycle, but did not mucli help increase farmers'
gains from their rubber farm.
Table 7. The results of PAM analysis for rubber monoculture and rubber agroforest. Costs
Revenues Tradable Input
Domestic Factors
Profits
Monoculture Private Prices 3,876,364 214,540 5,387,103 -1,725,279Social Prices 8,511,689 246,775 6,764,913 1,500,001Divergences -4,635,325 -32,235 -1,377,810 -3,225,280
Agroforest Private Prices 1,747,146 0 3,906,513 -2,159,367Social Prices 3,102,799 0 5,028,496 -1,925,697Divergencies -1,355,653 0 -1,121,983 -2,336,70I
Tabel 8. Ratio indicators of PAM analysis for rubber monoculture and rubber agroforest. Indicators Monoculture Agroforest
PCR 1.4711529 2.23594 DRC 0.8185098 1.620632
NPCO 0.4554165 0.563087 NPCI 0.8693749 0 EPC 0.4430565 0.563087

29
From Table 8 it is seen that values of PCR (private cost ratio) for rubber monoculture and
rubber agroforest were much higher than 1, especially rubber agroforest. This also suggests that
the value added of the existing system could not afford its domestic factor costs.
(2) Social Profitability
The NPV of social profits of rubber agroforest was also remarkably negative, but
substantially positive for rubber monoculture (Table 7). This suggests that smallholder rubber
agroforest had no comparative advantage under the existing technologies and efficient policies
and the system could not survive without assistance from the government. Such system wasted
scarce resources by producing at social costs that exceeded the costs of importing. In contrast,
smallholder rubber monoculture had the reverse situation. It had high comparative advantage
under the existing technologies and efficient policies. The system could survive without
assistance from the government. Accordingly, smallholder rubber monoculture could be able to
compete in the world market, while smallholder rubber agroforest could not.
From Table 8 it is seen that values of DRC (domestic resource cost ratio) for rubber
monoculture was less than 1, while for rubber agroforest was much higher than 1. These tell us
that the value added of the existing system could afford the domestic factor costs. Producing
rubber domestically was more efficient in the use of scarce resource in comparison with
importing it.
(3) Policy Transfer
The value of output (revenues) transfer was negative for both rubber monoculture and
rubber agroforest (Table 7) and the NPCO of these systems was 0.455 and 0.563 respectively

30
(Table 8). These suggest the existence of substantial output transfer from farmers to the
economy. Apparently, it stemmed from two things, namely, failures in domestic market of output
(as mentioned earlier) and overvalued in official exchange rates. Monoculture farmer and
agroforest farmers actually respectively received only 45.5 and 56.3 percent of the efficient
(FOB) price.
The value of tradable input transfer was negative for rubber monoculture and zero for
rubber agroforest (Table 7) and the NPCI of these systems was 0.870 and nil respectively (Table
8). These suggest the existence of 13 percent government subsidies on tradable inputs, namely
Urea, TSP and KCI, to monoculture farmers, but not to agroforest farmers. In fact, only
monoculture farmers used these tradable inputs.
The EPC values of 0.443 and 0.563 respectively for rubber monoculture and rubber
agroforest show that the transfers of output and tradable inputs was significant. Output transfer
from farmers to the economy was much higher than the input transfer from the economy to
farmers.
The net transfer was negative in both rubber monoculture and rubber agroforest, but
rubber monoculture provided much higher transfer than in rubber agroforest. This was caused by
the higher output quantity in rubber monoculture in comparison with that in rubber agroforest.
(4) Sensitivity Analysis
For this analysis purposes, only official exchange rates (OFR) are changed, namely from
Rp 2,430 to Rp 3,400 per US dollar. Considering the transmission process of price at FOB
level to farmgate level, it is assumed that the farmgate price changed proportionally with
changes in OFR. It was estimated that the farrngate private price with this new exchange rates
31
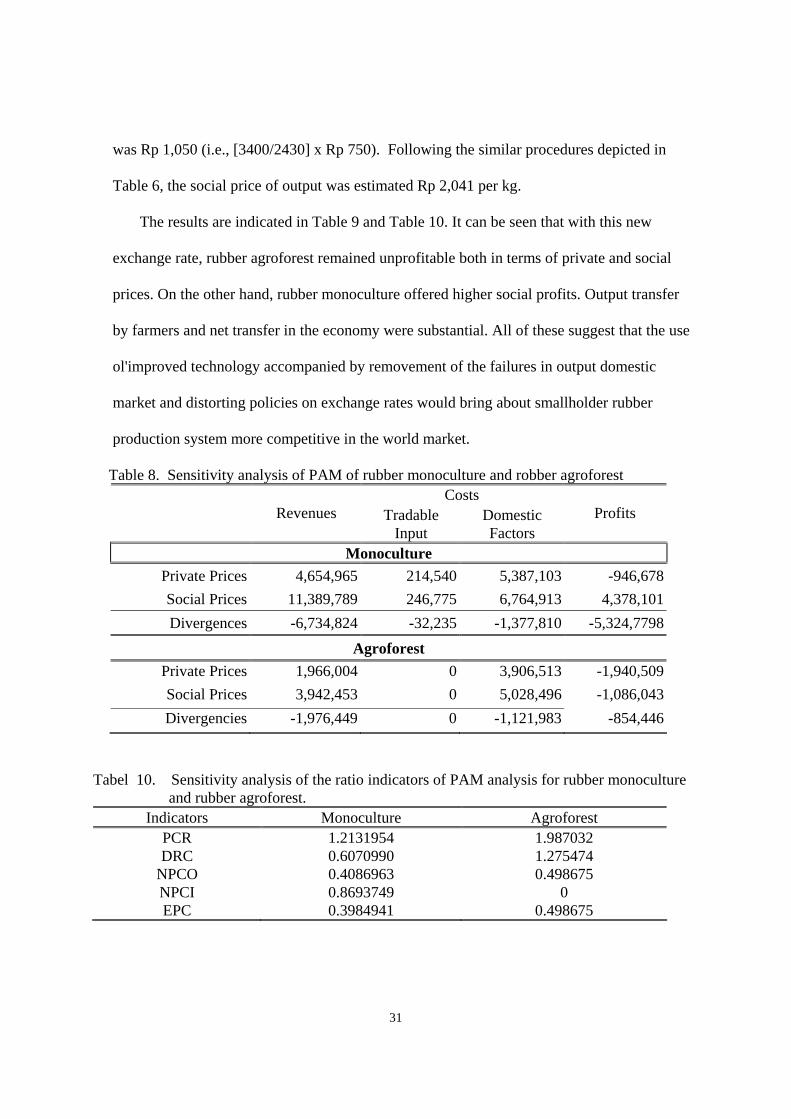
was Rp 1,050 (i.e., [3400/2430] x Rp 750). Following the similar procedures depicted in
Table 6, the social price of output was estimated Rp 2,041 per kg.
The results are indicated in Table 9 and Table 10. It can be seen that with this new
exchange rate, rubber agroforest remained unprofitable both in terms of private and social
prices. On the other hand, rubber monoculture offered higher social profits. Output transfer
by farmers and net transfer in the economy were substantial. All of these suggest that the use
ol'improved technology accompanied by removement of the failures in output domestic
market and distorting policies on exchange rates would bring about smallholder rubber
production system more competitive in the world market.
Table 8. Sensitivity analysis of PAM of rubber monoculture and robber agroforest Costs
Revenues Tradable Input
Domestic Factors
Profits
Monoculture Private Prices 4,654,965 214,540 5,387,103 -946,678Social Prices 11,389,789 246,775 6,764,913 4,378,101Divergences -6,734,824 -32,235 -1,377,810 -5,324,7798
Agroforest Private Prices 1,966,004 0 3,906,513 -1,940,509Social Prices 3,942,453 0 5,028,496 -1,086,043Divergencies -1,976,449 0 -1,121,983 -854,446
Tabel 10. Sensitivity analysis of the ratio indicators of PAM analysis for rubber monoculture and rubber agroforest.
Indicators Monoculture Agroforest PCR 1.2131954 1.987032 DRC 0.6070990 1.275474
NPCO 0.4086963 0.498675 NPCI 0.8693749 0 EPC 0.3984941 0.498675

32
6. Conclusion and Suggestions
6.1. Conclusion
Smallholder rubber farm with intercroping, both monoculture and agroforest, was not
competitive under the existing technologies, output prices, input prices and policy transfers.
These were primarily because of two factors : (i) farmers received output price much less than
the efficient price, indicating the existence of market failures of output; and (ii) overvalued
official exchange rates.
Under the efficient policies, smallholder rubber agroforest remained to suffer from
substantial losses, indicating that the system did not have comparative advantage in the world
market, and land use was highly economically inefficient. On the other hand, smallholder rubber
monoculture system was highly economically efficent.
6.2. Suggestions
For improving the economic efficiency and the comparative advantage of smallholder rubber, the
present study offers the following suggestions. First, introduction of improved technology,
especially clonal seeds t farmers so as to increase yield level of rubber plants. This is
accompanied by extension programmes and provision of clonal seeds to farmers. Second,
improvement in the output marketing system by provision of price information, transparent
quality determination related to output farmgate price discovery, improvement of transportation
facilities, etc. Third, shift from over valuation to the true values of exchange rates. Last, deeper
and thorougher research on marketing and processing systems of smallholder rubber.
33
References
CBS (various issues), International Trade Statistics Export - Volume I, Central Bureau of Statistics, Jakarta.
DGE, (1994), Rencana Pembangunan Lima Tahun Keenam Subsektor Perkebunan 1994119,95 -
199811999, Direktorat Jenderal Perkebunan, Departemen Pertanian, Jakarta. DGE (1995), Statistical Estate Crops of Indonesia 1994-1996 : Rubber, Directorate General of
Estate Crop, Jakarta. Gittinger, JP. (1982), Economic Analysis ofAgricultural Projects, 2nd edn., EDI Series in
Economic Development, UI Press-John Hopkins, London, Jakarta. Hadi, PU., Hendiarto and Sudana, IW. (1997), Laporan Penelitian Analisis Kemampuan Petani
Membeli Pupuk, Kerjasama antara PT Petrokimia Gresik (Persero) dengan Pusat Penelitian Sosial Ekonomi Pertanian.
Hadi, PU., Manurung, VT. dan Purnama, B. (1995), Laporan Penelitian Karakterisasi Sosial
Ekonomi Sistem Pertanian Tebang Bakar di Tiga Zone Ekologi di Sumatera, Kerjasama antara International Commission for Research in Agroforestry dengan Pusat Penelitian Sosial Ekonomi Pertanian, Badan Penelitian dan Pengembangan Pertanian.
Hadi, PU. (1996), 'Analisis usahatani dan dampak deregulasi perdagangan kasus kedelai di Jawa
Timur', Prosiding Seminar Nasional Dinamika Sumberdaya dan Pengembangan Sistem Usaha Pertanian, Cisarua, Bogor, 25-26 September 1996 (akan terbit).
Hartley, MJ., Nerlove, M. and Peters Jr, RK. (1987), 'An analysis of rubber supply in Sri Lanka',
American Journal of Agricultural Economics 69(4) 755-61. Hendiarto dan Muslim, C. (1995), Socio-Economic Benchmark Survey for the Upland Farmers
Development Project (UFDP) : Propinsi Kalimantan Tengah Buku II, Kerjasama antara Proyek Usahatani Lahan Kering dengan Pusat Penelitian Sosial Ekonomi Pertanian.
Jierwiriyapant, P. and Hadi, PU. (1992), 'Soybean and competing crops in Chiang Mai province,
Thailand : the application of the Policy Analysis Matrix', in Jierwiriyapant, et al (eds.), Local Soybean Economies and Government Policies in Thailand and Indonesia, CGPRT No. 27, The CGPRT Centre, pp. 1-76.
MADECOR dan CAER (1989), Socio-Economic Study of the NES Projects, Mandala
Agricultural Development Corporation in association with Center for Agro-Economic Research.
Monke, EA. and Pearson, SR. 19095 The Policy Analysis Matrix for Agricultural Development,
Cornell University Press, Ithaca and London.

34
PT IDU and WHAD (1996), Study on Monitoring the Impact of Policy Changes and Investment in the Tree Crops Sector - Indonesia, A collaborative research between PT Indeco Duta Utama (Indonesia) and Winrock International Institute for Agricultural Development (USA).
Saputro, T., Fadjar, U., Supriono, A., Dereinda, R. dan Darjatmo, B. (1996), Loporan Penelitian
Pengkajian Pengembangan Pold Kemitraan Agribisnis Perkebunan, Pusat Pengkajiaii dan Pengembangan Agribisnis, Badan Penelitian dan Pengembangan Pertanian.
Simatupang, P., Rivai, RS., Arifin, M. dan Azahari. A. (1987), Pola Produksi dan Penyerapan
Tenaga Kerja & PIR-Perkebunan Karet : Studi Kasus di NES I Talang Jaya, Sumatera Selatan, Pusat Penelitian Sosial Ekonomi Pertanian, Badan Penelitian dan Pengembangan Pertanian.
Sumana dan Muharminto (1995), Pengkajian Pengembangan Agribisnis Perkebunan Buku II :
Upaya Pengembangan Pasar Produk Agroindustri Perkebunan (Komo&ti Karet Jenis RSS), Pusat Penelitian Sosial Ekonomi Pertanian, Badan Penelitian dan Pengembangan Pertanian.
Yusdja, Y., Limbong, WH., Manurung V. dan Hadimuslihat, AS. (1980), Telaahan Sistem
Komoditi Karet Rakyat Nasional, Pusat Penelitian Agro Ekonomi, Badan Penelitian dan Pengembangan Pertanian.
W O R L D A G R O F O R E S T R Y C E N T R E ( I C R A F )
S O U T H E A S T A S I A R E G I O N A L O F F I C E W O R K I N G P A P E R S
Funded by theAsian Development Bank
RETA 5711