analysis of the fiscal strategy document 2013-2017
TRANSCRIPT

100
Analysis of the Fiscal Strategy Document 2013-2017 Report by the Portuguese Public Finance Council
No. 3/2013
May 2013
The Portuguese Public Finance Council was set up by the Budget Framework Law (Law no. 22/2001 of 20 August, with the wording given by Law no. 22/2011 of 20 May) and its Statutes were approved by Law no. 54/2011 of 19 October. The Council’s mission is to conduct an independent assessment of the consistency, compliance with the stated objectives and the sustainability of public finances, while promoting fiscal transparency, so as to contribute to the quality of democracy and of political economic decisions and so strenghten the State’s financial credibility.
Note: The preliminary Portuguese version of this publication was made available on 24th May 2013.

Available in: www.cfp.pt
Analysis of the Fiscal Strategy Document 2013-2017
Report by the Portuguese Public Finance Council
No. 3/2013
Lisbon, May 2013

List of abbreviations
Abbreviation Description
AMECO Annual Macro-Economic Database of the European Commission BoP Bank of Portugal BFL Budget Framework Law CFP Portuguese Public Finance Council DEFP Primary Deficit EC European Commission ECB European Central Bank EDP Excessive Deficit Procedure EFAP Economic and Financial Assistance Programme EFSF European Financial Stability Facility EFSM European Financial Stabilisation Mechanism EMU European and Monetary Union ESA European System of Accounts EU European Union FSD Fiscal Strategy Document GDP Gross Domestic Product GFCF Gross Fixed Capital Formation IGCP Portuguese Treasury and Debt Management Agency IMF International Monetary Fund INE National Statistics Institute M€ Million euros MoU Memorandum of Understanding MTO Medium Term Objective OECD Organisation for Economic Co-operation and Development PFB Primary Fiscal Balance SB State Budget TUP Port use Tax WEO World Economic Outlook
iv | Analysis of the Fiscal Strategy Document 2013-2017 Portuguese Public Finance Council

Table of contents
PURPOSES OF THE REPORT ........................................................................................... 7
1 OVERVIEW AND CONCLUSIONS ............................................................................ 8
2 BUDGET OUTTURN IN 2012 .................................................................................. 13
3 PUBLIC FINANCE SUSTAINABILITY ...................................................................... 15
3.1 SUMMARY ............................................................................................................................................... 15 3.2 CHANGE IN PUBLIC DEBT ....................................................................................................................... 15 3.3 DEBT SUSTAINABILITY ............................................................................................................................. 17
3.3.1 In the short- and medium-term .......................................................................................... 17 3.3.2 In the long-term ........................................................................................................................ 19
4 MACROECONOMIC SCENARIO ............................................................................. 24
4.1 SUMMARY ............................................................................................................................................... 24 4.2 MACROECONOMIC SCENARIO ANALYSIS ............................................................................................. 24
5 FISCAL FORECASTS ................................................................................................ 31
5.1 SUMMARY ............................................................................................................................................... 31 5.2 FISCAL BALANCES ................................................................................................................................... 31 5.3 BREAKDOWN OF FISCAL ADJUSTMENT EFFORTS ................................................................................. 34 5.4 COMPARISON WITH FSD/2012 ........................................................................................................... 36
REFERENCES .................................................................................................................. 41
Portuguese Public Finance Council Analysis of the Fiscal Strategy Document 2013-2017 | v

Charts
Chart 1 – Public debt (% GDP) .............................................................................................................................................................8
Chart 2 – Variations of GDP vs unemployment rate and domestic demand ...................................................................9
Chart 3 – Change in public debt and successive forecasts published in fiscal planning documents ................ 16
Chart 4 – Change in debt in the absence of additional fiscal consolidation measures (% GDP) ......................... 19
Chart 5 – Sensitivity analysis: long term debt change scenarios ....................................................................................... 21
Chart 6 – Primary fiscal balance (% GDP) .................................................................................................................................... 22
Chart 7 – Change in the IMF forecasts for the Portuguese economy and the Euro Area ....................................... 25
Chart 8 – Contributions to real GDP growth (p.p.)................................................................................................................... 27
Chart 9 – Change in GDP components ......................................................................................................................................... 29
Chart 10 – Change in market share (real rate of change, %) ............................................................................................... 30
Chart 11 – GDP growth and unemployment rate..................................................................................................................... 30
Chart 12 – Fiscal balances (% of GDP) ........................................................................................................................................... 33
Chart 13 – Fiscal consolidation effort in structural terms - Cumulative composition of structural adjustment
implicit in FSD 2013-17 ....................................................................................................................................................................... 34
Chart 14 – Composition of the structural adjustment estimated in FSD/2013 and FSD/2012 (non-cumulative
annual figures) ......................................................................................................................................................................................... 37
Chart 15 – Change in structural deficit underlying the medium-term strategies - Convergence to the medium-
term objective (MTO) as % of GDP................................................................................................................................................. 38
Tables
Table 1 - Redemption of direct State debt (M€) ...................................................................................................................... 17
Table 2 - Simulation of the public debt ratio in 2017 for different combinations of primary fiscal balance and
nominal growth (% GDP) .................................................................................................................................................................... 18
Table 3 – Macroeconomic forecasts for the Portuguese economy .................................................................................. 26
Table 4 – Budget indicators ............................................................................................................................................................... 32
Table 5 – Change in adjusted budget aggregates (2012-2017)......................................................................................... 35
Table 6 – Changes in the composition of the fiscal adjustment required to meet the excessive deficit
correction target and the medium-term objective (MTO) ................................................................................................... 39
vi | Analysis of the Fiscal Strategy Document 2013-2017 Portuguese Public Finance Council

PURPOSES OF THE REPORT
This Report springs from the Portuguese Public Finance Council’s (CFP) statutory duty to produce reports, preceding debates in Parliament, on: a) The Stability and Growth Programme and other procedures within the European regulatory framework of the Stability and Growth Pact; b) The Multi-Annual Budgetary Framework Planning (article 7). These reports form part of the tasks entrusted to the Council which include (article 6):
a) to assess the macroeconomic evolution scenarios adopted by the Government and the consistency of fiscal forecasts with them;
b) to assess compliance with the fiscal rules in force;
c) to evaluate the public debt dynamics and its sustainability;
…
h) to monitor the budget outturn.
Finally, the CFP’s Senior Board is required to assess the previous year’s budget outturn and the proposals set out in the Stability and Growth Program — article 17 (1-a).
Portuguese Public Finance Council Analysis of the Fiscal Strategy Document 2013-2017 | 7

1 OVERVIEW AND CONCLUSIONS
In the evaluation of the Portuguese Public Finance Council (CFP), summarized in Chapter 2 of this report and developed in its Report No. 2/2013, Analysis of the general government national accounts in 2012, the budget execution in 2012 made a significant contribution to the desired reduction of the structural budget deficit. Nevertheless, both the level of public debt and the great vulnerability of the Portuguese economy to fiscal consolidation measures continue to testify to the economy’s structural weaknesses, whose correction remains a priority.
Hence the importance of the Fiscal Strategy Document (FSD/2013), which is analysed in chapters 3-5 of this report. This document was adopted by the Government in the end of April, and replaces the annual update to the Stability Programme for as long as the Economic and Financial Adjustment Programme, sponsored by the European Union, the European Central Bank and the International Monetary Fund (IMF), is in place. The analysis of the proposals contained in the Stability Programme is part of the CFP remit.
Debt sustainability at the forefront of fiscal priorities
In its Introduction, the Fiscal Strategy Document (FSD) places debt sustainability at the forefront of fiscal policy priorities. Its analysis clearly documents that, whatever the chosen path, the return to sustainability requires a significant and durable effort, and that the effort required rises sharply with any attempt at postponing it. The CFP considers this approach appropriate in light of the growing debt burden weighing on the Portuguese economy. The CFP recognizes that the Portuguese economy must achieve a higher trend rate of economic growth. Higher trend growth, however, is not a matter of stimulating aggregate demand with traditional policies that, given the high level of debt, lack effectiveness and risk to end in increasingly severe and frequent debt crises that increase uncertainty and discourage investment. For this reason, we favour compliance with a structural budget balance target that supports stable growth and improves income distribution between generations. Policies directed at these objectives should aim at raising trend growth by protecting productive capital expenditures in government spending, reducing the tax burden on factor incomes, and implementing reforms that create an investment-friendly environment.
These are relevant considerations given that, for a long time, public debt sustainability was not considered a priority in Portugal, and a fiscal framework that incorporated such concern was only recently adopted. Starting in the 1970s from a low level of debt, low public expenditure and a young population, this seemed a distant concern. On joining the European Union and later the single currency, initially faster economic growth, the proceeds from privatisations, easier credit conditions and innovative financial tools (like Public-Private-
Chart 1 – Public debt (% GDP)
Source: European Commission, Database AMECO, May 2013.
0
20
40
60
80
100
120
140
8 | Analysis of the Fiscal Strategy Document 2013-2017 Portuguese Public Finance Council

Partnerships) allowed the country to maintain, until the beginning of the millennium, a debt ratio that appeared consistent with the European norm (introduced in 1992 in the Maastricht Treaty).
In the meantime, however, population had aged and productivity virtually stagnated. This meant that the country’s economic potential became at risk at the same time as the burden
of social expenditures – mainly on health care and pensions – began to surge. Until the international financial crisis erupted, efforts were made to bring the fiscal deficit under the Excessive Deficit Procedure limit of 3 percent of GDP. This result was virtually achieved in 2007, but the combination of a less expansionary fiscal policy and loss of competitiveness had brought about a perceptible decline in growth and employment, as well as an increase in the debt ratio. In the unfavourable international environ-ment that ensued, Portugal found
itself without the fiscal space and the economic and institutional basis needed to accompany other developed countries’ effort in adopting a countercyclical economic policy while keeping the confidence of investors.
The return to economic growth now depends on a set of conditions, starting with the return to a fiscal responsibility path. This remains a necessary step towards recovering market confidence, itself a condition for pursuing an independent economic policy, within an international environment to which a small open economy must adapt if it is to lessen its risks and benefit from its opportunities. It also requires a number of institutional and structural reforms whose implementation has started and whose results will be the faster the more consistent they are with a policy of fiscal responsibility.
Omission of fiscal strategy to achieve the necessary primary surpluses
The FSD recognizes these premises and argues that it will be necessary for the Portuguese government to achieve significant primary budget surpluses for a long period of time in order to regain sustainability. Apart from that, however, it falls short of spelling out the fiscal strategy that should serve to deliver those surpluses. A simple sustainability exercise of the type presented in the FSD document, further expanded in this CFP Report, shows the dimension of the problem and illustrates the need for a fiscal strategy that brings about a stable primary surplus. However, a sustainability exercise by itself is not a strategy and very little is said in the FSD about the projected development of government spending and revenues over time. This makes it difficult to evaluate the longer-term consequences of the government’s policies and to build a consensus around them.
Chart 2 – Variations of GDP vs unemployment rate and domestic demand
Source: International Monetary Fund, WEO Database, April 2013.
-10
-5
0
5
10
15
20
GDP Unemployment rate Domestic demand
Portuguese Public Finance Council Analysis of the Fiscal Strategy Document 2013-2017 | 9

Moreover, the FSD does not integrate an analysis of the expected effect of major economic policy measures the Government envisages for the programming period, such as those contained in the Strategy for Growth, Employment and Industrial Development 2013-2020, released by the Government on 23 April. Given the close link between the budget constraint and the economy’s prospects, as the FSD’s risk analysis clearly underlines, it would be useful to find in the FSD a first analytical attempt at combining fiscal consolidation measures with growth inducing measures in the medium run.
Along the same lines, the medium-term macro-fiscal projections presented in the FSD are insufficiently documented to serve as a credible substitute for policy analysis. Numerical projections are always fallible and even more so in an uncertain environment. Their main use is to show what the government expects to achieve from well-defined policies and goals. If these are not spelled out, the forecasts become essentially mechanistic exercises that do not help in evaluating and monitoring policies. An important progress was made in this update of the FSD concerning the evaluation of the risks involved in the projections. A problem remains, however, with respect to how they were taken into account in the projection results. The FSD risk analysis seems to advise that a considerable degree of prudence should be incorporated in those results and the associated policy goals. It is not clear, however, that this has been the case.
Prudent projections are particularly important when looking at the medium run in times of deep policy and structural change. Structural measures needed to bring about a higher trend growth rate often take time to produce results and can have a negative impact on real GDP in the short run. Ignoring this and concentrating on the short run for as long as debt proved financeable was part of the strategies that brought the country to the present crisis. But simply mentioning structural measures, mainly in the form of legal adjustments, without spelling out their economic foundations, the implementation schedule and the expected results, makes the strategy difficult to evaluate and detracts from its credibility.
Further reforms to the budget process are required
Several elements are needed to complement this exercise, starting with the creation of a fiscal framework that clearly identifies the aims and constraints of budgetary policy. A first step in this direction consisted in the transposition into national legislation of the principles set in the European architecture. This was accomplished by the Parliamentary approval of the Decree No. 139/XII containing the 7th amendment to the Budget Framework Law (BFL). As mentioned in the Opinion of the Portuguese Public Finance Council concerning the proposal for this amendment, “up to now and despite introducing the rules defined by the European architecture, the Budget Framework Law failed to incorporate into national principles, procedures and practices the provisions required to ensure compliance.” The Government’s Report on the State Budget for 2013 stated the intention to develop a project on “Creating an institutional basis for public finance sustainability” that should lead to an in-depth revision of the Portuguese fiscal framework and is expected to be completed by the end of 2013. This intention is reiterated in the FSD and, in the CFP’s opinion, remains an essential step towards making the efforts to regain sustainability effective. There are also important progresses to be made on finance laws of specific subsectors and the CFP has recently proposed how to
10 | Analysis of the Fiscal Strategy Document 2013-2017 Portuguese Public Finance Council

improve behavioural incentives with respect to fiscal sustainability at the local and regional levels.1
But changing the laws is just a first step towards building an effective framework. In the opinion of the CFP, further improvement in expenditure management is also necessary. Regular spending reviews, together with end-year flexibility in spending, should be envisaged in order to provide those managing public services with the stability to plan their operations on a sensible time scale, while allowing the better prioritisation of expenditures, monitoring the compliance with a long-term and transparent regime for managing public spending and judging the success of policies by their outcomes rather than resource inputs.
Need for further progress in fiscal transparency
A parallel priority needs to be given to gathering, processing and making public in a transparent way the information necessary to support a new approach to policy-making and evaluation. The quality and timeliness of statistics improved enormously in Portugal, mainly as a result of adopting European standards. But much still remains to be done. In the area of public sector data collection and transparency, the need for a definition and effective implementation of accounting standards valid across all public sector levels and entities has been recognized for decades but is still far from completed, leading to a lack of appropriate and timely information. Lack of consistency in accounting and statistical criteria – concerning, for example, the use of cash-basis versus accrual data, or the inclusiveness of the public sector – as well as the use of temporary measures as a stop gap method to comply with fiscal targets, aggravate the problem, even for the purpose of evaluating short-term objectives.
When looking at the medium-term and even more when producing sustainability exercises, these problems gain acuity since changes to the starting point of the exercise, to the definition of the relevant variables or to the policy measures intended to bring about the desired results can make a significant difference with respect to what is achieved. Lack of accuracy and transparency of the data jeopardises the quality and credibility of policy decisions and detracts from the possibility to create the consensus necessary to the implementation of the strategy that the sustainability exercise advocates.
In the case of the FSD, these problems are acutely felt. The choice of 2017 as the starting year of the exercise that illustrates the path of debt consolidation is a case in point. The macroeconomic scenario that leads to the results retained for 2017 is supported by the short-term forecast for 2013-14 and a number of assumptions for the following years, when the economic recovery is expected to be consolidated. However, as explained in section 4.1 of the present Report, neither these assumptions nor the projections for 2013-14 provide a sufficiently solid basis for the expected recovery.
Reinforcing the insufficient transparency of the scenario is the fact that, with respect to the measures required along the period 2013-2017 to bring about the desired outcomes, the FSD only mentions the size of the adjustment needed in order for Portugal to comply with the European rules. Even for 2013, there still remains a degree of uncertainty since a new set
1 Report No. 2/2012, “Principles for Revising Subnational Public Finance Laws”, and Report No. 1/2013, “Analysis of the Legal Proposals for New Subnational Finance Laws”.
Portuguese Public Finance Council Analysis of the Fiscal Strategy Document 2013-2017 | 11

of measures will be needed to replace those rejected by the Constitutional Court. Although a preliminary list has been made public, the final measures will be part of a revised budget, yet to be presented to Parliament. Beyond that, the FSD only mentions the correction to the budget balance needed in 2014 (1.7 p.p. of GDP), 2015 (0.4 p.p.) and 2016 (0.7 p.p.) in order to open the way to comply with European commitments of a structural deficit improvement of at least 0.5 p.p. of GDP in 2016 and 2017).
The document correctly stresses that most of the structural deficit adjustment required in the context of the Economic and Financial Assistance Program has already been achieved (namely a correction of 6.2 p.p. of GDP between 2010 and 2012, for a total of approximately 10 p.p. required in the EFAP and according to the criteria defined therein). However, this does not replace an explicit strategy, either for the medium-term envisaged in the FSD, or for the sustainability effort the need for which the FSD also stresses.
Need for a sustainability oriented management of economic policy
Given the shock to people’s expectations that was the consequence of the budget crisis and the need for an international assistance program, both the Portuguese and the international investors need reassurance concerning the fact that economic and public finance management entered a new course. The commitment to European rules, though necessary, is not sufficient if not rooted in a fiscal framework that is consistent with those rules and an economic policy framework that promotes growth of a small open economy in a rapidly changing and increasingly demanding international environment. In the near future the improvement made in these areas must be consolidated and further progress needs to be made. Policy transparency is a condition for progress to be understood as such.
12 | Analysis of the Fiscal Strategy Document 2013-2017 Portuguese Public Finance Council

2 BUDGET OUTTURN IN 2012
On 29th April last, the CFP published Report No. 2/2013 - Analysis of the General Government Account 2012 - which provides a detailed analysis of the budget outturn (national accounts) in the previous year. The Senior Board assessment is based on that Report and it draws attention to the matters listed below.
1. A first general point we wish to address that applies not only to 2012 has to do with the continued and intensive use of temporary and one-off measures, in addition to what the CFP Report classifies as special factors, which tends to reduce the information the overall fiscal balance can give on the consolidation efforts undertaken. Such use makes it increasingly difficult for the general public to understand the extent to which fiscal goals were achieved, hindering social consensus on correction efforts and deflating investor confidence.
In fact, looking at the effect of such measures in headline terms it would appear that no fiscal adjustment was made in 2012, since the 10,596 million euros (6.4% of GDP) deficit was 2 p.p. of GDP higher than in 2011. However, the 2011 deficit benefitted from a sizeable pension fund transfer (3.5% of GDP), as well as other factors. Whereas the 2012 deficit was exacerbated by the reclassification of capital transactions previously recorded as financial operations and by other one-off factors. Adjusting for these effects the 2012 deficit would have been 9,806 M€, equal to 5.9% of GDP. Thus, in 2012 the fiscal balance improved by 1.3 p.p. of GDP (2,505 M€) compared to the figure for 2011. Correcting for the impact of the business cycle, the structural balance2 net of special factors is estimated to have improved by 2 p.p. of GDP (2.4 p.p. of GDP in the case of the primary structural balance net of special factors).
2. The second general point relates to the continued optimism underlying the macro-fiscal forecasts, which leads to additional measures throughout the year in order to meet the targets set. In 2012 this optimism was focused mainly on the GDP deflator, employment and tax revenue forecasts. It is true that such forecasts involve uncertainty and technical difficulties that cannot be ignored, but for this very reason a greater degree of prudence is required when setting targets, so as to avoid both constant changes in policy and resorting to one-off measures the impact of which was discussed in the previous paragraph.
3. Emphasis should be given to the sharp fall in primary expenditure in adjusted terms, due to the nominal decrease in all expenditure items, in particular the fall in compensation of employees. Over half of the correction took place in the final quarter.
2 Which is the overall fiscal balance minus the business cycle component and the temporary and one-off measures. The primary structural balance also excludes interest charges. For the reasons explained in Report No. 2/2013, the CFP’s analysis also excludes special factors.
Portuguese Public Finance Council Analysis of the Fiscal Strategy Document 2013-2017 | 13

4. By subsectors, reference should be made to the positive contribution made by regional and local governments to the fiscal deficit correction, while at the same time the budgetary position of social security funds deteriorated sharply, due to the increase in pension outlays and the economic slowdown, which had an effect on both the sector’s revenues and expenses, reflecting the impact of the automatic stabilisers (unemployment benefits in particular), despite the measures taken to reduce their impact.
5. Compared to the forecasts in the fiscal planning documents (FSD/2011, SB/2012 and FSD/2012) the fiscal deficit, in headline terms, was 1.9 p.p. of GDP higher than expected. This unfavourable bias was due entirely to revenue, as spending fell below the estimates in the three documents. Correcting for the effect of the reclassified capital transfers reduces this bias to around 1 p.p. of GDP.
6. The high level of public debt that has accumulated over the years is reflected in interest payments which totalled 7,265 M€ (4.4% of GDP).
7. In 2012 gross public debt (Maastricht definition) grew at a much steeper rate (15.3 p.p. of GDP) than the fiscal deficit, as a result of significant deficit-debt adjustments3, in particular the transactions stemming from the banking sector recapitalisation process, the settling of commercial debt arrears, as well as the increase in central government deposits (of a transient nature and having no impact on net debt).
3 Transactions that affect the debt (deficit) without affecting the deficit (debt). Note that according to the Maastricht definition, commercial debt, which includes arrears, is not a component of debt.
14 | Analysis of the Fiscal Strategy Document 2013-2017 Portuguese Public Finance Council

3 PUBLIC FINANCE SUSTAINABILITY
3.1 SUMMARY
This chapter covers recent changes in public debt and examines sustainability. The CFP concludes that if public debt is to avoid an explosive trajectory (unlimited growth) further consolidation measures are required in addition to those adopted up to 2012, even if a high level of economic growth occurs. Nonetheless, the fall in the public debt ratio would benefit not only from improvements in the primary fiscal balance but also from a recovery in economic growth. Under the central scenario of the FSD/2013 the debt ratio will be less than 60% in 2037 (that is to say 20 years after the end of the time horizon covered by the FSD/2013), thus complying with the rule of reducing excessive debt to the benchmark of 60% of GDP. In this chapter this scenario is subject to a sensitivity analysis.
3.2 CHANGE IN PUBLIC DEBT
The high level of Portuguese public debt greatly restricts fiscal options. According to the Maastricht definition, the debt stood at a record high of 123.6% of GDP at the end of 2012. This figure is a consequence of the persistent accumulation of budgetary deficits, the predominance of unfavourable deficit-debt adjustments4 and the strong slowdown in economic growth since the beginning of the century. The outcome of this debt accumulation is reflected in interest payments which totalled 7,265 M€ (4.4% of GDP) in 2012 and accounted for almost 20% of tax revenue.5
The FSD/2013 revises the level of debt upwards compared to the forecast in the FSD/2012 and in the memorandum of understanding (MoU) of May 2011. This revision became necessary after the level of debt in 2012 showed a deviation of over 10 p.p. of GDP as compared to those documents. The April 2012 FSD forecast for the projection horizon was revised upwards, by 6.6 p.p. of GDP in 2013 and 15.4 p.p. of GDP in 2016.
According to the information contained in the FSD/2013, debt will only enter a downward trend after reaching a peak in 2015, a year later than expected in the FSD/2012 and in the MoU of May 2011. Note that the FSD/2013 includes a decrease in the debt ratio in 2013 versus 2012, but this decline will be reversed in 2014 and the final figure will be higher than in 2012. The interim reduction in 2013 is contingent on a sharp, favourable deficit-debt adjustment (-6.9% of GDP), that probably springs from a decrease in central government deposits (that totalled 16,585 M€ or 10% of GDP in December 2012) and possible consolidation effects.6 However this decline in deposits may only arise in 2014, if the
4 The deficit-debt adjustments stem from financial transactions which, under the accounting rules, only impact on debt and not on deficit. In this context 2012 is a paradigmatic year, given that the change in debt was 8,648 M€ (5.2 p.p. of GDP) higher than the budgetary deficit (considering both items measured according to the Excessive Deficit Procedure methodology), as a result of this type of adjustment, which in 2012 included mainly bank recapitalisation operations, the increase in central government deposits and the payment of arrears. 5 In 2012 interest accounted for 19.2% of tax revenue, or 14% of the tax burden (tax revenue and effective social contributions) or 10.7% of general government revenue. In comparison, in 2008 interest accounted for 13% of tax revenue or 7% of total revenue. 6 Maastricht debt is consolidated, that is to say, it excludes general government assets comprising of liabilities issued by the general government itself. For example, it excludes treasury bills issued by the central government which are held by the Social Security Funds and treasury loans to state-owned enterprises that are included in the general government sector (RSOE).
Portuguese Public Finance Council Analysis of the Fiscal Strategy Document 2013-2017 | 15

option is taken to pre-finance in the current year the high volume of redemptions due in 2014.
Guaranteeing the reversal of the debt ratio’s upward trend is crucial to restore public finance sustainability. It should be borne in mind that the successive multi-annual fiscal planning documents, published since the introduction of the euro in 1999, have not proved effective in achieving the downward trend in public debt they describe. In effect (Chart 3), these documents have indicated successive upward revisions in the debt level and have always postponed the beginning of the downward trend.
The inability to reverse the growth in the debt ratio since the beginning of the century reveals the insufficiency of the Portuguese budgetary process, based on a yearly outlook and devoid of tools to assess the future impact of the decisions taken each year and their framing within an effective multi-annual perspective.
Chart 3 – Change in public debt and successive forecasts published in fiscal planning documents (% of GDP)
Adjustment program Stability program and FSD updates
Source: Bank of Portugal, INE and Ministry of Finance. CFP calculations. | Note: In the right hand chart the FSD/2013 corresponds to the April 2012 and April 2013 lines.
The State’s medium- and long-term direct debt refinancing requirements are significant which stresses the importance of achieving the budget goals. Setting the assistance program aside, redemption of the State’s direct debt up to 2017 will equal 47,059 M€ at current prices (24.2% of the closing balance in 2012), of which around ⅔ will occur in 2014 and 2015, as shown in Table 1. The amount of interest is contingent upon the average cost of the debt, which in turn is influenced by the price at which existing debt is refinanced. The credibility of the fiscal adjustment process, which depends upon the actual achievement of a downward trend in the debt ratio, will play an important part to achieve a favourable outcome in this field.
16 | Analysis of the Fiscal Strategy Document 2013-2017 Portuguese Public Finance Council

Table 1 - Redemption of direct State debt (M€)
Source: IGCP. | Note: The EFSF loan that matures in February 2015 and has a nominal value of EUR 1,730 million will be refinanced by the EFSF for a longer period.
3.3 DEBT SUSTAINABILITY
3.3.1 In the short- and medium-term
The long-term change in public debt depends crucially upon the initial debt level, the implicit debt interest rate, the level of the primary fiscal balance and economic growth. Box 1 (on page 17) provides a brief explanation of the intertemporal budgetary restrictions to which the public sector is subject. In this section the sensitivity of the debt’s trajectory to changes in those parameters is analysed. It should be stressed that it is a mechanical simulation, which does not take into account the effect of any interactions between fiscal variables and the macroeconomic scenario, so different values must be assumed for parameters relating to the rate of nominal growth in output and to the nominal interest rate. Calculations are made according to a top-down approach and do not assess the level of the fiscal effort required at any given moment in time to achieve the primary fiscal balance considered.7 The simulations do not take the impact of the change to the ESA2010 norm into account, which will occur in 2014. That change will probably have an unfavourable yet unknown impact on debt, resulting from the integration of some state-owned enterprises that currently fall outside the scope of the general government sector.8
7 The fiscal effort necessary to achieve a particular primary fiscal balance depends upon the starting point, the change in spending associated with the population’s age structure, in particular pensions and health expenditure, as well as the potential economic growth. 8 The debt stock of state-owned enterprises not included in the general government accounts for 2012 totalled 20,662 M€, i.e. 12.5% of GDP (21,429 M€ or 13.1% at the end of the 1st quarter of 2013). However this figure includes State loans which will not affect the level of total public debt, even in the worst scenario under which all such enterprises would are included in the general government.
Redemption of M/L term loans 2013 2014 2015 2016 2017 2014-2017
Economic and Financial Assistance Programme 0 0 2 277 9 951 3 659 15 887EFSF 0 0 1 730 2 525 0 4 255EFSM 0 0 0 4 750 0 4 750IMF 0 0 547 2 676 3 659 6 882
Other medium and long term debt 5 843 14 109 14 468 9 922 8 560 47 059
Total 5 843 14 109 16 745 19 874 12 219 62 946
Portuguese Public Finance Council Analysis of the Fiscal Strategy Document 2013-2017 | 17

Additional budget consolidation measures are inevitable if public debt is to avoid an explosive trajectory (unlimited growth). In 2012 the primary deficit was 2% of GDP (1.5% in adjusted terms). According to the results of the mechanical simulation presented below, without a reduction in the primary deficit it will not be possible to contain the growth in the public debt ratio until 2017, even with a high level of economic growth.9 Decreasing the debt ratio in 2017 to a level under the 2012 figures, maintaining the primary deficit at 2012 levels, would require an average nominal growth for this period greater than or equal to 4.5% per year (which would imply an average real growth of over 2.5% per year throughout the period), which is an unlikely scenario.
A fall in the public debt ratio would benefit both from an improvement in the primary fiscal balance and a recovery in economic growth.10 In fact a constant primary surplus of 3.5% of GDP combined with an average nominal growth of 3.5% would result in a debt ratio of 100.6% of GDP in 2017, maintaining the other underlying assumptions referred in the note to Table 2. Sustainable recovery in economic growth should be based on reforms on the supply side giving rise to higher potential growth, providing the economy with the ability to meet an increase in demand from private and foreign agents.
Table 2 - Simulation of the public debt ratio in 2017 for different combinations of primary fiscal balance and nominal growth (% GDP)
Note: The starting point for the simulation is the debt ratio recorded in 2012 (123.6% of GDP). It assumes a constant implicit debt interest rate of 4% and a favourable stock-flow adjustment of -8.2% of GDP (tending to reduce the debt), spread over time as in FSD/2013. The simulation considers a constant value for all parameters for each year from 2013 to 2017. The combinations of primary fiscal balance and nominal economic growth that result in debt higher than 100% of GDP in 2017 and lower than the 2012 figure are coloured beige while the combinations that result in higher debt in 2017 than in 2012 are coloured pink.
Given the same nominal interest rate (4.0%), Chart 4 shows how various combinations of lower primary fiscal balances or lower nominal output growth rates produce explosive debt ratio trajectories, once the effect of the decline in deposits has worn away.
9 The simulation assumes a (nominal) implicit debt interest rate of 4% over the entire period. In 2012 the implicit interest rate was 3.9%. A constant interest rate of 4% is higher than the rates assumed in the FSD/2013 for this period (3.5%, 3.6%, 3.6%, 3.7% and 3.8%, respectively from 2013 to 2017), but lower than those used for the central scenario from 2017 onwards (4.3%) in the same document. 10 It should be recalled that in 2012 GDP fell 3.3% in nominal terms.
1.36 -2.0 -1.5 -1.0 0.0 0.5 1.0 1.5 2.0 2.5 3.0 3.5 4.0 4.51.0 144.6 141.9 139.3 134.0 131.3 128.7 126.0 123.4 120.7 118.1 115.4 112.7 110.12.0 137.8 135.2 132.6 127.4 124.8 122.2 119.6 117.0 114.4 111.8 109.2 106.6 104.02.5 134.6 132.0 129.4 124.3 121.7 119.1 116.6 114.0 111.4 108.8 106.3 103.7 101.13.0 131.4 128.9 126.3 121.2 118.7 116.1 113.6 111.0 108.5 105.9 103.4 100.8 98.33.5 128.4 125.9 123.3 118.3 115.8 113.2 110.7 108.2 105.7 103.1 100.6 98.1 95.64.0 125.4 122.9 120.4 115.4 112.9 110.4 107.9 105.4 102.9 100.4 97.9 95.4 92.94.5 122.5 120.1 117.6 112.6 110.1 107.7 105.2 102.7 100.2 97.8 95.3 92.8 90.35.0 119.7 117.3 114.8 109.9 107.5 105.0 102.6 100.1 97.6 95.2 92.7 90.3 87.86.0 114.4 111.9 109.5 104.7 102.3 99.9 97.5 95.1 92.7 90.3 87.9 85.5 83.1
Primary balance (% GDP)
Nom
inal
gro
wth
(%)
18 | Analysis of the Fiscal Strategy Document 2013-2017 Portuguese Public Finance Council

Chart 4 – Change in debt in the absence of additional fiscal consolidation measures (% GDP)
Notes: PFB represents the primary fiscal balance (as % of GDP), r the nominal interest rate (as a percentage), g the nominal GDP growth rate (as a percentage). As in Table 2, a deficit-debt adjustment of -8.2% of GDP is assumed, spread over time as in the FSD/2013. Without this adjustment the curves shown above would rise throughout the entire period shown.
3.3.2 In the long-term
When the current excessive deficit procedure to which Portugal is subject is closed by the European Council11, Portugal will have to reduce its excessive debt against the reference value of 60% of GDP within 20 years. This new rule stems from the review of the Community regulations relating to the Stability and Growth Pact under the Treaty on Stability, Coordination and Governance in the Economic and Monetary Union (Budget Treaty) and the 7th amendment to the budgetary framework law approved by Parliament (following its promulgation).12
The FSD/2013 provides an analysis of public debt sustainability in Portugal over the long run. Given the projected debt level for 2017 (115% of GDP), the FSD sets out the changes to this ratio based on different hypotheses regarding the interest rate and nominal growth in GDP. The exercise is repeated in this section, broadening the sensitivity analysis provided in the FSD/2013.13
Under the FSD/2013 central scenario debt will be less than 60% in 2037, that is to say 20 years after the time horizon referred to in the FSD. This outcome is based on the
11 The Council declared the excessive deficit situation on 2nd December 2009 and gave Portugal up to 2014 to correct it. Based on the information announced at the 7th review of the adjustment programme, this correction will be complete in 2015, when the deficit will be 2.5% of GDP, lower than the reference value. 12 Article 10-G (1) of the budgetary framework law states that “When the ratio of public debt to gross domestic product (GDP) exceeds the 60% reference value, the Government shall be obliged to reduce it at a benchmark rate of one twentieth per year, as provided for in article 2 of Council Regulation (EC) no. 1467/97 of 7 July, on speeding up and clarifying implementation of the excessive deficit procedure, amended by Council Regulation (EU) no. 1177/2011 of 8 November.” 13 In the simulations the 2012 debt level given in the FSD/2013 was adjusted as per the estimate used in the 7th review of the adjustment programme, so as to match the report of the national statistics authority in the EDP of March 2013. This correction results in a debt level of 123.6% of GDP, i.e., 0.6 p.p. higher than in the FSD/2013.
PFB = -1.5; r = 4; g = 3.5
PFB = -1.5; r = 4; g = 4
PFB = -1; r v= 4; g = 3.5
PFB = -0.5; r = 4; g = 2
PFB = 0; r = 4; g = 3.5
60
110
160
210
26020
05
2008
2011
2014
2017
2020
2023
2026
2029
2032
2035
2038
2041
2044
2047
2050
Portuguese Public Finance Council Analysis of the Fiscal Strategy Document 2013-2017 | 19

assumptions of a primary fiscal surplus of 3.5% of GDP, a nominal interest rate of 4.3% and nominal growth in GDP of 3.5% per year. As the debt stock reduces over time the interest payments gradually fall from 4.8% of GDP in 2018 to 2.6% of GDP in 2037, which will provide for an overall budget surplus of close to 1% of GDP in that year. The analysis undertaken here seeks to determine how these outcomes will withstand any changes to the hypotheses. Chart 5 shows the change in the ratio of debt to GDP in each of the scenarios described in the paragraphs below.
Reducing the fiscal effort in the beginning, results in fiscal consolidation efforts for a longer period than in the central scenario. If the primary fiscal surplus were 1 p.p. of GDP lower, that is to say if it remained steady after 2017 at 2.5% of GDP, a debt ratio below 60% of GDP would only be achieved in 2048, eleven years later than in the central scenario. This slower correction rate for the excess debt towards the 60% of GDP reference value would not comply with the legislation nor with the Budget Treaty. Thus there is a clear trade-off between an immediate fiscal effort and the future scope for fiscal policy.
The reward for reforms which provide for a faster potential economic growth would be any earlier achievement of the reference value. If the remaining parameters of the FSD central scenario remained the same, a higher rate of growth would lead to a faster reduction in debt. For example an additional 1 p.p. of nominal growth (4.5% per year at current prices) would mean that the debt would fall below 60% of GDP in 2033, while the primary fiscal surplus remained at 3.5% of GDP. Under the greater growth premise, even with a smaller surplus of 2.5% of GDP, the reference value would be reached in 2038.
A higher interest rate requires larger primary fiscal surpluses to avoid an unsustainable path. If overall debt would cost as much as the latest issue of 10-year Treasury Bonds (5.6%), and the remaining central scenario parameters remained unchanged, the reference value would only be achieved in 2051, and the correction trajectory established by the legislation (national and European) and the Budget Treaty would not be met.
Primary fiscal surpluses of less than 2.5% of GDP are hardly compatible with the debt reduction rule. Under the various simulated combinations of growth and interest rate, primary fiscal surpluses of less than 2.5% of GDP make it impossible to abide by the rule of reducing public debt in excess of the reference value at a rate of one twentieth per year, even when growth of 4.5% is considered.
20 | Analysis of the Fiscal Strategy Document 2013-2017 Portuguese Public Finance Council

Chart 5 – Sensitivity analysis: long term debt change scenarios
Notes: PFB stands for primary fiscal balance (as % of GDP), r the nominal interest rate (as a percentage), g the nominal growth rate for GDP (as a percentage). The first five graphs assume the central scenario set out in the FSD/2013 up to and including 2017.
The less favourable the starting point, the greater the adjustment effort required to comply with the debt reduction rule. Any policy change that extends the fiscal adjustment that should be made until 2017, and increases the debt level beyond that value, will require an extended need to maintain primary fiscal surpluses after 2017. For example, assuming the starting point in 2017 is 10 p.p. of GDP less favourable than projected in the FSD/2013. That could stem from the combined effect of unforeseen financial transactions resulting in unfavourable deficit-debt adjustments, from a possible nonfulfillment of budget goals or from changes in the national accounts system. Under the remaining conditions applying to the FSD central scenario, such a change would extend the efforts required to reach a figure below the reference value by four years, and the debt reduction rule would not be complied with.
How realistic are the hypotheses in this exercise? These simulations are clearly mechanical to the extent that they are not backed up by a model that takes relationships between variables into account. Therefore if they are to be informative they must be based on realistic hypotheses. As for nominal growth of 3.5% per year, the statistics point to average growth, at current prices, of 5.3% from 1995 to 2008; during the European and Monetary Union (EMU) period from 1999 to 2008 that figure was 4.2% per year. This would suggest that the 3.5%
Portuguese Public Finance Council Analysis of the Fiscal Strategy Document 2013-2017 | 21

hypothesis is relatively cautious. However, real growth in these subperiods was just 2.2 and 1.3%, respectively, and the corresponding growth rates for GDP prices were 3 and 2.9%, respectively. Indeed this higher growth in prices compared to the euro area accounted for Portugal’s loss of competitiveness over the period. Assuming no further losses of competitiveness after 2017 and that the ECB manages to hold inflation at close to 2% per year, the 3.5% nominal growth hypothesis represents average real growth of 1.5%. Although Portugal’s population and its working population are expected to decline, it does not seem unrealistic to assume that economic reforms could improve overall productivity of factors in the medium run, which would lead to faster growth.
As to whether a steady primary fiscal surplus of 3.5% of GDP is a realistic hypothesis, past experience is not promising. After 1977, the only significant primary fiscal surpluses were recorded from 1986 to 1992, the highest of which was in 1992 (3.5% of GDP). According to ESA95 series, which begin in 1995, no significant primary fiscal surplus was recorded. In fact from 1995 to 1997 there was a primary fiscal balance, but during the rest of the period significant primary fiscal deficits were the norm: the average primary fiscal deficit from 1995 to 2012 was 1.6% of GDP; in the period following the EMU (1999-2012), the average primary fiscal deficit was 2.1%. If we exclude the financial crisis period, from 1999 to 2008 the average primary fiscal deficit was 1.2% of GDP.
Achieving and maintaining a primary fiscal surplus of 3.5% of GDP will require strong spending discipline. Assuming that the goal of a primary fiscal surplus of 3.5% of GDP can be achieved by 2017, the simulations show that it is essential to maintain that surplus until 2037 if debt sustainability is to be restored and the debt ratio reduction rule fulfilled. The FSD/2013 assumes that the ratio of total revenue to GDP will fall from 2013 to 2017 from 42.6% to 41.7% of GDP. This suggests that the Government believes that a revenue ratio of over 42% of GDP cannot be sustained over a long period or is inconsistent with the GDP growth rates assumed in the simulations. Taking this for granted, it means that maintaining the primary fiscal surplus at 3.5% of GDP would require strong discipline on the spending side. Discipline over spending would also create sufficient fiscal scope to adopt a counter cyclical fiscal stance over time, while still complying with the Stability and Growth Pact, as reinforced by the Budget Treaty. This goal will be more easily reached if the budgetary process adopts a multi-annual approach.
Chart 6 – Primary fiscal balance (% GDP)
Source: European Commission, AMECO database, May 2013. Note: the dotted line represents the polynomial trend.
-8.5
-6.5
-4.5
-2.5
-0.5
1.5
3.5
1977 1984 1991 1998 2005 2012
22 | Analysis of the Fiscal Strategy Document 2013-2017 Portuguese Public Finance Council

Box 1 – Intertemporal fiscal restriction
By definition, ignoring monetary financing, the absolute amount of public debt (D), in monetary units, in the year t is equal to the debt in the previous period plus the budgetary deficit in year t and any deficit-debt adjustments, and may be expressed as:
𝐷𝐷𝑡𝑡 = 𝐷𝐷𝐷𝐷𝐷𝐷𝐷𝐷𝑡𝑡 + 𝑟𝑟𝑡𝑡𝐷𝐷𝑡𝑡−1 + 𝐷𝐷𝑡𝑡−1 + 𝐴𝐴𝐴𝐴𝑡𝑡
where DEFP is the primary deficit (i.e., before debt interest payments), r is the nominal implicit debt interest rate and AJ is the deficit-debt adjustment. All figures are expressed at current prices. This represents the public sector fiscal restriction from a dynamic perspective. Dividing by nominal GDP, where the rate of growth is g, we obtain:
𝑑𝑑𝑡𝑡 =1 + 𝑟𝑟𝑡𝑡1 + 𝑔𝑔𝑡𝑡
𝑑𝑑𝑡𝑡−1−𝑝𝑝𝑝𝑝𝑝𝑝𝑝𝑝𝑝𝑝𝑝𝑝𝑝𝑝𝑝𝑝𝑡𝑡 + 𝑝𝑝𝑎𝑎𝑡𝑡
where the lower case letters represent the output ratios. Using this expression it is possible to calculate the value of the debt in period t given that debt in t-1, the primary fiscal balance, the output growth rate and the deficit-debt adjustment in year t are known.
Portuguese Public Finance Council Analysis of the Fiscal Strategy Document 2013-2017 | 23
4 MACROECONOMIC SCENARIO
4.1 SUMMARY
The analysis of the macroeconomic scenario in the FSD/2013 is constrained by the fact that the fiscal consolidation measures to be implemented during the time frame covered by this document have not been identified, nor has the expected impact of the measures set out in the Strategy for Growth, Employment and Industrial Development 2013-2020. The economic downturn expected for 2013 constitutes a sharp downward revision compared to the estimates in SB/2013, as domestic demand is expected to decline further. The FSD points to a turning point being reached as early as 2014, based on a recovery in domestic demand (in particular in private investment) and on the strength of the relevant foreign demand. Over the period covered by the forecasts the unemployment rate is likely to remain high.
4.2 MACROECONOMIC SCENARIO ANALYSIS
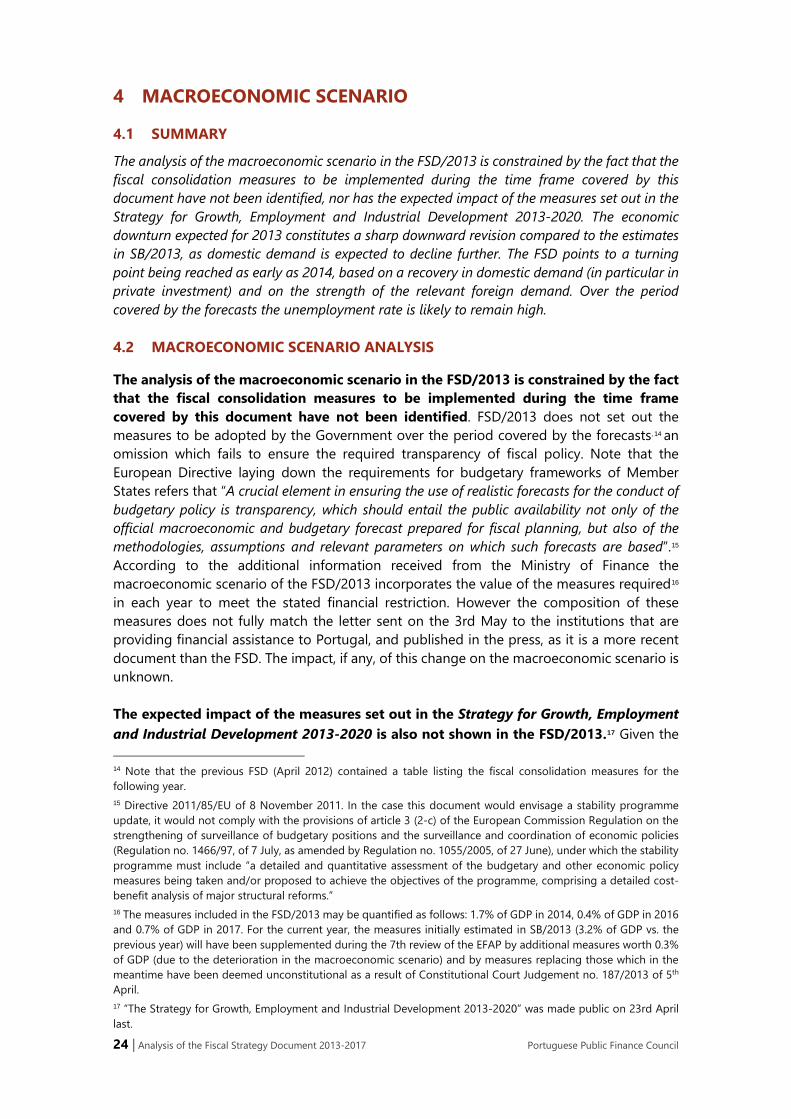
The analysis of the macroeconomic scenario in the FSD/2013 is constrained by the fact that the fiscal consolidation measures to be implemented during the time frame covered by this document have not been identified. FSD/2013 does not set out the measures to be adopted by the Government over the period covered by the forecasts,14 an omission which fails to ensure the required transparency of fiscal policy. Note that the European Directive laying down the requirements for budgetary frameworks of Member States refers that “A crucial element in ensuring the use of realistic forecasts for the conduct of budgetary policy is transparency, which should entail the public availability not only of the official macroeconomic and budgetary forecast prepared for fiscal planning, but also of the methodologies, assumptions and relevant parameters on which such forecasts are based”.15
According to the additional information received from the Ministry of Finance the macroeconomic scenario of the FSD/2013 incorporates the value of the measures required16 in each year to meet the stated financial restriction. However the composition of these measures does not fully match the letter sent on the 3rd May to the institutions that are providing financial assistance to Portugal, and published in the press, as it is a more recent document than the FSD. The impact, if any, of this change on the macroeconomic scenario is unknown.
The expected impact of the measures set out in the Strategy for Growth, Employment and Industrial Development 2013-2020 is also not shown in the FSD/2013.17 Given the
14 Note that the previous FSD (April 2012) contained a table listing the fiscal consolidation measures for the following year. 15 Directive 2011/85/EU of 8 November 2011. In the case this document would envisage a stability programme update, it would not comply with the provisions of article 3 (2-c) of the European Commission Regulation on the strengthening of surveillance of budgetary positions and the surveillance and coordination of economic policies (Regulation no. 1466/97, of 7 July, as amended by Regulation no. 1055/2005, of 27 June), under which the stability programme must include “a detailed and quantitative assessment of the budgetary and other economic policy measures being taken and/or proposed to achieve the objectives of the programme, comprising a detailed cost-benefit analysis of major structural reforms.” 16 The measures included in the FSD/2013 may be quantified as follows: 1.7% of GDP in 2014, 0.4% of GDP in 2016 and 0.7% of GDP in 2017. For the current year, the measures initially estimated in SB/2013 (3.2% of GDP vs. the previous year) will have been supplemented during the 7th review of the EFAP by additional measures worth 0.3% of GDP (due to the deterioration in the macroeconomic scenario) and by measures replacing those which in the meantime have been deemed unconstitutional as a result of Constitutional Court Judgement no. 187/2013 of 5th April. 17 “The Strategy for Growth, Employment and Industrial Development 2013-2020” was made public on 23rd April last.
24 | Analysis of the Fiscal Strategy Document 2013-2017 Portuguese Public Finance Council

interdependence between the budget variables and the macroeconomic aggregates, a fiscal strategy document should specify the effects of the major economic policy measures. Given the importance the Government attributes to that strategy for 2013-2020, as well as the fact the referred document states that fiscal consolidation is one of that strategy’s goals, it would be useful if the FSD/2013 sought to evaluate the input of those measures to achieve the fiscal consolidation goals.
Chart 7 – Change in the IMF forecasts for the Portuguese economy and the Euro Area
Revisions for Portugal (compared to EFAP baseline scenario) and for the Euro area (%)
Cumulative change in GDP (at constant prices)
Source: INE and Ministry of Finance. CFP calculations. | Notes: the IMF forecast revisions for GDP in the Euro area correspond to the difference between the forecasts published in WEO - April 2013 and WEO – April 2011; the period up to 2016 is examined as that year marks the end of the time frame covered by the EFAP baseline scenario; in the panel on the left a negative figure represents a downward revision of projected economic growth, while a positive figure represents the inverse situation.
Since the beginning of the EFAP the forecasts therein have been repeatedly revised downwards. The macroeconomic forecasts included in the FSD, for the period 2013-17, are in line with those published recently by the international institutions that provide financial assistance to Portugal. However, it should be borne in mind that in the past the short run forecasts were also aligned and proved to be overoptimistic. Note that the European legislation governing these matters requires forecasts to be “based on the most likely macro-fiscal scenario or on a more prudent scenario”.18 Compared to the EFAP baseline scenario (MoU of May 2011), the forecasts for GDP growth from 2012 to 2016 have been repeatedly revised downwards.19 Part of the explanation for these revisions is the existence of a harsher than expected external environment, due in particular to the sovereign debt crises that hit the Euro area. In fact the Euro area growth forecasts were also revised downwards and had a major influence on the projections for Portugal, as the EFAP baseline scenario estimated net exports would make a substantial contribution over the time frame considered. However, with the exception of 2012, the revisions made to the Portuguese economy forecasts were of a larger magnitude than to the Euro area (left hand panel in Chart 7). To give an idea of that scale, it should be stated that the most recent IMF forecast (which is similar to the one in the FSD), suggests that in 2016 the real output of the Portuguese economy will still be 4.1% lower than
18 Article 3 (2-A – 2) of Regulation No. 1466/97 of 7 July, as amended by Regulation No. 1055/2005 of 27 June. 19 The year 2011 was the only exception, as GDP growth was higher than expected.
Portuguese Public Finance Council Analysis of the Fiscal Strategy Document 2013-2017 | 25
the level achieved before the global economic crisis of 2008, while the programme’s baseline scenario estimated it would exceed that level by 2.6%.20
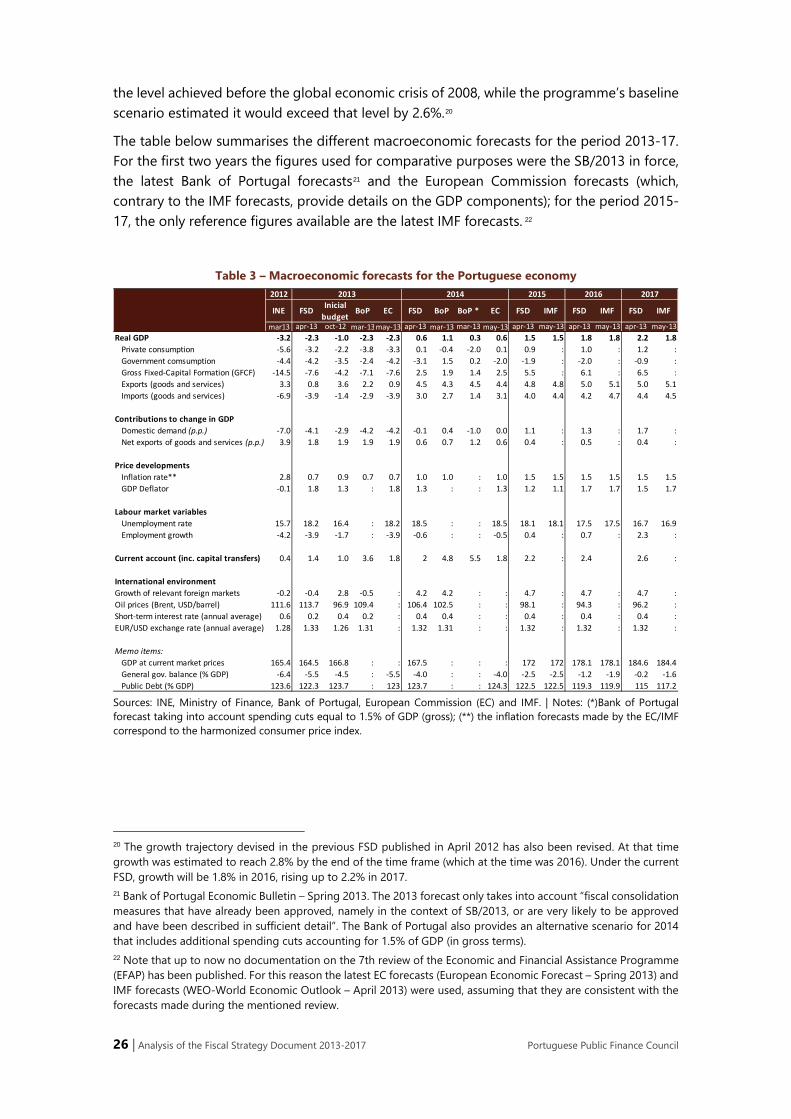
The table below summarises the different macroeconomic forecasts for the period 2013-17. For the first two years the figures used for comparative purposes were the SB/2013 in force, the latest Bank of Portugal forecasts21 and the European Commission forecasts (which, contrary to the IMF forecasts, provide details on the GDP components); for the period 2015-17, the only reference figures available are the latest IMF forecasts. 22
Table 3 – Macroeconomic forecasts for the Portuguese economy
Sources: INE, Ministry of Finance, Bank of Portugal, European Commission (EC) and IMF. | Notes: (*)Bank of Portugal forecast taking into account spending cuts equal to 1.5% of GDP (gross); (**) the inflation forecasts made by the EC/IMF correspond to the harmonized consumer price index.
20 The growth trajectory devised in the previous FSD published in April 2012 has also been revised. At that time growth was estimated to reach 2.8% by the end of the time frame (which at the time was 2016). Under the current FSD, growth will be 1.8% in 2016, rising up to 2.2% in 2017. 21 Bank of Portugal Economic Bulletin – Spring 2013. The 2013 forecast only takes into account “fiscal consolidation measures that have already been approved, namely in the context of SB/2013, or are very likely to be approved and have been described in sufficient detail”. The Bank of Portugal also provides an alternative scenario for 2014 that includes additional spending cuts accounting for 1.5% of GDP (in gross terms). 22 Note that up to now no documentation on the 7th review of the Economic and Financial Assistance Programme (EFAP) has been published. For this reason the latest EC forecasts (European Economic Forecast – Spring 2013) and IMF forecasts (WEO-World Economic Outlook – April 2013) were used, assuming that they are consistent with the forecasts made during the mentioned review.
mar13 apr-13 oct-12 mar-13may-13 apr-13 mar-13 mar-13 may-13 apr-13 may-13 apr-13 may-13 apr-13 may-13Real GDP -3.2 -2.3 -1.0 -2.3 -2.3 0.6 1.1 0.3 0.6 1.5 1.5 1.8 1.8 2.2 1.8 Private consumption -5.6 -3.2 -2.2 -3.8 -3.3 0.1 -0.4 -2.0 0.1 0.9 : 1.0 : 1.2 : Government comsumption -4.4 -4.2 -3.5 -2.4 -4.2 -3.1 1.5 0.2 -2.0 -1.9 : -2.0 : -0.9 : Gross Fixed-Capital Formation (GFCF) -14.5 -7.6 -4.2 -7.1 -7.6 2.5 1.9 1.4 2.5 5.5 : 6.1 : 6.5 : Exports (goods and services) 3.3 0.8 3.6 2.2 0.9 4.5 4.3 4.5 4.4 4.8 4.8 5.0 5.1 5.0 5.1 Imports (goods and services) -6.9 -3.9 -1.4 -2.9 -3.9 3.0 2.7 1.4 3.1 4.0 4.4 4.2 4.7 4.4 4.5
Contributions to change in GDP Domestic demand (p.p.) -7.0 -4.1 -2.9 -4.2 -4.2 -0.1 0.4 -1.0 0.0 1.1 : 1.3 : 1.7 : Net exports of goods and services (p.p.) 3.9 1.8 1.9 1.9 1.9 0.6 0.7 1.2 0.6 0.4 : 0.5 : 0.4 :
Price developments Inflation rate** 2.8 0.7 0.9 0.7 0.7 1.0 1.0 : 1.0 1.5 1.5 1.5 1.5 1.5 1.5 GDP Deflator -0.1 1.8 1.3 : 1.8 1.3 : : 1.3 1.2 1.1 1.7 1.7 1.5 1.7
Labour market variables Unemployment rate 15.7 18.2 16.4 : 18.2 18.5 : : 18.5 18.1 18.1 17.5 17.5 16.7 16.9 Employment growth -4.2 -3.9 -1.7 : -3.9 -0.6 : : -0.5 0.4 : 0.7 : 2.3 :
Current account (inc. capital transfers) 0.4 1.4 1.0 3.6 1.8 2 4.8 5.5 1.8 2.2 : 2.4 2.6 :
International environmentGrowth of relevant foreign markets -0.2 -0.4 2.8 -0.5 : 4.2 4.2 : : 4.7 : 4.7 : 4.7 :Oil prices (Brent, USD/barrel) 111.6 113.7 96.9 109.4 : 106.4 102.5 : : 98.1 : 94.3 : 96.2 :Short-term interest rate (annual average) 0.6 0.2 0.4 0.2 : 0.4 0.4 : : 0.4 : 0.4 : 0.4 :EUR/USD exchange rate (annual average) 1.28 1.33 1.26 1.31 : 1.32 1.31 : : 1.32 : 1.32 : 1.32 :
Memo items: GDP at current market prices 165.4 164.5 166.8 : : 167.5 : : : 172 172 178.1 178.1 184.6 184.4 General gov. balance (% GDP) -6.4 -5.5 -4.5 : -5.5 -4.0 : : -4.0 -2.5 -2.5 -1.2 -1.9 -0.2 -1.6 Public Debt (% GDP) 123.6 122.3 123.7 : 123 123.7 : : 124.3 122.5 122.5 119.3 119.9 115 117.2
FSD IMF FSD IMFEC FSD IMFEC FSD BoP BoP *INE FSD Inicial budget
BoP
2012 2013 2014 2015 2016 2017
26 | Analysis of the Fiscal Strategy Document 2013-2017 Portuguese Public Finance Council

Forecasts for 2013-14 The economic downturn expected for this year (-2.3%) constitutes a sharp downward revision compared to the estimates in SB/2013 (-1%).23 This revision stems from expectations of a greater decline in domestic demand (-4.1 p.p. instead of -2.9 p.p.), which will make the economy shrink for the third year running. Although the Bank of Portugal’s GDP forecast for 2013 is in line with the Ministry of Finance’s, the central bank points to a steeper fall in private consumption (-3.8% instead of -3.2%), even without taking into account any additional fiscal measures not included in SB/2013. On the other hand, the Bank of Portugal expects a lower decrease in public consumption (-2.4%) than the Ministry of Finance (-4.2%).24 The right hand panel in Chart 8 shows the contributions made by domestic demand and net exports to the changes in GDP recorded in 2011 and 2012 and the projections for the following five years.
Chart 8 – Contributions to real GDP growth (p.p.)
Comparison with SB/2013 and Bank of Portugal Domestic demand vs. Net exports
Source: INE, Ministry of Finance and Bank of Portugal. | Note: (*) The Bank of Portugal’s alternative forecast for 2014 in a scenario involving additional public spending cuts of 1.5% of GDP (in gross terms).
According to the official forecasts for the Portuguese economy a turning point will be reached next year, as positive growth is estimated. The Ministry of Finance estimates that GDP will grow by 0.6% in 2014, as a result of the positive impact of net exports (0.6 p.p.) and the slight decline in domestic demand (-0.1 p.p.), a figure which assumes a strong recovery compared to the -4.1 p.p. change forecast for the current year. In fact the FSD points to positive changes in 2014 in private consumption (0.1% versus -3.2% in 2013), gross fixed capital formation (2.5% versus -7.6%) and exports (4.5% versus +0.8%). Nonetheless it should be stressed that no explanation is given in the FSD/2013 for the significant change expected in the behaviour of these variables.
23 According to the quick estimate for the quarterly national accounts published by INE on 15th May last, in year-on-year terms GDP recorded a fall of 3.9% in volume terms in the 1st quarter of 2013 (-3.8% in the 4th quarter of 2012). Compared to the previous quarter, INE’s estimates suggest that the continuous decrease has slowed from - 1.8% to -0.3%. 24 In the FSD, the GDP deflator is expected to increase from -0.1% in 2012 to 1.8% in 2013. According to additional information provided by the Ministry of Finance, this forecast reversal is linked to the public consumption deflator which was highly negative (-7.7%) in 2012, due to the decrease/suspension of civil servants holiday pay, and which the Ministry of Finance estimates will total 6.7% in 2013, as a consequence of restoring that pay. As for the importance of the GDP deflator in macro-fiscal forecasts see Box 1 of CFP Report Nº 2/2013 – Analysis of the General Government Account 2012.
Portuguese Public Finance Council Analysis of the Fiscal Strategy Document 2013-2017 | 27

The Bank of Portugal’s alternative scenario for 2014 points to lower growth than in the FSD/2013, even when assuming measures on a lesser scale than those stated by the Ministry of Finance. In the spring issue of its Economic Bulletin the Bank of Portugal published a scenario which includes additional spending cuts accounting for 1.5% of GDP in gross terms in 2014.25 Despite less than the amount of cuts taken into account in 2014 in the FSD (1.7% of GDP – net terms), that forecast points to lower GDP growth (by 0.3 p.p.) than that estimated by the Ministry of Finance. This less positive perspective springs above all from expectations of a greater decline in domestic demand. On one hand, in the alternative scenario the Bank of Portugal estimates private consumption will fall (-2%), while the Ministry of Finance foresees this item growing by 0.1% in 2014. On the other hand, under that scenario the Bank of Portugal predicts that investment growth (1.4%) in 2014 will be less than in the FSD (2.5%).26 For the reasons stated in this paragraph and the previous one, and if the external environment recovers no more than expected, the possibility of the economy shrinking again next year cannot be excluded, albeit by less than forecasted for 2013.
Forecasts for 2015-17 Average annual economic growth for the period 2015-2017 is estimated to be around 1.8%, based mainly on an increase of domestic demand.27 According to the forecasts in the FSD/2013, from 2015 onwards domestic demand will make a positive contribution which will exceed the contribution of net exports (right hand panel of Chart 8). Actually, for the period 2015-17, the Ministry of Finance estimates investment to increase significantly (average annual growth of 6%),28 assuming restrictions on Portuguese financing will ease. Bearing in mind that FSD/2013 suggests a steady decrease in public investment, the overall increase will be sustained by the relaunching of private investment and exports. Finally, it should be noted that despite the implementation of fiscal consolidation measures with a direct impact on disposable income, the Ministry of Finance’s forecasts indicate that between 2015 and 2017 private consumption will grow by around 1% per year. The left hand panel on Chart 9 shows the expected behaviour of the components of domestic demand.
25 That alternative scenario suggests there will be a negative impact of 0.8% on GDP resulting from the cuts in compensation of employees and social transfers (including pensions). In addition the Bank of Portugal provides sensitivity analysis for exports growth in 2014, stemming from a deviation in foreign demand and/or an unexpected change in market share of ± 1 p.p., under which the corresponding impact on GDP would be ± 0.2 p.p. 26 It should also be noted that the fall in public consumption forecast in the FSD for 2014 (-3.1%) contrasts with a lesser decrease estimated by the European Commission (-2%). We recall that errors in estimating this indicator have been frequent, both in terms of changes in volume and of the deflator. 27 The FSD/2013 forecasts do not include the potential effects of structural reforms. It must be mentioned that the forecasts for the end of the time frame are subject to a great deal of uncertainty, and are also strongly constrained by the need to achieve a structural balance within the -0.5% of GDP limit. On the other hand, those forecasts depend to a large extent on estimated potential GDP growth which, according to the current FSD, should be 0.8% in 2017. 28 Note that the initial version of the EFAP indicated a substantially lower investment growth at the end of the time frame: 2.4% in 2015 and only 1% in 2016.
28 | Analysis of the Fiscal Strategy Document 2013-2017 Portuguese Public Finance Council

Chart 9 – Change in GDP components Domestic demand components (annual rate of change) Relative weight of exports & imports in GDP (%)
Source: INE and Ministry of Finance.
FSD/2013 suggests Portugal’s net borrowing capacity will improve over the projection horizon. Following the turnaround in 2012 regarding the successive large external deficits that were observed during a long period, regular current and capital account surpluses are expected: a balance of 1.4% of GDP is forecast for the current year and one of over 2% from 2014 onwards, reaching 2.6% of GDP at the end of the time frame.29 Above all this change reflects expectations as to an improvement in the goods and services account balance (that should achieve a 4% surplus in 2017) contributing to a reduction in the high degree of external indebtedness.
Very significant growth in relevant foreign demand is expected from next year onwards. Following the economic downturn in 2012 (-0.2%) and estimated for the current year (-0.4%), strong growth in external demand for the Portuguese economy is expected, to the tune of 4.2% in 2014 and 4.7% in each of the final three years of the projection. This forecast is mainly based on the dynamism of the emerging economies, as well as the Euro area’s recovery, which assumes an improvement in the current international environment. Hence exports are expected to grow at an average annual rate of around 5% from 2015-17 and their relative weight in GDP to increase by 6.2 p.p. over the time frame of the FSD, going from 38.7% in 2012 to almost 45% in 2017 (right hand panel of Chart 9).30 Under this scenario market share should increase at an average annual rate of 0.3% from 2015 to 2017, as shown in Chart 10. It must be stressed that the fragility of the global upturn and the financial markets, as well as tensions within the European Union, are important risks to the recovery of foreign demand.31
29 Note that FSD/2012 estimated a higher surplus at the end of the time frame (4.9% of GDP). 30 This year the relative weight of exports in GDP is expected to exceed that of imports. The aim of the ”Strategy for Growth, Employment and Industrial Development 2013-2020” is to achieve sustainable growth in the national economy of over 2% per year in 2020. One of the assumptions made to meet that objective is an increase in the relative weight of exports in GDP up to 50% by the end of that time frame. To that end, reinforcement of the economic diplomacy strategy is expected and the reduction by half of the port use tax (TUP Cargo), among other measures. 31 The FSD/2013 report stresses the risk of overvaluing the recovery of foreign demand: under a scenario of lower foreign demand (– 1 p.p.), real GDP growth will reach 0.3% in 2014, i.e. such a decrease in exports would lead to a lower growth of the economy by less 0.3 p.p., when compared to the central scenario for that year.
Portuguese Public Finance Council Analysis of the Fiscal Strategy Document 2013-2017 | 29

Chart 10 – Change in market share (real rate of change, %)
Source: AMECO. CFP calculations. | Note: the dotted lines represent the FSD/2013 forecasts.
Over the coming years the unemployment rate is likely to remain high. The FSD estimates that unemployment will continue to climb in 2013 (+2.5 p.p., rising from 15.7% to 18.2%)32, having increased by 3 p.p. in the previous year. From 2014 onwards (the year in which the FSD estimates unemployment will reach 18.5%) the unemployment rate is expected to fall steadily (at a slow pace), although the unemployment rate expected by the end of the time frame (16.7%) will still be higher (by 1 p.p.) than in 2012 (Chart 11). The FSD report sets out the risks inherent in the unemployment rate forecasts, particularly in regard to private consumption and, consequently, to the revenue from indirect taxes. Note that recent forecasting errors in relation to this indicator had negative consequences for the budget outturn, resulting in lower tax revenue, as well as higher spending on social transfers.
Chart 11 – GDP growth and unemployment rate
Source: Ministry of Finance and INE.
32 According to INE, the estimated unemployment rate for the 1st quarter of 2013 was 17.7%. This figure is 0.8 p.p. higher than in the previous quarter.
30 | Analysis of the Fiscal Strategy Document 2013-2017 Portuguese Public Finance Council

5 FISCAL FORECASTS
5.1 SUMMARY
This chapter deals with the forecasts for the general government accounts from 2013 to 2017 and the composition of the fiscal adjustment efforts, and includes comparisons with the previous FSD. The excessive deficit correction goal and the medium-term objective for the structural balance are postponed by two years as compared to the FSD/2012. The consolidation of public finances by 2017 indicated in the FSD/2013 involves a fiscal adjustment based almost solely on public spending cuts. However, a quality and viability assessment of the adjustment strategy is hindered by the lack of available data. For the sake of transparency the CFP recommends that following the approval of the 2013 fiscal consolidation measures, the Government should update the composition of the adjustment underlying the general government accounts for the period 2013-2017, so as to match the estimated changes in the various revenue and spending items to the estimated changes in the fiscal balance. In order to fulfil its mission the CFP requires timely access to full details of the measures proposed, including their expected impact.
5.2 FISCAL BALANCES
As in previous CFP reports, the expected changes in general government budget aggregates is analysed on the basis of figures adjusted of temporary and one-off measures. Similarly, certain transactions that have a temporary effect on general government spending (referred to as “special factors”)33 have been identified and their impact on government accounts was also corrected. In addition the CFP has considered the figures set out in Table II.9 of the FSD, regarding the general government accounts for the period 2013-2017, as being net of transfers under the financial system support that may be (re)classified as capital expenditure (hence impacting on the deficit).34 Correcting revenue and expenditure for these effects provides a clearer view of the starting point and the change forecasted in the FSD for the public finance aggregates. Table 4 sets out the figures that are discussed below.
33 For 2010-2012, temporary measures and special factors correspond to the transactions quantified in Box 2 of CFP Report No. 2/2013 – Analysis of the General Government Account 2012. In regard to the years covered by the FSD for which the Ministry of Finance has identified temporary measures (2013 and 2014), the CFP only considered the granting of the Port of Lisbon concession (0.1% of GDP), to be undertaken in 2013, as a temporary measure. The increased spending stemming from severance payments (0.7 % of GDP), classified as a temporary measure in 2014 by the Ministry of Finance, was not taken into account by the CFP when calculating the structural balance. 34 It should be noted that there is a risk of the public financial support provided to BANIF (0.7% of GDP) being classified, in whole or in part, as a capital transfer impacting on the deficit. However, even if that happens, it should not prevent achieving the goal set in the adjustment programme, given that this goal is net of the financial system support.
Portuguese Public Finance Council Analysis of the Fiscal Strategy Document 2013-2017 | 31

Table 4 – Budget indicators
Source: INE, Ministry of Finance (MF). CFP calculations. Note: (i) There may be minor differences between these figures and those in CFP Report No. 2/2013 as the cyclical component source used here is the Ministry of Finance’s estimate rather than the European Commission estimate [Spring 2013 forecasts] used in that report, because the latter does not include estimates for the period 2015-2017; (ii) annual changes do not necessarily match the differences between figures as a percentage of GDP due to rounding.
The adjusted general government budgetary deficit should decrease by 5.7 p.p. of GDP until 2017. According to the FSD forecast the proposed strategy sets out to reduce the budgetary deficit to -0.2% of GDP by 2017. The proposed adjustment coincides with the expected change in the adjusted primary fiscal balance, since the relative weight of interest in GDP is expected to remain unchanged (at 4.4% of GDP). Therefore a primary fiscal surplus should be recorded from 2014 onwards (0.3 % of GDP), and in 2017 be equivalent to 4.2% of GDP. In 2013 the change in the fiscal balance will still be negatively affected by the business cycle, which is expected to reverse from 2014 onwards. This trajectory is based on the correction of Portugal’s excessive deficit situation in 2015 (the deficit will account for 2.5% of GDP by that year), two years later than estimated in the FSD/2012.
To achieve the medium-term objective (MTO) of a structural balance of -0.5% of GDP in 2017, this balance, net of special factors, will have to improve by 3.9 p.p. of GDP, of which 2.8 p.p. is expected to arise in the first three years. In comparative terms, from 2010 to 2012 the structural balance correction net of special factors was of the same magnitude (3.9 p.p. of GDP), which means that approximately half of the adjustment required to meet the MTO has already been achieved. Under the European legislation, the budgetary adjustment path Portugal is obliged to follow, calls for compliance with a structural balance rule, which requires an annual adjustment of at least 0.5 p.p. of GDP in that balance until the medium-term budget objective, currently set at 0.5% of GDP, is met. From the data provided in the FSD it is possible to see that the forecasts match the need to meet those rules, since the document foresees a structural deficit of 0.5% of GDP at the end of the time frame considered.
Budget balance 2012 2013 2014 2015 2016 2017 2012 2013 2014 2015 2016 2017 2010/12 2010/17 2012/17Primary (EDP) -2.0 -1.1 0.3 1.8 3.1 4.2 -1.7 0.9 1.4 1.5 1.3 1.0 5.0 11.2 6.2
Actual (headline), EDP -6.4 -5.5 -4.0 -2.5 -1.2 -0.2 -2.0 0.9 1.4 1.5 1.2 1.1 3.4 9.6 6.2Adjusted of temporary & one-off measures -6.9 -5.6 -4.0 -2.5 -1.2 -0.2 1.5 1.3 1.6 1.5 1.2 1.1 4.6 11.3 6.7
-5.9 -5.6 -4.0 -2.5 -1.2 -0.2 1.3 0.3 1.6 1.5 1.2 1.1 2.7 8.5 5.7
Cyclically adjusted -4.9 -3.4 -2.5 -1.6 -1.0 -0.5 -1.3 1.4 1.0 0.9 0.6 0.5 4.6 9.0 4.4Structural -5.3 -3.6 -2.5 -1.6 -1.0 -0.5 2.2 1.8 1.1 0.9 0.6 0.5 5.8 10.7 4.9Structural net of special factors -4.4 -3.6 -2.5 -1.6 -1.0 -0.5 2.0 0.8 1.1 0.9 0.6 0.5 3.9 7.9 3.9
Structural primary -0.9 0.8 1.9 2.7 3.4 3.9 2.6 1.8 1.1 0.8 0.7 0.5 7.4 12.2 4.9Structural primary net of special factors 0.0 0.8 1.9 2.7 3.4 3.9 2.3 0.8 1.1 0.8 0.7 0.5 5.5 9.4 3.9
memo itemstemporary measures & one-off measures 0.5 0.1 0.0 0.0 0.0 0.0 -3.5 -0.4 -0.1 0.0 0.0 0.0 -1.2 -1.7 -0.5special factors -1.0 0.0 0.0 0.0 0.0 0.0 0.2 1.0 0.0 0.0 0.0 0.0 1.8 2.8 1.0temporary & one-off measures & special factors -0.5 0.1 0.0 0.0 0.0 0.0 -3.3 0.6 -0.1 0.0 0.0 0.0 0.7 1.1 0.5output gap (EC- Spring 2013 | MF (FSD 2013-17) -3.4 -4.5 -3.4 -1.9 -0.6 0.6 -1.6 -1.1 1.1 1.5 1.4 1.1 -2.6 1.4 4.0cyclical component (EC-Spring 2013|MF (FSD 2013-17) -1.6 -2.0 -1.5 -0.9 -0.3 0.3 -0.7 -0.5 0.5 0.7 0.6 0.5 -1.2 0.6 1.8interest payments (EDP) 4.4 4.4 4.4 4.3 4.4 4.4 0.3 0.0 0.0 0.0 0.0 0.0 1.6 1.6 0.0
% of GDP Annual change (p.p. of GDP)
Adjusted of temporary & one-off measures & special factors
32 | Analysis of the Fiscal Strategy Document 2013-2017 Portuguese Public Finance Council

Chart 12 – Fiscal balances (% of GDP) Overall fiscal balance and primary fiscal balance
(headline figures) Structural balance and primary structural balance
(net of special factors)
Source: INE, Ministry of Finance. CFP calculations. | Notes: The structural balances are adjusted of special factors.
The fiscal adjustment is strongly contingent upon the measures implemented and their composition over the course of the time frame. The change in the primary structural balance measures the consolidation effort required to achieve the budget targets set out in the FSD. For 2013, the FSD assumes a change in that balance net of special factors of around 0.8% of GDP. However the FSD report identifies the need for measures of a considerably higher value totalling 3.5% of GDP (3.2% of which were originally planned in SB/2013 plus an additional 0.3% of GDP identified during the 7th review of the EFAP). It thus appears that this discrepancy was brought about by the need to compensate the impact of two Constitutional Court decisions35, the deviation from the estimate for 2012 presented under SB/2013, and the respective outturn, as well as the effect of the harsher economic environment. The improvement in the budget balance in 2014 and subsequent years will stem from the ability to generate positive primary fiscal balances, which will depend strongly on the budget consolidation measures implemented.
35 Note that as a result of the 2012 Constitutional Court decision, the SB/2013 provided for the partial repayment of the holiday pay to civil servants and pensioners, from January 2013 onwards. However, Constitutional Court Judgment no. 187/2013 of 5th April declared the measure to suspend the holiday bonuses approved in the SB/2013 to be unconstitutional, and so that suspension was revoked, with effects back to January of that year. Portuguese Public Finance Council Analysis of the Fiscal Strategy Document 2013-2017 | 33

5.3 COMPOSITION OF FISCAL ADJUSTMENT EFFORTS
With the exception of 2013, the consolidation of public finances until 2017 builds on a fiscal adjustment almost solely based on public spending cuts. 36 The FSD/2013 forecasts indicate that from 2010 to 2017 over ¾ of the structural adjustment will be achieved on the spending side, as shown in Chart 13. The distribution of the effort implicit in these forecasts will result above all, from the increasing contribution of primary current expenditure savings, particularly from compensation of employees and social transfers, in contrast with the declining contribution of (the decrease in) capital expenditure. International experience suggests that the likelihood of the budget adjustment to be successful increases the more it is based upon permanent cost reduction measures, as it makes the adjustment less likely to be reversed in the future.
Chart 13 – Fiscal consolidation effort in structural terms - Cumulative composition of structural adjustment implicit in FSD 2013-17
Source: INE and Ministry of Finance. CFP calculations. | Note: The composition of the structural adjustment is assessed by the change in the budget aggregates, in structural terms, with reference to the change in the structural balance. The structural figures are net of the business cycle effects and the temporary measures, one-off measures and special factors described in footnote no. 33.
In order to control spending, the introduction of a wide-ranging spending rule in the Portuguese budgetary process should make the achievement of the structural adjustment objective more feasible. The introduction of budgetary spending rules has proved to be critical to enhance adjustment efforts. As highlighted by the OECD37, a spending rule not only provides for more timely monitoring of the budget outturn by signalling possible deviations, it also supports the performance of the structural balance rule, since it allows compliance with that rule to be based, in part, on the developments of a real time variable.
36 The fulfillment of these forecasts would lead to an adjustment effort, by the end of the EFAP in 2014, split into 61% on the expenditure side and 39% on the revenue side. 37 Economic Survey of Portugal, July 2012
34 | Analysis of the Fiscal Strategy Document 2013-2017 Portuguese Public Finance Council

Table 5 – Change in adjusted budget aggregates (2012-2017)
Source: INE and Ministry of Finance. CFP calculations. | Note: The changes do not necessarily match the differences between amounts as a percentage of GDP due to rounding.
The proposed fiscal consolidation strategy assumes the current tax burden level will continue.38 Over the time frame of the FSD/2013, tax revenues rise in line with the growth of output.39 From 2013 onwards the revenue from indirect taxes increases both as a percentage of GDP and in nominal terms. It does not appear to be affected by measures included in the FSD and which impact on households’ disposable income40.
The largest contribution to the fiscal consolidation from 2012 to 2017 will come from expenditure that will decline by 4.6 p.p. of GDP over the time frame of the forecasts. Following an increase in spending in 2013 vis-à-vis 2012, basically due to the restoring of Christmas and holiday bonuses for civil servants and pensioners, public expenditure is expected to return to a downward course. The adjustment in expenditure will be sharper in 2014, and from thereafter its relative weight in GDP is expected to fall steadily until 2017. Thus, from 2012 to 2017 all spending categories are expected to decrease mainly as regards compensation of employees and social transfers (-1.5 and -1.3 p.p. of GDP, respectively). The expected change in capital expenditure will also contribute to this decrease and a fall of 0.6 p.p. of GDP is predicted up to 2017. In nominal terms spending should decrease until 2015 (1,211 M€ relating to primary expenditure), and then from 2016 onwards this trend will be reversed, due in essence to social transfers and intermediate consumption. The relative weight in GDP of interest payments will stabilise over the time frame of the forecasts and will benefit from a significant reduction of the stock effect, as well as the relative stabilisation of the average cost of debt over the course of the projection period.
However, the absence of detail on the consolidation measures envisaged to achieve the downward trajectory of expenditure undermines the transparency, feasibility and
38 This paragraph and the next benefit from the numerical adjustments set out in Table 5. 39 However, the value of 2013 tax revenue has been revised downwards as compared with SB/2013 (-1752 M€; -0.7 p.p. of GDP) over half of which is due to changes in indirect taxes (-1102 M€; -0.5 p.p. of GDP). 40 In fact, there has been a decrease in the elasticity underlying this revenue component over the time frame of the FSD/2013.
Percentagem do PIB | Percentage of GDP Variação p.p. PIB | Change p.p. GDP2012 2013 2014 2015 2016 2017 2010/12 2010/13 2010/14 2010/17 2012/17
Valores ajustados | Adjusted for temp. measures & special factorsReceita Total | Total revenue 40.7 42.6 42.2 41.7 41.6 41.7 0.7 2.6 2.2 1.8 1.1
Receita corrente | Current revenue 39.6 41.5 41.3 40.8 40.7 40.8 0.8 2.7 2.5 2.0 1.3Receita fiscal |Tax revenue 22.7 24.1 24.1 24.2 24.4 24.7 0.6 2.0 2.0 2.5 1.9
Impostos indiretos | Indirect taxes 13.6 13.2 13.3 13.5 13.7 13.9 0.3 -0.1 0.0 0.5 0.2Impostos directos | Direct taxes 9.1 10.9 10.8 10.7 10.7 10.8 0.3 2.1 2.0 2.0 1.7
Contribuições Sociais | Social contributions 11.6 12.0 11.9 11.4 11.1 11.1 -0.7 -0.3 -0.4 -1.2 -0.5Das quais: efectivas| of which: actual soc. contr. received 9.1 9.3 9.2 9.1 9.0 9.1 0.0 0.2 0.1 0.0 0.0
Vendas e outras receitas correntes | Sales & other current rev. 5.2 5.3 5.2 5.2 5.2 5.0 0.8 0.9 0.8 0.7 -0.1Receitas de capital | Capital transfers received 1.1 1.1 0.9 0.9 0.9 0.9 -0.1 0.0 -0.3 -0.3 -0.2
Despesa Total | Total expenditure 46.6 48.2 46.2 44.2 42.9 41.9 -2.1 -0.4 -2.5 -6.7 -4.6Despesa Primária | Primary expenditure 42.2 43.8 41.8 39.9 38.5 37.6 -3.6 -2.0 -4.0 -8.3 -4.6
Despesa Corrente Primária | Current primary expend. 39.9 41.8 39.9 38.0 36.8 35.9 -2.2 -0.3 -2.2 -6.2 -4.0Consumo intermédio | Intermediate consumption 4.6 4.4 4.4 4.1 4.0 3.9 -0.1 -0.3 -0.3 -0.8 -0.6Despesas com pessoal | Compensation of employees 9.9 10.6 9.9 9.1 8.7 8.4 -2.4 -1.6 -2.3 -3.9 -1.5Prestações sociais | Social transfers 22.6 23.9 22.7 22.1 21.7 21.3 0.7 1.9 0.8 -0.7 -1.3
que não em espécie | other than in kind 18.0 19.1 18.2 17.7 17.4 17.1 0.9 2.0 1.1 0.0 -0.9Subsídios e outra despesa corrente | Subsidies & other current exp. 2.9 2.9 2.8 2.6 2.4 2.4 -0.4 -0.3 -0.5 -0.9 -0.5
Despesas de capital | Capital expenditure 2.3 2.1 2.0 1.9 1.7 1.7 -1.4 -1.7 -1.8 -2.0 -0.6Juros (PDE) | Interest paid (EDP) 4.4 4.4 4.4 4.3 4.4 4.4 1.6 1.6 1.6 1.6 0.0
Saldo global (PDE) | General government balance (EDP) -5.9 -5.6 -4.0 -2.5 -1.2 -0.2 2.7 3.1 4.7 8.5 5.7Saldo Primário (PDE)| Primary balance (EDP) -1.5 -1.2 0.3 1.8 3.1 4.2 4.3 4.7 6.2 10.0 5.7
Carga fiscal | Tax burden 32.0 33.5 33.4 33.4 33.4 33.8 0.7 2.2 2.1 2.5 1.8Despesa corrente | Current expenditure 44.3 46.1 44.2 42.3 41.1 40.3 -0.6 1.2 -0.7 -4.7 -4.0Dívida Pública | Public Debt (Maastricht def.) 123.6 122.3 123.7 122.5 119.3 115.0 29.6 28.3 29.7 21.0 -8.6
Portuguese Public Finance Council Analysis of the Fiscal Strategy Document 2013-2017 | 35

credibility of the fiscal forecasts. The FSD/2013 defines the financial constraints imposed on general government and quantifies the consolidation effort required to meet them, but it does not explain which measures are planned to achieve it.41 A transparent strategy should identify policies and their impacts on the public finance aggregates as well as their interaction with the variables of the underlying macroeconomic scenario, while also taking into account the possible outcomes of the Strategy for Economic Growth, Employment and Industrial Development for the period 2013-2020. For the sake of fiscal transparency and in accordance with European legislation42, which is being incorporated into Portuguese law, it is important for the FSD to include a projection of general government revenue and expenditure incorporating policy measures that have been adopted (no policy change scenario). The measures required and planned to achieve the medium-term goals should then be specified and quantified with reference to this scenario. The information that was subsequently released on the fiscal consolidation measures envisaged and their effects, although not entirely incompatible, reflects a different composition when compared to the FSD. Therefore, the CFP recommends the Government to update the composition of the adjustment underlying the general government accounts forecast for the period 2013-2017,43 following the approval of the fiscal consolidation measures that should occur in 2013, to ensure consistency between estimated changes in the various revenue and spending items and the estimated changes in the fiscal balance.
The CFP also recommends that in the future, whenever estimates and projections for the general government accounts are published they should be accompanied in timely manner by specific and detailed figures covering the underlying measures. As well as contributing to the feasibility of those measures within the expected time periods, this will also provide for proper interpretation of the projections, and the necessary identification of the various risks of achieving the budget targets set.
Similarly, as there is an economic growth strategy for the period 2013-2020 and one of its goals is fiscal consolidation,44 the CFP also suggests that the medium-term budgetary framework be revised in light of the impact assessment of that strategy.
In the future, in order to fulfil its mission the CFP will require timely access to full details of the measures proposed, including their expected impact.
5.4 COMPARISON WITH THE FSD/2012
The update of the medium-term fiscal forecast changes the pace of the adjustment over the coming years and the composition of the consolidation in 2013 as compared with the FSD/2012. According to the FSD/2013, a restrictive fiscal policy shall be maintained
41 After the publication of the FSD/2013, a letter sent on the 3rd May to the institutions that provide financial assistance to Portugal, and published in the press, listed a set of measures to be implemented from 2013-15. This set covers a shorter period than the FSD/2013 and was released under the framework of the so called “Reform of the State and the Pension System”, aimed at achieving savings of 4,788 M€ by 2015. The composition and the time scale of the measures included in the FSD/2013 may not coincide with those set out in the aforesaid letter. 42 Directive 2011/85/EU of 8 November 2011. 43 Table II.9 of the FSD. 44 Slide 4 of the slideshow “Strategy for Growth, Employment and Industrial Development 2013-2020”.
36 | Analysis of the Fiscal Strategy Document 2013-2017 Portuguese Public Finance Council

in order to correct the public finance imbalances, and to ensure compliance with the commitments made under the EFAP and in the European Union. The difference between the FSD/2013 and the previous document consists, mainly, in the change of the pace of adjustment, as a result of the MTO deadline being postponed for two years.
The largest change to the composition of the adjustment effort is expected in 2013. Indeed the fiscal adjustment to be undertaken in 2013 is now wholly provided by revenue, whereas in FSD 2012 it was based almost solely on the spending side. This change springs from the governmental option, expressed in SB/2013, of achieving a substantial increase in taxation45 to offset: i) the increase in compensation of employees and pensions in 2013 due to the restoring of the holiday bonus to civil servants and 1.1 bonuses to pensioners, as a result of a Constitutional Court decision in 2012; ii) the sharp deviation in tax revenue recorded in 2012. Nonetheless, the deviation in tax revenue in 2012 forced a downward correction in the estimated level of 2013 tax revenue.46
Over the remaining time frame of FSD/2013 (2014-2017) the improvement in the structural balance will be based essentially on a decrease in structural expenditure. In line with the projections in FSD/2012, albeit with a different composition, the structural adjustment from 2014 to 2017 will require a consolidation effort based essentially on a major contribution from expenditure.
Chart 14 – Composition of the structural adjustment estimated in FSD/2013 and FSD/2012 (non-cumulative annual figures)
Source: Ministry of Finance. CFP calculations. | Note: The composition of the structural adjustment is assessed by the structural change in the budget aggregates with reference to the change in the structural balance. The structural figures are net of the business cycle effects and the temporary measures, one-off measures and special factors described in Table 6.
45 Among the set of measures that embody the increase in taxation in SB/2013, we stress: the personal income tax surcharge of 3.5% on all taxable income, the introduction of measures that alter the progressive nature of tax on earned income (income tax bands reduced from 8 to 5), as well additional taxes on capital and property, in the form of higher tax withholding rates and the revaluation of properties for Municipal Property Tax (IMI) purposes. 46 Note that (adjusted) tax revenue in 2012 was 3,602 M€ (-1.9 p.p. of GDP) below the figure in the FSD/2012, and this led to the revising of the tax revenue forecast for 2013. In effect, as a result of this change, the tax revenue forecast for 2013 in the FSD/2013 was revised downwards (-1,506 M€ or -0.5 p.p. of GDP) compared to the previous forecast in the FSD/2012.
Portuguese Public Finance Council Analysis of the Fiscal Strategy Document 2013-2017 | 37

The excessive deficit correction and the medium-term objective for the structural balance are postponed for two more years. Under the FSD/2013 the excessive deficit situation will be corrected in 2015, instead of 2013, while the achievement of a structural deficit of 0.5% of GDP is now expected for 2017, also two years later than the date set in the FSD/2012.
Chart 15 – Change in structural deficit underlying the medium-term strategies - Convergence to the medium-term objective (MTO) as % of GDP
Source: INE and Ministry of Finance. CFP calculations. Note: In the case of FSD/2012 it is assumed that a structural deficit of 0.5% of GDP will be achieved in 2017, thereby meeting the medium-term objective.
Following the revision of the budget targets, expenditure’s contribution to the adjustment effort will be greater. An assessment of the adjustment effort required to ensure compliance with the new goals to correct the excessive deficit and the achievement of the medium-term objective reveals that the postponement of these targets for two more years will require a more spending-focussed adjustment. The calculations are set out in Table 6. The contribution of this aggregate will account for around ¾ of the adjustment effort to be undertaken, vis-à-vis the average 60% estimated in the previous FSD to achieve the same goals.47 Capital expenditure explains the increased effort to adjust spending. It is a matter of some importance to the extent that indiscriminate cuts in public investment can jeopardise the economy’s potential growth rate.
In a situation where the debt ratio is under pressure, achieving a primary fiscal surplus only in 2014 increases the distance of the turning point in the public debt trajectory. The FSD/2012 estimated primary fiscal surpluses would be achieved as early as 2012, in line with the Government’s projections in the FSD/2011 (which covered the period 2011-15). Primary fiscal surpluses from 2012 to 2016 underlying budgetary forecasts in the FSD/2012 totalled 12.5% of GDP, which is higher than the figure in the FSD/2013 of 5.3% of GDP which will arise from 2014 onwards. Postponing the achieving of a fiscal surplus for two more years
47The comparison takes as a reference the years in which these targets are to be reached under the trajectory set out in each FSD, rather than a direct year on year comparison. Therefore, for the purpose of assessing the consolidation effort required to correct the excessive deficit situation, the FSD/2012 forecast for 2013 is compared to the FSD/2013 forecast for 2015. Similarly accessing the effort to meet the medium-term objective involves comparing the FSD/2012 forecast for 2015 with the current forecast (in FSD/2013) for 2017.
38 | Analysis of the Fiscal Strategy Document 2013-2017 Portuguese Public Finance Council

will continue to compromise the reduction of the public debt ratio, requiring increasingly larger primary fiscal surpluses in order to reverse the public debt trajectory in a persistent and sustainable manner. As a result of this change, among other factors, the public debt ratio has been repeatedly revised upward.
Table 6 – Changes in the composition of the fiscal adjustment required to meet the excessive deficit correction target and the medium-term objective (MTO)
Source: INE and Ministry of Finance. CFP calculations. | Notes: (i) figures relating to 2010 match those in the latest excessive deficit procedure notification that underpinned the budgetary forecasts underlying each of the fiscal strategy documents (EDP March 2012 and EDP March 2013, respectively); (ii) temporary measures, one-off measures and special factors in 2010 match the figures in the budgetary forecasts of each FSD (iii) the business cycle components of revenue and expenditure used in the FSD/2012 budgetary forecasts were recalculated by the CFP according to the new method adopted in the meantime by the European Commission48 and used in FSD/2013, taking as a basis the output gap in the FSD/2012, so as to make it comparable with the new business cycle components breakdown (revenue and expenditure) in the FSD/2013 forecasts. Accordingly the figures shown here referring to the FSD/2012 differ from those used in previous CFP Reports and those shown in the FSD/2012. For the reasons mentioned above, the figures for 2010 that should serve as a benchmark for a comparison with the end of the time frame of each FSD are different, corresponding to the figures that would be obtained in real time, on the basis of the information available at the time each document was published. In the case of the FSD/2013 they represent the latest information available. Compared to the figures published in the CFP Report No. 2/2013, there may be slight differences as the cyclical component source used here is the Ministry of Finance estimate rather than the European Commission estimate [Spring 2013 forecasts], because the latter does not include estimates for the period 2015-2017.
48 See Gilles Mourre, George-Marian Isbasoiu, Dario Paternoster and Matteo Salto, “The cyclically-adjusted budget balance used in the EU fiscal framework: an update”, European Economy, Economic Papers, Vol. 478, March 2013, EC, Brussels (available at ec.europa.eu/economy_finance/publications/economic_paper/2013/ecp478_en.htm).
∆ p.p. GDP % ∆ p.p. GDP %Total Structural Revenue net of SF 39.7 43.0 42.7 - 3.3 44% 3.0 36%Total Structural Expenditure net of SF 48.6 44.4 43.3 - -4.2 56% -5.3 64% Primary current Expend. net of SF 42.1 37.1 36.3 - -4.9 67% -5.7 69% Capital expenditure 3.7 2.7 2.2 - -1.0 13% -1.5 18% Interest payments 2.9 4.6 4.8 - 1.8 -24% 1.9 -23%Structural Budget Balance net of SF -8.9 -1.4 -0.5 - 7.4 100% 8.3 100%Memo items:
Structural Primary Balance net of SF -6.0 3.2 4.2 - 9.2 124% 10.2 123% Primary Structural Expenditure net of SF 45.7 39.8 38.5 - -5.9 -80% -7.2 -87%
∆ p.p. GDP % ∆ p.p. GDP %Total Structural Revenue net of SF 40.0 42.7 41.8 41.7 1.8 26% 1.7 22%Total Structural Expenditure net of SF 48.3 46.3 43.4 42.2 -4.9 74% -6.1 78% Primary current Expend. net of SF 41.8 39.9 37.1 36.1 -4.6 69% -5.6 72% Capital expenditure 3.7 2.1 1.9 1.7 -1.8 27% -2.0 26% Interest payments 2.8 4.4 4.3 4.4 1.5 -23% 1.6 -20%Structural Budget Balance net of SF -8.3 -3.6 -1.6 -0.5 6.7 100% 7.9 100%Memo items:
Structural Primary Balance net of SF -5.5 0.8 2.7 3.9 8.2 123% 9.4 120% Primary Structural Expenditure net of SF 45.5 41.9 39.0 37.8 -6.5 96% -7.7 98%
FSD/2012
2010 2013 2015 2017
MTO2010/15 2010/17
Deficit 3% MTO2010/13 2010/15
FSD/2013
2010 2013 2015 2017Deficit 3%
Portuguese Public Finance Council Analysis of the Fiscal Strategy Document 2013-2017 | 39

40 | Analysis of the Fiscal Strategy Document 2013-2017 Portuguese Public Finance Council

REFERENCES AMECO, Annual Macro-Economic Databse of the European Commission, May 2013
Bank of Portugal, Economic Bulletin – Spring 2013
European Commission, European Economic Forecast - Spring 2013
IGCP, Online Statistics, April 2013
IMF, World Economic Outlook, April 2011
IMF, World Economic Outlook, April 2013
INE, Quarterly National Accounts by Institutional Sector, 4th quarter of 2012, April 2013
INE Online Statistics, April 2013
INE, Excessive Deficit Procedure (1st Notice of 2013), April 2013
Ministry of Finance, Fiscal Stategy Document 2012-2016, April 2012
Ministry of Finance, Budget Report for 2013, October 2012
Ministry of Finance, Fiscal Stategy Document 2013-2017, April 2013
OECD, Economic Survey of Portugal, July 2012
Portuguese Public Finance Council Analysis of the Fiscal Strategy Document 2013-2017 | 41

Portuguese Public Finance Council
Praça de Alvalade, n.º 6 – 10.º, 1700-036 Lisbon, Portugal TEL +351 211 024 400 | FAX +351 211 021 870
www.cfp.pt
42 | Analysis of the Fiscal Strategy Document 2013-2017 Portuguese Public Finance Council