analysis of the microclimate of sÃo cristÓvÃo … · and its influence in heating systems,...
TRANSCRIPT

ANALYSIS OF THE MICROCLIMATE OF SÃO CRISTÓVÃO AND ITS INFLUENCE IN HEATING SYSTEMS,
VENTILATING AND AIR CONDITIONING (HVAC)
Monteiro, M.F.M., [email protected], T.L.P, [email protected] Filho, M.A.F, [email protected]
State University of Rio de Janeiro, PPG-Mechanical Engineering,
State University of Rio de Janeiro,Fonseca Teles Street, 121, 1st floor, Rio de Janeiro, 20940-200, Brazil
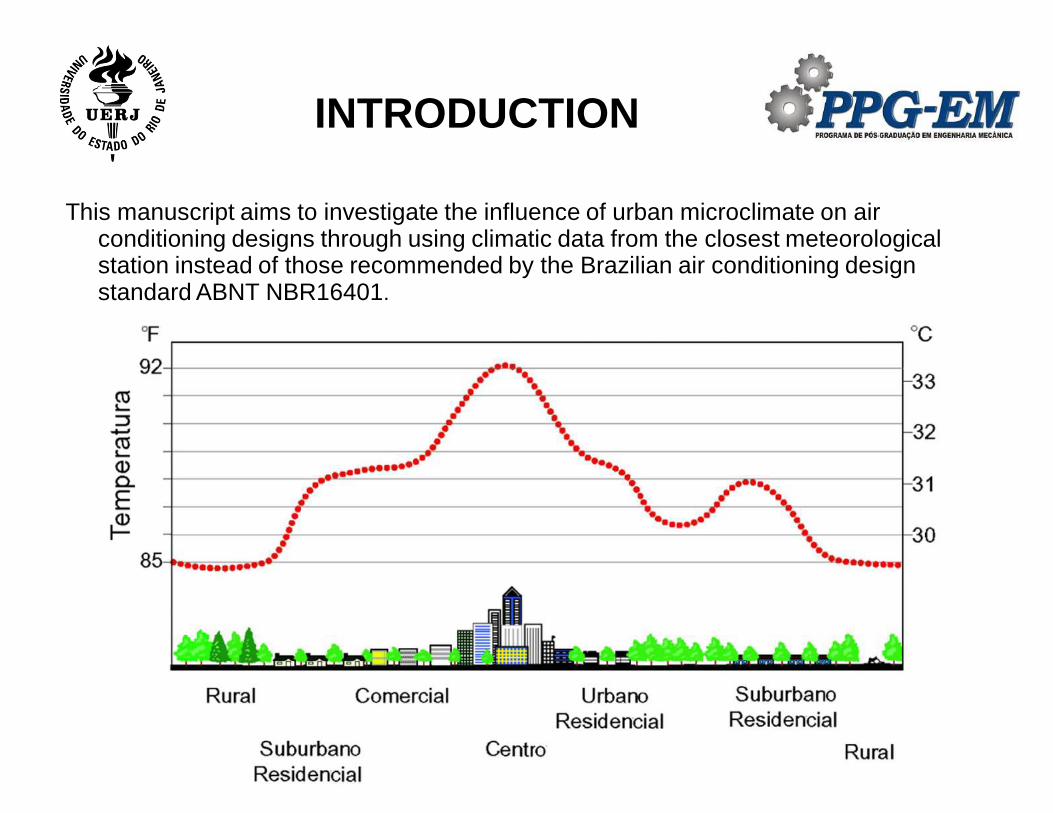
This manuscript aims to investigate the influence of urban microclimate on air conditioning designs through using climatic data from the closest meteorological station instead of those recommended by the Brazilian air conditioning design standard ABNT NBR16401.
INTRODUCTION
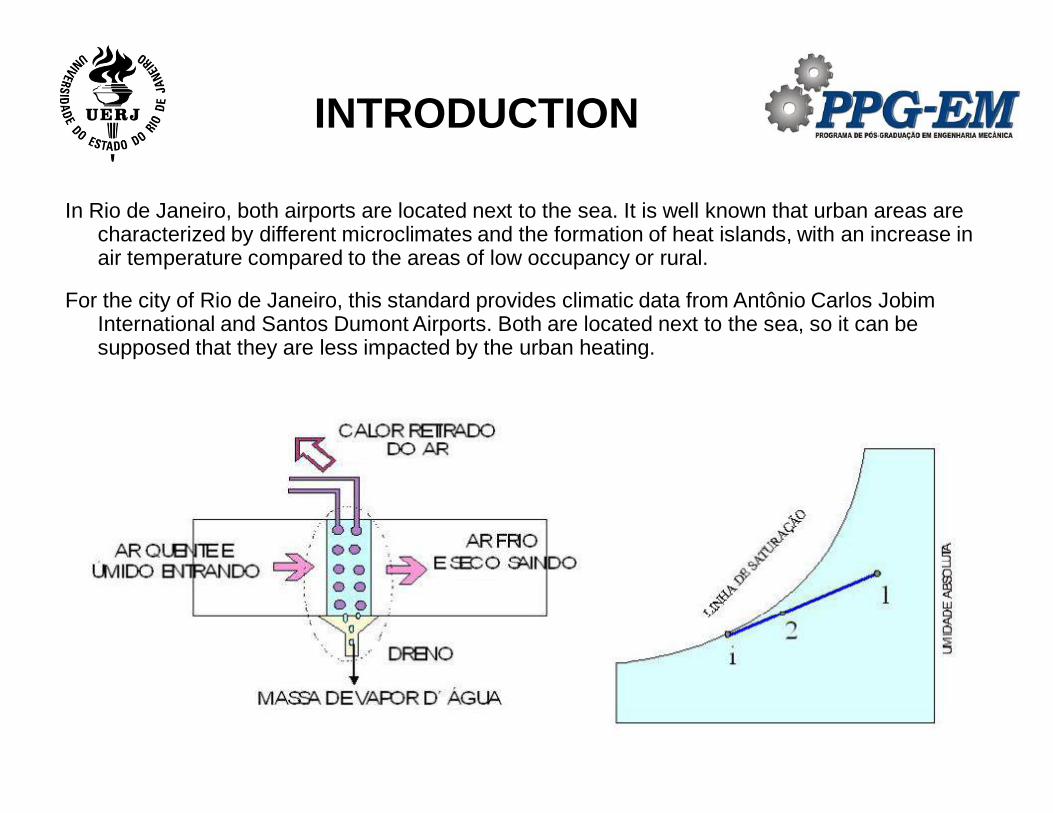
In Rio de Janeiro, both airports are located next to the sea. It is well known that urban areas are characterized by different microclimates and the formation of heat islands, with an increase in air temperature compared to the areas of low occupancy or rural.
For the city of Rio de Janeiro, this standard provides climatic data from Antônio Carlos Jobim International and Santos Dumont Airports. Both are located next to the sea, so it can be supposed that they are less impacted by the urban heating.
INTRODUCTION

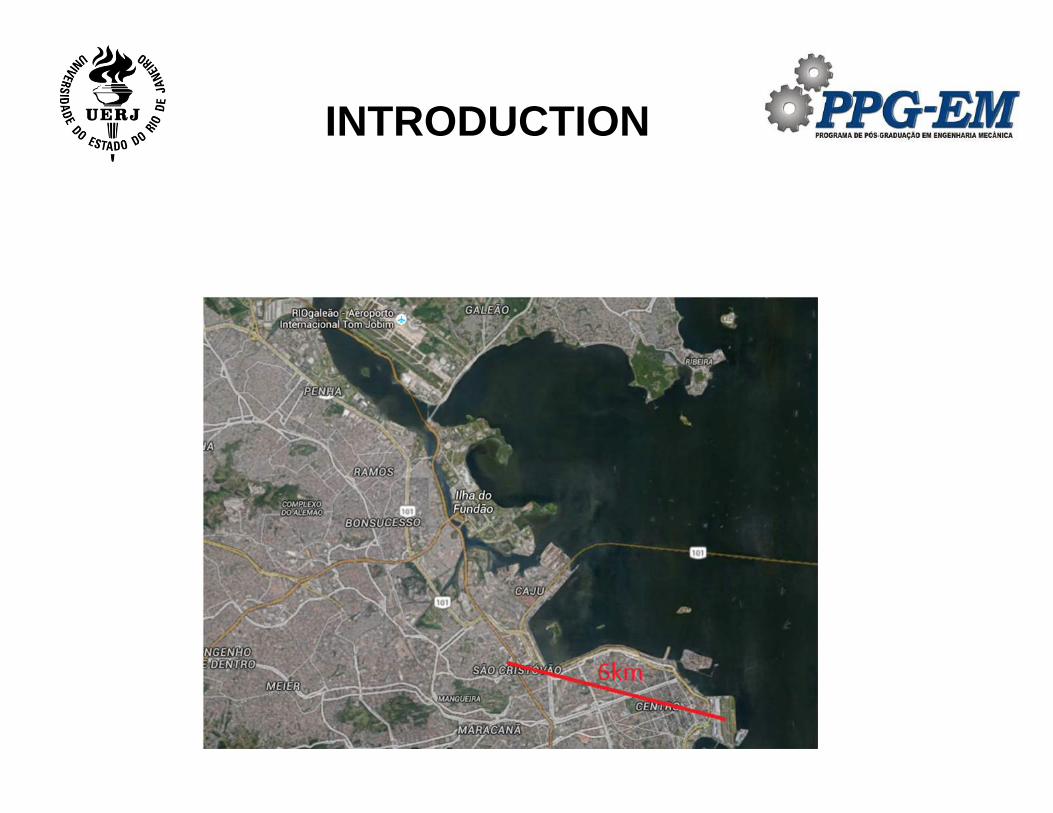
The Figure presents a map showing that it is far respectively, 6 km and 10 km, from the Santos Dumont and Antonio Carlos Jobim airports. For any place in the Rio de Janeiro city, there is no indication in the NBR 16401 about what climatic data must be chosen. It is well known that air conditioning designers adopt the highest temperature data.
INTRODUCTION

INTRODUCTION
INTRODUCTION

The São Cristóvão meteorological station belongs tothe Fundação Instituto de Geotécnica (Geo-Rio),within the Rio de Janeiro's City Hall, a departmentcreated for monitoring the rainfall in order to warn thepopulation about risks of slope slips. It is located at thelatitude of -22.896667, the longitude of -43.221667and an elevation of 25 meters, on the top of the Geo-Rio building. This station measures and recordstemperature, humidity, pressure, rainfall and windspeed at 15 minute intervals. It has supplied access todownload data since 2002, but the period used here isfrom 2003 to 2015 (Alerta Rio, 2016).
Methodology
GEO-RIO
Rua Campo de São Cristóvão, 268

The dry bulb temperature, dew point (DPT) and wet bulb temperature and wind speedcorresponding to different annual percentage representing the value that is exceeded onaverage by the percentage indicated the total number of hours per year (8760h). The 0.4%,1.0% and 2.0% are exceeded, on average, 35h, 88h, 175h per year, respectively, for the recordperiod. (ASHRAE, 2013).
Methodology
Meteorological data sets used for the calculations may contain missing values. Gaps up to 6 hours were filled by linear interpolation to provide the most complete possible
time series. When the data at the right time are lacking, they can be replaced by data up to 0.5 hours before or after, when available (ASHRAE, 2013).
Steps have been taken to ensure that the number and distribution of data missing not introduce significant deviations in the analysis. The number of dry bulb temperature values each hour for the month, after filling by interpolation must be at least 85% of the total hours for the month and the difference between the number of temperature
data observed between day and night should be less than 60 (ASHRAE, 2013).
Some months were also eliminated during the additional quality control checks. The dry bulb temperature of a station will only be used for design calculation if there was data from at least eight months that met the quality control and selection criteria from the registration period for each month of the year. For example, we must have at least
eight months of January, February, March, April, May, June, July, August, September, October, November and December (ASHRAE, 2013).
Methodology
Simulation
- Calculation of thermal load - HAP by Carrier- Dynamic effect of the building
Methodology

The plant of the building used for study case is shown in Figure. The building has an area of 120m² and it is internally divided into administrative room, reception, security room, circulation area,
information technology room, dining room and bathrooms. It is placed in the São Cristóvão neighborhood, and for this investigation, strategically located where there is a meteorological
station.
Methodology

Methodology
Ambientes Área (m²) Pé Direito (m) NBR 16401-3 ANVISA
(m³/h) (m³/h)
Guarita ISI 9,9 3,2 31 27
Sala de Crachá 4,2 3,2 21 27
TIC 16,2 3,2 43 27
Briefing 7,1 3,2 95 102
Circulação 7,6 3,2 27 17
Recepção 45,4 3,2 287 255
Supervisor - Vigilância 12,5 3,2 50 54
Copa p/ vigilância 18,3 3,2 339 204

The table presents DBT, CWBT and DPT at the three frequency levels for the Santos Dumont and Antônio Carlos Jobim airports reproduced from the NBR 16401 and also those generated for São Cristóvão.
Results

ResultsAfter defined the entry temperatures, thermal load calculations were made in order to evaluate their
influence on the air conditioning design. The table shows the thermal loads corresponding to the three places at the three frequency levels.
Thermal Load 0.40% 1.00% 2.00%
Antônio C. Jobim 40.4kW 38.6kW 37.5kW
Santos Dumont 38.1kW 36.5kW 35.7kW
São Cristóvão 37.9kW 36.3kW 34.7kW
Results
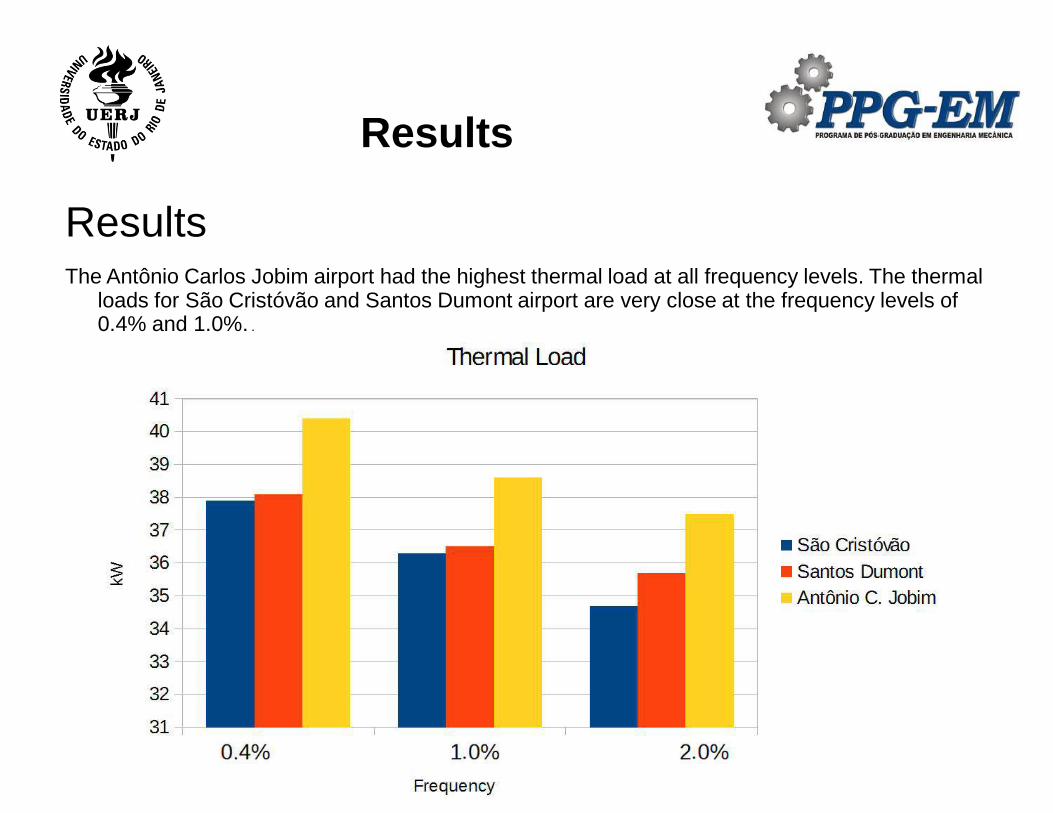
ResultsThe Antônio Carlos Jobim airport had the highest thermal load at all frequency levels. The thermal
loads for São Cristóvão and Santos Dumont airport are very close at the frequency levels of 0.4% and 1.0%. .
Results

As soon as the costs of automated meteorological stations have decreased, moresuitable climatic data have become available. On the other hand, HVAC designer usecommercial software for thermal load calculation where it is comfortable to pre-selectclimatic data ready available, usually that presented in the design standards.
The DBTs calculated for São Cristóvão have confirmed that there is an increasingtemperature gradient from the south to the north in the study region. Since SãoCristóvão is a neighborhood where buildings up to 2 floors are predominant, theelevation of its meteorological station has contributed to a negligible urban heatingperception.
Although the DBT for São Cristóvão is midway between the others, the thermal load forSão Cristóvão was the lowest. This can be justified due to its lower air humidity.
The variations of the thermal loads among the sites chosen are around 6% for thestudied construction, which does not significantly interfere in the selection of the airconditioning equipment. At first the size of the building should be higher for thatpercentage has a significant impact on thermal load calculation.
This research will go on encompassing other sites within the Rio de Janeiro metropolitanregion.
Conclusion

References
ASSOCIAÇÃO BRASILEIRA DE NOMAS TÉCNICAS - ABNT, 2008. NBR 16401-1:Instalações de Ar Condicionado – Sistemas Centrais e Unitários. Parte 1: Projeto dasinstalações. Rio de Janeiro, RJ, Brazil.
American Society of Heating, Refrigerating, and Air-Conditioning Engineers -ASHRAE., 2013. Handbook Fundamentals. Chapter.14. Climatic Design Information.Atlanta, GA, USA.
Carrier, 2016. HAP - Hourly Analysis Program, version 4.9.1, USA.
Sistema de Alerta Rio da Prefeitura do Rio de Janeiro, http://alertario.rio.rj.gov.br/,2016, Rio de Janeiro, RJ, Brazil
Stull, R.B., 1993. An Introduction to Boundary Layer Meteorology, Kluwer AcademicPublishers, Dordrecht.
References