analysis of the static mechanical properties of iron …
TRANSCRIPT

MASTER IN INDUSTRIAL ENGINEERING
MASTER THESIS
ANALYSIS OF THE STATIC MECHANICAL
PROPERTIES OF IRON-BASED ALLOYS DEPOSITED BY EXTREME HIGH-SPEED LASER MATERIAL
DEPOSITION FOR ADDITIVE MANUFACTURING OR REPAIR APPLICATIONS
Student Montes Martínez, Edurne Director Pinto Cámara, Charles Richard Institute Fraunhofer ILT, Aachen Academic year 2017/2018
Aachen, 27 September, 2018

Edurne Montes Martínez Analysis of the static mechanical properties of iron-based alloys deposited by Extreme high-speed laser
material deposition for additive manufacturing or repair applications I
BILBOKO INGENIARITZA ESKOLA
ESCUELA
DE INGENIERÍA DE BILBAO
Statement I hereby declare that I have written the present work independently and have used no sources other than those indicated in the bibliography. Items that are taken literally or by analogy from published or unpublished sources are identified as such. The drawings or illustrations in this work have been created by myself or provided with a corresponding source proof. This work was developed in the Fraunhofer institute for laser technique (ILT) and has not yet been submitted to any other examination authority in the same or similar form.
Aachen, 27 September 2018

Edurne Montes Martínez Analysis of the static mechanical properties of iron-based alloys deposited by Extreme high-speed laser
material deposition for additive manufacturing or repair applications II
BILBOKO INGENIARITZA ESKOLA
ESCUELA
DE INGENIERÍA DE BILBAO
Summary
(ENGLISH)
The objective of the following work is to analyze the feasibility of extreme high-speed laser material deposition advanced manufacturing process (EHLA) for the repair of E355 steel components. The verification is carried out by the deposition of materials in powder form with similar mechanical properties to the steel base. The selected powder materials to be deposited are low carbon AISI 430L ferritic stainless steel, heat treatable and low alloy steel AISI 4340 and case hardening steel 16MnCr5. A series of experiments are conducted in order to achieve the best-adapted combination of process parameters (laser power, mass flow of powder, speed of rotation of the piece and feed forward of the contribution among others) to achieve a low porosity, defect-free bonding and crack-free for the deposition of consecutive layers with a final thickness of 10 mm. Tensile specimens are sampled from repaired layers to analyze the static mechanical properties to evaluate whether the repair by these materials meet the quality requirement.
(DEUTSCH)
Gegenstand der folgenden Arbeit ist eine Machbarkeitsanalyse eines Hochgeschwindigkeits-Laserauftragsschweißverfahrens zur Reparatur von E355 Stahlkomponenten. Zur Überprüfung werden metallische Pulver verwendet, die hinsichtlich ihrer Eigenschaften identisch zum Basismaterial sind. Die ausgewählten Pulver sind ein nichtrostender, ferritischer AISI 430L Stahl mit einem niedrigen Kohlenstoffgehalt, sowie ein hitzebeständiger, niedriglegierter, nichtrostender AISI 4340 Stahl, als auch ein gehärteter 16MnCr5 Stahl. Das Experiment besteht aus einer Reihe von Versuchen zur Ermittlung der bestmöglichen Prozessparameter (Laserleistung, Pulvermenge, Rotationsgeschwindigkeit des Gegenstandes, Vorschub), um eine geringe Porosität, keine Schweißfehler und Risse, für die nachfolgenden Auftragsschichten bis zur finalen Stärke von 10 mm, zu gewährleisten. Darauffolgend werden diese Proben in einem Zugversuch hinsichtlich ihrer statisch-mechanischen Eigenschaften analysiert, um abschließend eine Aussage treffen zu können, ob die Reparatur durch diese Materialien den Anforderungen gerecht werden.

Edurne Montes Martínez Analysis of the static mechanical properties of iron-based alloys deposited by Extreme high-speed laser
material deposition for additive manufacturing or repair applications III
BILBOKO INGENIARITZA ESKOLA
ESCUELA
DE INGENIERÍA DE BILBAO
(ESPAÑOL)
El objetivo del siguiente trabajo es analizar la viabilidad del proceso avanzado de fabricación de deposición de material láser de alta velocidad para la reparación de componentes de acero E355. La verificación se llevará a cabo mediante la deposición de polvos metálicos con propiedades mecánicas similares a la base de acero. Los polvos seleccionados son acero inoxidable ferrítico AISI430L con bajo contenido de carbono, acero AISI4340 tratable térmicamente y de baja aleación y acero de cementación 16MnCr5. El proceso consistirá en la realización de una serie de experimentos con el fin de lograr la combinación de parámetros de proceso (potencia del láser, flujo masivo de polvo, velocidad de rotación de la pieza y avance de la contribución entre otros) que mejor se adapten y den baja porosidad, sin defectos de unión y sin grietas para la deposición de capas consecutivas de 10 mm de espesor final. Las muestras se usarán para crear muestras de tracción para analizar las propiedades mecánicas estáticas del material proporcionado y para concluir si la reparación por estos materiales cumple con los requisitos.

Edurne Montes Martínez Analysis of the static mechanical properties of iron-based alloys deposited by Extreme high-speed laser
material deposition for additive manufacturing or repair applications IV
BILBOKO INGENIARITZA ESKOLA
ESCUELA
DE INGENIERÍA DE BILBAO
Contents
Summary II
Contents IV
Figure Index VI
Table Index IX
Abbreviations and symbols X
1 Introduction 1
2 State of the Art 2 2.1 Laser Material Deposition (LMD) 2 2.1.1 Process Principle 2 2.1.2 Most important parameters of LMD 3 2.1.3 LMD in repair applications 3 2.2 Extreme high‐speed laser material deposition
process (EHLA) 4 2.2.1 Introduction 4 2.2.2 Process principle 4 2.2.3 Most important parameters of EHLA 5 2.3 Selection of powders and substrate 6 2.3.1 Application of the powders in LMD 9
3 Objective 10
4 Design of Experiments 11 4.1 System set-up 11 4.2 Experimental method 13 4.2.1 First Experimental Phase: process configuration for
one layer deposition 14 4.2.2 Second Experimental Phase: process configuration
for five consecutive layer deposition 16 4.2.3 Third Experimental Phase: process analysis for
continuous depositions of 3 mm thickness 17 4.2.4 Fourth Experimental Phase: metallographic analysis
and mechanical properties 17
5 Results 21

Edurne Montes Martínez Analysis of the static mechanical properties of iron-based alloys deposited by Extreme high-speed laser
material deposition for additive manufacturing or repair applications V
BILBOKO INGENIARITZA ESKOLA
ESCUELA
DE INGENIERÍA DE BILBAO
5.1 First Experimental Phase: process configuration for one layer deposition 21
5.2 Second Experimental Phase: process configuration for five consecutive layer deposition 22
5.3 Third Experimental Phase: process analysis for continuous depositions of 3 mm thickness 30
5.4 Fourth Experimental Phase: metallographic analysis and mechanical properties 40
5.4.1 Analysis AISI 4340 – Without cooling 40 5.4.2 Analysis AISI 4340 – With cooling 46 5.4.3 Analysis AISI 430L – Without cooling 52 5.4.4 Analysis AISI 430L – With cooling 53
6 Conclusions 64
7 References 65
Annex I 69 Metallography all experiments First and Second Phase of AISI
4340 69 First Experimental Phase 69 Second Experimental Phase 72
Annex II 74 Metallography all experiments First and Second Phase of AISI
430L 74 First Experimental Phase 74 Second Experimental Phase 77
Annex III 81 Metallography all experiments First and Second Phase of DIN
16MnCr5 81 First Experimental Phase 81 Second Experimental Phase 85 EDX measurements results 89

Edurne Montes Martínez Analysis of the static mechanical properties of iron-based alloys deposited by Extreme high-speed laser
material deposition for additive manufacturing or repair applications VI
BILBOKO INGENIARITZA ESKOLA
ESCUELA
DE INGENIERÍA DE BILBAO
Figure Index
Figure 1 Schematic process principle of conventional LMD process [2]. 2 Figure 2 Effect of laser power and powder mass flow on layer properties [10, 25, 26, 27, 28]. 3 Figure 3 Repair of Blade Tips using LMD [18]. 4 Figure 4 Schematic process principle of EHLA process [2]. 5 Figure 5 Schematic diagram of EHLA´s most important process parameters. 6 Figure 6 CAD drawing and manufacturers EHLA system from HORNET [2]. 11 Figure 7 Schematic representation of EHLA working distance and powder focus. 12 Figure 8 Summary of the Experimental Method Phases. 13 Figure 9 Sample preparation sketch. 15 Figure 10 Schematic representation of the process during the ND. 16 Figure 11 Schematic representation of same direction and zig-zag build-up strategies. 17 Figure 12 Sample manufacturing scheme and DIN 50125 B 4x20 tensile sample dimensions. 20 Figure 13 E.II-12 metallography: 2400 W laser power and 0.3 mm/u feed forward. 22 Figure 14 E.II-17 metallography: 2400 W laser power and 0.25 mm/u feed forward and 0.23 mm ND. 23 Figure 15 E.II-22 metallography: 5 layer deposition in zig-zag configuration 0.3 mm/u feed forward, 2400 W and 0. 3 mm ND. 23 Figure 16 E.I-13 metallography: 2200 W laser power and 0.35 mm/u feed forward. 24 Figure 17 E.III-10 metallography: 1800 W and 0.25 mm/u feed forward. 25 Figure 18 E.III-17 metallography: 1800 W, 0.25 mm/u feed forward and 0.08 mm ND. 26 Figure 19 E.III-18 metallography: 1800 W, 0.25 mm/u feed forward and 0.1 mm ND. 27 Figure 20 E.III-19 metallography: 1800 W, 0.25 mm/u feed forward and 0.12 mm ND. 27 Figure 21 E.III-21metallography: 2000 W, 0.25 mm/u feed forward and 0.15 mm ND. 27 Figure 22 EDX measurements of 16MnCr5 powder with chemical composition in different spectrums. 28 Figure 23 EDX measurements of 16MnCr5 powder with chemical composition in different spectrums. 29 Figure 24 SEM pictures of the 16MnCr5 powder particles with different magnifications: a) 200X, b) 400X, c) 1.00kX and d) 2.00kX. 29

Edurne Montes Martínez Analysis of the static mechanical properties of iron-based alloys deposited by Extreme high-speed laser
material deposition for additive manufacturing or repair applications VII
BILBOKO INGENIARITZA ESKOLA
ESCUELA
DE INGENIERÍA DE BILBAO
Figure 25 E.II-23 metallography: continuous deposition process, 2400 W laser power, 0.3 mm/u feed forward and 0.3 mm ND. 30 Figure 26 E.II-23: sample preparation a), edge crack metallography b), inter grain crack metallography c) inter grain phase metallography d). 31 Figure 27 E.II-23: EDX analysis with component mass percentage comparison between different spectrums. 32 Figure 28 E.II-23: EDX analysis with component mass percentage comparison between different spectrums. 33 Figure 29 E.II-23:EDX analysis with component mass percentage comparison between different spectrums. 33 Figure 30 E.II-23: local micro hardness test to detect the nature of the grain boundary phase. 34 Figure 31 E.II-23: micro hardness measurement location. 35 Figure 32 E.II-23: micro hardness profile measurement. 35 Figure 33 E.I-17 temperature evolution. 36 Figure 34 E.I-17 metallography: 2200-2000 W laser power, 0.35 mm/u feed forward and 0.12 mm ND. Right part. 37 Figure 35 E.I-17 metallography: 2200-2000 W laser power, 0.35 mm/u feed forward and 0.12 mm ND. Left part. 37 Figure 36 E.I-17 microstructure: substrate (a), interface (b) and layer (c). 38 Figure 37 E.I-17 micro hardness measurement location. 39 Figure 38 E.I-17 micro hardness profile measurement. 39 Figure 39 Edge growth due to high temperature and process geometry nature. 40 Figure 40 Cross-section and porosity analysis in the ROI of 4340 (10 mm) without cooling. 41 Figure 41 Temperature evolution during EHLA without cooling layers 1-35. 41 Figure 42 Temperature evolution during EHLA without cooling layers 36-70. 41 Figure 43 Microstructure pictures: substrate (a), interface (b) and layer (c) of the 4340 10 mm build-up. 42 Figure 44 Micro hardness measurement location in the 4340 10 mm build-up. 43 Figure 45 Hardness profile of the deposition without cooling for 4340 (10mm). 43 Figure 46 Tensile samples of 4340 after break. 44 Figure 47 4340 10 mm build-up with no cooling stress-strain curve. 45 Figure 48 Schematic representation of the Argon cooling system used during EHLA process. 46 Figure 49 Evolution of the build-up of 4340 (10 mm) after 25, 50 and final 80 layers. 46 Figure 50 Temperature evolution during EHLA with cooling layers 1-45. 47 Figure 51 Temperature evolution during EHLA with cooling layers 46-85. 47 Figure 52 Microstructure pictures: substrate (a), interface (b) and layer (c) of the 4340 10 mm build-up with cooling. 48

Edurne Montes Martínez Analysis of the static mechanical properties of iron-based alloys deposited by Extreme high-speed laser
material deposition for additive manufacturing or repair applications VIII
BILBOKO INGENIARITZA ESKOLA
ESCUELA
DE INGENIERÍA DE BILBAO
Figure 53 Hardness measurement position of the deposition with cooling for 4340 (10mm). 49 Figure 54 Hardness profile of the deposition with cooling for 4340 (10mm). 49 Figure 55 Tensile samples of 4340 after break. 50 Figure 56 4340 10 mm build up with cooling stress-strain curve. 51 Figure 57 Porosity analysis 10 mm 430L build-up laser power reduction: a) left part and b) right part. 52 Figure 58 Porosity analysis 10 mm 430L build-up laser power reduction: left part and right part. 53 Figure 59 Temperature evolution during the 430L SS (10 mm). maximum temperature: 395.5 °C. 53 Figure 60 Crack propagation in 430L (10 mm) intercrystalline main crack across layer with crack branches and intergranular cracked edges. 54 Figure 61 temperature evolution during the 430L SS (3 mm) - layer by layer. Max temperature: 209.6 ºC. 55 Figure 62 Crack cross section etched with V2A Beize. 55 Figure 63 Microstructure left side of the crack with different magnification factors: 10 x (a), 20 x (b), 50 x (c) and 50 x with inter-grain deposits measurements (d). 56 Figure 64 Microstructure right side of the crack with different magnification factors: 10 x (a), 20 x (b), 50 x (c) and 50 x with inter-grain deposits measurements (d). 56 Figure 65 Microstructure non crack affected area with different magnification factors: 10 x (a), 20 x (b), 50 x (c) and 50 x with inter-grain deposits measurements (d). 57 Figure 66 SEM images with different magnifications of the brittle crack 430L (10 mm). 58 Figure 67 EDX analysis of crack-free sample 430L (10 mm) build up with component mass percentage comparison between different spectra. 59 Figure 68 EDX analysis of crack-free sample 430L build up with component mass percentage comparison between different spectra – grain and grain boundary. 59 Figure 69 EDX analysis of crack-free sample 430L build up with component mass percentage comparison between different spectra. 60 Figure 70 Hardness measurement position of the deposition with cooling for 430L (10mm). 61 Figure 71 Hardness profile of the deposition with cooling for 430L (10mm). 61 Figure 72 30mN, Etched 2 - 45s micro hardness local measurements. 62 Figure 73 Tensile sample of 430L with cooling after break. 62 Figure 74 430L 10 mm build up with cooling stress-strain curve. 63

Edurne Montes Martínez Analysis of the static mechanical properties of iron-based alloys deposited by Extreme high-speed laser
material deposition for additive manufacturing or repair applications IX
BILBOKO INGENIARITZA ESKOLA
ESCUELA
DE INGENIERÍA DE BILBAO
Table Index
Table 1 Nominal chemical composition of metal powders used in this study (wt. %) [29,19]. 7 Table 2 Nominal chemical composition of E355 cold drawn tubes used in this study (wt. %) [9]. 7 Table 3 General mechanical properties of annealed 4340 steel as reference [19]. 8 Table 4 General mechanical properties for grade 430L stainless steel [20]. 8 Table 5 General mechanical properties of Soft annealed 16MnCr5 as reference [19]. 8 Table 6 Process parameters for 430L and 4340. 14 Table 7 Process parameters for the 16MnCr5. 14 Table 8 Parameter set of E.II-12, laser power and feed forward with porosity and bonding analysis. 22 Table 9 Thickness measurements of E.II-12: (2400 W laser power and 0.3 mm/u feed forward) and calculation of the ND from the max. thickness and min. thickness values. 23 Table 10 E.II-22 thickness measurements: 2400 W laser power, 0.3 mm ND and 0.3 mm/u feed forward with the corresponding deviation. 24 Table 11 E.I-13 thickness measurements and process parameters. 24 Table 12 E.I-13 ND calculation. 24 Table 13 E.I-15 and E.I-16 process parameters. 25 Table 14 E.I-15 and E.I-16 thickness measurements: 2200 W laser power, 0.15 mm and 0.2 mm ND and 0.35 mm/u feed forward with the corresponding deviation. 25 Table 15 E.III-10 process parameters and thickness measurements. 26 Table 16 E.III-17, E.III-18 and E.III-19 porosity and thickness measurements with the corresponding deviation. 27 Table 17 E.II-23 thickness measurements: 2400 W laser power, 0.3 mm ND and 0.3 mm/u feed forward with the corresponding deviation. 30 Table 18 E.I-17 process parameter. 36 Table 19 E.I-17thickness measurement: 2200-2000 W laser power, 0.12 mm ND and 0.35 mm/u feed forward with the corresponding deviation. 37 Table 20 Sample dimensions and tensile test results for 4340 10 mm without cooling. 45 Table 21 Sample dimensions and tensile test results for 4340 10 mm with cooling. 50 Table 22 Sample dimensions and tensile test results for 430L 10 mm with cooling. 63

Edurne Montes Martínez Analysis of the static mechanical properties of iron-based alloys deposited by Extreme high-speed laser
material deposition for additive manufacturing or repair applications X
BILBOKO INGENIARITZA ESKOLA
ESCUELA
DE INGENIERÍA DE BILBAO
Abbreviations and symbols
ABBREVIATION MEANING AM Additive Manufacturing LMD Laser Material Deposition EHLA Extreme High‐Speed Laser Material Deposition SS Stainless Steel 3D Three-dimensional HAZ Heat Affected Zone ID Internal Diameter SEM Scanning electron microscope EDX Energy-dispersive X-ray spectroscopy
SYMBOL UNIT MEANING dL [mm] Working distance ND [mm] Nozzle displacement LT [mm] Layer thickness Rp0,2 [MPa] Yield strength at 0.2% deformation Rm [MPa] Tensile strength A [%] Percentage elongation at break Z [%] Percentage reduction of area do [mm] Test piece diameter so [mm²] Test piece section

1
Edurne Montes Martínez Analysis of the static mechanical properties of iron-based alloys deposited by Extreme high-speed laser
material deposition for additive manufacturing or repair applications
BILBOKO INGENIARITZA ESKOLA
ESCUELA
DE INGENIERÍA DE BILBAO
1 Introduction
Since 2014, extreme high-speed laser deposition (EHLA) as a new process based on laser material deposition (LMD) has been successively developed by the joint research group of Fraunhofer-Institute of Technology and RWTH Aachen University. EHLA is flexible and of economic advantage for saving both the laser energy and the additive material and is suitable for coating, repair and additive production [1].
Before EHLA came out, coating of large-scaled workpiece to protect the surface against corrosion could be achieved by conventional processes like thermal spray and hard chromium plating. However, these processes have shortcomings, such as high energy consumption, formation of unwanted by-products like hexavalent chromium and loose non-metallurgical bonding. In thermal spray, only half of the material can be can be deposited on workpiece as a coat. The coat is porous, so the process have to be repeated several times. In contrast to thermal spray, more than 90 percent of the material used in EHLA can be deposited to form a non-porous and metallurgical bonded coat which is able to provide a long-term protection [2].
Unlike in conventional LMD processes, added powders in EHLA will be melted by the laser beam before their have reached the workpiece surface. This means that the powders are in a liquid state when they drop into a molten pool, so that the coat will be more homogeneous and the remelted layer in substrate will be thinner. Therefore, the thickness of the coat will not be in millimetre range but only need to be several ten to hundred micrometre. The EHLA process not only can be used for steel coating, but is also suitable for the additive manufacturing of other materials like aluminium alloys with a productivity increase of 100 to 250 times [2].
Nevertheless, as EHLA is a newly developed technology focusing mainly on coating, very little research about the application of EHLA in repair has been done. In this study, powder materials of AISI 4340 steel, 430L stainless steel and 16MnCo have been used to research the repair quality of parts of E3555 construction steel with the focus on the evaluation of the process strategy and the obtained static mechanical properties.

2
Edurne Montes Martínez Analysis of the static mechanical properties of iron-based alloys deposited by Extreme high-speed laser
material deposition for additive manufacturing or repair applications
BILBOKO INGENIARITZA ESKOLA
ESCUELA
DE INGENIERÍA DE BILBAO
2 State of the Art
2.1 Laser Material Deposition (LMD)
2.1.1 Process Principle
LMD (also termed as direct energy deposition) is an additive manufacturing (AM) process in which metallic powders are fed towards a substrate into a molten pool, which is created by the heating of a laser beam whose power usually can be varied from 500 W to 4000 W. The powders are carried by an argon flow and fed coaxially with the laser beam through a movable nozzle. The injected material, which is melted and deposited, is metallurgically bonded to the substrate with almost 100% density. Because the heat affected zone (HAZ) is very small and the solidification is very fast, a fine microstructure is generated replying the properties of the wrought or cast material or even exceeding them. Normal characteristics of LMD are thickness > 500 µm, surface rates in the range of 10-50 cm2/min and typical deposition speeds <2 m/min. In Figure 1 there is a schematic diagram of the process principle of LMD [2].
Figure 1 Schematic process principle of conventional LMD process [2].

3
Edurne Montes Martínez Analysis of the static mechanical properties of iron-based alloys deposited by Extreme high-speed laser
material deposition for additive manufacturing or repair applications
BILBOKO INGENIARITZA ESKOLA
ESCUELA
DE INGENIERÍA DE BILBAO
2.1.2 Most important parameters of LMD
The main process parameters of the LMD process are laser power, deposition speed, and powder mass flow. These parameters and the various combinations of them can directly affect porosity, track geometry and powder efficiency [10, 25, 26, 27, 28]. The most important effects are shown in Figure 2.
Figure 2 Effect of laser power and powder mass flow on layer properties [10, 25, 26, 27, 28].
2.1.3 LMD in repair applications
LMD is one of the well-known AM technologies for processing metallic materials and is suitable for the repair of large-sized parts made of high-value materials. Load-bearing components, which are often exposed to high-level and alternative loads, are critical, because any deep cracks and wear failure would lead to catastrophic damages [3, 4]. The maintenance of such components, for example, damaged rails with cracks, through traditional ways will cause a high material wastage, because the entire parts need to be replaced. Using AM, or more precisely laser cladding, instead of the replacement of the entire damaged part, the damaged area can be firstly cut off and a wide number of materials can be then locally deposited in the damaged area to do the repair or even, improve the wear and fatigue resistance and significantly increase the performance of the rail and the lifetime [5]. As for the aeronautical sector, the maintenance is highly important not solely from an economic point of view, but also because of the safety demands [6]. As titanium is one of the most widely used materials for
Increase Effect:
•Decrease of track porosity
•Smoother transition between substrate surface and track surface
•Constant deposition Rate (until certain Threshold)
•Constant powder efficiency (until certain Threshold)
Decrease effect:
•Poor cross sectional porosity
Laser Power
Increase Effect:
•Poor cross sectional porosity
•Increase of deposition Rate
•Decrease of powder efficiency.
Decrease effect:
•Decrease of track porosity
•Smoother transition between substrate surface and track surface
Powder mass flow

4
Edurne Montes Martínez Analysis of the static mechanical properties of iron-based alloys deposited by Extreme high-speed laser
material deposition for additive manufacturing or repair applications
BILBOKO INGENIARITZA ESKOLA
ESCUELA
DE INGENIERÍA DE BILBAO
aeronautical applications because of its advantages [7] or due to its high environmental impact during its life cycle [8].
Unlike conventional surface cladding processes such as thermal spraying, plasma spraying and arc welding, in LMD the HAZ is small and the geometrical accuracy is high. This fact lets LMD be a more efficient technology to realize a low-cost repair of damaged high-value components [11]. Figure 3 shows a repair of blade tips using LMD technology.
Figure 3 Repair of Blade Tips using LMD [18].
2.2 Extreme high‐speed laser material deposition process (EHLA)
2.2.1 Introduction
Developed initially to obtain good coating properties of large components, by the Extreme high‐speed laser material deposition process (EHLA), the LMD process is optimized to achieve coating in reduced times. In EHLA a deposition speed up to 200 m/min and a surface rate up to 500 cm2/min can be achieved, 100 times faster than in conventional LMD process and with an achievable reduction time up to 50%. This also enables a significant reduction of the layer thickness, approximately to 10-250 µm [2].
2.2.2 Process principle
As in LMD, the interaction time between the powder particles and the laser beam is relatively short. Because the material is directly injected into the melt pool, the amount of energy which is absorbed by the powder is smaller than that absorbed by the component surface. The strength of EHLA process lies in the reduction of the time needed for melting the powder particles and therefore the time required for the formation of the fused bond. The solution adopted is to deposit a higher amount of energy into the powder mass flow melting the particles before reaching the substrate, and, consequently, liquid material falls into the melt pool instead of solid material requiring smaller HAZ what leads in less laser energy

5
Edurne Montes Martínez Analysis of the static mechanical properties of iron-based alloys deposited by Extreme high-speed laser
material deposition for additive manufacturing or repair applications
BILBOKO INGENIARITZA ESKOLA
ESCUELA
DE INGENIERÍA DE BILBAO
absorbed by the substrate and less time needed for the generation of the deposition. This is realized by making the focus of the powder stream, a little above the substrate. This point is called a working point and is located approximately 1 mm above the substrate surface. The working distance (dL) can be changed by the carrier and shielding gas flow. Hence using EHLA the HAZ shrinks by a factor of one hundred: from between 500 - 1000 µm in conventional LMD, down to just 5 - 10 µm [2]. A feed rate of 25-200 m/min, which is 100 times faster than the conventional LMD is obtained during the rotation of cylindrical components in EHLA process. That is what makes EHLA a suitable AM process for the coating of large cylindrically symmetric components. In Figure 4 there is a schematic diagram of the process principle of EHLA [2].
Figure 4 Schematic process principle of EHLA process [2].
2.2.3 Most important parameters of EHLA
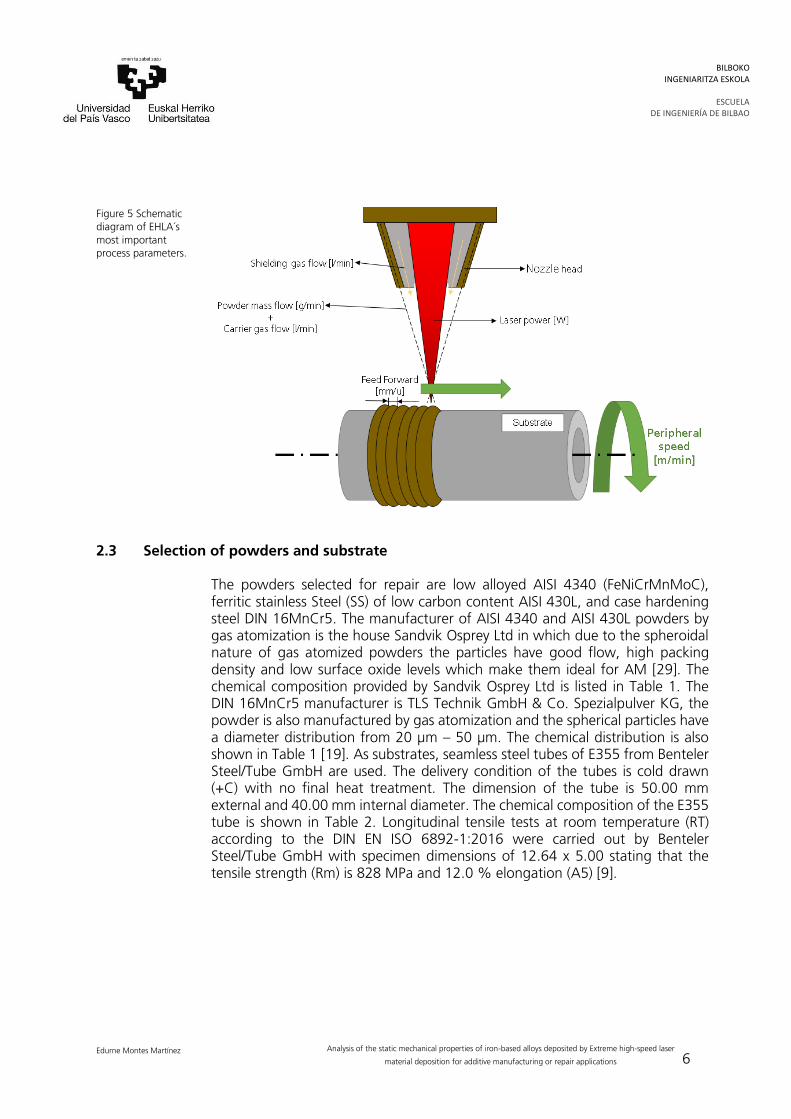
EHLA works with the same parameters as conventional LMD: deposition speed [m/min], powder mass flow [g/min] and laser power [W]. Furthermore, for defining the processing of cylindrical parts in EHLA, another parameter, would be the deposition speed on the surface of the piece, should be taken into consideration. Figure 5 shows the most important process parameters from EHLA process.
6
Edurne Montes Martínez Analysis of the static mechanical properties of iron-based alloys deposited by Extreme high-speed laser
material deposition for additive manufacturing or repair applications
BILBOKO INGENIARITZA ESKOLA
ESCUELA
DE INGENIERÍA DE BILBAO
Figure 5 Schematic diagram of EHLA´s most important process parameters.
2.3 Selection of powders and substrate
The powders selected for repair are low alloyed AISI 4340 (FeNiCrMnMoC), ferritic stainless Steel (SS) of low carbon content AISI 430L, and case hardening steel DIN 16MnCr5. The manufacturer of AISI 4340 and AISI 430L powders by gas atomization is the house Sandvik Osprey Ltd in which due to the spheroidal nature of gas atomized powders the particles have good flow, high packing density and low surface oxide levels which make them ideal for AM [29]. The chemical composition provided by Sandvik Osprey Ltd is listed in Table 1. The DIN 16MnCr5 manufacturer is TLS Technik GmbH & Co. Spezialpulver KG, the powder is also manufactured by gas atomization and the spherical particles have a diameter distribution from 20 µm – 50 µm. The chemical distribution is also shown in Table 1 [19]. As substrates, seamless steel tubes of E355 from Benteler Steel/Tube GmbH are used. The delivery condition of the tubes is cold drawn (+C) with no final heat treatment. The dimension of the tube is 50.00 mm external and 40.00 mm internal diameter. The chemical composition of the E355 tube is shown in Table 2. Longitudinal tensile tests at room temperature (RT) according to the DIN EN ISO 6892-1:2016 were carried out by Benteler Steel/Tube GmbH with specimen dimensions of 12.64 x 5.00 stating that the tensile strength (Rm) is 828 MPa and 12.0 % elongation (A5) [9].

7
Edurne Montes Martínez Analysis of the static mechanical properties of iron-based alloys deposited by Extreme high-speed laser
material deposition for additive manufacturing or repair applications
BILBOKO INGENIARITZA ESKOLA
ESCUELA
DE INGENIERÍA DE BILBAO
Table 1 Nominal chemical composition of metal powders used in this study (wt. %) [29,19].
Chemical composition (nominal), wt.%
Alloy Fe C Cr Ni Mo Si Mn S P
4340 Bal. 0.38 – 0.43 0.7- 0.9 1.65- 2.00 0.2- 0.3 0.15- 0.35 0.6-0.8 0.03 0.03
430L Bal. 0.03 16.0-18.0 N/A N/A 1.0 1.0 0.03 0.04
16MnCr5 Bal. 0.14-0.19 0.8-1.1 N/A N/A 0.4 1.0-1.3 0.035 0.025
Table 2 Nominal chemical composition of E355 cold drawn tubes used in this study (wt. %) [9].
Chemical composition (nominal), wt.%
Material Fe C Al Nb Si Mn S P
E355 Bal. 0.175 0.028 0.012 0.18 1.33 0.004 0.013
The mechanical and physical properties are intrinsically related to the manufacturing process used. Therefore the ones obtained by EHLA are expected to differ from those obtained by the traditional subtractive methods. However, in order to have a general knowledge about the values of these materials, in Table 3, Table 4 and Table 5 the common mechanical and physical properties of the AISI 4340, AISI 430L and DIN 16MnCr5, respectively, are presented [19,20].
8
Edurne Montes Martínez Analysis of the static mechanical properties of iron-based alloys deposited by Extreme high-speed laser
material deposition for additive manufacturing or repair applications
BILBOKO INGENIARITZA ESKOLA
ESCUELA
DE INGENIERÍA DE BILBAO
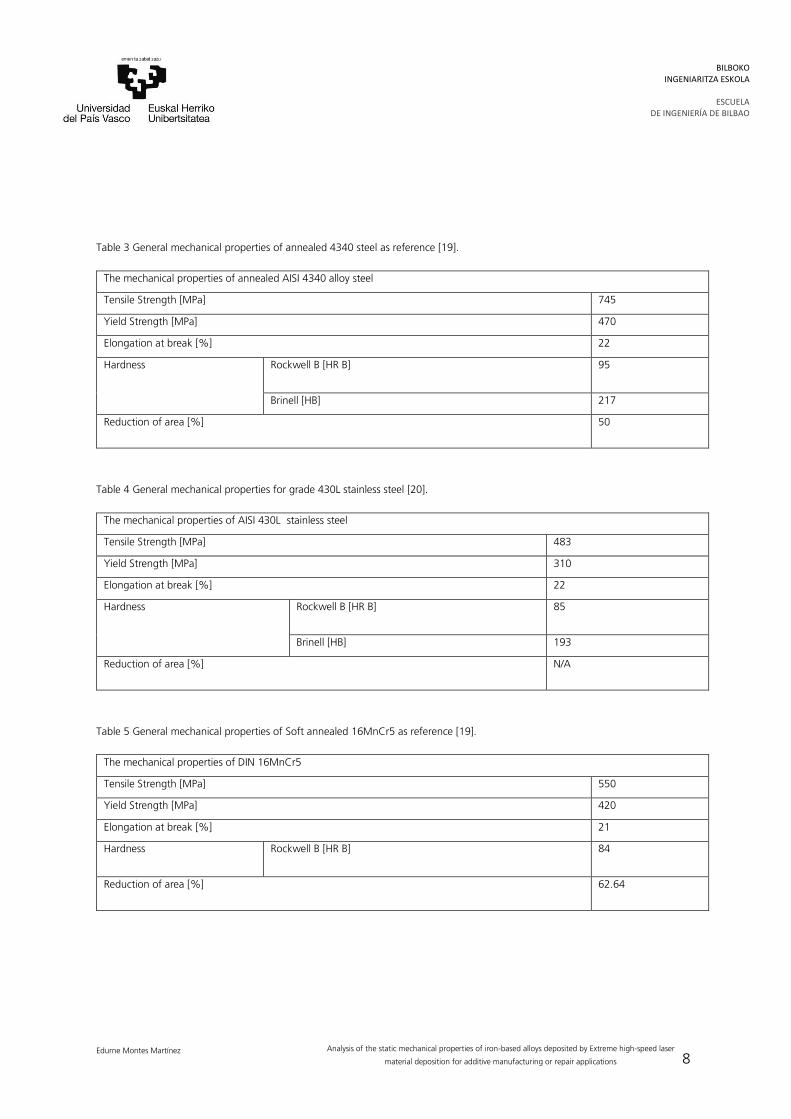
Table 3 General mechanical properties of annealed 4340 steel as reference [19].
The mechanical properties of annealed AISI 4340 alloy steel
Tensile Strength [MPa] 745
Yield Strength [MPa] 470
Elongation at break [%] 22
Hardness Rockwell B [HR B] 95
Brinell [HB] 217
Reduction of area [%] 50
Table 4 General mechanical properties for grade 430L stainless steel [20].
The mechanical properties of AISI 430L stainless steel
Tensile Strength [MPa] 483
Yield Strength [MPa] 310
Elongation at break [%] 22
Hardness Rockwell B [HR B] 85
Brinell [HB] 193
Reduction of area [%] N/A
Table 5 General mechanical properties of Soft annealed 16MnCr5 as reference [19].
The mechanical properties of DIN 16MnCr5
Tensile Strength [MPa] 550
Yield Strength [MPa] 420
Elongation at break [%] 21
Hardness Rockwell B [HR B] 84
Reduction of area [%] 62.64

9
Edurne Montes Martínez Analysis of the static mechanical properties of iron-based alloys deposited by Extreme high-speed laser
material deposition for additive manufacturing or repair applications
BILBOKO INGENIARITZA ESKOLA
ESCUELA
DE INGENIERÍA DE BILBAO
2.3.1 Application of the powders in LMD
The selected powders have performed different functions in the LMD studies carried out so far. Case hardening steel 16MnCr5 has been used mainly as a substrate for LMD operations. LMD with continuous powder supply may be used advantageously to produce wear resistant hard material dispersion coatings, especially on small functional areas or complex shaped parts as gears. 16MnCr5, generally used for gear manufacturing, is a material that during its useful life will suffer much wear due to friction. For this reason, the LMD studies carried out with this material are mainly based on the deposition of ceramics such as ZrO2, Al2O3, and TiO2 or of hard-phase particles that increase their useful life [30-32]. 430L, also used in coating applications, is generally used reinforced by ceramic phase [33,34], but also has been proved to be useful in processes of producing 3D functionally objects due to its corrosion-resistant properties and good interlayer adhesiveness but generally mixed to enhance its properties [35,36]. The AISI 4340 is a high strength steel used widely in aircraft critical applications such as landing gear. Several studies have been done with AISI 4340 steel powder about hardness improvement [37, 39], the microstructural features involved [38, 39], and the effect of LMD on fatigue properties [40]. The results obtained in these studies show an optimistic outlook for the future use of AISI 4340 by means of LMD as a potential repair technology for aerospace applications [41].

10
Edurne Montes Martínez Analysis of the static mechanical properties of iron-based alloys deposited by Extreme high-speed laser
material deposition for additive manufacturing or repair applications
BILBOKO INGENIARITZA ESKOLA
ESCUELA
DE INGENIERÍA DE BILBAO
3 Objective
The objective of this thesis is to analyze the possibility of using Extreme High‐Speed Laser Material Deposition (EHLA) process for the repair of E355 steel parts by depositing materials with the potential to achieve similar mechanical properties. The selected powders are ferritic stainless steel (SS) AISI 430L with low carbon content, low alloy iron-based metal powder AISI 4340 and case hardening steel DIN 16MnCr5. A series of experiments with different combinations of process parameters are carried out. The difficulty of using EHLA to repair parts of E355 is to achieve the same or even better static mechanical properties of the deposited area compared to the original state at the same position. Therefore, it is necessary to carry out tensile tests of the build-up material to verify that whether the static mechanic properties achieved are equal to those of the base material, or even improved. To obtain tensile samples from the build-up material, it is necessary to produce layers with a thickness of at least 8 mm (10 mm will be used to have a greater margin of action). The samples are mechanized according to DIN 50125-B. There is a challenge obtain a layer thickness of millimeters in EHLA process, which is initially designed for coating because the strategy must be adjusted during the building process.

11
Edurne Montes Martínez Analysis of the static mechanical properties of iron-based alloys deposited by Extreme high-speed laser
material deposition for additive manufacturing or repair applications
BILBOKO INGENIARITZA ESKOLA
ESCUELA
DE INGENIERÍA DE BILBAO
4 Design of Experiments
4.1 System set-up
Figure 6 shows a technical drawing of the used High-Speed LMD system from Hornet Laser Cladding B.V in Fraunhofer ILT. The system is basically based on a retrofitted conventional lathe and is designed especially for rotationally symmetrical components with a maximum diameter of 300 mm, a maximum clamping length of 1500 mm and a maximum weight of 1000 kg. The workpiece is clamped by means of a three-claw chuck. The maximum rotation speed which can be achieved during cladding is 2000 rpm. The operation is controlled by CNC. The axes can be moved in the X- (up/down) and Z- (left/right) direction via a control panel, the Y (forth/back)-axis displacement can be controlled manually with a set screw. However, the Y-axis will remain in the position zero in experiments, which matches the axis of the working piece.
Figure 6 CAD drawing and manufacturers EHLA system from HORNET [2].

12
Edurne Montes Martínez Analysis of the static mechanical properties of iron-based alloys deposited by Extreme high-speed laser
material deposition for additive manufacturing or repair applications
BILBOKO INGENIARITZA ESKOLA
ESCUELA
DE INGENIERÍA DE BILBAO
The laser head, which consists of optics and a powder nozzle, can be titled manually from 60° downward to -30° upward. As beam source, a diode laser DL 040 HQ from Coherent is used and the maximum laser power is 4000 W with a focusing optic PHFQ-H1-C. The connection to the system is achieved through a 600 µm length optic fiber for a typical focus at 2:1 imaging. Additionally, a powder feeder GTV PF 2/2, of the company GTV Verschleißschutz GmbH, is connected to the system. The volume of the feeder is 1.5 L with a powder capacity of 6.5 kg.
For the horizontal processing, corresponding to the surface of the tube, the level is set up as 90 ° with a coupling cube. A continuously coaxial powder nozzle is used for feeding the filler material, each one of the metallic powders in the case of study. The set working distance is 10 mm from the component surface so that the powder focus (working point) is positioned approximately 1 mm above the component surface. This distance can be varied via carrier gas and shielding gas. Figure 7 shows a schematic representation of the working distance and the powder focus of the EHLA process. The adjustment of the flow rate of argon shielding gas is controlled manually in experiment.
Figure 7 Schematic representation of EHLA working distance and powder focus.

13
Edurne Montes Martínez Analysis of the static mechanical properties of iron-based alloys deposited by Extreme high-speed laser
material deposition for additive manufacturing or repair applications
BILBOKO INGENIARITZA ESKOLA
ESCUELA
DE INGENIERÍA DE BILBAO
4.2 Experimental method
The procedure to be followed in this experimental work consists in the realization of four work phases and one final analysis as shown in Figure 8 for 430L. Said phases are the same for all the powders. However, taking into account the different behavior of each one of them, the process parameters used in each of the materials will be different to obtain the best results of deposition in each case.
Figure 8 Summary of the Experimental Method Phases.

14
Edurne Montes Martínez Analysis of the static mechanical properties of iron-based alloys deposited by Extreme high-speed laser
material deposition for additive manufacturing or repair applications
BILBOKO INGENIARITZA ESKOLA
ESCUELA
DE INGENIERÍA DE BILBAO
4.2.1 First Experimental Phase: process configuration for one layer deposition
The First Experimental Phase is consisting of the deposition of 10 mm length layers on the substrate tube with various combinations of laser power and feed forward. The rest of the process parameters are selected according to the general conditions of EHLA as a process to obtain layer build-ups. These process parameters are the same for 430L and 4340 and they are gathered in Table 6. For 16MnCr5, as the results obtained will show in the chapter 5.1.3 DIN 16MnCr5, is necessary to increase the peripheral speed of the tube in 20 unities to obtain results that can be compared to the other two materials. This new process parameter combination is shown in Table 7.
Table 6 Process parameters for 430L and 4340.
Peripheral speed [m/min]
Conveyor plate speed
[U/min]
Powder mass flow
[g/min]
Carrier gas flow [l/min]
Shielding gas flow [l/min]
Laser beam diameter
[mm]
30 3 18.67 5.5 10 1.2
Table 7 Process parameters for the 16MnCr5.
Peripheral speed [m/min]
Conveyor plate speed
[U/min]
Powder mass flow
[g/min]
Carrier gas flow [l/min]
Shielding gas flow [l/min]
Laser beam diameter
[mm]
50 6 18.27 6 10 1.2
The analysis of the layer is carried out making a cut perpendicular to the layer build-up in order to obtain an image of the cross-section. The samples then are cut and embedded in a Bakelite sample as shown in Figure 9. Then, the embedded samples went through a process of fine grinding and polishing until the surface roughness (Ra) was reduced to 1 μm. The images of each cross-section are taken with the Microscope Axio Imager Objective A-Plan with different magnifications for later analysis of the layer thickness obtained in each of the different configurations of laser power and feed forward. In addition, the presence or absence of pores and the correct adhesion between layer and substrate were checked.

15
Edurne Montes Martínez Analysis of the static mechanical properties of iron-based alloys deposited by Extreme high-speed laser
material deposition for additive manufacturing or repair applications
BILBOKO INGENIARITZA ESKOLA
ESCUELA
DE INGENIERÍA DE BILBAO
Figure 9 Sample preparation sketch.
The series of experiments in the first experimental phase have the objective to determine the combination of the laser power and the feed forward with the aim to low porosity and defect-free bonding with the substrate.
All the images corresponding to each one of the experiments are summarized in Annex I for the 4340, Annex II for the 430L and Annex III for the DIN 16MnCr5 at the end of this document according to the following nomenclature: Figure – Roman number of the corresponding Annex – number of the metallography. So the first metallography of 4340 material whose combination of parameters correspond with 1800 W of laser power and 0.2 mm/U of feed forward would be expressed as Figure I – 1. Additionally, all the results from the measures, temperature, deviation and correct bonding are summarized in the corresponding Annexes and only the results which were used in the following phases are being shown in the main documentation.
Starting from the thickness of the layer measured in each of the experiments, the nozzle displacement (ND) in the radial direction X necessary for the deposition of consecutive layers was calculated for the Second Experimental Phase. The lower and upper margins of the ND which are established correspond with the minimum and maximum value of the thickness of the layer deposited respectively. Using values contained between these two margins reduces the tendency to accumulate errors in the successive deposition of layers. As the objective was to have the same ND as deposited layer thickness (LT) to have a constant working distance of 10 mm between the nozzle tip and the surface:
𝐿𝑇 ≈ 𝑁𝐷

16
Edurne Montes Martínez Analysis of the static mechanical properties of iron-based alloys deposited by Extreme high-speed laser
material deposition for additive manufacturing or repair applications
BILBOKO INGENIARITZA ESKOLA
ESCUELA
DE INGENIERÍA DE BILBAO
Figure 10 depictures a schematic representation of the front view of the process during the ND, where the fill forms are the position of the nozzle and layer achieved for the first layer and the stripped ones the ones for the second.
Figure 10 Schematic representation of the process during the ND.
4.2.2 Second Experimental Phase: process configuration for five consecutive layer deposition
The second experimental phase consists in the deposition of five consecutive layers of material in order to verify that no large deviations occur between the actual thicknesses obtained (LT) and the theoretical thickness calculated from the ND used. In addition, the existence or not of pores in the build-up was checked through the metallography of the build-up cross sections and the best build-up strategy was analyzed.
The build-up strategy determinates another process parameter which can be modified in the EHLA process: the thermal times. Two different type of time intervals are distinguished: the time elapsed between consecutive layers or the inter-layer time interval, and time elapsed between consecutive deposits over (or adjacent to) a common co-ordinate/point in space – the intra-layer time interval. The inter-layer time is dependent on the orientation of the part, more or less constant, while the intra-layer time depends on the laser tracks employed. In the Second Phase the time interval which was modified was the intra-layer time, thus the time between two consecutive layers using two different build-up strategies: same direction build-up and zig-zag build-up. Both configurations are depictured in Figure 11.

17
Edurne Montes Martínez Analysis of the static mechanical properties of iron-based alloys deposited by Extreme high-speed laser
material deposition for additive manufacturing or repair applications
BILBOKO INGENIARITZA ESKOLA
ESCUELA
DE INGENIERÍA DE BILBAO
Figure 11 Schematic representation of same direction and zig-zag build-up strategies.
For determining which build-up strategy is the most suitable one the experiments are carried out only for the 430L. The criterion to evaluate the best strategy is to compare the geometry of the build-up as well as the thermal history of the same in each case.
4.2.3 Third Experimental Phase: process analysis for continuous depositions of 3 mm thickness
The objective of the Third Experimental Phase is the control and monitoring of the temperature in the process as a preliminary test before the final build-up of 10 mm by building a preliminary test sample of 3 mm.
4.2.4 Fourth Experimental Phase: metallographic analysis and mechanical properties
The Fourth Experimental Phase consists in the deposition of blocks of five consecutive layers in order to obtain a thickness of build-up sufficient to be able to manufacture tensile samples for the measurement of the static mechanical properties achieved by EHLA process.
The knowledge of the strength that a material has is one of the bases of knowledge for the correct design, production quality control and life prediction of industrial plants. Standards for tensile testing were among the earliest standards to be published and the development of such Standards continues

18
Edurne Montes Martínez Analysis of the static mechanical properties of iron-based alloys deposited by Extreme high-speed laser
material deposition for additive manufacturing or repair applications
BILBOKO INGENIARITZA ESKOLA
ESCUELA
DE INGENIERÍA DE BILBAO
today. The DIN EN ISO 6892 standard specifies the tensile test method of metallic materials and defines the mechanical properties that can be determined at room temperature. The tensile test consists in applying an increasing tensile load on normalized tensile pieces, usually until their breakdown. Meanwhile, the values of load and deformation at each moment of the process are recorded in the so-called Strain-stress curves. The tensile pieces are clutched so that they are axially aligned to minimize the possible bending effect. Products that can be tested with this standard include metal sheets, plates, cables, rods, and tubes. The general specifications regarding tensile test piece dimensions are given in the DIN EN ISO 6892-1 standard. In a tensile test various mechanical properties can be determined according to DIN EN ISO 6892 Standard. The most important ones are:
Young’s Modulus of Elasticity (‘E’): quantifies the measure of how much a structure will elastically deform when loaded. A low modulus means that a material will be flexible, a high modulus a material that will be stiff and inflexible.
Poisson’s coefficient (‘ʋ’): quantifies the ratio between the longitudinal elongation and the shortening of the transversal lengths to the direction of the force.
Proportionality limit: top value below which the elongation is proportional to the applied load.
Yield Strength at 0.2% deformation (as ‘Re’): It is the maximum load applicable without permanent deformations in the material.
Tensile strength (‘Rm’): stress corresponding to the maximum load (Fm).
Percentage elongation after fracture (‘A’): permanent elongation of the gauge length after fracture, expressed as a percentage of the original gauge length (Lo).
Percentage reduction of Area (as ‘Z’): maximum change in cross-sectional area which has occurred during the test expressed as a percentage of the original cross-sectional area (So).
The dimension and size of the round tensile samples are specified in the DIN 50125. Due to the nature of the EHLA process and in order to be able to manufacture the tensile samples with the thinnest build-up possible, the dimension of tensile samples selected for the analysis of the static mechanical properties of the deposited material are DIN 50125 Form A and DIN 50125 Form B. In order to be able to measure these properties with a minimum of material expense, the DIN 50125-B form was selected, which requires less total length,

19
Edurne Montes Martínez Analysis of the static mechanical properties of iron-based alloys deposited by Extreme high-speed laser
material deposition for additive manufacturing or repair applications
BILBOKO INGENIARITZA ESKOLA
ESCUELA
DE INGENIERÍA DE BILBAO
therefore less length to deposit, less waste of material and hence, shorter manufacturing time. From this test type, the smallest dimensions are chosen for the same reasons: DIN50125 – B4 x 20. The dimensions of the samples are summarized in the sketch of depictured in Figure 12.
Figure 12 shows the dimensions of the sample in accordance with the DIN50125 – B4 x 20 standard along with a distribution scheme of the 5 tensile samples that will be taken from each of the build-ups. As it was observed, to obtain an M6 for the tensile sample a build-up of at least 10 mm is necessary. This brings a safety margin of approximately 66.67% with respect to the true measures required. In regard to the necessary layer length to obtain the 41 mm, it is established between 65-70 mm. The need for this fact shall be expressed later in this document. The samples were manufactured and the tensile test performed by the company wbm, Prüflabor GmbH.

20
Edurne Montes Martínez Analysis of the static mechanical properties of iron-based alloys deposited by Extreme high-speed laser
material deposition for additive manufacturing or repair applications
BILBOKO INGENIARITZA ESKOLA
ESCUELA
DE INGENIERÍA DE BILBAO
Figure 12 Sample manufacturing scheme and DIN 50125 B 4x20 tensile sample dimensions.

21
Edurne Montes Martínez Analysis of the static mechanical properties of iron-based alloys deposited by Extreme high-speed laser
material deposition for additive manufacturing or repair applications
BILBOKO INGENIARITZA ESKOLA
ESCUELA
DE INGENIERÍA DE BILBAO
5 Results
5.1 First Experimental Phase: process configuration for one layer deposition
AISI 4340
For the AISI 4340, in this first experimental phase, a series of14 experiments are carried out with different process parameter configurations. In the experiments, the laser power will be increased by 200 W from 1600 W to 2200 W in order to see the relation of the variation of the parameters laser power and feed forward in the quality of the layer. With each of the powers, 4 different feed forwards are used: 0. 2 mm/u, 0. 25 mm/u, 0.3 mm/u and 0.35 mm/u. The parameters set for each experiment is shown in Table I-1 in Annex I at the end of this document with their corresponding metallography (Figures I -1 to 14). The peripheral speed, powder mass flow, carrier gas flow, shielding gas flow and laser beam diameter are kept constant for all experiments and their values are shown in Table 6 of section 4. 2. 1 First Experimental Phase.
AISI 430L
For 430L low-carbon stainless steel, 12 experiments are carried out. The approach for arranging the experiments is the same as the one used in the AISI 4340, the laser power is increased 200 W from 1800 W laser power until the securing of a no-defect bonding and a low porosity cladding. This goal is achieved with laser powers of 2400 W. For each one of the laser power, 3 different feed-forwards are used: 0.2 mm/u, 0.25 mm/u and 0.3 mm/u. The combination of process parameters of these 12 experiments is shown in Table-II 1 in Annex II at the end of this document with their corresponding metallography (Figures II -1 to 12). The remaining process parameters are shown in Table 6.
DIN 16MnCr5
With regard to DIN 16MnCr5, in this first experimental phase, a series of 17 experiments are carried out. initially proposed under the same dynamics as for the AISI 4340 and 430L.However, it is verified in the course of the experiments that the desired objectives of low porosity and no-defect bonding cannot be obtained by means of the variation of the laser power and feed forward, so the perimeter speed and the powder mass flow must be varied too in order to obtain comparable results. The 17 experiments carried out are listed in Annex III with their corresponding metallography (Figures III 1 -17). The process parameters used in each of the experiments (Table III - 1) and the results of the

22
Edurne Montes Martínez Analysis of the static mechanical properties of iron-based alloys deposited by Extreme high-speed laser
material deposition for additive manufacturing or repair applications
BILBOKO INGENIARITZA ESKOLA
ESCUELA
DE INGENIERÍA DE BILBAO
layer thickness measurements for each of them (Table III - 2) are also given in this Annex.
5.2 Second Experimental Phase: process configuration for five consecutive layer deposition
AISI 430L
After the analysis of the 12 experiments carried out in the first phase, it is concluded that the parameter set which gives lower porosity and defect-free bonding is the one corresponding to experiment 12 (E.II-12). In E.II-12, the feed forward and the laser power are the 0.3 mm/u and 2400 W respectively as is shown in Table 8. Figure 13 shows a metallography of the built-up cross-section.
Table 8 Parameter set of E.II-12, laser power and feed forward with porosity and bonding analysis.
Figure II -
Laser power [w]
Feed forward [mm/u]
Bonding OK?
Porosity [%]
12 2400 0.3 Yes < 0.1
Figure 13 E.II-12 metallography: 2400 W laser power and 0.3 mm/u feed forward.
For the continuous build-up, the NDs needed are calculated from the layer thickness measurements of E.II-12 as shows Table 9, and the same direction deposition strategy is analyzed. The process parameters remain the same as in Table 8.
It is observed that under this strategy the volume achieved has a non-symmetric shape due to the existence transient instability period at the beginning of each layer. This shape can be appreciated from Figure II-13 to Figure II – 18. The process parameters used for these experiments are summarized in the Table II -2. Figure 14, which corresponds to the experiment 17 (E.II-17), represents an example of this phenomena. The process parameters for the E.II 17 are: 2400 W, 0.3 mm ND and 0.25 mm/u feed forward. The rest of the process parameters are the same as in the E.II-12.

23
Edurne Montes Martínez Analysis of the static mechanical properties of iron-based alloys deposited by Extreme high-speed laser
material deposition for additive manufacturing or repair applications
BILBOKO INGENIARITZA ESKOLA
ESCUELA
DE INGENIERÍA DE BILBAO
Table 9 Thickness measurements of E.II-12: (2400 W laser power and 0.3 mm/u feed forward) and calculation of the ND from the max. thickness and min. thickness values.
Figure II -
Max. thickness
[µm]
ND [mm]
Theoretical height 5
layers [mm]
Min. thickness
[µm]
ND [mm]
Theoretical height 5
layers [mm]
Distance peak valley
[µm]
Average thickness
[µm]
12 295,12 0,3 1,5 216,42 0,2 1,0 78,7 255,77
Figure 14 E.II-17 metallography: 2400 W laser power and 0.25 mm/u feed forward and 0.23 mm ND.
In order to avoid this transient instability and obtain more symmetrical build-up volumes, a zig-zag deposition strategy is chosen. Furthermore, taking into account the results obtained with same direction strategy, it is concluded that those experiments with 0.25 mm/u feed forward are dispensable since they do not provide insight into the influence of the feed forward in the build-up. The zig-zag strategy experiments are summarized also in Table II -2 and the corresponding metallography are the ones from Figure II 19 to Figure II-22.
It is established through the zig-zag strategy that the volume obtained is, in fact, more symmetrical and the transitory period at the beginning of each layer is avoided. The parameter set which gives less porosity and defect- free bonding is the one of experiment 22 (E.II-22) with 0.3 mm/u feed forward, 2400 W laser power and 0.3 mm ND. The metallography of E.II-22 is shown in Figure 15. The thickness measurements are gathered in Table 10 with the corresponding deviation of the real thickness achieved and the theoretical one expected from the ND calculations. As can be appreciated, the build-up shows no bonding defect between the substrate and added material and a level of porosity < 0.1 % of the volume in all the cross-section area.
Figure 15 E.II-22 metallography: 5 layer deposition in zig-zag configuration 0.3 mm/u feed forward, 2400 W and 0. 3 mm ND.
24
Edurne Montes Martínez Analysis of the static mechanical properties of iron-based alloys deposited by Extreme high-speed laser
material deposition for additive manufacturing or repair applications
BILBOKO INGENIARITZA ESKOLA
ESCUELA
DE INGENIERÍA DE BILBAO
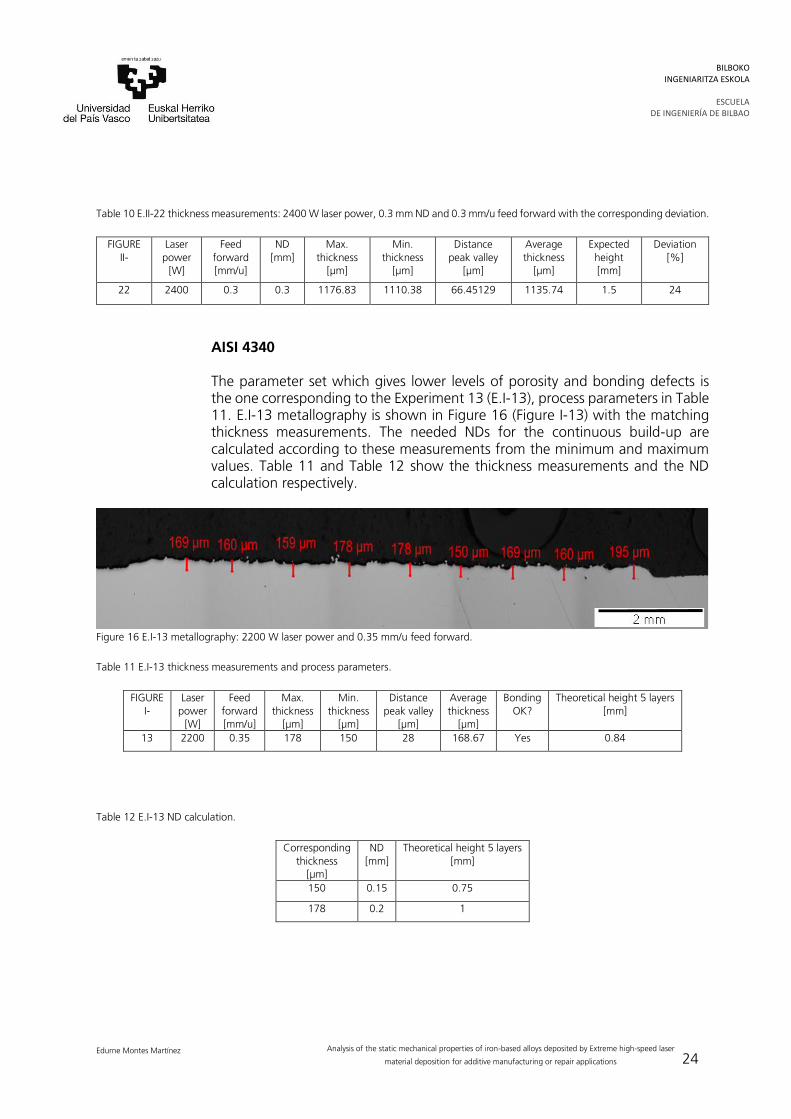
Table 10 E.II-22 thickness measurements: 2400 W laser power, 0.3 mm ND and 0.3 mm/u feed forward with the corresponding deviation.
FIGURE II-
Laser power
[W]
Feed forward [mm/u]
ND [mm]
Max. thickness
[µm]
Min. thickness
[µm]
Distance peak valley
[µm]
Average thickness
[µm]
Expected height [mm]
Deviation [%]
22 2400 0.3 0.3 1176.83 1110.38 66.45129 1135.74 1.5 24
AISI 4340
The parameter set which gives lower levels of porosity and bonding defects is the one corresponding to the Experiment 13 (E.I-13), process parameters in Table 11. E.I-13 metallography is shown in Figure 16 (Figure I-13) with the matching thickness measurements. The needed NDs for the continuous build-up are calculated according to these measurements from the minimum and maximum values. Table 11 and Table 12 show the thickness measurements and the ND calculation respectively.
Figure 16 E.I-13 metallography: 2200 W laser power and 0.35 mm/u feed forward.
Table 11 E.I-13 thickness measurements and process parameters.
FIGURE I-
Laser power
[W]
Feed forward [mm/u]
Max. thickness
[µm]
Min. thickness
[µm]
Distance peak valley
[µm]
Average thickness
[µm]
Bonding OK?
Theoretical height 5 layers [mm]
13 2200 0.35 178 150 28 168.67 Yes 0.84
Table 12 E.I-13 ND calculation.
Corresponding thickness
[µm]
ND [mm]
Theoretical height 5 layers [mm]
150 0.15 0.75
178 0.2 1

25
Edurne Montes Martínez Analysis of the static mechanical properties of iron-based alloys deposited by Extreme high-speed laser
material deposition for additive manufacturing or repair applications
BILBOKO INGENIARITZA ESKOLA
ESCUELA
DE INGENIERÍA DE BILBAO
The zig-zag strategy is the only one used for the reason extrapolated from the experiments carried out with 430L. Table 13 shows the process parameter set for the second phase. Their corresponding metallography are the Figure I – 15 and the Figure I – 16.
Table 13 E.I-15 and E.I-16 process parameters.
Figure I -
Laser power [W]
Feed forward [mm/u]
ND [mm]
15 2200 0.35 0.15
16 2200 0.35 0.2
As both E.I-15 and E.I-16 present high deviation between the real thickness and theoretical one as Table 14 shows, for the Third Experimental Phase a 0.12 mm ND is used, which leads to a theoretical height of 0.6 mm with an expected deviation lower than 10%.
Table 14 E.I-15 and E.I-16 thickness measurements: 2200 W laser power, 0.15 mm and 0.2 mm ND and 0.35 mm/u feed forward with the corresponding deviation.
Figure I-
Feed forward [mm/u]
ND [mm]
Max thickness
[µm]
Min thickness
[µm]
Valley peak [µm]
Average thickness
[µm]
Theoretical height [mm]
Deviation [%]
15 0.35 0.15 543 477 66 519.17 0.75 31
16 0.35 0.2 590 489 101 563.83 1 44
DIN 16MnCr5
The process parameter set which has lower porosity levels, lack of cracks and no defects in the bonding area is the one corresponding to the Experiment 10 (E.III-10) whose metallography can be seen in Figure 17 below.
Figure 17 E.III-10 metallography: 1800 W and 0.25 mm/u feed forward.

26
Edurne Montes Martínez Analysis of the static mechanical properties of iron-based alloys deposited by Extreme high-speed laser
material deposition for additive manufacturing or repair applications
BILBOKO INGENIARITZA ESKOLA
ESCUELA
DE INGENIERÍA DE BILBAO
Table 15 shows its process parameter combination for E.III-10. From the thickness measurements obtained the ND needed is calculated. For this operation, as for the other materials, the minimum and maximum values of the thickness are used. Taking into account that the minimum thickness of the layer is 57 μm and that the maximum of 167.5 μm, with an average thickness of 109.6 μm (Table 15), the NDs used are: 0.08mm, 0.1mm and 0.12mm.
Table 15 E.III-10 process parameters and thickness measurements.
FIGURE III-
Laser power
[W]
Feed forward [mm/u]
Max. thickness
[µm]
Min. thickness
[µm]
Distance peak valley
[µm]
Average thickness
[µm]
Expected height [mm]
Deviation [%]
10 1800 0.25 167.74 57.01 28.67 109.3 0.55 24
In spite of the good results gotten in E.III-10, the results obtained in the deposition of 5 consecutive layers with the NDs calculated according to the criteria used with the rest of the materials are unacceptable. For this three NDs configurations, the pore percentage in the build-up is too high as Figure 18, Figure 19 and Figure 20 show. This pictures correspond to Experiment 17, 18 and 19 respectively (E.III-17, E.III-18, and E.III-19). In addition, the deviation between the real thickness obtained and the theoretically expected is too high (Table 16) which in prolonged processes would lead to a collision of the nozzle with the constructed volume producing the collapse of it. The deviation is smaller as the ND in the radial direction grows, which leads to think that with bigger ND the deviation will be lower fulfilling equality of LT≈ND. In the same way, to reduce the possibility of the appearance of pores, the laser power is increased first to 2000 W and then to 2200 W.
Figure 18 E.III-17 metallography: 1800 W, 0.25 mm/u feed forward and 0.08 mm ND.

27
Edurne Montes Martínez Analysis of the static mechanical properties of iron-based alloys deposited by Extreme high-speed laser
material deposition for additive manufacturing or repair applications
BILBOKO INGENIARITZA ESKOLA
ESCUELA
DE INGENIERÍA DE BILBAO
Figure 19 E.III-18 metallography: 1800 W, 0.25 mm/u feed forward and 0.1 mm ND.
Figure 20 E.III-19 metallography: 1800 W, 0.25 mm/u feed forward and 0.12 mm ND.
Table 16 E.III-17, E.III-18 and E.III-19 porosity and thickness measurements with the corresponding deviation.
ND [mm]
Porosity [%]
Expected thickness after 5 layers
[mm]
Real thickness after 5 layers
[mm]
Deviation [%]
0.08 1.13 0.4 0.81834 104.585
0.1 2.13 0.5 0.83633 67.266
0.12 2.81 0.6 0.87363 45.605
Despite the increase of both the ND, now 0.15 mm, and the laser power, the results obtained are still unacceptable. For 2000 W power, the percentage of pores is still high (Figure 21) while if the power is increased by another 200 W, even though the pores disappear, the temperature reached in the process is so high that the nozzle is at risk of being damaged because the powder burns. In total 6 experiment are carried out to try to avoid the burning of the powder varying the carrier gas flow which controls the velocity of the particles. The augmentation of this flow implies that the time the particles are in the laser beam diameter is less, so to have the same amount of melted material we need higher laser powers. The correspondent metallography of this 6 experiments (Figures III - from 21 to 26) and process parameter combination, thickness measurements, deviation and porosity levels (Table III-3 and Table III - 4) are summarized in Annex III.
Figure 21 E.III-21metallography: 2000 W, 0.25 mm/u feed forward and 0.15 mm ND.
It is therefore concluded that the presence of pores does not result from a poor selection of the ND parameter, nor from an insufficient laser power. As said, the experiments are carried out with an increase of the laser power of 200 W in each case until the danger of damaging the nozzle is reached. Therefore, there is no possibility to avoid pores by adjusting the process parameters as in the 430L and

28
Edurne Montes Martínez Analysis of the static mechanical properties of iron-based alloys deposited by Extreme high-speed laser
material deposition for additive manufacturing or repair applications
BILBOKO INGENIARITZA ESKOLA
ESCUELA
DE INGENIERÍA DE BILBAO
4340. This points to problems inside the powder, so an EDX analysis of the powder is performed.
The EDX analysis verified that powder has a high contamination content of ceramic elements. In the measurement points, apart from elements inherent of the 16MnCr5, Aluminum, Zirconium and Oxygen can be found in high levels. There is not an obvious causality, but there is a possible correlation between the appearance of ceramic and the bad weldability. In order to verify this correlation, more experiments are needed. Nevertheless, the current state of this material makes it unsuitable EHLA applications. The EDX results are shown in Figure 22 and Figure 23 with their correspondent chemical composition in the spectra signposted.
Figure 22 EDX measurements of 16MnCr5 powder with chemical composition in different spectrums.
All results in mass% Process option: All elements analyzed (normalized) Spectrum In Statistic C O Al Si Ti Cr Mn Fe Zr Total
Spectrum 1 Yes 2.53 55.89 18.82 5.85 1.47 0.53 7.64 2.36 4.91 100
Spectrum 3 Yes 4.80 4.71 0.39 0.97 0.93 88.21 100
In Figure 24 it is shown SEM pictures of the powder with different magnification (a) 200 X b) 400 X c) 1.00k X and d) 2.00k X) and can be appreciated where the contamination can be seen, red arrows, between the spherical powder particles.

29
Edurne Montes Martínez Analysis of the static mechanical properties of iron-based alloys deposited by Extreme high-speed laser
material deposition for additive manufacturing or repair applications
BILBOKO INGENIARITZA ESKOLA
ESCUELA
DE INGENIERÍA DE BILBAO
Figure 23 EDX measurements of 16MnCr5 powder with chemical composition in different spectrums.
All results in mass% Process option: All elements analyzed (normalized) Spectrum In Statistic O Al Si Ti Cr Mn Fe Zr Total
Spectrum 1 Yes 62.65 18.97 6.05 1.06 0.41 4.34 1.14 5.38 100
Figure 24 SEM pictures of the 16MnCr5 powder particles with different magnifications: a) 200X, b) 400X, c) 1.00kX and d) 2.00kX.

30
Edurne Montes Martínez Analysis of the static mechanical properties of iron-based alloys deposited by Extreme high-speed laser
material deposition for additive manufacturing or repair applications
BILBOKO INGENIARITZA ESKOLA
ESCUELA
DE INGENIERÍA DE BILBAO
5.3 Third Experimental Phase: process analysis for continuous depositions of 3 mm thickness
AISI 430L
Firstly, the experimentation with 430L is carried out. The deposition is approached as a continuous process without cooling between layers. Due to the continuous supply, the piece entered in red hot as a result of an overheating of the material. The process is stopped after the deposition of the layer 14. It is concluded that, in order not to damage the nozzle with the high temperatures (> 800 °C), it is necessary to do non-continuous deposition. The solution adopted to achieve the necessary 10 mm is the deposition of blocks of 5 consecutive layers with cooling intervals between each one. The cooling time is of near 15 minutes (approximate time for the piece to reach again a temperature around 60° C). The process parameter set used for the build-up is 2400 W laser power, 0.3 mm/u feed forward, ND 0.3 mm and Zig-Zag deposition strategy. The corresponding metallography of the build-up volume (E.II-23) is shown in Figure 25. The thickness measurements and deviation information are gathered in Table 17.
Figure 25 E.II-23 metallography: continuous deposition process, 2400 W laser power, 0.3 mm/u feed forward and 0.3 mm ND.
Table 17 E.II-23 thickness measurements: 2400 W laser power, 0.3 mm ND and 0.3 mm/u feed forward with the corresponding deviation.
Picture II-
feed forward [mm/u]
ND [mm]
Max thickness
[µm]
Min thickness
[µm]
Valley peak distance
[µm]
Average thickness
[µm]
Theoretical height [mm]
Deviation [%]
23 0.3 0.3 4049.78 3683.91 365.87 3897.68 4.2 7
For analyzing the microstructure, the sample embedded in Bakelite for fine grinding and polishing until the surface roughness is reduced to 1 μm (Figure 26 a)) is etched 10 seconds with V2A Beize. V2A Beize is one of the most common etchants for stainless steels. Its normal composition is: 100 cc

31
Edurne Montes Martínez Analysis of the static mechanical properties of iron-based alloys deposited by Extreme high-speed laser
material deposition for additive manufacturing or repair applications
BILBOKO INGENIARITZA ESKOLA
ESCUELA
DE INGENIERÍA DE BILBAO
hydrochloric acid – HCl, 100 cm3 of water - H2O, 10 cc nitric acid - HNO3 and 0.2 - 2 cm³ saving stain. During the etching process it was ensured good movement of the sample in the acid to ensure a uniform etching attack.
After the etching and under the microscope several micro cracks are detected: crack about 0.8 mm from the edge (26, b)) and crack course inter-crystalline, with an approximated length of 100 μm (26, c)) among others. In whole layer grain boundary phases recognizable, the presumption is that this phase is martensite. This presumption is based in the fact that the microstructure of ferritic stainless steels could be either completely ferritic or a mixture of ferrite and martensite, finding the martensite in the grain boundaries [22]. According to studies [21] any austenite that is generated at elevated temperature (around 800 °C for bright red in the 3 mm build-up of AISI 430L according to the stainless steel temperature guide [23]) will be transformed to martensite when cooling to room temperature leaving no carbon available for carbide formation, which would explain the lack of those in the build-up material.
Figure 26 E.II-23: sample preparation a), edge crack metallography b), inter grain crack metallography c) inter grain phase metallography d).
With the aim of checking the nature of the deposits in the grain boundaries, an EDX analysis is carried out. Figure 27, Figure 28 and Figure 29 show different measurement of the chemical composition. The chemical composition

32
Edurne Montes Martínez Analysis of the static mechanical properties of iron-based alloys deposited by Extreme high-speed laser
material deposition for additive manufacturing or repair applications
BILBOKO INGENIARITZA ESKOLA
ESCUELA
DE INGENIERÍA DE BILBAO
measurements show traces of nickel and oxygen in small quantities in some areas of the sample. The presence of oxygen is associated as a consequence of the etching process. The traces of nickel, on the other hand, present in a non-homogeneous way in the cross-section area, can be associated with traces of contamination due to the previous use of Ni alloys since this element is not present in the 430L nor in the base E355. Nevertheless, having very reduced contents and being selectively associated with certain areas, the nickel measurements obtained can be attached to the proximity of the detection limits in the EDX tests. For these reasons, it is decided to suppress these two elements of the measurements.
Figure 27 E.II-23: EDX analysis with component mass percentage comparison between different spectrums.
All results in mass%
Spectrum In Statistic C Si Cr Mn Fe Total
Spectrum 1 Yes 5.33 0.69 17.29 0.75 75.94 100
Spectrum 2 Yes 7.63 0.93 16.38 0.84 74.23 100

33
Edurne Montes Martínez Analysis of the static mechanical properties of iron-based alloys deposited by Extreme high-speed laser
material deposition for additive manufacturing or repair applications
BILBOKO INGENIARITZA ESKOLA
ESCUELA
DE INGENIERÍA DE BILBAO
Figure 28 E.II-23: EDX analysis with component mass percentage comparison between different spectrums.
Figure 29 E.II-23:EDX analysis with component mass percentage comparison between different spectrums.
All results in mass%
Spectrum In Statistic C Si Cr Mn Fe Total
Spectrum 1 Yes 6.62 0.70 16.64 0.75 75.28 100
Spectrum 2 Yes 8.77 0.62 16.04 0.84 73.74 100
Spectrum 3 Yes 7.90 0.46 16.71 0.73 74.21 100
Spectrum 4 Yes 7.97 0.82 16.21 0.66 74.33 100
Spectrum 5 Yes 6.04 0.72 16.93 0.97 75.35 100
Spectrum 6 Yes 7.03 0.70 16.71 0.84 74.73 100
All results in mass%
Spectrum In Statistic C Si Cr Mn Fe Total
Spectrum 1 Yes 7.85 0.82 16.45 0.72 74.16 100

34
Edurne Montes Martínez Analysis of the static mechanical properties of iron-based alloys deposited by Extreme high-speed laser
material deposition for additive manufacturing or repair applications
BILBOKO INGENIARITZA ESKOLA
ESCUELA
DE INGENIERÍA DE BILBAO
Since there is no great difference in chemical composition between the grains and the deposition situated in their boundaries, it is decided to carry out micro hardness tests to determine if the nature of these deposits is indeed martensite.
Hardness
Local hardness measurements are taken to check the hardness of the different zones: the ferrite grains and the elements in the grain limits, presumably martensite. Figure 30 shows the location of the four measurements taken: two in the grain boundary and the other two inside the grains. As can be seen, there is a strong hardening in the grain limit of around 300 HV which indicates that the element is, in fact, martensite.
Figure 30 E.II-23: local micro hardness test to detect the nature of the grain boundary phase.
To complement the local measurement information, three Micro-Vickers hardness measurements are done to measure the hardness of layers, interface and substrate. Three test positions are selected from left to right. Figure 31 shows the measurement line locations. The spacing between the points is 100 μm and a total of 50 points are measured in each line. The total test length of the line 1, line 2 and line 3 are 5.02 mm, 5.00 mm and 4.93 mm respectively and includes all cladding layers, fusion zone, and heat affected zone and substrate.

35
Edurne Montes Martínez Analysis of the static mechanical properties of iron-based alloys deposited by Extreme high-speed laser
material deposition for additive manufacturing or repair applications
BILBOKO INGENIARITZA ESKOLA
ESCUELA
DE INGENIERÍA DE BILBAO
Figure 31 E.II-23: micro hardness measurement location.
As can be seen in Figure 32, measurements across the layer are irregular. This may be due to the difference in hardness between ferrite and martensite that has been seen in local measurements. However, the maximum values obtained are 200 HV lower than the ones we have observed before (549 HV0.1), which means that most of the measurements do not directly affect the martensite. However, these measurements give an idea of the overall hardness to be obtained in the total build-up of 10 mm.
Figure 32 E.II-23: micro hardness profile measurement.
0
20
40
60
80
100
120
140
160
180
200
220
240
260
280
300
320
340
0,0 0,5 1,0 1,5 2,0 2,5 3,0 3,5 4,0 4,5 5,0
Hard
ne
ss [
HV
0.1
]
Distance from the surface [mm]
left line - line1 middle line - line2 right line - line3

36
Edurne Montes Martínez Analysis of the static mechanical properties of iron-based alloys deposited by Extreme high-speed laser
material deposition for additive manufacturing or repair applications
BILBOKO INGENIARITZA ESKOLA
ESCUELA
DE INGENIERÍA DE BILBAO
AISI 4340
As for the AISI 4340, the build-up is done providing blocks of 5 consecutive layers in order to achieve 3 mm build-up. The process is carried out discontinuously to avoid the overheating of the piece: deposition of blocks of 5 consecutive layers in zig-zag configuration with the parameters selected in First and Second Experimental Phases shown in Table 18.
Table 18 E.I-17 process parameter.
Picture I-
Powder mass flow
[g/min]
Shielding gas flow
[l/min]
Laser beam diameter
[mm]
Feed forward [mm/u]
ND [mm]
Laser power [W]
17 18.67 10 1.2 0.35 0.12 Variable with the build-up
1-10: 2200 10-35: 2000
Between each block 15 minutes of cooling are necessary. The criterion of 15 minutes of waiting corresponds to the approximate time necessary for the piece to cool down to values of approximately 60 °C before the deposition of the next block. The 3 mm are achieved without Argon cooling while EHLA process. As there is no cooling down during the process, the temperatures achieved are higher after of each block as the graphic in Figure 33 shows. This effect is consequence of the thermal accumulation and the thicker the layer gets the oposition of the material for heat convection flow. Therefore, to avoid excesive heating, the laser porwer is lowered after the 10 first layers from 2200 W to 2000 W for the 15 remaining ones. The metallography of the experimet with the thickness measurements are shown in Figure 34 and 35. The deviation reached after the 3 mm build-up is 3,.88%. Table 19 gathers all the measurement and deviation information for the Experiment 17.
Figure 33 E.I-17 temperature evolution.
0
200
400
600
0 7
12
17
22
27
34
39
44
49
56
61
66
71
78
83
88
93
100
105
110
115
TEM
PERA
TUR
E (°
C)
TIME (min)

37
Edurne Montes Martínez Analysis of the static mechanical properties of iron-based alloys deposited by Extreme high-speed laser
material deposition for additive manufacturing or repair applications
BILBOKO INGENIARITZA ESKOLA
ESCUELA
DE INGENIERÍA DE BILBAO
Table 19 E.I-17thickness measurement: 2200-2000 W laser power, 0.12 mm ND and 0.35 mm/u feed forward with the corresponding deviation.
Picture I-
Max thickness
[µm]
Min thickness
[µm]
Valley peak distance
[µm]
Average thickness
[µm]
Theoretical height [mm]
Deviation [%]
17 2931 2791 140 2883.5 3 3.88
For the microstructure analysis of the sample, the entire specimens is cut into three parts for Optical microscope observation and etched with 3 % Nital (97 % ethanol and 3 % nitric acid) solution to demonstrate the microstructure. The microstructure of the 5 sets of layers is expected to be different due to extremely high heating temperatures during the EHLA process as can be appreciated in Figures 34 and 35.
Figure 34 E.I-17 metallography: 2200-2000 W laser power, 0.35 mm/u feed forward and 0.12 mm ND. Right part.
Figure 35 E.I-17 metallography: 2200-2000 W laser power, 0.35 mm/u feed forward and 0.12 mm ND. Left part.
The microstructure in the substrate (a), interface (b) and layer (c) of the specimen are shown in Figures 36. The grain size of the layer as can be seen, is smaller and finer than that of the substrate which implies an improvement of the mechanical properties with respect to the base material E355. As can be seen in the micro-Hardness test results in Figure 32, this supposition is confirmed as the layer has around 40 HV more than the substrate.

38
Edurne Montes Martínez Analysis of the static mechanical properties of iron-based alloys deposited by Extreme high-speed laser
material deposition for additive manufacturing or repair applications
BILBOKO INGENIARITZA ESKOLA
ESCUELA
DE INGENIERÍA DE BILBAO
Figure 36 E.I-17 microstructure: substrate (a), interface (b) and layer (c).
For the hardness analysis the part is embedded in a rubber sample for fine grinding and polishing until the surface roughness is reduced to 1 μm. Micro-Vickers hardness measurements were performed to measure the hardness of layers, interface and substrate. Three test positions are selected from left to right. Two sets of measurement points are defined in the middle test position. The measure line location can be observed in the Figure 37. In order to eliminate the test points only in the interface or the cladding layer, the interval between the two groups of test points is 50 μm. The spacing between the points is 50 μm, a total of 76 points are measured. The total test length is 3.8 mm includes all cladding layers, fusion zone, heat affected zone and substrate.

39
Edurne Montes Martínez Analysis of the static mechanical properties of iron-based alloys deposited by Extreme high-speed laser
material deposition for additive manufacturing or repair applications
BILBOKO INGENIARITZA ESKOLA
ESCUELA
DE INGENIERÍA DE BILBAO
Figure 37 E.I-17 micro hardness measurement location.
It is observed that the hardness is higher in layers than that in substrate region. Furthermore, the last five layers were with a significant higher hardness than the other 20 layers, which are approximately 310 HV0.1 as it is shown in the Figure 38 with measures corresponding to the left line, middle line_1, middle line_2 and right line. This higher hardness level is contributed by the presence of carbides in dendritic as a result of absence of re-heating.
Figure 38 E.I-17 micro hardness profile measurement.
020406080
100120140160180200220240260280300320340360380400420
0 5 10 15 20 25 30 35 40 45 50 55 60 65 70 75
Hard
ne
ss [
HV
0.1
]
Distance from the surface [mm]
right line left line middle line 2 middle line 1
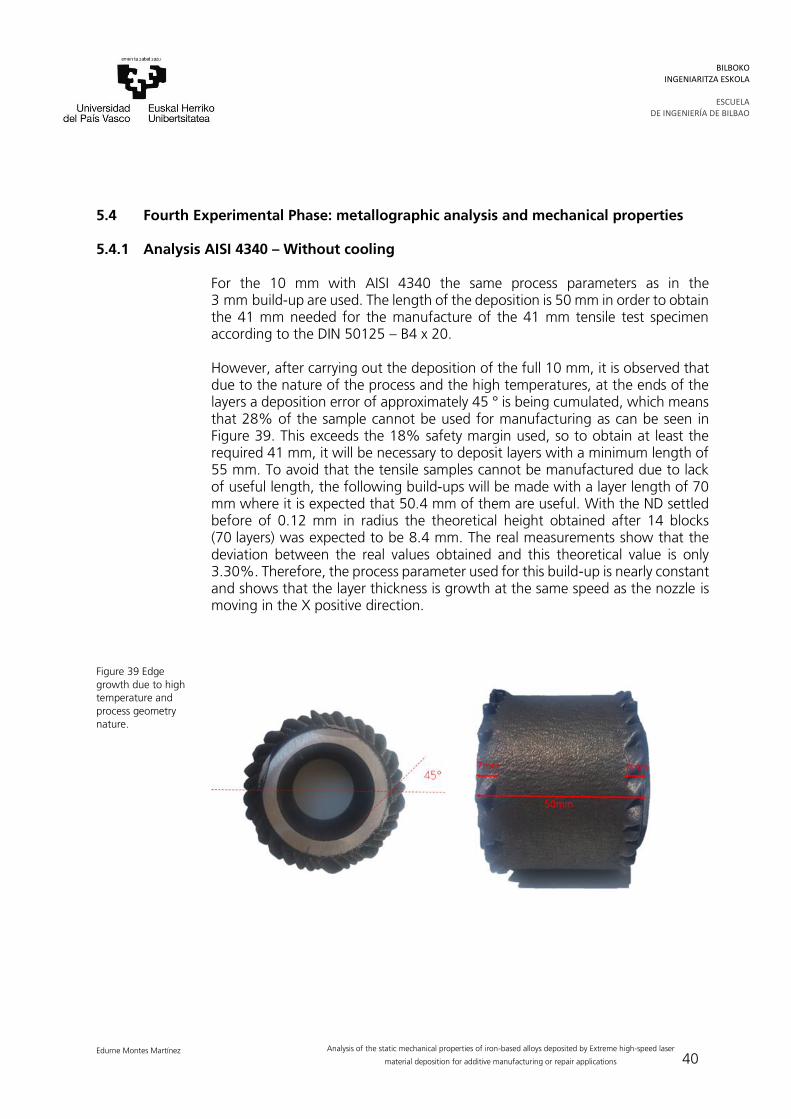
40
Edurne Montes Martínez Analysis of the static mechanical properties of iron-based alloys deposited by Extreme high-speed laser
material deposition for additive manufacturing or repair applications
BILBOKO INGENIARITZA ESKOLA
ESCUELA
DE INGENIERÍA DE BILBAO
5.4 Fourth Experimental Phase: metallographic analysis and mechanical properties
5.4.1 Analysis AISI 4340 – Without cooling
For the 10 mm with AISI 4340 the same process parameters as in the 3 mm build-up are used. The length of the deposition is 50 mm in order to obtain the 41 mm needed for the manufacture of the 41 mm tensile test specimen according to the DIN 50125 – B4 x 20.
However, after carrying out the deposition of the full 10 mm, it is observed that due to the nature of the process and the high temperatures, at the ends of the layers a deposition error of approximately 45 ° is being cumulated, which means that 28% of the sample cannot be used for manufacturing as can be seen in Figure 39. This exceeds the 18% safety margin used, so to obtain at least the required 41 mm, it will be necessary to deposit layers with a minimum length of 55 mm. To avoid that the tensile samples cannot be manufactured due to lack of useful length, the following build-ups will be made with a layer length of 70 mm where it is expected that 50.4 mm of them are useful. With the ND settled before of 0.12 mm in radius the theoretical height obtained after 14 blocks (70 layers) was expected to be 8.4 mm. The real measurements show that the deviation between the real values obtained and this theoretical value is only 3.30%. Therefore, the process parameter used for this build-up is nearly constant and shows that the layer thickness is growth at the same speed as the nozzle is moving in the X positive direction.
Figure 39 Edge growth due to high temperature and process geometry nature.

41
Edurne Montes Martínez Analysis of the static mechanical properties of iron-based alloys deposited by Extreme high-speed laser
material deposition for additive manufacturing or repair applications
BILBOKO INGENIARITZA ESKOLA
ESCUELA
DE INGENIERÍA DE BILBAO
Analysis Thickness and porosity
The metallography of the sample after cutting a cross section and dividing it in two with their posterior embedding for grinding an fine polishing until 1 µm. Figure 40 show that the porosity of the sample of the left side (a) and right side (b) of the divide sample are 0.15 % and 0.22 % respectively. The thermal history of the entire process is shown in the Figure 41 (layers 1-35) and Figure 42 (layer 36-70), where the peaks represent the temperatures reached after the deposition of the blocks of layers. It can be seen that the average duration of the cooling process until reaching temperatures of about 60° C is around 20 minutes. The waiting time required for cooling the part between blocks determines the duration of the process: for build-ups of 10 mm thicknesses the process takes about 6 hours.
Figure 40 Cross-section and porosity analysis in the ROI of 4340 (10 mm) without cooling.
Figure 41 Temperature evolution during EHLA without cooling layers 1-35.
Figure 42 Temperature evolution during EHLA without cooling layers 36-70.
0
100
200
300
400
500
0
12
22
34
44
56
66
78
88
100
110
122
132
144
154
164Te
mper
ature
[°C
]
Time [min]
0
100
200
300
400
500
171
178
185
192
199
206
213
220
227
234
241
248
255
262
269
276
283
290
297
304
311
318
325
332Te
mper
ature
[°C
]
Time [min]

42
Edurne Montes Martínez Analysis of the static mechanical properties of iron-based alloys deposited by Extreme high-speed laser
material deposition for additive manufacturing or repair applications
BILBOKO INGENIARITZA ESKOLA
ESCUELA
DE INGENIERÍA DE BILBAO
Microstructure analysis
For the microstructure analysis of the sample, the two parts are also etched with 3 Vol. % Nital (97 Vol.% ethanol and 3 Vol.% nitric acid) solution to demonstrate the microstructure. The microstructure in the substrate (a), interface (b) and layer (c) of the specimen are shown in Figures 43. The grain size of the interface is smaller and finer than that of the substrate which would imply a probable improvement of the mechanical properties with respect to the base material E355 as already verified with the 3 mm build-up in the Chapter 4.2.2 AISI 4340.
Figure 43 Microstructure pictures: substrate (a), interface (b) and layer (c) of the 4340 10 mm build-up.

43
Edurne Montes Martínez Analysis of the static mechanical properties of iron-based alloys deposited by Extreme high-speed laser
material deposition for additive manufacturing or repair applications
BILBOKO INGENIARITZA ESKOLA
ESCUELA
DE INGENIERÍA DE BILBAO
Mechanical properties
The micro hardness measurements are adopted on a cross section of both the substrate and deposited layers, beginning at the last layers moving toward the substrate. Half of the build-up is analyzed with 4 measurements in the left part corresponding to the positions shown in Figure 44.The micro hardness analysis of the build-up material show that the average micro hardness varied from 300 to 400 HV0.1 across all samples. Hardness variations are observed in both the deposited and heat affected zones. Increased hardness is attributed to the process parameters as can be shown in Figure 45.
Figure 44 Micro hardness measurement location in the 4340 10 mm build-up.
Figure 45 Hardness profile of the deposition without cooling for 4340 (10mm).
0
30
60
90
120
150
180
210
240
270
300
330
360
390
420
0,0 0,5 1,0 1,5 2,0 2,5 3,0 3,5 4,0 4,5 5,0 5,5 6,0 6,5 7,0 7,5 8,0
Hard
ne
ss [
HV
0.1
]
Distance from the surface [mm]
left line - line1 middle line - line2 middle line - 3 right line - line4

44
Edurne Montes Martínez Analysis of the static mechanical properties of iron-based alloys deposited by Extreme high-speed laser
material deposition for additive manufacturing or repair applications
BILBOKO INGENIARITZA ESKOLA
ESCUELA
DE INGENIERÍA DE BILBAO
The results obtained are consistent with those obtained after the heat treatment carried out in [37] where in order to release the residual stress and hardness variation due to high thermal gradients attached to the LMD, post heat treatment was performed in accordance with ASM handbook standard [42]. The process involves the heating of the clad plates to 560 °C, and soaking for 3 hours followed by slow cooling to 250 °C over 5 hours, and finally air cooling. This points to the fact that in EHLA, due to the consequent heating of the layers in the constructed volume, it could be considered that the piece undergoes a considerable heat treatment when applied in [37].
The tensile tests are carried out by wbm Prüflabor GmbH at Room temperature (+20°C) according to the DIN EN ISO 6892-1 B: 2017-02.
The material presents a ductile fracture, as can be observed in the Figure 46. The ductile fracture begins with the formation of a neck and the formation of cavities within the zone of strangulation. Then the cavities fuse in a crack in the center of the sample and propagate towards the surface in a direction perpendicular to the applied tension. When it approaches the surface, the crack changes its direction to 45 ° with respect to the tension axis and results in a cone and funnel fracture. The ductile behavior is also confirmed in the strain –stress curve obtained with the information of the tensile tests, Figure 47 and Table 20. An improvements of the mechanical properties: the tensile strength is increased in 300 MPa while the yield strength is the double as the expected from an annealed 4340. The elongation is also similar as the one obtained by annealing (Table 3). The results obtained after the tensile test prove that this material is suitable for the repair of E355 as the properties obtained are similar and even improved.
Figure 46 Tensile samples of 4340 after break.

45
Edurne Montes Martínez Analysis of the static mechanical properties of iron-based alloys deposited by Extreme high-speed laser
material deposition for additive manufacturing or repair applications
BILBOKO INGENIARITZA ESKOLA
ESCUELA
DE INGENIERÍA DE BILBAO
Table 20 Sample dimensions and tensile test results for 4340 10 mm without cooling.
Sample -Nr. wbm
do [mm]
So [mm²]
Fmax [N]
Rp0.2 [Mpa]
Rm [Mpa]
A* [%]
1137.1 4.01 12.63 13404 875 1061 10
1137.2 3.99 12.50 13499 894 1079 17
1137.3 3.99 12.50 12819 862 1025 7
1137.4 3.99 12.50 13347 888 1067 13
1137.5 4.00 12.57 13378 884 1064 12
Figure 47 4340 10 mm build-up with no cooling stress-strain curve.

46
Edurne Montes Martínez Analysis of the static mechanical properties of iron-based alloys deposited by Extreme high-speed laser
material deposition for additive manufacturing or repair applications
BILBOKO INGENIARITZA ESKOLA
ESCUELA
DE INGENIERÍA DE BILBAO
5.4.2 Analysis AISI 4340 – With cooling
In order to reduce the process time due to cooling down and the and so the process time, the same process parameters as in the no cooling 10 mm deposition are used adding an external cooling system with Argon to the process while cladding and in cooling down times. A schematic representation of the cooling system is depictured in the Figure 48.
Figure 48 Schematic representation of the Argon cooling system used during EHLA process.
The decrease of the temperature is up to 100°C so the cooling while deposition is a good choice in order to avoid overheating of the piece. The Figure 49 shows the evolution of the build-up after 25 layers (a)), 50 layers (b)) and the final 80 layers (c)).
Figure 49 Evolution of the build-up of 4340 (10 mm) after 25, 50 and final 80 layers.

47
Edurne Montes Martínez Analysis of the static mechanical properties of iron-based alloys deposited by Extreme high-speed laser
material deposition for additive manufacturing or repair applications
BILBOKO INGENIARITZA ESKOLA
ESCUELA
DE INGENIERÍA DE BILBAO
The presence of a greater airflow during the EHLA process, carries a higher risk of bubbles trapped within the deposited layers, which increases the likelihood of developing pores. The temperature evolution of the process is represented in the Figure 50 (layers 1-45) and Figure 51 (layers 46-85).
Figure 50 Temperature evolution during EHLA with cooling layers 1-45.
Figure 51 Temperature evolution during EHLA with cooling layers 46-85.
Microstructure analysis
Generally, the cooling rates decrease as accumulated heat increases. There is a significant increasing of heat experienced by laser-deposited 4340 samples as the distance from the substrate increased as a result of heat flow in and the build-up of mass, therefore the cooling rates reduce from the first layer to the fifth layer in each set. From this view, the surfaces of the deposited sample exhibited dendritic structure from the laser deposition and showed large, elongated grains. These grains grew epitaxial, inclined in a direction toward the layers following the temperature field resulting from the moving laser beam. The microstructure in the substrate (a), interface (b) and layer (c) of the specimen are shown in Figure 52.
2070
120170220270320370
0 510
15
20
25
30
35
40
45
50
55
60
65
70
75
80
85
90
95
10
010
511
011
512
012
513
013
514
014
515
015
5
TEM
PER
ATU
RE
[ºC
]
TIME [min]
2070
120170220270320370
15
816
316
817
317
818
318
819
319
820
320
821
321
822
322
823
323
824
324
825
325
826
326
827
327
828
328
8TEM
PER
ATU
RE
[ºC
]
TIME [min]

48
Edurne Montes Martínez Analysis of the static mechanical properties of iron-based alloys deposited by Extreme high-speed laser
material deposition for additive manufacturing or repair applications
BILBOKO INGENIARITZA ESKOLA
ESCUELA
DE INGENIERÍA DE BILBAO
Figure 52 Microstructure pictures: substrate (a), interface (b) and layer (c) of the 4340 10 mm build-up with cooling.
Mechanical properties
Figure 54 illustrate the micro-hardness profile along the cross-section of the entire clad zone (CZ), dilution zone (DZ), HAZ and base material zone (BZ) in the positions shown in Figure 53. The measurement points addressed are mean values with an error range of ∼%10. There are four positons selected to take into consideration for measurement of hardness distribution. The values of hardness decline follow the subsequent order: clad zone, interface, base material zone and HAZ, respectively. The highest hardness value appears in CZ with an average value of 350-450 HV0.1. The DZ is really small which is also an advantage of EHLA over traditional laser metal deposition. The hardness experiences a sharp falling down in HAZ with value of 200 HV0.1 (Figure 54), then it increases in the substrate with an average value of 275 HV0.1. The microstructure in different zone is applicable to give a good explanation of this trend.

49
Edurne Montes Martínez Analysis of the static mechanical properties of iron-based alloys deposited by Extreme high-speed laser
material deposition for additive manufacturing or repair applications
BILBOKO INGENIARITZA ESKOLA
ESCUELA
DE INGENIERÍA DE BILBAO
Figure 53 Hardness measurement position of the deposition with cooling for 4340 (10mm).
Figure 54 Hardness profile of the deposition with cooling for 4340 (10mm).
0
30
60
90
120
150
180
210
240
270
300
330
360
390
420
450
480
510
0 1 2 3 4 5 6 7 8 9 10 11
Hard
ne
ss
[H
VO
.1]
Distance from the surface [mm]
left line - line1 middle line - line2 middle line - 3 right line - line4

50
Edurne Montes Martínez Analysis of the static mechanical properties of iron-based alloys deposited by Extreme high-speed laser
material deposition for additive manufacturing or repair applications
BILBOKO INGENIARITZA ESKOLA
ESCUELA
DE INGENIERÍA DE BILBAO
Same commentaries as for the without cooling piece according to the results obtained in the prior study [37]
Tensile test done under the same standard as the no cooling one and same company. The results don’t differ a significantly from the ones obtained for the no cooling process (Figure 56 and Table 21), however there is a considerable reduction in the elongation, more than 50% in some cases, that points out that the 4340 processed without cooling down, and thus the one reaching higher temperatures while processing gives more ductile products. The fracture in the sample has ductile breakage, cone and funnel fracture shape, as the no cooling case, Figure 55.
Figure 55 Tensile samples of 4340 after break.
Table 21 Sample dimensions and tensile test results for 4340 10 mm with cooling.
Sample -Nr. wbm
Do [mm]
So [mm²]
Fmax [N]
Rp0.2 [Mpa]
Rm [Mpa]
A* [%]
1138.1 3.98 12.44 13099 903 1052 6
1138.2 3.99 12.50 13041 909 1042 3
1138.3 4.05 12.88 13360 895 1037 9
1138.4 4.05 12.88 13294 889 1031 9
1138.5 4.00 12.57 13187 910 1049 5

51
Edurne Montes Martínez Analysis of the static mechanical properties of iron-based alloys deposited by Extreme high-speed laser
material deposition for additive manufacturing or repair applications
BILBOKO INGENIARITZA ESKOLA
ESCUELA
DE INGENIERÍA DE BILBAO
Figure 56 4340 10 mm build up with cooling stress-strain curve.
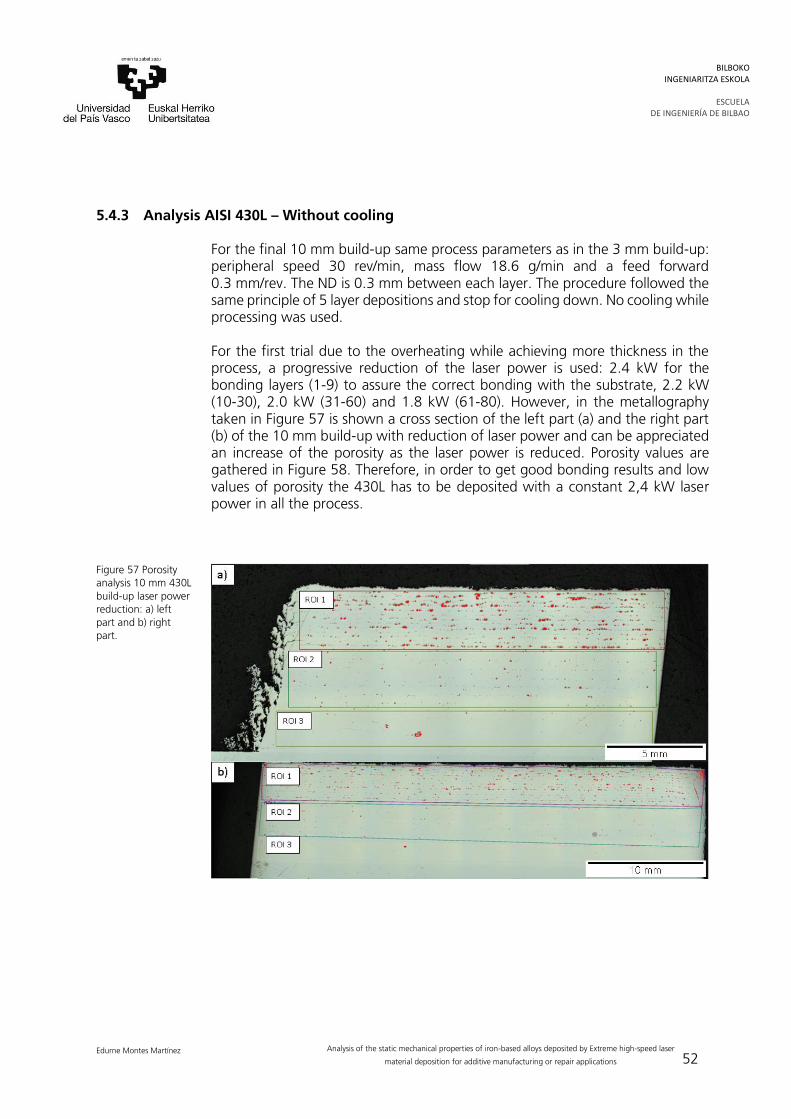
52
Edurne Montes Martínez Analysis of the static mechanical properties of iron-based alloys deposited by Extreme high-speed laser
material deposition for additive manufacturing or repair applications
BILBOKO INGENIARITZA ESKOLA
ESCUELA
DE INGENIERÍA DE BILBAO
5.4.3 Analysis AISI 430L – Without cooling
For the final 10 mm build-up same process parameters as in the 3 mm build-up: peripheral speed 30 rev/min, mass flow 18.6 g/min and a feed forward 0.3 mm/rev. The ND is 0.3 mm between each layer. The procedure followed the same principle of 5 layer depositions and stop for cooling down. No cooling while processing was used.
For the first trial due to the overheating while achieving more thickness in the process, a progressive reduction of the laser power is used: 2.4 kW for the bonding layers (1-9) to assure the correct bonding with the substrate, 2.2 kW (10-30), 2.0 kW (31-60) and 1.8 kW (61-80). However, in the metallography taken in Figure 57 is shown a cross section of the left part (a) and the right part (b) of the 10 mm build-up with reduction of laser power and can be appreciated an increase of the porosity as the laser power is reduced. Porosity values are gathered in Figure 58. Therefore, in order to get good bonding results and low values of porosity the 430L has to be deposited with a constant 2,4 kW laser power in all the process.
Figure 57 Porosity analysis 10 mm 430L build-up laser power reduction: a) left part and b) right part.

53
Edurne Montes Martínez Analysis of the static mechanical properties of iron-based alloys deposited by Extreme high-speed laser
material deposition for additive manufacturing or repair applications
BILBOKO INGENIARITZA ESKOLA
ESCUELA
DE INGENIERÍA DE BILBAO
Figure 58 Porosity analysis 10 mm 430L build-up laser power reduction: left part and right part.
5.4.4 Analysis AISI 430L – With cooling
The process must to be carried out with a constant laser power of 2.4 kW. To avoid an excessive overheating, the number of consecutive layers contributed in each of the blocks was reduced from 5 to 3 blocks. Every 12 layers a nozzle distance readjustment is done (-1.8 mm) to assure the correct working distance. Cooling with Argon is also added while processing. Process parameters are maintained the same. Temperature process in Figure 59.
Figure 59 Temperature evolution during the 430L SS (10 mm). maximum temperature: 395.5 °C.
Analysis thickness and crack appearance
Despite the low porosity level measurements (0.16 % left sample and 0.12 % right sample), the 430L presents cracking problems which is assumed to be due to residual stresses generated by the shrinkage of the material in the cooling process. The cracks occur at opposite ends of the piece and are longitudinal
2,54
0,24 0,16
2,04
0,2 0,070
1
2
3
ROI1 - 1,8 kW ROI2 - 2,0 kW ROI3 - 2,2 kW
Po
rosi
ty (%
)
Left Part Right Part
0
40
80
120
160
200
240
280
320
360
400
010
20
30
40
50
60
70
80
90
10
011
012
013
014
015
016
017
018
019
020
021
022
023
024
025
026
027
028
029
030
031
0
Tem
pera
ture
[ºC
]
Time [min]

54
Edurne Montes Martínez Analysis of the static mechanical properties of iron-based alloys deposited by Extreme high-speed laser
material deposition for additive manufacturing or repair applications
BILBOKO INGENIARITZA ESKOLA
ESCUELA
DE INGENIERÍA DE BILBAO
along the entire length of the contribution (Figure 60). The depth of them is prolonged until the energy is not enough to remain perpendicular to the contribution and bifurcates to right and left 90 degrees of the original crack. The crack propagates through the grain boundaries in the main and perpendicularly in the bifurcations. The formation of cracks usually depends on the microstructure and phases [13], the residual stresses [14], the process parameters [13] and the different thermo-physical properties between the added and base materials [15]. Cracks are thought to originate at spots such as the fractured WC particles, pores and solidification cracks [14] and propagate along brittle eutectic phases in the direction of highest temperature gradient [13], [16], [17], [11].
Figure 60 Crack propagation in 430L (10 mm) intercrystalline main crack across layer with crack branches and intergranular cracked edges.
In order to verify that the generation and propagation of the crack is not due to the high temperature gradients, only 3 mm thickness was deposited layer by layer to always maintain temperatures below 200 ºC (Figure 61). The results show that despite these new conditions the formation of both cracks in perimeter opposite positions continued to occur. However, this effect did not happen as severe as in the low temperatures when the piece entered bright red (third experimental phase temperature around 816 ºC) taking into account the color of the steel), where only small cracks inside the build-up were detected

55
Edurne Montes Martínez Analysis of the static mechanical properties of iron-based alloys deposited by Extreme high-speed laser
material deposition for additive manufacturing or repair applications
BILBOKO INGENIARITZA ESKOLA
ESCUELA
DE INGENIERÍA DE BILBAO
Figure 61 temperature evolution during the 430L SS (3 mm) - layer by layer. Max temperature: 209.6 ºC.
Microstructure analysis
For detecting the microstructure and analyzing that the crack propagation, the sample is etched 10 seconds with V2A Beize two times (Figure 62). The pictures show the microstructure of the sample in 3 different areas: left of the crack (Figure 63), right of the crack (Figure 64) and area non affected by the crack (Figure 65). The letters correspond to different magnification factors: 10 x (a), 20 x (b), 50 x (c) and 50 x with inter-grain deposits measurements (d). The inter-grain deposits have a 2 µm width and different length according to the area but are mostly located in the convergence point of two or more grains.
Figure 62 Crack cross section etched with V2A Beize.

56
Edurne Montes Martínez Analysis of the static mechanical properties of iron-based alloys deposited by Extreme high-speed laser
material deposition for additive manufacturing or repair applications
BILBOKO INGENIARITZA ESKOLA
ESCUELA
DE INGENIERÍA DE BILBAO
Figure 63 Microstructure left side of the crack with different magnification factors: 10 x (a), 20 x (b), 50 x (c) and 50 x with inter-grain deposits measurements (d).
Figure 64 Microstructure right side of the crack with different magnification factors: 10 x (a), 20 x (b), 50 x (c) and 50 x with inter-grain deposits measurements (d).

57
Edurne Montes Martínez Analysis of the static mechanical properties of iron-based alloys deposited by Extreme high-speed laser
material deposition for additive manufacturing or repair applications
BILBOKO INGENIARITZA ESKOLA
ESCUELA
DE INGENIERÍA DE BILBAO
Figure 65 Microstructure non crack affected area with different magnification factors: 10 x (a), 20 x (b), 50 x (c) and 50 x with inter-grain deposits measurements (d).
The depth of the crack pointed to that the break is complete to the length of 10 mm, to distinguish the type of break is proceeded to make some SEM (Figure 66) photographs of the sample forcing the culture along the entire crack. The rupture had to be forced because, despite the fact that the depth of the crack covered almost the entire build-up, there is still cohesion between both parts of it. In the images can be seen the difference between the ruptures produced by the propagation of crack, and that plastic rupture made by means of the application of external force.

58
Edurne Montes Martínez Analysis of the static mechanical properties of iron-based alloys deposited by Extreme high-speed laser
material deposition for additive manufacturing or repair applications
BILBOKO INGENIARITZA ESKOLA
ESCUELA
DE INGENIERÍA DE BILBAO
Figure 66 SEM images with different magnifications of the brittle crack 430L (10 mm).
To differentiate the composition of the grain boundaries and the grain itself, as for the 3mm build-up, EDX measurements are carried out. However in the measurements shown in Figure 67, 68 and 69 the difference between the areas was not remarkable. Only stood out the fact that sometimes there is a small Ni rash in the grain boundaries (up to 0.6%). As said before, since the Ni is not present in the substrate and the powder according to the suppliers of both, this could be a sign of contamination of the powder with a Ni-based powder.

59
Edurne Montes Martínez Analysis of the static mechanical properties of iron-based alloys deposited by Extreme high-speed laser
material deposition for additive manufacturing or repair applications
BILBOKO INGENIARITZA ESKOLA
ESCUELA
DE INGENIERÍA DE BILBAO
Figure 67 EDX analysis of crack-free sample 430L (10 mm) build up with component mass percentage comparison between different spectra.
Figure 68 EDX analysis of crack-free sample 430L build up with component mass percentage comparison between different spectra – grain and grain boundary.
All results in mass%
Spectrum In Statistic C Si Cr Mn Fe Total
Spectrum 2 Yes 7.31 0.68 16.48 0.85 74.68 100.00
Spectrum 3 Yes 5.73 0.57 16.52 0.62 76.56 100.00
All results in mass%
Spectrum In Statistic C Si Cr Mn Fe Total
Spectrum 1 Yes 9,25 0,95 15,74 1,02 73,04 100
Spectrum 2 Yes 7,92 0,74 16,51 0,70 74,13 100
Spectrum 3 Yes 6,09 0,54 17,09 0,50 75,78 100
Spectrum 4 Yes 5,62 0,82 16,78 1,03 75,75 100

60
Edurne Montes Martínez Analysis of the static mechanical properties of iron-based alloys deposited by Extreme high-speed laser
material deposition for additive manufacturing or repair applications
BILBOKO INGENIARITZA ESKOLA
ESCUELA
DE INGENIERÍA DE BILBAO
Figure 69 EDX analysis of crack-free sample 430L build up with component mass percentage comparison between different spectra.
Mechanical properties
Micro-Vickers hardness measurements are performed to measure the hardness of layers, interface and substrate. The sample is divided in two parts and a pair of line measurements is taken in each of the parts of the sample, four measurements in total (Figure 70). The spacing between the points is 100 μm, total length of the lines 12 mm, which makes around 113 measurements per line. The hardness measurements of all the 430L build-up are observed that are bounded mostly between 240 and 320 HV0.1 (Figure 71). Annealed 430 usually has a Vickers hardness around 162 HV0.1 [20], which makes a soft material. Despite getting an increase of the hardness through EHLA the material remains being soft in a lower level.
All results in mass%
Spectrum In Statistic C Si Cr Mn Fe Total
Spectrum 1 Yes 6.79 0.67 16.11 0.59 75.84 100.00
Spectrum 2 Yes 8.77 0.70 16.32 0.60 73.62 100.00
Spectrum 3 Yes 5.04 0.57 16.65 0.67 77.07 100.00
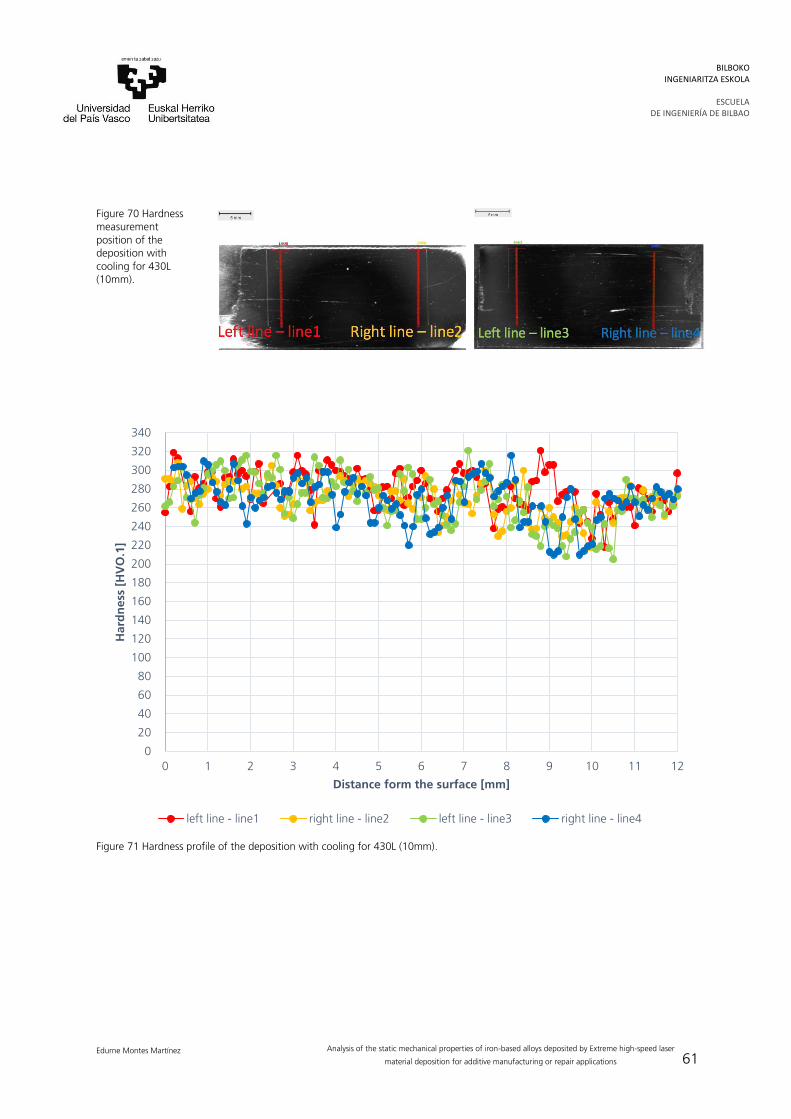
61
Edurne Montes Martínez Analysis of the static mechanical properties of iron-based alloys deposited by Extreme high-speed laser
material deposition for additive manufacturing or repair applications
BILBOKO INGENIARITZA ESKOLA
ESCUELA
DE INGENIERÍA DE BILBAO
Figure 70 Hardness measurement position of the deposition with cooling for 430L (10mm).
Figure 71 Hardness profile of the deposition with cooling for 430L (10mm).
0
20
40
60
80
100
120
140
160
180
200
220
240
260
280
300
320
340
0 1 2 3 4 5 6 7 8 9 10 11 12
Hard
ne
ss [
HV
O.1
]
Distance form the surface [mm]
left line - line1 right line - line2 left line - line3 right line - line4

62
Edurne Montes Martínez Analysis of the static mechanical properties of iron-based alloys deposited by Extreme high-speed laser
material deposition for additive manufacturing or repair applications
BILBOKO INGENIARITZA ESKOLA
ESCUELA
DE INGENIERÍA DE BILBAO
As in the third experimental phase, in order to detect the nature of the grain boundary phase local micro hardness measurements are done. In the Figure 72 the location of the measures are shown with different forces: a) 30 mN, b) 30 mN, c) 30 mN near the BDZ and d) 10 mN.
Figure 72 30mN, Etched 2 - 45s micro hardness local measurements.
In the performance of the tensile test, the brittle fracture takes place without appreciable deformation in the sample, < 1% (Table 22), and due to rapid propagation of a crack. That is why in the samples made with the 430L, as expected, the break occurs perpendicular to the direction of the force, at 90 °, as Figure 73 shows. The material breaks under 6 kN. The strain-stress curve obtained after the tensile test shows also this high brittleness of the 430L (Figure 74).
Figure 73 Tensile sample of 430L with cooling after break.

63
Edurne Montes Martínez Analysis of the static mechanical properties of iron-based alloys deposited by Extreme high-speed laser
material deposition for additive manufacturing or repair applications
BILBOKO INGENIARITZA ESKOLA
ESCUELA
DE INGENIERÍA DE BILBAO
Table 22 Sample dimensions and tensile test results for 430L 10 mm with cooling.
Sample -Nr. wbm
do [mm]
So [mm²]
Fmax [N]
Rp0.2 [Mpa]
Rm [Mpa]
A* [%]
1136.2 4.07 13.01 6006 N/A 461 N/A
1136.3 4.04 12.82 6236 N/A 486 N/A
1136.4 3.99 12.50 6379 N/A 510 N/A
Figure 74 430L 10 mm build up with cooling stress-strain curve.

64
Edurne Montes Martínez Analysis of the static mechanical properties of iron-based alloys deposited by Extreme high-speed laser
material deposition for additive manufacturing or repair applications
BILBOKO INGENIARITZA ESKOLA
ESCUELA
DE INGENIERÍA DE BILBAO
6 Conclusions
The experimental work carried out has consisted in the verification of the viability of 3 iron-based materials AISI 4340, AISI 430L and DIN 16MnCr5 for repair processes using EHLA. For this, an experimental process consisting of 4 work packages was carried out: first analysis of the deposition of a layer of material to select the laser power and feed forward which give low porosity and no bonding defects, second selection of the nozzle displacement according to the thickness obtained in the analysis of a layer by the deposition of blocks of 5 layers, third preliminary study of 3 mm to see the behavior of the material in greater thicknesses and choose the best manufacturing strategy and fourth, and last, build-up of 10 mm to manufacture samples for tensile tests. For each material is concluded that:
AISI 4340 is a suitable option for E355 repair applications. The process is carried out without any further complication more than the time needed for the cooling down. However, the mechanical properties reached are improved from the original ones and even the substrate ones. Higher tensile strength is reached which could imply not only a successful reparation but a prolongation of the life of the piece repaired.
AISI 430L firstly presented as a ductile material is not valid for repair applications: extremely brittle presents cracks not being able to absorb nearly any expansion (<1%). So, despite being able to build-up, the products obtained have no mechanical use under any load. The reason could be the high content of martensite in every grain boundary.
DIN 16MnCr5 experiments show that this material is not suitable for the EHLA process because it has a really unstable deposition with high temperatures which put the nozzle in danger. This could be due to the high content of contaminants in the powder from the manufacturing.
With this work, I want to set a starting base for future experiments with these 3 materials. Special emphasis will be placed on AISI 4340 due to the favorable results obtained: possible subsequent thermal treatments to analyze its response. It is also intended to provide a basis for a deeper understanding of the brittleness of the AISI 430L. Finally, as far as DIN 16MnCr5 is concerned, the use of this material in future projects is pending. New powder will be ordered, if possible from a new supplier and before making any contribution through EHLA, the dust quality will be checked by EDX test.

65
Edurne Montes Martínez Analysis of the static mechanical properties of iron-based alloys deposited by Extreme high-speed laser
material deposition for additive manufacturing or repair applications
BILBOKO INGENIARITZA ESKOLA
ESCUELA
DE INGENIERÍA DE BILBAO
7 References
[1] Schopphoven, T.; Gasser, A.; Backes, G. EHLA: Extreme high-speed laser material deposition. Economical and effective protection against corrosion and wear. Laser-Technik-Journal 14, Nr.4, (2017) Pages.26-29
[2] Schopphoven, T., Gasser, A., Wissenbach, K., and Poprawe, R. Investigations on ultra-high-speed laser material deposition as alternative for hard chrome plating and thermal spraying. Journal of laser applications: JLA 28, Nr.2, Art. 022501, (2016)
[3] Shariff SM, Pal TK, Padmanabham G, Joshi SV. Sliding wear behavior of laser surface modified pearlitic rail steel. Surface Engineering Volume 26- Issue 3, (2010) Pages 199–208.
[4] Kaysser W. Surface Modifications in Aerospace Applications. Surface Engineering Volume 17- Issue 4, (2001) Pages 305-312
[5] Lewis, S.R., Lewis, R. and Fletcher, Assessment of laser cladding as an option for repairing/enhancing rails. D.I. (2015). Wear, 330. Pages 581 - 591. ISSN 0043-1648
[6] S. Desvaux, M. Duquennoy, J. Gualandri, M. Ourak The evaluation of surface residual stress in aeronautic bearings using the Barkhausen noise effect NDT&E Int., 37 (2004) Pages 9-17
[7] C. Veiga, J.P. Davim, A.J.R. Loureiro. Properties and applications of titanium alloys: a brief review Rev. Adv. Mater. Sci., 32 (2012) Pages133-148
[8] T.E. Norgate, S. Jahanshahi, W.J. Rankin. Assessing the environmental impact of metal production processes J. Clean. Prod., 15 (2007) Pages 838-848
[9] Benteler Steel/Tube GmbH data test E355 (+C)
[10] Chongliang Zhong. Experimental study of effects of main process parameters on porosity, track geometry, deposition rate, and powder efficiency for high deposition rate laser metal deposition. Fraunhofer-Institut für Lasertechnik ILT, Aachen 52074, Germany. Journal of Laser Applications 27, 042003 (2015)

66
Edurne Montes Martínez Analysis of the static mechanical properties of iron-based alloys deposited by Extreme high-speed laser
material deposition for additive manufacturing or repair applications
BILBOKO INGENIARITZA ESKOLA
ESCUELA
DE INGENIERÍA DE BILBAO
[11] Lijun Song, Guangcheng Zeng, Hui Xiao, Xianfeng Xiao, Simeng Li. Repair of 304 stainless steel by laser cladding with 316L stainless steel powders followed by laser surface alloying with WC powders. Journal of Manufacturing Processes. Volume 24, Part 1, (2016) Pages 116-124
[12] Zhong C., Gasser A., Schopphoven, T., Poprawe R. Experimental study of porosity reduction in high deposition-rate Laser Material Deposition. Optics & Laser Technology 75 (2015). Pages: 87–92
[13] Zhou SF, Zeng XY, Hu QW, Huang YJ. Analysis of crack behavior for Ni-based WC composite coatings by laser cladding and crack-free realization Applied Surface Science. Volume 255, Issue 5, Part 1, (2008), Pages 1646-1653
[14] Lee C, Park H, Yoo J, Lee C, Woo W, Park S. Residual stress and crack initiation in laser clad composite layer with Co-based alloy and WC plus NiCr. Applied Surface Science, Vol.345, (2015) Pages 286-294
[15] Kadolkar PB, Watkins TR, De Hosson JTM, Kooi BJ, Dahotre NB. State of residual stress in laser-deposited ceramic composite coatings on aluminum alloys. Acta Materialia. Volume 55, Issue 4, (2007), Pages 1203-1214
[16] Wang JD, Li LQ, Tao W. Crack initiation and propagation behavior of WC particles reinforced Fe-based metal matrix composite produced by laser melting deposition. Optics & Laser Technology. Volume 82, (2016), Pages 170-182
[17] Ignat S, Sallamand P, Nichici A, Vannes B, Grevey D, Cicala E. MoSi MoSi2 laser cladding - Elaboration, characterization and addition of non-stabilized ZrO2 powder particles. Intermetallics.11:931–8. (2003)
[18] https://www.industrial-lasers.com/articles/print/volume-27/issue-06/features/laser-cladding-replaces-tig-for-industrial-gas-turbines.html 13.09.2018
[19] https://www.azom.com 13.09.2018
[20] http://www.steelnumber.com13.09.2018
[21] Lippold J, Kotecki D. Welding metallurgy and weldability of stainless steel. USA: John Wiley and Sons (2005)
[22] K. Devendranath Ramkumar, Aditya Chandrasekhar, Aditya Kumar Singh, Sharang Ahuja, Anurag Agarwal, N. Arivazhagan, Arul Maxiumus Rabel. Comparative studies on the weldability, microstructure and tensile properties of autogenous TIG welded AISI 430 ferritic stainless steel with and without flux. Journal of Manufacturing Processes 20 (2015) Pages 54–69.

67
Edurne Montes Martínez Analysis of the static mechanical properties of iron-based alloys deposited by Extreme high-speed laser
material deposition for additive manufacturing or repair applications
BILBOKO INGENIARITZA ESKOLA
ESCUELA
DE INGENIERÍA DE BILBAO
[23] https://www.engineeringtoolbox.com/tempering-colors-steel-d_1530.html 13.09.2018
[24] Íñigo Agote. Nuevas aplicaciones Industriales de WAAM, LMD y Binder Jetting. Jornadas sobre Fabricación Aditiva. Tecnalia. Addit 3D by BIEMH Feria internacional de Fabricación Aditiva y 3D. 06.06.2017.
[25] C.A. Brice, Kl Schwendner, D.W. Mahaffey, E.H. Mooret, H.L. Fraser. Process variable effects on laser deposited Ti–6Al–4V, Solid freeform fabrication proceedings. Solid Freeform Fabrication Symposium, University of Texas, Austin, TX, (1999) Pages 369–374.
[26] P.A. Kobryn, E.H. Moore, S.L. Semiatin, The effect of laser power and traverse speed on microstructure, porosity, and build height in laser-deposited Ti–6Al– 4V, Scr.Mater.43 (2000) Pages 299–305.
[27] D.F.Susan, J.D.Puskar, J.A.Brooks, C.V.Robino, Quantitative characterization of porosity in stainless steel LENS, Mater. Charact. 57 (2006) Pages 36–43.
[28] Leijun Li, Repair of directionally solidified superalloy GTD-111by laser-engineered netshaping, J.Mater.Sci.41 (2006) Pages 7886–7893.
[29] https://www.materials.sandvik/en/products/metal-powder/list-of-materials/ 25.09.2018
[30] Ouyang J.H., Nowotny S., Richter A., and Beyer E., Characterization of laser clad yttria partially-stabilized ZrO2 ceramic layers on steel 16MnCr5, Surf. Coat. Technol,137: 12. (2001)
[31] A. Techel, A. Luft, A. Muller, S. Nowotny. Production of hard metal-like wear protection coatings by C02 laser cladding. Optical and Quantum Electronics 27 (1995) Pages1313-1318
[32] Mustafa Ulutan, Koray Kiliçay, Osman Nuri Çelik, Ümit Er. Microstructure and wear behaviour of plasma transferred arc (PTA)-deposited FeCrC composite coatings on AISI 5115 steel. Journal of Materials Processing Technology 236 (2016) Pages 26–34
[33] A. Yakovlev, Ph. Bertrand, I. Smurov. Laser cladding of wear resistant metal matrix composite coatings. Thin Solid Films. Volumes 453–454, 1(2004) Pages 133-138
[34] I. Smurov. Laser cladding and laser assisted direct manufacturing. Surface and Coatings Technology. Volume 202, Issue 18, (2008) Pages 4496-4502

68
Edurne Montes Martínez Analysis of the static mechanical properties of iron-based alloys deposited by Extreme high-speed laser
material deposition for additive manufacturing or repair applications
BILBOKO INGENIARITZA ESKOLA
ESCUELA
DE INGENIERÍA DE BILBAO
[35] Artem Yakovlev, Artem Yakovlev, Ph. Bertrand, Ph. Bertrand, Igor Yu. Smurov, Igor Yu. Smurov. Development of 3D functionally graded models by laser-assisted coaxial powder injection, Proc. SPIE 5399, Laser-Assisted Micro- and Nanotechnologies 2003, (2004)
[36] I. SmurovEmail authorM. DoubenskaiaS. N. GrigorievD. V. KotobanP. A. Podrabinnik. Application of laser surface engineering to solve tribological problems. Journal of Friction and Wear. Volume 35, Issue 6, (2014) Pages 470–476
[37] Shi Da Sun, Qianchu Liu, Milan Brandt, Madabhushi Janardhana, and Graham Clark. Microstructure and mechanical properties of laser cladding repair of AISI 4340 steel. 28th International Congress of the Aeronautical Sciences (2012)
[38] Bhattacharya S, Dinda G P, Dasgupta A K and Mazumder J. Microstructural evolution of AISI 4340 steel during Direct Metal Deposition process, Materials Science and Engineering: A. Vol. 528, No. 6. (2011) Pages 2309-2318
[39] Fastow M, Bamberger M, Nir N and Landkof M. Laser surface melting of AISI 4340 steel, Materials Science and Technology. Vol. 6, No. 9.(1990) Pages 900-904
[40] McDaniels R L, White S A, Liaw K, Chen L, McCay M H and Liaw P K. Effects of a laser surface processing induced heat-affected zone on the fatigue behavior of AISI 4340 steel, Materials Science and Engineering: A. Vol. 485, No. 1-2.(2008) Pages 500-507
[41] Liu Q, Janardhana M, Hinton B, Brandt M and Sharp K. Laser cladding as a potential repair technology for damaged aircraft components, International Journal of Structural Integrity. Vol. 2, No. 3. (2009) Pages 314-331
[42] Canonico D A. Stress-Relief Heat Treating of Steel. Heat Treating, ASM Metals Handbook. Vol. 4, No. 1. (1991) Pages 81-84

69
Edurne Montes Martínez Analysis of the static mechanical properties of iron-based alloys deposited by Extreme high-speed laser
material deposition for additive manufacturing or repair applications
BILBOKO INGENIARITZA ESKOLA
ESCUELA
DE INGENIERÍA DE BILBAO
Annex I
Metallography all experiments First and Second Phase of AISI 4340
First Experimental Phase
Table I - 1 Process parameter combination for one layer 4340 powder deposition
FIGURE I -
Laser Power [W]
Feed forward [mm/u]
Max. thickness [µm]
Min. thickness [µm]
Distance peak valley [µm]
Average thickness [µm]
Bonding OK?
Theoretical height 5 layers [mm]
1 1800 0.2 382 291 91 327.71 No 1.64
2 2000 0.2 377 291 86 329.75 No 1.65
3 2200 0.2 325 285 40 314.38 Yes 1.57
4 1600 0.2 436 241 195 303.33 No 1.52
5 1800 0.25 303 205 98 251.57 No 1.26
6 2000 0.25 310 242 68 285.00 No 1.43
7 2200 0.25 293 230 63 260.63 Yes 1.30
8 2200 0.3 238 153 85 206.30 Yes 1.03
9 2000 0.3 200 144 56 168.18 No 0.84
10 1800 0.3 252 196 56 221.00 No 1.11
11 1800 0.35 248 180 68 218.14 No 1.09
12 2000 0.35 204 186 18 194.00 Yes 0.97
13 2200 0.35 178 150 28 168.67 Yes 0.84
14 2000 0.4 195 178 17 184.00 Yes 0.92
Figure I - 1

70
Edurne Montes Martínez Analysis of the static mechanical properties of iron-based alloys deposited by Extreme high-speed laser
material deposition for additive manufacturing or repair applications
BILBOKO INGENIARITZA ESKOLA
ESCUELA
DE INGENIERÍA DE BILBAO
Figure I - 2
Figure I - 3
Figure I - 4
Figure I - 5
Figure I - 6

71
Edurne Montes Martínez Analysis of the static mechanical properties of iron-based alloys deposited by Extreme high-speed laser
material deposition for additive manufacturing or repair applications
BILBOKO INGENIARITZA ESKOLA
ESCUELA
DE INGENIERÍA DE BILBAO
Figure I - 7
Figure I - 8
Figure I - 9
Figure I - 10
Figure I - 11

72
Edurne Montes Martínez Analysis of the static mechanical properties of iron-based alloys deposited by Extreme high-speed laser
material deposition for additive manufacturing or repair applications
BILBOKO INGENIARITZA ESKOLA
ESCUELA
DE INGENIERÍA DE BILBAO
Figure I - 12
Figure I - 13
Figure I - 14
Second Experimental Phase
Table I - 2 Process parameter combination for 5 layer 4340 powder deposition
FIGURE I -
Laser Power [W]
Feed forward [mm/u]
ND [mm]
Max. thickness [µm]
Min. thickness [µm]
Distance peak valley [µm]
Average thickness [µm]
Expected height [mm]
Deviation
15 2200 0.35 0.15 543 477 66 519.17 0.75 31%
16 2200 0.35 0.2 590 489 101 563.83 1 44%
Figure I - 15

73
Edurne Montes Martínez Analysis of the static mechanical properties of iron-based alloys deposited by Extreme high-speed laser
material deposition for additive manufacturing or repair applications
BILBOKO INGENIARITZA ESKOLA
ESCUELA
DE INGENIERÍA DE BILBAO
Figure I - 16

74
Edurne Montes Martínez Analysis of the static mechanical properties of iron-based alloys deposited by Extreme high-speed laser
material deposition for additive manufacturing or repair applications
BILBOKO INGENIARITZA ESKOLA
ESCUELA
DE INGENIERÍA DE BILBAO
Annex II
Metallography all experiments First and Second Phase of AISI 430L
First Experimental Phase
FIGURE II -
Laser Power [W]
Feed forward [mm/u]
Max. thickness [µm]
Min. thickness [µm]
Distance peak valley [µm]
Average thickness [µm]
Bonding OK?
Theoretical height 5 layers [mm]
1 1800 0.2 303.86 230.63 73.23 267.25 No 1.336
2 1800 0.25 304.95 177.07 127.88 241.01 No 1.205
3 1800 0.3 230.30 98.37 131.93 164.34 No 0.822
4 2000 0.2 369.44 285.28 84.16 327.36 No 1.637
5 2000 0.25 365.07 237.19 127.88 301.13 No 1.506
6 2000 0.3 231.67 196.74 34.93 214.21 No 1.071
7 2200 0.2 326,81 216.42 110.39 271.62 No 1.358
8 2200 0.25 294.18 167.23 126.95 230.71 No 1.154
9 2200 0.3 260.14 161.77 98.37 210.96 No 1.055
10 2400 0.2 433.93 345.39 88.54 389.66 Yes 1.948
11 2400 0.25 348.67 274.35 74.32 311.51 Yes 1.558
12 2400 0.3 295.12 216.42 78.70 255.77 Yes 1.279
Table II - 1 process parameters for 430L one layer deposition
Figure II - 1
Figure II - 2

75
Edurne Montes Martínez Analysis of the static mechanical properties of iron-based alloys deposited by Extreme high-speed laser
material deposition for additive manufacturing or repair applications
BILBOKO INGENIARITZA ESKOLA
ESCUELA
DE INGENIERÍA DE BILBAO
Figure II - 3
Figure II - 4
Figure II - 5
Figure II - 6
Figure II - 7

76
Edurne Montes Martínez Analysis of the static mechanical properties of iron-based alloys deposited by Extreme high-speed laser
material deposition for additive manufacturing or repair applications
BILBOKO INGENIARITZA ESKOLA
ESCUELA
DE INGENIERÍA DE BILBAO
Figure II - 8
Figure II - 9
Figure II - 10
Figure II - 11
Figure II - 12

77
Edurne Montes Martínez Analysis of the static mechanical properties of iron-based alloys deposited by Extreme high-speed laser
material deposition for additive manufacturing or repair applications
BILBOKO INGENIARITZA ESKOLA
ESCUELA
DE INGENIERÍA DE BILBAO
Second Experimental Phase
Table II - 2 Process parameter used for Second Experimental Phase of 430L SS. Same direction and Zig-Zag configurations
Strategy Figure II-
Laser Power [W]
Feed forward [mm/u]
ND [mm]
Strategy Figure II-
Laser Power [W]
Feed forward [mm/u]
ND [mm]
Same direction
13 2400 0.2 0.2
Zig-Zag
19 2400 0.2 0.2
14 2400 0.25 0.2 20 2400 0.3 0.2
15 2400 0.3 0.2 21 2400 0.2 0.3
16 2400 0.2 0.3 22 2400 0.3 0.3
17 2400 0.25 0.3
18 2400 0.3 0.3
Table II - 3 Process parameter, thickness measurement and deviation calculation of second phase 430L deposition
Figure II -
Strategy Laser Power
[W]
Feed forward [mm/u]
ND [mm]
Max. thickness
[µm]
Min. thickness
[µm]
Distance peak-valley
[µm]
Average thickness
[µm]
Expected thickness
[mm]
Deviation [%]
13 Same direction
2400 0.2 0.2 2173 1577 596 1980 1 98
14 Same direction
2400 0.25 0.2 1712 1544 168 1625 1 63
15 Same direction
2400 0.3 0.2 1439 1290 149 1367 1 37
16 Same direction
2400 0.2 0.3 2117.87 1839.20 278.67 1991.70 1.5 33
17 Same direction
2400 0.25 0.3 1669.86 1511.23 158.63 1569.10 1.5 5
18 Same direction
2400 0.3 0.3 1429.78 1329.02 100.75 1367.61 1.5 9
19 Zig-zag 2400 0.2 0.2 1732.02 1672.00 60.02051 1702.01 1 70
20 Zig-zag 2400 0.3 0.2 1213.27 1026.78 186.4924 1144.94 1 14
21 Zig-zag 2400 0.2 0.3 1747.02 1618.41 128.6155 1678.43 1.5 12
22 Zig-zag 2400 0.3 0.3 1176.83 1110.38 66.45129 1135.74 1.5 24

78
Edurne Montes Martínez Analysis of the static mechanical properties of iron-based alloys deposited by Extreme high-speed laser
material deposition for additive manufacturing or repair applications
BILBOKO INGENIARITZA ESKOLA
ESCUELA
DE INGENIERÍA DE BILBAO
Figure II - 13
Figure II - 14
Figure II - 15
Figure II - 16

79
Edurne Montes Martínez Analysis of the static mechanical properties of iron-based alloys deposited by Extreme high-speed laser
material deposition for additive manufacturing or repair applications
BILBOKO INGENIARITZA ESKOLA
ESCUELA
DE INGENIERÍA DE BILBAO
Figure II - 17
Figure II - 18
Figure II - 19
Figure II - 20
Figure II - 21

80
Edurne Montes Martínez Analysis of the static mechanical properties of iron-based alloys deposited by Extreme high-speed laser
material deposition for additive manufacturing or repair applications
BILBOKO INGENIARITZA ESKOLA
ESCUELA
DE INGENIERÍA DE BILBAO
Figure II - 22

81
Edurne Montes Martínez Analysis of the static mechanical properties of iron-based alloys deposited by Extreme high-speed laser
material deposition for additive manufacturing or repair applications
BILBOKO INGENIARITZA ESKOLA
ESCUELA
DE INGENIERÍA DE BILBAO
Annex III
Metallography all experiments First and Second Phase of DIN 16MnCr5
First Experimental Phase
Table III - 1 Process parameters one layer deposition 16MnCr5
FIGURE III-
Peripheral speed
Speed conveyor plate
Powder mass flow
Carrier gas flow
Shielding gas flow
Laser beam diameter
Laser Power
F Feed forward
[W] [mm/u]
[m/min] [u/min] [g/min] [l/min] [l/min] [mm]
1 30 5.5 17.67 4 10 1.2 1600 0.2
2 30 5.5 17.67 4 10 1.2 1800 0.2
3 30 5.5 17.67 5 10 1.2 1800 0.3
4 30 5.5 17.67 5 10 1.2 1600 0.3
5 50 5.5 17.67 5 10 1.2 1800 0.25
6 50 6.5 18.67 5 10 1.2 2000 0.25
7 30 5.5 17.67 6 10 1.2 1800 0.25
8 40 5.5 17.67 6 10 1.2 1800 0.25
9 50 5.5 17.67 6 10 1.2 1800 0.25
10 50 6.0 18.27 6 10 1.2 1800 0.25
11 50 6.5 18.67 6 10 1.2 1800 0.25
12 30 6.5 18.67 6 10 1.2 1800 0.3
13 40 6.5 18.67 6 10 1.2 1800 0.3
14 40 7.0 18.96 6 10 1.2 1800 0.3
15 50 7.0 18.96 6 10 1.2 1800 0.3
16 30 5.5 17.67 6 10 1.2 1800 0.3
17 30 5.5 17.67 6 10 1.2 1600 0.3

82
Edurne Montes Martínez Analysis of the static mechanical properties of iron-based alloys deposited by Extreme high-speed laser
material deposition for additive manufacturing or repair applications
BILBOKO INGENIARITZA ESKOLA
ESCUELA
DE INGENIERÍA DE BILBAO
Table III - 2 Thickness measurements one layer deposition 16MnCr5
FIGURE III -
Max. Thickness
Min. Thickness
Mean Standard Deviation
Bonding OK? Theoretical height 5 layers
[µm] [µm] [µm] [µm] Yes/No [mm]
1 315.75 197.34 268.06 35.54 No 1.34
2 281.76 194.05 250.51 30.93 No 1.25
3 225.85 106.35 156.17 35.47 Yes 0.78
4 237.91 43.85 159.27 54.71 No 0.80
5 155.68 55.91 118.09 37.96 Yes 0.59
6 209.40 103.06 149.73 34.01 No 0.75
7 254.35 164.45 208.15 33.65 Yes 1.04
8 166.64 43.85 113.39 40.62 No 0.57
9 149.10 63.59 92.25 27.64 Yes 0.46
10 167.74 57.01 109.30 28.67 Yes 0.55
11 173.22 75.65 136.31 33.14 No 0.68
12 122.97 36.2 89.79 33.43 No 0.45
13 210.68 111.91 152.62 30.04 No 0.76
14 201.97 62.53 133.73 43.38 No 0.67
15 192.24 62.58 132.45 40.82 No 0.66
16 186.84 99.98 146.51 37.34 No 0.73
17 208.41 30.78 129.55 60.89 Y 0.65
Figure III - 1
Figure III - 2
Figure III - 3

83
Edurne Montes Martínez Analysis of the static mechanical properties of iron-based alloys deposited by Extreme high-speed laser
material deposition for additive manufacturing or repair applications
BILBOKO INGENIARITZA ESKOLA
ESCUELA
DE INGENIERÍA DE BILBAO
Figure III - 4
Figure III - 5
Figure III - 6
Figure III - 7
Figure III - 8
Figure III - 9
Figure III - 10
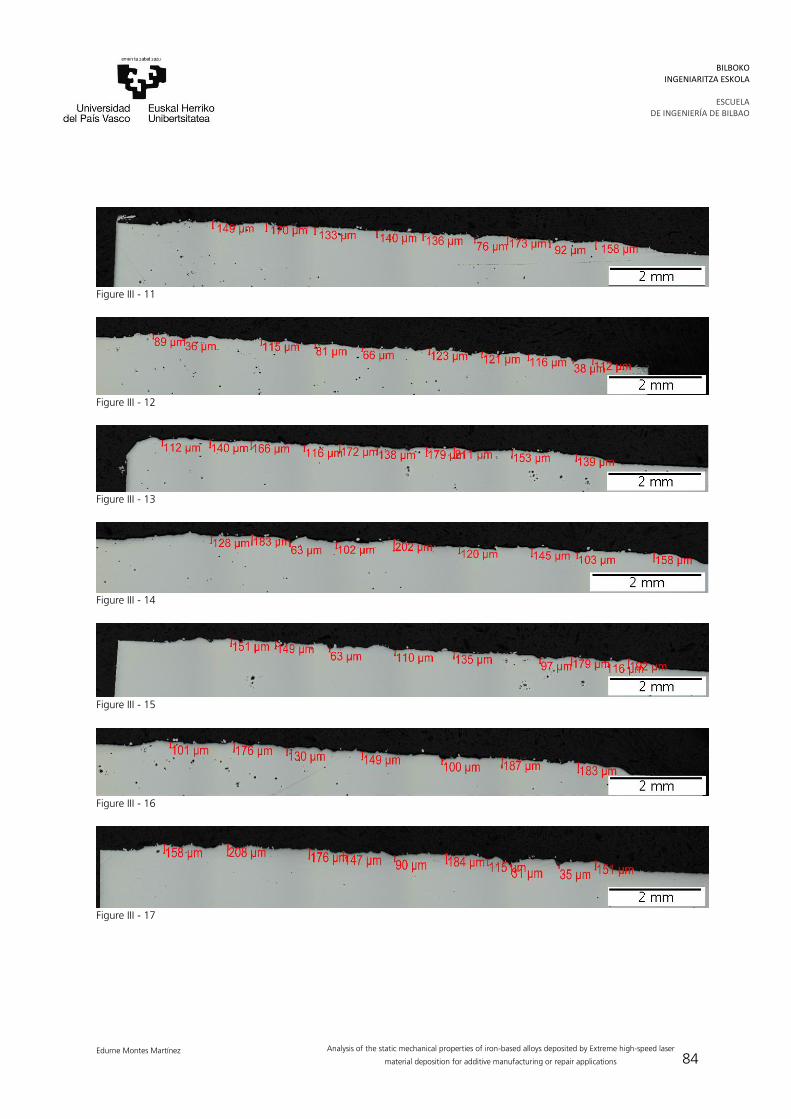
84
Edurne Montes Martínez Analysis of the static mechanical properties of iron-based alloys deposited by Extreme high-speed laser
material deposition for additive manufacturing or repair applications
BILBOKO INGENIARITZA ESKOLA
ESCUELA
DE INGENIERÍA DE BILBAO
Figure III - 11
Figure III - 12
Figure III - 13
Figure III - 14
Figure III - 15
Figure III - 16
Figure III - 17

85
Edurne Montes Martínez Analysis of the static mechanical properties of iron-based alloys deposited by Extreme high-speed laser
material deposition for additive manufacturing or repair applications
BILBOKO INGENIARITZA ESKOLA
ESCUELA
DE INGENIERÍA DE BILBAO
Second Experimental Phase
Table III - 3 process parameters 5 layer deposition 16MnCr5 – First Trial
FIGURE III -
Peripheral speed vp
Speed conveyor plate
Powder mass flow
Carrier gas flow
Shielding gas flow
Laser beam diameter
Laser Power
F Feed forward
ND
(W) (mm/u) (mm)
(m/min) (U/min) (g/min) (l/min) (l/min) (mm)
18 50 6 18.27 6 10 1.2 1800 0.25 0.08
19 50 6 18.27 6 10 1.2 1800 0.25 0.10
20 50 6 18.27 6 10 1.2 1800 0.25 0.12
21 50 6 18.27 6 10 1.2 2000 0.25 0.15
22 50 6 18.27 7 10 1.2 2000 0.25 0.15
23 50 6 18.27 8 10 1.2 2000 0.25 0.15
24 50 6 18.27 6 10 1.2 2200 0.25 0.15
25 50 6 18.27 6 10 1.2 2200 0.25 0.15
26 50 6 18.27 7 10 1.2 2200 0.25 0.15
Table III - 4 Thickness of the 5 layer build up and deviation of the achieved thickness from the theoretical one expected in the First trial
FIGURE III -
Max. Thickness
Min. Thickness
Mean Standard Deviation
Bonding OK?
ND Expected
Thickness after 5 layers
Real thickness after
5 layers Deviation
[µm] [µm] [µm] [µm] Yes/No [mm] [mm] [mm] [%}
18 868.30 701.66 818.34 54.75 No 0.08 0.40 0.818 104.59
19 923.12 674.25 836.33 91.78 No 0.10 0.50 0.836 67.27
20 911.06 760.86 873.63 51.65 No 0.12 0.60 0.874 45.61
21 663.00 531.00 590.57 51.32 Yes 0.15 0.75 0.591 21.26
22 567.91 505.41 532.35 24.06 Yes 0.15 0.75 0.532 29.02
23 548.17 414.42 496.64 48.04 Yes 0.15 0.75 0.497 33.78
24 376.32 120.64 250.73 91.66 Yes 0.15
25 348.64 151.30 253.15 64.68 Yes 0.15
26 459.41 208.41 366.73 8.18 Yes 0.15

86
Edurne Montes Martínez Analysis of the static mechanical properties of iron-based alloys deposited by Extreme high-speed laser
material deposition for additive manufacturing or repair applications
BILBOKO INGENIARITZA ESKOLA
ESCUELA
DE INGENIERÍA DE BILBAO
Figure III - 18
Figure III - 19
Figure III - 20

87
Edurne Montes Martínez Analysis of the static mechanical properties of iron-based alloys deposited by Extreme high-speed laser
material deposition for additive manufacturing or repair applications
BILBOKO INGENIARITZA ESKOLA
ESCUELA
DE INGENIERÍA DE BILBAO
Figure III - 21
Figure III - 22
Figure III - 23

88
Edurne Montes Martínez Analysis of the static mechanical properties of iron-based alloys deposited by Extreme high-speed laser
material deposition for additive manufacturing or repair applications
BILBOKO INGENIARITZA ESKOLA
ESCUELA
DE INGENIERÍA DE BILBAO
Figure III - 24
Figure III - 25
Figure III - 26

89
Edurne Montes Martínez Analysis of the static mechanical properties of iron-based alloys deposited by Extreme high-speed laser
material deposition for additive manufacturing or repair applications
BILBOKO INGENIARITZA ESKOLA
ESCUELA
DE INGENIERÍA DE BILBAO
EDX measurements results
Process option: All elements analyzed (normalized) Table III - 5
Spectrum In Statistic C O Al Si Ti Cr Mn Fe Zr Total Spectrum 1
Yes 2.53 55.89 18.82 5.85 1.47 0.53 7.64 2.36 4.91 100.00
Spectrum 2
Yes 5.09 0.37 0.97 0.90 92.66 100.00
Spectrum 3
Yes 4.80 4.71 0.39 0.97 0.93 88.21 100.00
Max. 4.80 55.89 18.82 5.85 1.47 0.97 7.64 92.66 4.91 Min. 2.53 4.71 0.37 5.85 1.47 0.53 0.90 2.36 4.91
All results in mass%
Figure III - 27
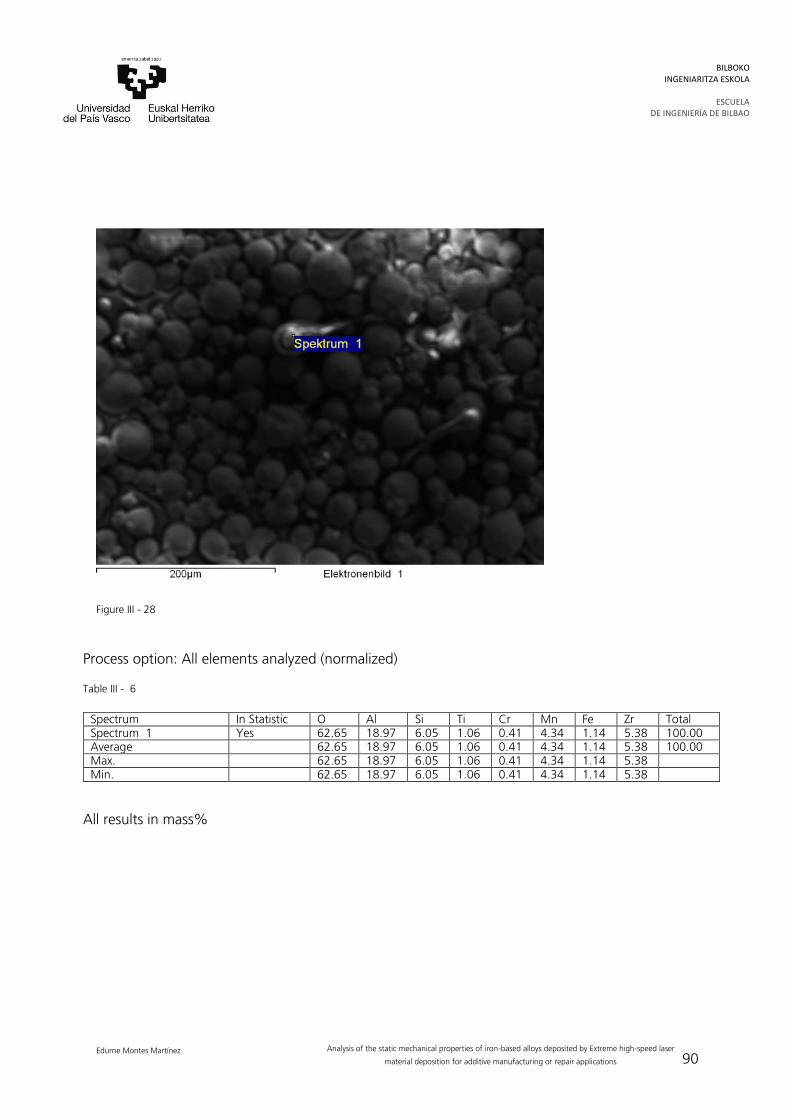
90
Edurne Montes Martínez Analysis of the static mechanical properties of iron-based alloys deposited by Extreme high-speed laser
material deposition for additive manufacturing or repair applications
BILBOKO INGENIARITZA ESKOLA
ESCUELA
DE INGENIERÍA DE BILBAO
Figure III - 28
Process option: All elements analyzed (normalized) Table III - 6
Spectrum In Statistic O Al Si Ti Cr Mn Fe Zr Total Spectrum 1 Yes 62.65 18.97 6.05 1.06 0.41 4.34 1.14 5.38 100.00 Average 62.65 18.97 6.05 1.06 0.41 4.34 1.14 5.38 100.00 Max. 62.65 18.97 6.05 1.06 0.41 4.34 1.14 5.38 Min. 62.65 18.97 6.05 1.06 0.41 4.34 1.14 5.38
All results in mass%

91
Edurne Montes Martínez Analysis of the static mechanical properties of iron-based alloys deposited by Extreme high-speed laser
material deposition for additive manufacturing or repair applications
BILBOKO INGENIARITZA ESKOLA
ESCUELA
DE INGENIERÍA DE BILBAO
Figure III - 29
Process option: All elements analyzed (normalized) Table III - 7
Spectrum In Statistic O Al Si Ti Cr Mn Fe Zr Total Spectrum 1 Yes 53.81 20.75 6.57 1.52 0.59 8.82 2.26 5.68 100.00 Average 53.81 20.75 6.57 1.52 0.59 8.82 2.26 5.68 100.00 Max. 53.81 20.75 6.57 1.52 0.59 8.82 2.26 5.68 Min. 53.81 20.75 6.57 1.52 0.59 8.82 2.26 5.68
All results in mass%