analysis of unconventional oil and gas impacts …
TRANSCRIPT

Graduate Theses, Dissertations, and Problem Reports
2019
ANALYSIS OF UNCONVENTIONAL OIL AND GAS IMPACTS ON ANALYSIS OF UNCONVENTIONAL OIL AND GAS IMPACTS ON
DOWNSTREAM FISH ASSEMBLAGES AND PHYSIOLOGICAL DOWNSTREAM FISH ASSEMBLAGES AND PHYSIOLOGICAL
STRESS STRESS
Joshua Noah Ankeny West Virginia University, [email protected]
Follow this and additional works at: https://researchrepository.wvu.edu/etd
Part of the Aquaculture and Fisheries Commons, and the Biodiversity Commons
Recommended Citation Recommended Citation Ankeny, Joshua Noah, "ANALYSIS OF UNCONVENTIONAL OIL AND GAS IMPACTS ON DOWNSTREAM FISH ASSEMBLAGES AND PHYSIOLOGICAL STRESS" (2019). Graduate Theses, Dissertations, and Problem Reports. 3789. https://researchrepository.wvu.edu/etd/3789
This Thesis is protected by copyright and/or related rights. It has been brought to you by the The Research Repository @ WVU with permission from the rights-holder(s). You are free to use this Thesis in any way that is permitted by the copyright and related rights legislation that applies to your use. For other uses you must obtain permission from the rights-holder(s) directly, unless additional rights are indicated by a Creative Commons license in the record and/ or on the work itself. This Thesis has been accepted for inclusion in WVU Graduate Theses, Dissertations, and Problem Reports collection by an authorized administrator of The Research Repository @ WVU. For more information, please contact [email protected].

ANALYSIS OF UNCONVENTIONAL OIL AND GAS IMPACTS ON DOWNSTREAM FISH
ASSEMBLAGES AND PHYSIOLOGICAL STRESS
Joshua Ankeny
Thesis submitted
to the Davis College of Agriculture, Natural Resources, and Design
At West Virginia University
in partial fulfillment of the requirements for the degree of
Master of Science in
Wildlife and Fisheries Resources
J Todd Petty, Ph.D., Chair
Quinton Phelps, Ph.D.
Eric Merriam, Ph.D.
School of Natural Resources
Wildlife and Fisheries Resources Program
Morgantown, West Virginia
2019
Keywords: unconventional oil and gas, hydraulic fracturing, shale gas extraction, hematocrit,
fish communities, fisheries management
Copyright 2019 Joshua Ankeny

ABSTRACT
Analysis of Unconventional Oil and Gas Impacts on Downstream Fish Assemblages and
Physiological Stress
Joshua Ankeny
Unconventional Oil and Gas (UOG) production has been steadily expanding throughout the mid-Atlantic since 2008. Increased sedimentation, degraded water chemistry and an overall decrease in habitat quality due to UOG is anticipated to negatively impact aquatic inhabitants, a common observation in other stressed landscapes (i.e., mining, agriculture, development). We assessed stream health through both community analysis and physiological parameters (i.e., growth and hematocrit). A before-after-control-impact study uncovered three fish metrics that were significantly different following UOG disturbances. The invertivore-piscivore metric decreased following UOG disturbance (p = 0.045) whereas two benthic metrics saw a surprising increase (p = 0.003 and p = 0.011). Further analysis revealed that fish communities are becoming more uniform as tolerant taxa proliferate through the chronically degraded systems. An ANCOVA alongside a linear mixed effect model failed to find a significant difference between the weight and length of Semotilus atromaculatus residing in both treatment conditions. S. atromaculatus were tested for hematological responses within eleven UOG impacted sites and eight reference sites with a linear mixed effect model. Hematocrit levels were found to be significantly lower in S. atromaculatus residing within UOG impacted streams (p = 0.029). A weak negative correlation (r = -0.397) suggests that as UOG well density increases, resident fish health decreases. Our findings indicate that in systems chronically impaired by anthropogenic stressors, physiological health indicators may provide better insight than community analyses. Additionally, we predict that the steady expansion of horizontal wells could lead to an overall degradation of resident fish populations as they exhibit degraded health. Our findings have potential to shape management practices and establish UOG protocols that protect aquatic environment.

iii
ACKNOWLEDGEMENTS
I would like to begin by thanking my family for their never-ending support. My wife
Chantelle Ankeny, for her motivation every day. She encouraged me to always work my hardest
and she always showed interest in my project. I owe her immensely as she set aside her
education to support me at graduate school. To our son, Griffin Ankeny, though he does not
know it yet, I am motivated everyday by the thought of giving him a great life and providing for
my family. My mother, Johnette Mathieson, for her belief in me. As a child, my mother instilled in
me the urge to explore the outdoors and see the beauty that this world has to offer. She
continuously encourages me to reach new heights. My father, Robert Kim Ankeny, for his
encouragement. My father guided me through the Boy Scouts of America where he instilled in
me countless life lessons as well as a passion for exploring the outdoors.
Additionally, I would like to thank my fellow graduate students, especially Rebecca Long,
Kevin Eliason and Brian Gordon. Kevin Eliason was always there when I needed him, be it
running statistical analyses, working long hours in the field or just venting about the stress of
graduate school. The memories that I have made with my fellow graduate students will be
cherished. Thank you to Brock Huntsman for statistical support during his time at WVU. I would
also like to thank Donna Hartman and Yvette Halley for their logistical support as well as their
parenting advice.
Finally, I would like to thank the members of my graduate committee: Dr. J. Todd Petty,
Dr. Quinton Phelps and Dr. Eric Merriam. I cannot thank them enough for the countless hours
they spent teaching me, reviewing my work and guiding me to the finish line that is graduation. I
thank Dr. Quinton Phelps for his continuous encouragement through my graduate studies. I
strive to emulate the passion and excitement that he shows for the field of fisheries. I thank Eric
Merriam for his guidance through the early portion of my graduate studies as well as his

iv
continued support even after leaving WVU. Lastly, I thank Dr. J Todd Petty. It was an honor to
study under someone of such intellectual prowess. As I progress in the field of fisheries, I will
remember the lessons I learned from these mentors.
Funding for this project was provided by the National Science Foundation’s Appalachian
Freshwater Initiative.

v
TABLE OF CONTENTS
ABSTRACT ................................................................................................................................. ii
ACKNOWLEDGEMENTS .......................................................................................................... iii
TABLE OF CONTENTS .............................................................................................................. v
LIST OF TABLES ...................................................................................................................... vii
LIST OF FIGURES ..................................................................................................................... x
CHAPTER 1: LITERATURE REVIEW OF THE ENVIRONMENTAL IMPACTS OF UOG ........... 1
INTRODUCTION .................................................................................................................... 1
Pathways of Impact: ............................................................................................................ 1
Consequential Effects on Communities: .............................................................................. 5
Fish Communities as a Proxy for Stream Condition: ........................................................... 6
Hematocrit as a Proxy for Fish Health: ................................................................................ 7
OBJECTIVES ......................................................................................................................... 8
REFERENCES ....................................................................................................................... 9
CHAPTER 2: ANALYSIS OF UNCONVENTIONAL OIL AND GAS IMPACTS ON
DOWNSTREAM FISH COMMUNITIES USING A BEFORE AFTER CONTROL IMPACT STUDY
DESIGN ....................................................................................................................................13
ABSTRACT ...........................................................................................................................13
INTRODUCTION ...................................................................................................................14
METHODS ............................................................................................................................16
Study Area: ........................................................................................................................16
Site Selection: ....................................................................................................................16
Fish Community: ................................................................................................................17
Physical and Chemical Parameters: ...................................................................................18
Statistical Analysis: ............................................................................................................18
RESULTS ..............................................................................................................................21
Habitat and Water Quality: .................................................................................................21
Community Metrics: ...........................................................................................................21
Size Metrics: ......................................................................................................................22
DISCUSSION ........................................................................................................................22
Fish Assemblages: .............................................................................................................22

vi
Size Metrics: ......................................................................................................................25
Management Potential: ......................................................................................................26
Conclusion: ........................................................................................................................27
ACKNOWLEDGEMENTS ......................................................................................................27
FIGURES AND TABLES .......................................................................................................28
REFERENCES ......................................................................................................................45
CHAPTER 3: HEMATOCRIT AS A PREDICTOR OF SEMOTILUS ATROMACULATUS
STRESS DERIVED FROM UNCONVENTIONAL OIL AND GAS DISTURBANCE ....................51
ABSTRACT ...........................................................................................................................51
INTRODUCTION ...................................................................................................................52
METHODS ............................................................................................................................53
Site Selection: ....................................................................................................................53
Fish and Blood Sampling: ..................................................................................................54
Physical and Chemical Parameters: ...................................................................................54
Statistical Analysis: ............................................................................................................55
RESULTS ..............................................................................................................................56
Hematocrit: ........................................................................................................................56
Water Chemistry: ...............................................................................................................56
DISCUSSION ........................................................................................................................56
CONCLUSION ......................................................................................................................59
ACKNOWLEDGEMENTS ......................................................................................................59
FIGURES AND TABLES .......................................................................................................60
REFERENCES ......................................................................................................................65

vii
LIST OF TABLES
Chapter 2:
Table 1:
Fish metrics analyzed in this study along with their predicted response to UOG. Metrics
expected to decrease in abundance after UOG disturbance (-). Metrics expected to increase in
abundance after UOG disturbance (+). Metrics and expected results were selected from a larger
table found in Anderson, 2015.
Table 2:
Results from generalized linear mixed effects models comparing fish community metrics
between treatment conditions (i.e., reference and impacted) and sampling period (i.e., pre- and
post-.
Table 3:
Fulton’s condition factor for Semotilus atromaculatus in both treatment conditions.
Table 4:
The results of a linear mixed effect model for standard length (mm) and weight (g) of
Semotilus atromaculatus in both treatment conditions.
Table 5:
Comparison of watershed land uses between treatment types. An asterisk (*) denotes
statistically significant parameters.

viii
Table 6:
Comparison of water quality and habitat parameters between treatment types. An
asterisk (*) denotes statistically significant parameters. All metrics are mg/L except for those
specified. RVHA is a score ranging between 0 and 200.
Table 7:
All 50 species that occurred within samples were classified based on traits. Spawning
habits are rock-gravel spawners (RG), gravel-sand spawners (GS), non-guarding lithophils
(NGL), cavity spawners (CAV), Lithophilic spawners in sand or rock (LSR) and clean gravel
spawners (CGS). Trophic levels are invertivore-piscivore (IP), invertivore (IN), macro-omnivore
(MO), and omnivore-herbivore (OH). Tolerance levels are intolerant (I), moderately tolerant (M),
and tolerant (T). Other classifications included benthic species (B) and game species (G).

ix
Chapter 3:
Table 1:
Comparison of watershed land uses between treatment types. Unconventional Oil and
Gas was calculated as wells per upstream area. Other land uses were calculated as a percent
of total upstream area. An asterisk (*) denotes statistically significant parameters.
Table 2:
Comparison of water quality and habitat parameters between treatment types. An
asterisk (*) denotes statistically significant parameters. All metrics are mg/L except for those
specified. RVHA is a score ranging between 0 and 200.

x
LIST OF FIGURES
Chapter 2:
Figure 1:
A time series depicting the expansion of UOG across the state of West Virginia. Each
dot (●) represents a drilled UOG well. In 2007 there were 62 wells. In 2008 there were 314
wells. In 2011 there were 1189 wells. In 2017 there were 2382 wells. Map created in ArcGIS
version 10.3 (Environmental Systems Research Institute [ESRI] 2005).
Figure 2:
8 impacted sites (★) and 10 reference sites (●) were sampled within both the
Monongahela River drainage basin (light grey) and the Ohio River drainage basin (dark grey).
Dashed polygon represents the Marcellus shale formation. Map created in ArcGIS version 10.3
(ESRI, 2005).
Figure 3:
Boxplots of significant metrics. p-value derived from generalized linear mixed effect
models. White boxes represent reference conditions. Gray boxes represent impacted
conditions.
Figure 4:
Weight and length regression of Semotilus atromaculatus in both treatment conditions.
Reference samples and fit are represented by hollow circles (ο) and a dashed line respectively.
Impacted samples and fit are represented by solid circles (●) and a solid line respectively.
Figure 5:

xi
Boxplot of the log length and log weight of Semotilus atromaculatus in both treatment
conditions.

xii
Chapter 3:
Figure 1:
A cumulative frequency plot of hematocrit data. The dark gray bars represent the
frequency of hematocrit values for the impacted sites while the light gray bars represent the
control sites. The solid line represents to the percentage frequency for the impacted sites while
the dashed line represents the reference sites. p = significance factor, NR = number of reference
samples, NI = number of impacted samples
Figure 2:
The relationship between upstream UOG density (wells/km2) and average hematocrit
levels. The points represent individual sites. The dotted line represents the best fit line.
Figure 3:
11 impacted sites (★) and 8 reference sites (●) were sampled within both the
Monongahela River drainage basin (light grey) and the Ohio River drainage basin (dark grey).
Dashed polygon represents the Marcellus shale formation. Map created in ArcGIS version 10.3
(ESRI, 2005).
1
CHAPTER 1: LITERATURE REVIEW OF THE ENVIRONMENTAL IMPACTS OF UOG
INTRODUCTION
Shale gas production through means of unconventional oil and gas (UOG) is a rapidly
growing industry in the United States. Starting in the early 2000s, the oil and gas industry
employed some 225,000 employees or more, and spiked to nearly 450,000 employees in 2011
(Brown et al. 2013). Previously, natural gas trapped in these underground shale reserves was
both hard to reach and hard to extract. Now, with further technological advances and an
increasing drive to find the next new energy source, the potential benefit outweighs the
previously prohibitive costs of operation. It is projected that shale gas will account for 46% of all
natural gas production in the US, up from the 14% in 2009 (Rahm and Riha 2012).
A large contributor to this increase in oil and gas extraction is the ability to extract from
the Marcellus formation, which extends from southwestern New York through eastern Ohio, and
includes much of Pennsylvania and portions of West Virginia (King n.d.). As of 2011, the Energy
Information Administration calculated that the Marcellus formation would produce around 141
trillion cubic feet of natural gas. In 2015, the operating wells were averaging a total output of
14.4 billion cubic feet per day. This natural gas was an astonishing 36% of the total natural gas
used in the United States for that year (King n.d.). In the state of West Virginia alone, there has
been nearly a 40-fold increase in UOG wells since 2007.
Pathways of Impact:
With a rapid spike in a field that is so minimally explored, a major concern is how UOG
impacts downstream freshwater ecosystems. A previous study by Weltman-Fahs (2013)
described three primary pathways through which UOG can impact freshwater environments,
including; (1) increased sedimentation linked to deforestation and runoff from impermeable
2
surfaces including but not limited to well pads and roadways; (2) the leaching of chemicals into
both surface and ground waters through spills and leaks that occur during the fracturing
process; and (3) the rapid withdrawal or dispersal of water associated with the UOG causing a
hydrological change in the waterway (Weltman-Fahs and Taylor 2013a).
The first of pathway of impact is sedimentation. An increase in sedimentation directly
increases the nitrogen and phosphorus levels of the stream. With increased nitrogen and
phosphorus levels, eutrophication occurs more readily (Entrekin et al. 2011). Williams et al.
goes on to say that increased sedimentation can lead to decreased channel depths resulting in
habitat change, and furthermore, a decrease in the recreational use of the waterway (Williams
et al. 2008). This sedimentation caused by UOG can be a factor of two activities; deforestation
and the development of impermeable surfaces. Drilling for UOG requires the construction of a
well pad and, as with other construction jobs, deforestation is immanent. Essentially, through
the deforestation of an area you are removing what keeps the soil immobilized. With this
removed, any rain will easily wash the now mobilized sediment into the adjacent stream. A well-
established mountain stream derives a large proportion of its energy from the leaf litter of the
surrounding vegetation. If an area is deforested, this leaf litter no longer exists. Decreased
canopy cover allows for more sunlight to reach the surface water resulting in an increase in
temperature and an increased abundance of photosynthesizing plants and algae. With this
change the stream now has an autochthonous energy base, something more similar to streams
of larger width (Stone and Wallace 1998).
Access roads to the well pads are another UOG feature that are deleterious to
surrounding ecosystems. This increase in impermeable surfaces leads to yet another source of
sediment runoff, as well as a whole new problem; increased salinization of waterways. In a 2005
study, it was determined that the increase in roadways and the use of deicing methods are
leading to the salinization of freshwaters (Kaushal et al. 2005). In their study, they explain the
ecological implications of such a phenomenon. An increase the salinity levels of surface waters

3
can lead to a change in mortality and reproduction of aquatic organisms (Kaushal et al. 2005). A
change in seasons, correlating with a natural change in surface water levels, can lead to
fluctuation in the concentration of chloride in a stream. This fluctuation of chloride concentration
can amplify the effects of the salinity change on organisms unable to regulate their osmotic
potential of their cells within a short time frame (Kaushal et al. 2005). In a 2014 study, Kassotis
et al. explained that chloride is only one of over 750 chemicals used in the shale gas extraction
process. In this study, Kassotis primarily focused on endocrine disrupting chemicals. They found
that all of 39 unique samples contained some form of endocrine disrupting chemicals (Kassotis
et al. 2014). These chemicals have tremendous effects on the reproductive organs of the
animals inhabiting the impacted stream. Another study, performed in 2017, explained how the
presence of flowback and produced water in streams has a negative effect on rainbow trout gill
morphology via oxidative stress (Blewett et al. 2017).
These untreated fracturing fluids are finding their way into surface waters through
multiple means. Accidental spills during the drilling process is the main pathway. Canada
reported that 2,500 spills occurred over a seven year span. 113 of these spills were known to
have entered freshwater bodies of water (Blewett et al. 2017). Another source of surface water
contamination is the improper treatment of flowback. Flowback is the fluid slurry that “flows
back” up the well after the initial fracturing process. This cocktail consisting of brine, heavy
metals and nucleotides is then hauled to the treatment facilities where the intention is to treat it
and disperse it into surface waters. A common problem is that flowback is high in chloride which
proves hard to remove in treatment plants (Olmstead et al. 2013). Chloride is only one of the
many hard to remove chemicals found in flowback that leads to the inadequate treatment of
dispersed wastewater.
Defects in well casings is yet another pathway for these chemical rich liquids to
contaminate surface waters. After a well is drilled and before the fracking fluid is injected, a
cement well casing is constructed. This casing is supposed to stop any contamination of

4
groundwater and support the well’s infrastructure. Though the intentions are good, there are
recorded events of well casing failures that allow fracking fluid to leak into the surrounding
groundwater and eventually the surface waters (Entrekin et al. 2011).
The final of the three main impacts of UOG is the rapid withdrawal and dispersal of water
used in the UOG fracturing process. Water is the primary carrier of the chemicals deep into the
well. Many UOG sites operate on a multi-stage fracturing method resulting in an incredible need
for easily accessible fresh water. According to Entrekin, each UOG well uses between 2-7
million gallons of water (Entrekin et al. 2011) .To accumulate this much water, one of two things
must occur. The oil and gas company either dams a waterway, or directly extracts the water
from a nearby stream. Both scenarios negatively impact the stream. Both methods change the
natural hydrology of the river. The damming of a stream creates a sediment sink for particles
that would otherwise flow downstream. These pools can be lacking in aquatic life as the
substrate becomes uninhabitable and the flow decreases the amount of suspended food
available to fishes. On the other hand, removing massive amounts of water from an active
stream channel leads to inadequate dilution of chemicals, ultimately affecting the downstream
biota (Wildi 2010).
The lack of regulations on an UOG operation is becoming an increasingly apparent
problem. As far as water withdrawal and dispersal are concerned, there is a lack of mandatory
protocol. According to Rahm and Riha, there is no regulation on water withdrawal that takes into
consideration the size and discharge of the used stream. They go on to say that there is no
law stating where the used water must be returned to the stream from which it is extracted
(Rahm and Riha 2012). The lack of regulation allows those 2-7 million gallons of water to be
dispersed in a different location, leaving both the dispersal and extraction sites with altered
hydrological regimes. A stream not equipped to handle an increased discharge of this
magnitude could experience major geomorphological changes. These changes could result in a
less diverse and less stable biotic community structure.

5
Rahm and Riha studied these withdrawal and dispersal effects on streams of different
sizes and concluded with a simple strategy to mitigate harm to the waterways. They determined
that the smaller the stream, the more monitoring of water withdrawal and dispersal should be
used. Larger streams (> 1000 cfs) have the ability to lose and gain larger amounts of water
without an impact on habitat and flow. Whereas, smaller streams (< 100 cfs) are prone to worse
consequences (Rahm and Riha 2012).
Consequential Effects on Communities:
The three leading environmental impacts of UOG, sedimentation, chemical leaching, and
hydrological changes, all have a direct impact on the organisms living within the impacted
environment. Though not exactly the same, other land uses have been shown to have similar
deleterious effects. A stream’s ecosystem consists of a multitude of flora and fauna, most of
which are sensitive to the side effects of anthropogenic disturbances.
Deforestation of land surrounding a stream for the construction of well pad and roads
can lead to increased sedimentation within the stream. This sedimentation and reduced canopy
cover results in an energy source change from allochthonous to autochthonous (Stone and
Wallace 1998). With a new energy source and a change in the composition of the stream bed
habitat, the organismal populations of the stream changes. This leads to a decrease in fish and
invertebrate diversity between headwater streams and their downstream constituents (Stone
and Wallace 1998).
Impervious surfaces, such as those in residential developments, have been found to
have deleterious effects on stream habitat, water quality and biotic structure (Walters et al.
2001; Morse et al. 2003; Roy et al. 2003). Upon construction of impermeable surfaces, the
turbidity of adjacent surface waters systems increased. Studies have shown that increased
stream turbidity decreases the index of biological integrity (IBI) score for both
macroinvertebrates (Morse et al. 2003; Roy et al. 2003) and fish (Meyer et al. 1999; Walters et

6
al. 2001). Morse et al. (2004) explained that increased development leads to degraded water
chemistry through increased specific conductivity and TSS. Other studies have shown that
residential development leads to degraded habitat conditions (Merriam et al. 2011). We
anticipate that the impervious surfaces constructed during UOG operations will mimic the effects
of residential development.
Johnson et al. (2017) explained that biofilms are subject to species change relatable to
an anthropogenic change in land use (Johnson et al. 2017). Biofilms can contain a variance in
species relative to the water quality. This feature allows for the identification of increased salts,
increased acidity and even increased nitrates. Brittingham et al. proposed that this deforestation
has an impact on the amphibians in the area as well (Brittingham et al. 2014). They determined
that deforestation leads to habitat fragmentation and can change dispersal and breeding habits
of frogs.
Fish Communities as a Proxy for Stream Condition:
Before 1981, fish communities were rarely used as a metric to determine stream
condition. In 1981 this changed when James R. Karr wrote a methods paper outlining the use of
fish communities as a simplistic and inexpensive way of analyzing a stream (Karr 1981). Since
then, his method has been used on both a national (Barbour et al. 1999, USEPA 2006) and
local (McCormick et al. 2001) scale. Biotic indicators are superior to chemical or physical
monitoring as they give a better picture of what is happening over a span of time (Fausch et al.
1990). They explain that chemical or physical parameters are so complex that they rarely can
predict the biological integrity of the system. Karr goes on to explain that fish are a better
biological monitoring taxa than macroinvertebrates and diatoms due to their ease of sampling
(i.e., less sorting, less identification training), our wealth of background knowledge and the
ability to translate the results into a form easily understood by the general public.

7
Fish IBI analysis, involves analysis of community, population and the individual organism
(Karr 1981; Fausch et al. 1990). IBIs are specific to their geographic location and must be
created before analyzing a given area. Anderson (2015) used data collected from statewide
sampling events to create a West Virginia IBI (Anderson et al. 2015). Each individual species
found in the studies were classified based on their life history traits (i.e., spawning, distribution,
tolerance, trophic guild and family). Fish community samples from our study will look at the
difference of these metrics between UOG impacted and reference conditions. In the case of a
significant change in community structure, there is potential to advise environmental legislation
(Karr 1990).
Hematocrit as a Proxy for Fish Health:
Stress in an organism is can be caused by a variety events. Whatever the cause, the
stress event leads to the creation of corticosteroids and catecholamines. These hormones then
regulate secondary stress responses (i.e., compromised immune system, alteration of oxygen
consumption [Schreck and Tort 2016]). Sopinka et al. (2016) outlines various methods that are
used to measure these stress responses (Sopinka et al. 2016). They outline hematocrit as an
indicator of stress response that requires a simple test using inexpensive equipment.
Hematocrit is the volume percentage of red blood cells found in the blood (Sopinka et al.
2016). Typically, a baseline hematocrit value is obtained for a target species in a control setting.
After this baseline value is determined, the fish is subjected to a stressor and the change in
hematocrit is recorded. Depending on the stressor, the hematocrit can either increase or
decrease. In events that require the subject to consume more energy (i.e., avoiding predators),
the red blood cell count increases and subsequently the hematocrit value increases (Marshall et
al. 2012). In stress events that involve exposure to heavy metals, pesticides and disease it is
common to see a decrease in hematocrit as red blood cells are being destroyed and white blood

8
cell counts are increasing (Barnhorn 1996; Buthelezi et al. 2000; Nussey et al. 2006; Ghaffar et
al. 2018). We expect to see a decrease in the hematocrit levels of fish residing in UOG
impacted stream as they are potentially subject to decreased water quality including heavy
metal exposure.
OBJECTIVES
The goal of this research project is to determine the effects of UOG on fisheries within
West Virginia watersheds. Using both pre- and post- UOG development data, it is possible to
directly test for UOG development impacts on fishes. To meet this goal, I addressed the
following objectives:
1. Quantify the effect of UOG development on fish assemblage structure
2. Quantify the effect of UOG development on the physiological stress levels of
resident Semotilus atromaculatus (creek chub)
9
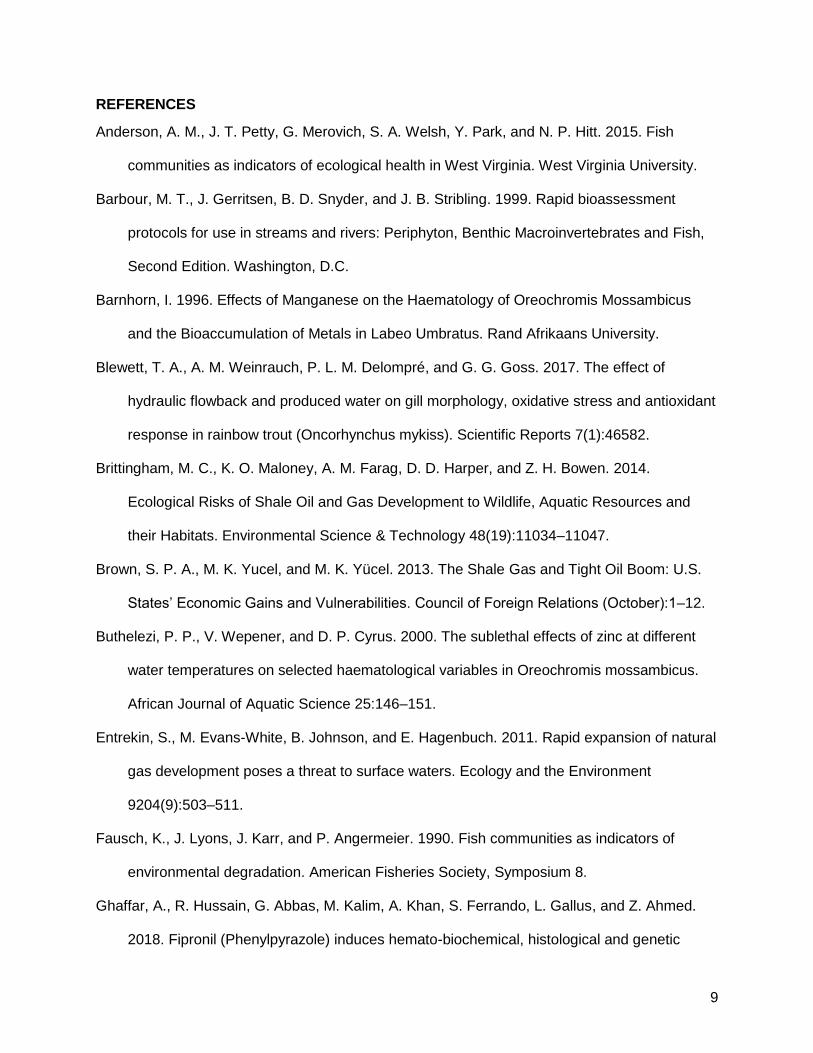
REFERENCES
Anderson, A. M., J. T. Petty, G. Merovich, S. A. Welsh, Y. Park, and N. P. Hitt. 2015. Fish
communities as indicators of ecological health in West Virginia. West Virginia University.
Barbour, M. T., J. Gerritsen, B. D. Snyder, and J. B. Stribling. 1999. Rapid bioassessment
protocols for use in streams and rivers: Periphyton, Benthic Macroinvertebrates and Fish,
Second Edition. Washington, D.C.
Barnhorn, I. 1996. Effects of Manganese on the Haematology of Oreochromis Mossambicus
and the Bioaccumulation of Metals in Labeo Umbratus. Rand Afrikaans University.
Blewett, T. A., A. M. Weinrauch, P. L. M. Delompré, and G. G. Goss. 2017. The effect of
hydraulic flowback and produced water on gill morphology, oxidative stress and antioxidant
response in rainbow trout (Oncorhynchus mykiss). Scientific Reports 7(1):46582.
Brittingham, M. C., K. O. Maloney, A. M. Farag, D. D. Harper, and Z. H. Bowen. 2014.
Ecological Risks of Shale Oil and Gas Development to Wildlife, Aquatic Resources and
their Habitats. Environmental Science & Technology 48(19):11034–11047.
Brown, S. P. A., M. K. Yucel, and M. K. Yücel. 2013. The Shale Gas and Tight Oil Boom: U.S.
States’ Economic Gains and Vulnerabilities. Council of Foreign Relations (October):1–12.
Buthelezi, P. P., V. Wepener, and D. P. Cyrus. 2000. The sublethal effects of zinc at different
water temperatures on selected haematological variables in Oreochromis mossambicus.
African Journal of Aquatic Science 25:146–151.
Entrekin, S., M. Evans-White, B. Johnson, and E. Hagenbuch. 2011. Rapid expansion of natural
gas development poses a threat to surface waters. Ecology and the Environment
9204(9):503–511.
Fausch, K., J. Lyons, J. Karr, and P. Angermeier. 1990. Fish communities as indicators of
environmental degradation. American Fisheries Society, Symposium 8.
Ghaffar, A., R. Hussain, G. Abbas, M. Kalim, A. Khan, S. Ferrando, L. Gallus, and Z. Ahmed.
2018. Fipronil (Phenylpyrazole) induces hemato-biochemical, histological and genetic

10
damage at low doses in common carp, Cyprinus carpio (Linnaeus, 1758). Ecotoxicology
27(9):1261–1271.
Johnson, W. H., M. R. Douglas, J. A. Lewis, T. N. Stuecker, F. G. Carbonero, B. J. Austin, M. A.
Evans-White, S. A. Entrekin, and M. E. Douglas. 2017. Do biofilm communities respond to
the chemical signatures of fracking? A test involving streams in North-central Arkansas.
BMC microbiology 17(1):29. BioMed Central.
Karr, J. R. 1981. Assessment of Biotic Integrity Using Fish Communities. Fisheries 6(6):21–27.
Karr, J. R. 1990. Biological Integrity and the Goal of Environmental Legislation : Lessons for
Conservation Biology. Conservation Biology 4(3):244–250.
Kassotis, C. D., D. E. Tillitt, J. W. Davis, A. M. Hormann, and S. C. Nagel. 2014. Estrogen and
Androgen Receptor Activities of Hydraulic Fracturing Chemicals and Surface and Ground
Water in a Drilling-Dense Region. Endocrinology 155(3):897–907.
Kaushal, S. S., P. M. Groffman, G. E. Likens, K. T. Belt, W. P. Stack, V. R. Kelly, L. E. Band,
and G. T. Fisher. 2005. Increased salinization of fresh water in the northeastern United
States. Proceedings of the National Academy of Sciences 102(38):13517–13520. National
Academy of Sciences.
King, H. M. (n.d.). Marcellus Shale - Appalachian Basin Natural Gas Play.
https://geology.com/articles/marcellus-shale.shtml.
Marshall, H., L. Field, A. Afiadata, C. Sepulveda, G. Skomal, and D. Bernal. 2012.
Hematological indicators of stress in longline-captured sharks. Comparative Biochemistry
and Physiology Part A: Molecular & Integrative Physiology 162(2):121–129. Pergamon.
McCormick, F. H., R. M. Hughes, P. R. Kaufmann, D. V. Peck, J. L. Stoddard, and A. T. Herlihy.
2001. Development of an Index of Biotic Integrity for the Mid-Atlantic Highlands Region.
Transactions of the American Fisheries Society 130(5):857–877.
Merriam, E. R., J. T. Petty, G. T. Merovich, J. B. Fulton, and M. P. Strager. 2011. Additive
effects of mining and residential development on stream conditions in a central

11
Appalachian watershed. Journal of the North American Benthological Society 30(2):399–
418.
Meyer, J., A. Sutherland, K. Barnes, D. Walters, and B. Freeman. 1999. A scientific basis for
erosion and sedimentation standards in the Blue Ridge physiographic province. Pages
321–324Georgia Water Resources Conference.
Morse, C. C., A. D. Huryn, and C. Cronan. 2003. Impervious surface area as a predictor of the
effects of urbanization on stream insect communities in Maine, U.S.A. Environmental
Monitoring and Assessment 89(95–127):33.
Nussey, G., J. H. J. Van Vuren, and H. H. du Preez. 2006. Effect of copper on the haematology
and osmoregulation of the Mozambique tilapia , Oreochromis mossambicus ( Cichlidae ).
Comp. Biochem. Physiol. 111c(3):369–380.
Olmstead, S. M., L. A. Muehlenbachs, J.-S. Shih, Z. Chu, and A. J. Krupnick. 2013. Shale gas
development impacts on surface water quality in Pennsylvania. Proceedings of the
National Academy of Sciences of the United States of America 110(13):4962–7. National
Academy of Sciences.
Rahm, B. G., and S. J. Riha. 2012. Toward strategic management of shale gas development:
Regional, collective impacts on water resources. Environmental Science & Policy 17:12–
23.
Roy, A. H., A. D. Rosemond, M. J. Paul, D. S. Leigh, and J. B. Wallace. 2003. Stream
macroinvertebrate response to catchment urbanisation (Georgia, U.S.A.). Freshwater
Biology 48(2):329–346. John Wiley & Sons, Ltd (10.1111).
Schreck, C. B., and L. Tort. 2016. The Concept of Stress in Fish. Pages 1–34Fish
PhysiologyFirst Edit. Elsevier Inc.
Sopinka, N. M., M. R. Donaldson, C. M. O’Connor, C. D. Suski, and S. J. Cooke. 2016. Stress
Indicators in Fish. Pages 405–462Fish Physiology.
Stone, M. K., and J. B. Wallace. 1998. Long-term recovery of a mountain stream from clear- cut

12
logging: the effects of forest succession on benthic invertebrate community structure.
Freshwater Biology 39:151–169.
Walters, D. M., M. C. Freeman, D. S. Leigh, B. J. Freeman, M. J. Paul, and C. M. Pringle. 2001.
Bed texture and turbidity as indicators of fish biotic integrity in the Etowah River system.
Pages 233–236Georgia Water Resources Conference.
Weltman-Fahs, M., and J. M. Taylor. 2013. Hydraulic Fracturing and Brook Trout Habitat in the
Marcellus Shale Region: Potential Impacts and Research Needs. Fisheries 38(1):4–15.
Wildi, W. 2010. Environmental hazards of dams and reservoirs. Curriculum in Natural
Environmental Science 88:187–197.
Williams, H. F. L., D. L. Havens, K. E. Banks, and D. J. Wachal. 2008. Field-based monitoring of
sediment runoff from natural gas well sites in Denton County, Texas, USA. Environmental
Geology 55(7):1463–1471.

13
CHAPTER 2: ANALYSIS OF UNCONVENTIONAL OIL AND GAS IMPACTS ON
DOWNSTREAM FISH COMMUNITIES USING A BEFORE AFTER CONTROL IMPACT
STUDY DESIGN
Joshua N. Ankeny, J. Todd Petty, Eric R. Merriam, Quinton E. Phelps
ABSTRACT
Since 2008, Unconventional Oil and Gas (UOG) production has been expanding
throughout West Virginia’s portion of the Marcellus shale formation. An increase in UOG is
expected to negatively impact headwater aquatic systems through increased sedimentation,
degraded water chemistry, altered hydrologic regimes and an overall decrease in habitat quality.
In this study, we utilized a before-after-control-impact study design in tandem with fish
community metrics to quantify the effects of UOG on fish community metrics in 8 UOG impacted
sites and 10 reference streams. A generalized linear mixed effect model revealed three metrics
that had a significant interaction between treatment type (i.e., reference and UOG impacted)
and sampling period (i.e., pre- or post-). Invertivores and Piscivores metrics were found to
decrease following UOG events, whereas benthic metrics increased. Our findings suggest that
community level analyses are not accurately assessing stream condition as fish communities
are experiencing statewide degradation. An ANCOVA alongside a linear mixed effect model
failed to find a significant difference between the weight and length of Semotilus atromaculatus
residing in both treatment conditions. Our findings indicate that in systems chronically impaired
by anthropogenic stressors, community analyses may not be capable of detecting a degraded
ecosystems.

14
INTRODUCTION
The deleterious effects of anthropogenic land uses on both biotic and abiotic aquatic
factors have been extensively studied. Researchers have explored the effects of mining (Freund
and Petty 2007; Merriam et al. 2011; Merovich et al. 2013), agriculture (Cuffney et al. 2000;
King et al. 2005), development (Morse et al. 2003; Merriam et al. 2011) and various
combinations of land uses (Merovich and Petty 2007; Merriam et al. 2015). However extensive
the research, there is a lurking concern for the potential impacts of new understudied land uses.
This research focuses on the rapid expansion of Unconventional Oil and Gas (UOG) exploration
in the Marcellus shale formation. The Marcellus shale play, spanning across much of the
Appalachian Basin, has seen a rapid uptick in UOG activity following new technological
advances in 2008 (Rahm and Riha 2012; Brown et al. 2013). In 2007 there were 62 drilled UOG
wells throughout the state of West Virginia. As of 2017, this number has increased to 2382.
Unconventional Oil and Gas is aptly referred to as horizontal drilling or hydraulic
fracturing. The hydrocarbons targeted with this approach lie deep within horizontal shale
formations that are relatively thin but very wide. To extract hydrocarbons from these formations,
wells are drilled between 1500 and 3000 meters deep. Once the shale formation is breached,
the drill is turned parallel to the earth’s surface and a hole is drilled horizontally through the
shale. A slurry of fracking fluid consisting of water, chemicals, biocides and proppants are
forced in the well under extreme pressure. This process fractures the shale formation and props
it open as to stimulate the release of hydrocarbons (EPA, 2018).
Unconventional Oil and Gas, like other anthropogenic stressors (i.e., mining, agriculture,
development), has deleterious effects on the surrounding watershed (Morse et al. 2003;
Merriam et al. 2011). Deforestation for the purpose of well pad construction, road construction
and pipeline corridor clearing lead to sedimentation of surrounding surface waters and habitat
fragmentation (Stone and Wallace 1998; Weltman-Fahs and Taylor 2013b; Brittingham et al.
2014). The cracking of well casings, the spilling of brine solutions and the improper treatment of

15
fracturing fluids have all lead to recorded contamination events in surface water systems
(Brittingham et al. 2014; Shrestha et al. 2017). In the Marcellus shale formation, each UOG well
requires 7.5 - 26.5 million liters of water during the fracturing process (Entrekin et al. 2011).
Extracting this much water from headwater systems can be detrimental to the hydrologic regime
(Rahm and Riha 2012).
In the early 1980s, two innovative stream assessment protocols were created: The Index
of Biological Integrity (IBI) and the Index of Well Being (IWB) (Gammon 1980; Karr 1981).
These protocols analyzed fish community metrics to determine the health of aquatic
ecosystems, a method rarely used before their time (Gammon 1980; Karr 1981). Since their
creation, the IBI and IWB have been extensively studied and used at both the national (Barbour
et al. 1999) and local (McCormick et al. 2001) scales. Gagic et al. (Gagic et al. 2015)
determined that trait-based community analyses provide better understanding of ecosystem
functionality than taxonomic-based analyses. Gagic’s approach was used to construct the West
Virginia IBI which included metrics based on spawning characteristics, trophic levels, taxonomic
families and tolerance levels (Anderson et al. 2015). Alterations in fish metrics are commonly
used to indicate changes in habitat quality, while consistent results can indicate a stable
environment. Many past studies have used fish community analyses to determine the effects of
an anthropogenic land use (Meyer et al. 1999; Walters et al. 2001). In addition to community
level analyses, physiological parameters (i.e., weight and length regression, condition factor) of
individual species are also commonly used to determine fish health as it relates to the
surrounding environment (Peters 1983; Reiss 1989; Riedel et al. 2009). Decreased weight
length regressions and condition factors imply a degree of malnourishment and degraded
individual health (Williams 2000).
In this study, we sampled 18 fish communities spread across the Monongahela River
basin and the Ohio River basin of northwestern West Virginia (Figure 2). To our knowledge, this
is the first study that utilizes a before-after-control-impact study design alongside fish community

16
metrics to assess watersheds impacted by UOG disturbance. Our research objectives include:
(1) quantify changes in fish community metrics as a response to UOG development within the
watershed; (2) analyze variations in weight (g) and length (mm, standard length) of Semotilus
atromaculatus (creek chub) within both treatment conditions.
METHODS
Study Area:
The Marcellus shale formation lies underneath six US states: West Virginia (21.33%),
Pennsylvania (35.35%), New York (20.06%), Ohio (18.19%), Virginia (3.85%), Maryland
(1.09%). Of the 245,771km2 that the Marcellus shale covers, only 27,510km2 are leased by oil
and gas companies for UOG extraction (U.S. Energy Information Administration, 2011). Both
the Monongahela River Basin and the Ohio River basin, analyzed in this study, fall completely
within the range of the Marcellus shale play (Figure 2). The Monongahela River basin covers
6800km2 of north central West Virginia and is predominately forested (75%) land. Agriculture
(14%) development (5%) and mining (4%) are the primary land use stressors in the
Monongahela River basin. The Ohio river basin covers 9600km2 of northwestern West Virginia
and is predominantly forested (82%) land. Agriculture (10%) is the primary land use stressor in
the Ohio River basin.
Site Selection:
Data provided by the West Virginia Department of Environmental Protection (WVDEP)
and West Virginia Division of Natural Resources (WVDNR) was used to select sampling events
that predated UOG activity. Eighteen sites throughout both the Ohio River basin and the
Monongahela River basin were selected for resampling based on presence or absence of UOG,
watershed land use attributes, sampling methods, and sampling date. Pre-UOG sites were
mapped and joined to a National Land Cover Database (U.S. Geological Survey, 2014) land use

17
file. Sites were removed from selection if they contained any upstream mining disturbance,
upstream agriculture disturbance greater than 20%, upstream development disturbance greater
than 2.5% or did not use backpack electrofishing as the sampling method. Detailed polygons of
UOG well pads were overlaid on the land use map. From the sites that did not contain UOG
disturbance within their watersheds, ten sites of least disturbance (Stoddard et al. 2006),
henceforth referred to as reference, were selected. Eight impacted sites were selected based on
the presence of UOG disturbance within their watersheds and a sampling date prior to the spud
date of all upstream wells. All mapping was performed in version 10.3 ArcGIS software
(Environmental Systems Research Institute [ESRI] 2005).
Fish Community:
All collection methods followed the single pass backpack electrofishing protocol outlined
in the WVDEP Fish Collection Protocol (WVDEP, 2011). Samples were collected between June
and October in 2017 and 2018. Sampling events corresponded with stable flow conditions as to
reduced turbidity and increase capture efficiency (Hense et al. 2010). Stream reaches were
initiated at the coordinates provided from the agencies who performed the pre-UOG sampling. If
reach lengths were not provided, it was calculated as 40 times the average wetted width for a
minimum of 160 meters and a maximum of 300 meters, as to follow WVDEP standard operating
procedures. Table 10 of the WVDEP Fish Collection Protocol (WVDEP, 2011) was used to
determine the number of electrofishing units and netters to use based on stream width and
depth. Smith-Root Model 24LR backpack electrofishing units (Vancouver, Washington) were
used alongside ¼” mesh nets (Freund and Petty 2007). As sampling progressed through the
reach, debilitated fish were netted and placed in live wells. Upon completion of the reach, fishes
were identified to the species level, weighed (nearest 0.01g) and measured (nearest mm,
standard length). Fish that were not able to be identified in the field were immediately

18
euthanized in 95% ethanol and identified in the lab. Fish identified in the lab were not weighed
as preservation in 95% ethanol significantly reduces fish weight (Shields and Carlson 1997).
Physical and Chemical Parameters:
To assess habitat quality, we performed U.S. Environmental Protection Agency (EPA)
rapid visual habitat assessments (RVHA) at each site (Barbour et al. 1999). Using RVHA,
various physiological parameters were assessed to give the site a score (maximum possible
RVHA = 200).
In situ water parameters in tandem with lab analyses were used to assess water quality.
A YSI 650 equipped with a 600XL sonde was used to measure dissolved O2 (mg/L), pH,
temperature (C), and specific conductivity (μS/cm) (Yellow Springs Instruments, Yellow Springs,
OH, USA). A single filtered sample was obtained using a Nalgene ® filtration device with a 0.45
μm mixed cellulose-ester membrane filter. This sample was used to measure Al, Ca, Fe, Mg,
Mn, K, Na, Sr, Zn (EPA method 200.7) as well as Ba, Cd, Cr, Ni and Se. (EPA method 200.8).
Three unfiltered samples were obtained and used to measure Br-, Cl-, SO42- (EPA method
300.0), NO2-, NO3
- (EPA method SM4110B-2000), total P (EPA method SM4500-P BE-1999),
total dissolved solids (EPA method SM2540 C-1997), total and bicarbonate alkalinity (EPA
method SM2320 B-1997). The samples were stored at 4℃ until they were analyzed at Research
Environmental and Industrial Consultants Inc. (Beaver, WV, USA).
Statistical Analysis:
Fish community response to UOG development:
The first objective set forward in this study was to assess changes in fish community
metrics as a response to UOG development within the watershed. Initially, raw counts as well as
relative abundances were calculated for multiple functional groups derived from Anderson’s
dissertation (Anderson et al. 2015). Of the 65 metrics outlined in Anderson’s doctoral
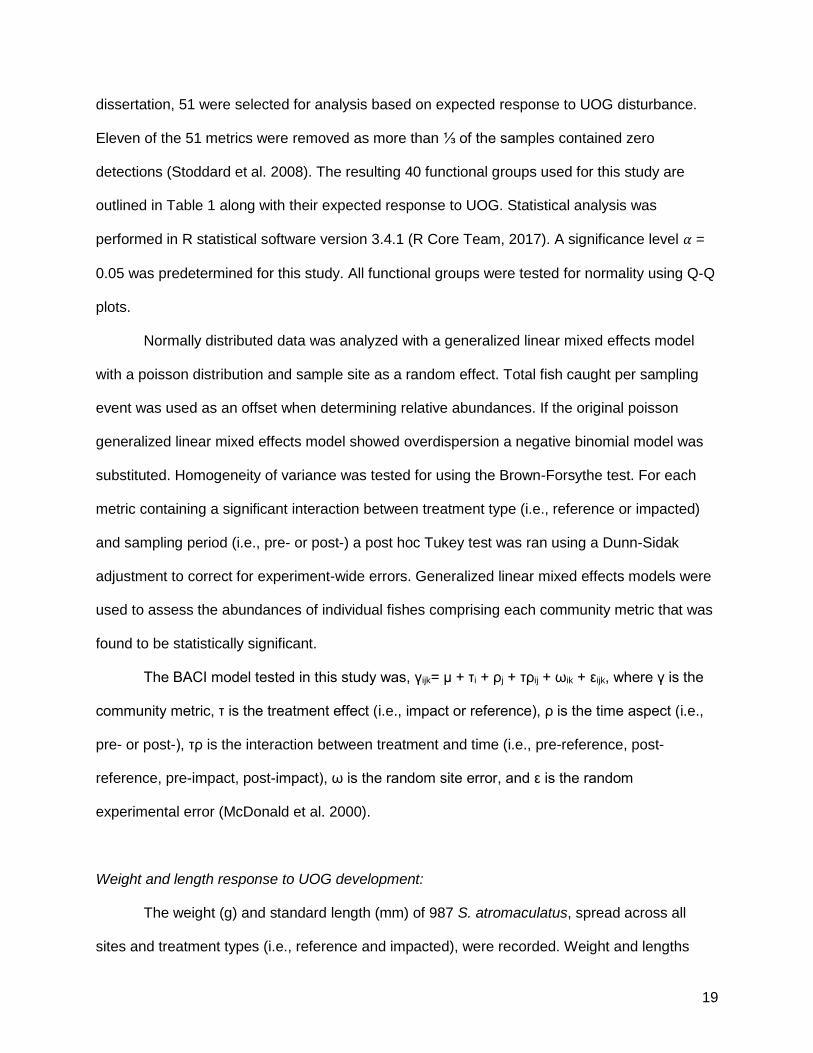
19
dissertation, 51 were selected for analysis based on expected response to UOG disturbance.
Eleven of the 51 metrics were removed as more than ⅓ of the samples contained zero
detections (Stoddard et al. 2008). The resulting 40 functional groups used for this study are
outlined in Table 1 along with their expected response to UOG. Statistical analysis was
performed in R statistical software version 3.4.1 (R Core Team, 2017). A significance level 𝛼 =
0.05 was predetermined for this study. All functional groups were tested for normality using Q-Q
plots.
Normally distributed data was analyzed with a generalized linear mixed effects model
with a poisson distribution and sample site as a random effect. Total fish caught per sampling
event was used as an offset when determining relative abundances. If the original poisson
generalized linear mixed effects model showed overdispersion a negative binomial model was
substituted. Homogeneity of variance was tested for using the Brown-Forsythe test. For each
metric containing a significant interaction between treatment type (i.e., reference or impacted)
and sampling period (i.e., pre- or post-) a post hoc Tukey test was ran using a Dunn-Sidak
adjustment to correct for experiment-wide errors. Generalized linear mixed effects models were
used to assess the abundances of individual fishes comprising each community metric that was
found to be statistically significant.
The BACI model tested in this study was, γijk= μ + τi + ρj + τρij + ωik + εijk, where γ is the
community metric, τ is the treatment effect (i.e., impact or reference), ρ is the time aspect (i.e.,
pre- or post-), τρ is the interaction between treatment and time (i.e., pre-reference, post-
reference, pre-impact, post-impact), ω is the random site error, and ε is the random
experimental error (McDonald et al. 2000).
Weight and length response to UOG development:
The weight (g) and standard length (mm) of 987 S. atromaculatus, spread across all
sites and treatment types (i.e., reference and impacted), were recorded. Weight and lengths

20
were log transformed and an ANCOVA was used to compare the slopes of the weight-length
regression between treatment types (Figure 3). A linear mixed effect model, with site as a
random effect, was used to compare both the log weight and log length, independently of one
another, between treatment types (Table 4; Figure 4).
Allometry within treatment groups was tested for using the following equation:
W = 𝛼L𝛽 (Peters 1983; Reiss 1989; Riedel et al. 2009)
In this equation, W is the log weight (g) of each specimen, L is the log length (mm) of each
specimen, 𝛼 is the intercept and 𝛽 is the allometric parameter (Riedel et al. 2009; Ogle 2013).
Fulton’s condition factor was calculated for each individual specimen using the following
equation:
KTL = [(100,000)(W)] / L3 (Ricker 1975)
In this equation, K is the coefficient of condition, W is the weight (g) and L is the length (mm). A
two-sample t-test was used to compare the means of the condition factors of each treatment
type (Table 3).
Water quality and habitat quality response to UOG development:
Water quality measurements were not available for the pre-Impacted and pre-Reference
samples. Therefore, each water quality parameter as well as RVHA was compared between
post- treatment conditions (i.e., post-Impacted and post-Reference) using two-sample t-tests
(Table 6).

21
RESULTS
Habitat and Water Quality:
Though insignificant (p = 0.377), mean rapid visual habitat assessment scores appeared
to decrease in the presence of UOG. Two sample t-tests revealed six water quality parameters
that were significantly different with regard to treatment type: Calcium (p = 0.003), Magnesium
(p = 0.020), Strontium (p = 0.009), Conductivity (p = 0.003), TDS (p = 0.024) and Alkalinity (p =
0.018). Remaining water quality parameters were not found to be significantly different between
treatment conditions (p > 0.05 for all parameters [Table 6]).
Community Metrics:
Of the 40 community metrics analyzed, three had a significant interaction between
treatment (i.e., reference and impacted) and sampling period (i.e., pre- and post- [Table 2]). The
invertivore and piscivore metric (IP) was significantly different when looking at raw count data,
while the benthic (Benthic) and benthic minus white sucker (Benthic_CACO) were significantly
different when comparing relative abundances of the metrics. The mean abundance of IP
species decreased from 324.9±79.5 in pre-UOG impacted sites to 200.4±139.6 in post-UOG
impacted sites. The mean relative abundance of species within the Benthic metric increased in
relative abundance from 0.551±0.175 in pre-UOG impacted sites to 0.678±0.164 in post-UOG
impacted sites. The mean relative abundance of species within the Benthic_CACO metric
increased in relative abundance from 0.537±0.172 in pre-UOG impacted sites to 0.662±0.167 in
post-UOG impacted sites (Table 2).
Redside dace (p < 0.001), rainbow darters (p = 0.026), johnny darters (p < 0.001),
longear sunfish (p < 0.001), golden redhorse (p < 0.001) and mimic shiner (p < 0.001) are all
intolerant or moderately tolerant species within the invertivore or piscivore trophic levels. These
fish species decreased in abundance following UOG disturbances. Central stoneroller (p <
0.001), mottled sculpin (p = 0.020), northern hogsucker (p = 0.007), logperch (p < 0.001) and

22
eastern blacknose dace (p < 0.001) are all moderately tolerant or tolerant benthic species.
These species were found to increase following UOG disturbance.
Size Metrics:
The ANCOVA for the weight-length regressions did not reveal any significant difference
between treatment types (p = 0.536). Figure 3 the log transformed data weight and length data.
The slopes are nearly indiscernible from one another implying that both populations are
increasing in weight and length at a similar ratio. A linear mixed effect model comparing the
length and weight independently failed to find a significant difference between treatment types
(p > 0.05 for both metrics [Table 4; Figure 4]).
Treatment type was not found to be a significant predictor of allometric growth. Fish
within both conditions were found to have negative allometric growth. Reference conditions had
a 𝛽 of 2.82 ± 0.037, while Impacted conditions had a 𝛽 of 2.84 ± 0.044. Additionally, Fulton’s
condition factor was not found to be significantly different between treatment types (p = 0.28,
Table 3).
DISCUSSION
Fish Assemblages:
Analysis of 18 fish communities revealed that three (Table 2) of our 40 metrics are
statistically different with regard to the interaction between treatment type (i.e., impacted and
reference) and sampling period (i.e., pre-UOG and post-UOG). The first of the three significant
metrics is unique in that it represents two trophic levels, invertivores and piscivores (IP). Our
study found that the IP metric is significantly lower in watersheds containing UOG (Table 2;
Figure 5). Previous studies (McCormick et al. 2001) suggest that the IP metric is negatively
correlated with increased turbidity, reduced canopy cover and degraded habitat quality, all of
which are common in sites containing UOG disturbances (Entrekin et al. 2011; Weltman-Fahs
and Taylor 2013a; Brittingham et al. 2014). Piscivores are typically visual predators and it has

23
been shown that increased turbidity reduces their foraging efficiency (Mazur and Beauchamp
2003). One explanation for this decrease is optimal foraging theory which explains that as
habitat quality decreases fishes move to a habitat patch that provides a better cost-benefit ratio
(Aspey and Lustick 1983). Invertivores have been found to decrease in systems with increased
sedimentation as macroinvertebrate composition shifts (Pirhalla 2004). A decrease in the
abundances of intolerant and moderately tolerant invertivore-piscivore species (i.e., redside
dace, rainbow darter, johnny darter, longear sunfish, golden redhorse, mimic shiner) is driving
the decrease in the IP metric (Table 8).
Additionally, our analyses determined that fishes comprising the Benthic and Benthic
minus white sucker (Benthic_CACO) metrics increased in relative abundance following UOG
development (Table 2; Figure 5). These findings disagree with other trait based indexes
(Barbour et al. 1999; McCormick et al. 2001; Anderson et al. 2015) which predict that
anthropogenic stressors associated with a decrease in benthic habitat (i.e., sedimentation or
substrate composition) negatively impact metrics consisting of benthic species as they require
clean substrate for habitat and spawning. Since increased stream sedimentation is one of the
leading impacts of UOG (Weltman-Fahs and Taylor 2013b; Brittingham et al. 2014) we initially
hypothesized a decline in these metrics. Our findings suggest that UOG sites are not
experiencing increased sedimentation load. Comparison of RVHAs did not reveal significant
degradation in habitat quality of UOG impacted sites (Table 6), implying that the evaluated
parameters (i.e., embeddedness, substrate characterization, sediment deposition, etc) are
uniform (Barbour et al. 1999) throughout treatment conditions. An increase in the abundances of
tolerant and moderately tolerant benthic species (i.e., central stoneroller, mottled scuplin,
northern hogsucker, logperch, eastern blacknose dace) is driving the increase in these benthic
metrics (Table 8). We failed to find a significant increase in the Benthic metrics when we
removed the tolerant species (Benthic2.DEP).

24
Our metrics were analyzed using both raw count data as well as relative abundance data
utilizing total fish as an offset. Though both pre- and post- sampling methods followed the
WVDEP Fish Collection Protocol (WVDEP 2018), we expected relative abundance data to have
stronger results as it reduces differences associated with different collection crews. Additionally,
it has been determined that both mean stream width and stream gradient are important factors
in single-pass electrofishing efficiency (Hense et al. 2010). As these factors do not change
within a site following UOG development, we can assume that they are not reducing detection
efficiency. The Benthic and Benthic_CACO metrics were found to be statistically different when
analyzing relative abundances while the IP metric was found to be statistically different only
when analyzing raw data.
Under ideal circumstance, both pre-impacted and pre-reference treatment conditions
should be similar in habitat characteristics as all sites are of similar size, similar geographic
location and have only UOG as the variable land use stressor. The remaining 37 metrics
revealed no significant change following UOG development despite our initial hypotheses. This
suggests that with a continual rise in anthropogenic disturbance throughout the state of West
Virginia there is potential to reduce even the pristine headwater streams to degraded habitats
through dispersal and mass effects (Leibold et al. 2004; Heino et al. 2015; Merriam and Petty
2016). A decreased habitat quality of neighboring systems has been shown to reduce the
functionality of isolated headwater streams within West Virginia (Merriam and Petty 2016).
Though our site selection methods controlled for upstream land uses, we disregarded
downstream impacts. The fourth principle of the riverscape-concept explains that “unintended
consequences of habitat degradation will occur in all directions, including upstream” (Fausch et
al. 2002). This statewide degradation could result in communities that are uniform between
treatment and reference conditions, rendering community level analyses useless.
It appears that reference and impacted sites are becoming more uniform which could
result in an overall decrease in fish richness and an eventual extirpation of less tolerant species.

25
Similar patterns have been recorded in macroinvertebrate communities within the mountaintop
removal-valley fill mining region of West Virginia (Merriam and Petty 2016). We believe we are
seeing a proliferation of tolerant taxa throughout the headwater streams of our study area
predating even our pre-UOG samples. Continued UOG disturbance, in conjunction with other
anthropogenic stressors, could result in overall degradation of West Virginia headwater streams
to lower biological integrity classes (Karr 1981, 1990).
Size Metrics:
S. atromaculatus are a widely distributed species with a range that extends across much
of eastern United States and southeastern Canada. Though S. atromaculatus are omnivorous
they mainly feed on macroinvertebrates and other fishes (Nico and Fuller 2019). Metric
construction for various IBIs has labeled S. atromaculatus as a tolerant species (McCormick et
al. 2001; Anderson et al. 2015). These characteristics lend S. atromaculatus to being a good
candidate for field studies as they are ubiquitous among West Virginia stream conditions. S.
atromaculatus chub were selected for size analysis as they were detected in all 18 of sites at an
average of 55 individuals per site (N = 987).
An ANCOVA of the length-weight slope revealed that S. atromaculatus are increasing in
size at similar ratios regardless of treatment condition (Figure 3). A linear mixed effects model
failed to reveal a significant difference between weight and length (Table 4). Additionally, there
is no difference in allometric growth or Fulton’s condition factor between treatment condition
(Table 3). Weight and length characteristics are highly variable between season (Moutopoulos
and Stergiou 2002). Our sampling period ranged from June to October. A different sampling
approach where weight and length measurements are taken within the same season may reveal
different results.

26
Management Potential:
West Virginia has a long history of anthropogenic disturbance through mining,
mountaintop removal, agriculture and development (Yarnell 1998). Moreover, legacy land uses
that occurred prior to our pre- data could be determining community composition within these
streams (Harding et al. 1998). These historic events make it nearly impossible to find a stream
that is truly of the reference condition. For our study, we instead selected streams of the least
disturbed condition (LDC [Stoddard et al. 2008]). Stoddard et al. (2008) labeled streams of least
disturbed condition as those in the landscape that still have anthropogenic disturbance but on a
lesser scale than the defined impacted sites. Both treatment conditions had agricultural
disturbance (< 20%) and developmental disturbance (< 2.5%). Mining disturbances were
controlled against as studies have shown that mining in West Virginia has deleterious effects on
biological condition that can be long-lasting (Petty et al. 2010; Merriam et al. 2011 [Table 5]).
Additionally, mining has been shown to affect surface waters to a greater extent in the presence
of additional land use stressors (Merriam et al. 2015). The only significantly different
anthropogenic land use stressor between treatment conditions was UOG (p < 0.001 [Table 5]).
Management agencies should consider both the individual impact of UOG as well as the
cumulative effects with other land use stressors.
Karr (1981; 1990) describes poor lotic habitats as those “dominated by omnivores,
pollution-tolerant forms, and habitat generalists; growth rates and condition factors commonly
depressed; hybrids and diseased fish often present.” As fish communities in these watersheds
become increasingly degraded and dominated by tolerant taxa we begin to question if
community level analysis is sufficient. If the cumulative effects of anthropogenic stressors result
in predominantly streams of poor condition, IBI cannot be used to make informed management
decisions. From our findings, we suggest that in chronically impaired systems the headwaters
streams are threatened by downstream anthropogenic stress (Fausch et al. 2002). Therefore, a

27
significant change in community metrics will prove hard to detect as the communities within
these ecosystems are at the lowest biotic integrity class.
Conclusion:
In summary, analysis of fish community metrics determined that IP abundance
decreased following UOG disturbance, indicating a reduction in optimal foraging conditions
(Aspey and Lustick 1983; Mazur and Beauchamp 2003). Contrary to expectations (Karr 1981;
McCormick et al. 2001; Anderson et al. 2015), we saw an increase in the relative abundance of
fishes within the Benthic and Benthic minus white sucker metrics. Fish assemblage results
suggest that community level analyses in watersheds with extensive anthropogenic stress, both
current and legacy, may not provide an adequate measurement of an aquatic ecosystem’s
health. We suggest that management agencies should conduct physiological studies as
opposed to community studies to determine changes in resident fish health associated with
landscape alterations (chapter 3 of this thesis).
ACKNOWLEDGEMENTS
We thank the NSF for their funding of this project. We would like to thank the West
Virginia Division of Natural Resources and West Virginia Department of Environmental
Protection for their assistance in the site selection process. Dr. Shawn Grushecky of the West
Virginia University Energy and Land Management Division provided detailed maps of UOG
wells within the study area. Jacquelyn Strager of the Natural Resource Analysis Center provided
the accumulated land use data that was used for site selection. We greatly appreciate the field
help provided by Rebecca Long, Brian Gordon, Jillian Clemente, Kurt Sigler, Timothy Robine,
Chantelle Ankeny, Jenny Sanders, Connor Cunningham, Conner Owens, Levi Canterbury and
Marty Traver. We would also like to thank Donna Hartman for her logistical support.

28
FIGURES AND TABLES
Figure 1:
A time series depicting the expansion of UOG across the state of West Virginia. Each
dot (●) represents a drilled UOG well. In 2007 there were 62 wells. In 2008 there were 314
wells. In 2011 there were 1189 wells. In 2017 there were 2382 wells. Map created in ArcGIS
version 10.3 (Environmental Systems Research Institute [ESRI] 2005).

29
Table 1:
All fish metrics analyzed in this study along with their predicted response to UOG.
Metrics expected to decrease in abundance after UOG disturbance (-). Metrics expected to
increase in abundance after UOG disturbance (+). Metrics and expected results were selected
from a larger table found in Anderson, 2015.
Metric Abbreviation Description Expected Response
Game Classified game fish from WV DNR ̶
RGS Rock-gravel spawners ̶
GSS Gravel and sand spawners ̶
NGL Non-guarding lithophilic spawners ̶
MO Macro-omnivore ̶
IN Invertivore ̶
IP Invertivore-Piscivore ̶
ISEAT Invertivore-Piscivore minus S. atromaculatus ̶
Benthic Benthic species ̶
Benthic_CACO Benthic species minus C. commersonii ̶
Cyprinid Cyprinidae family ̶
Cyprinid_BNDSEAT Cyprinidae family minus R. atratulus and S. atromaculatus ̶
BND_CACO_SEAT Blacknose dace, white sucker and S. atromaculatus +
OH Omnivore-Herbivore +
OH_CAAN Omnivore-Herbivore minus C. anomalum +
OH_CAAN_CACO Omnivore-Herbivore minus C. anomalum and C. commersonii +
OH_NG Non-game omnivore-herbivore +
IBenthicNG Benthic and non-game invertivore-piscivore ̶
INonGameNB Non-game and non-benthic invertivore-piscivore ̶
DMS Darters, madtoms and sculpins ̶
Percidae Percidae family ̶

30
Centrachidae Centrarchidae family ̶
Catostomidae Catostomidae family ̶
CGS_RGS Clean gravel and rock gravel spawners ̶
Cavity Spawn Cavity spawners ̶
Fish2.DEP Total Fish minus tolerant ̶
RGS2.DEP Rock-gravel spawners minus tolerant species ̶
NGL2.DEP Non-guarding lithophilic spawners minus tolerant species ̶
IP2.DEP Invertivore-piscivore minus tolerant species ̶
Benthic2.DEP Benthic minus tolerant species ̶
Cyprinid2.DEP Cyprinidae family minus tolerant species ̶
Game2.DEP Game fish minus tolerant species ̶
Tol.DEP Tolerant species +
Mod.DEP Moderately tolerant species ̶
Int.DEP Intolerant species ̶
Tol_Benthic.DEP Tolerant benthic species +
Tol_Cyprinid.DEP Tolerant species in the Cyprinidae family +
McC_CGS2.DEP Clean gravel spawners minus tolerant species ̶
CGS_RGS2.DEP Clean gravel and rock-gravel spawners minus tolerant species ̶
CavitySpawn2.DEP Cavity spawners minus tolerant species ̶

31
Figure 2:
8 impacted sites (★) and 10 reference sites (●) were sampled within both the
Monongahela River drainage basin (light grey) and the Ohio River drainage basin (dark grey).
Dashed polygon represents the Marcellus Shale formation. Map created in ArcGIS version 10.3
(ESRI, 2005).

32
Table 2:
The results from generalized linear mixed effects models comparing fish community
metrics between treatment conditions (i.e., reference and impacted) and sampling period (i.e.,
pre- and post- UOG).
Raw Counts
Metrics Treatment Period Mean SD SE Grouping p value
Invertivore -Piscivore
Reference Pre 248.2 166.5 52.66 AB
0.045 Post 300.9 110.1 34.81 AB
Impacted Pre 324.9 79.50 28.11 B
Post 200.4 139.6 49.37 A
Relative Abundances
Metrics Treatment Period Mean SD SE Grouping p value
Benthic Species Reference
Pre 0.698 0.137 0.043 AB
0.003 Post 0.677 0.146 0.046 AB
Impacted Pre 0.551 0.175 0.062 A Post 0.678 0.164 0.058 B
Benthic Species minus White
Suckers
Reference Pre 0.679 0.145 0.046 AB
0.011 Post 0.663 0.149 0.047 AB
Impacted Pre 0.537 0.172 0.061 A Post 0.662 0.167 0.059 B

33
Figure 3:
Boxplots of significant metrics. p-value derived from generalized linear mixed effect
models. White boxes represent reference conditions. Gray boxes represent impacted
conditions.

34
Figure 4:
Weight and length regression of Semotilus atromaculatus in both treatment conditions.
Reference samples and fit are represented by hollow circles (ο) and a dashed line respectively.
Impacted samples and fit are represented by solid circles (●) and a solid line respectively.

35
Table 3:
Fulton’s condition factor for Semotilus atromaculatus in both treatment conditions.
Mean SD SE p value
Reference 1.97 0.503 0.022 0.28
Impacted 2.01 0.398 0.019

36
Table 4:
The results of a linear mixed effect model for standard length (mm) and weight (g) of
Semotilus atromaculatus in both treatment conditions.
Treatment N Mean(±SD) p value
Log Length (mm) Reference 537 1.77±0.19
0.073 Impacted 450 1.71±0.18
Log Weight (g) Reference 537 0.595±0.54
0.080 Impacted 450 0.440±0.51

37
Figure 5:
Boxplot of the log length and log weight of Semotilus atromaculatus in both treatment
conditions.

38
Table 5:
Comparison of watershed land uses between treatment types. Unconventional Oil and
Gas was calculated as wells per upstream area. Other land uses were calculated as a percent
of total upstream area. An asterisk (*) denotes statistically significant parameters.
Watershed Land Uses Mean ± SD (%) P-Value
Reference Impacted Agriculture (%) 8.60 ± 5.90 7.42 ± 2.65 0.583 Development (%) 0.65 ± 0.79 0.63 ± 0.46 0.955 Forest Cover (%) 88.5 ± 7.04 90.1 ± 3.03 0.530 Open Water (%) 0.058 ± 0.057 0.037 ± 0.032 0.356 Roads (%) 1.80 ± 0.49 1.66 ± 0.74 0.650 Herbaceous Wetlands (%) 0.030 ± 0.060 0.032 ± 0.045 0.907 Woody Wetlands (%) 0 0.012 ± 0.035 0.351 UOG (Wells/km2) 0 1.07 ± 0.65 0.003*
Pre SMCRA Grass (%) 0.0032 ± 0.010 0 0.343 Pre SMCRA Barren (%) 0 0 NA Pre SMCRA Forest (%) 0.0010 ± 0.0033 0 0.343 Post SMCRA Grass (%) 0.075 ± 0.185 0 0.233 Post SMCRA Barren (%) 0.014 ± 0.042 0 0.322 Post SMCRA Forest (%) 0.172 ± 0.340 0.0010 ± 0.0019 0.147

39
Table 6:
Comparison of water quality and habitat parameters between treatment types. An
asterisk (*) denotes statistically significant parameters. All metrics are mg/L except for those
specified. RVHA is a score ranging between 0 and 200.
Parameters Mean ± SD P-Value
Reference Impacted Aluminum 0.021 ± 0.027 0.035 ± 0.045 0.450 Calcium 17.82 ± 7.27 29.36 ± 6.73 0.003* Iron 0.098 ± 0.086 0.124 ± 0.074 0.498 Magnesium 3.21 ± 1.67 5.02 ± 1.31 0.020* Manganese 0.026 ± 0.037 0.043 ± 0.061 0.488 Potassium 1.77 ± 0.88 2.05 ± 0.56 0.437 Sodium 6.55 ± 6.98 18.57 ± 22.1 0.176 Strontium 0.071 ± 0.05 0.141 ± 0.05 0.009* Zinc 0.0029 ± 0.005 0.0039 ± 0.005 0.681 Barium 0.056 ± 0.021 0.064 ± 0.017 0.344 Bromide 0.006 ± 0.19 0.041 ± 0.047 0.078 Chloride 4.63 ± 3.61 7.76 ± 4.13 0.113 Sulfate 17.81 ± 20.7 15.25 ± 8.26 0.727 Nitrate 0.382 ± 0.90 0.075±0.08 0.312 Phosphorous 7.85 ± 0.41 7.96 ± 0.45 0.717 pH 7.85 ± 0.41 7.99 ± 0.45 0.513 Conductivity (μS/cm) 99.3 ± 64.5 214.3 ± 72.3 0.003* TDS 0.065 ± 0.042 0.139 ± 0.047 0.024* Dissolved Oxygen 11.05 ± 1.85 10.36 ± 2.61 0.540 Alkalinity 51.4 ± 36.6 102.7 ± 42.8 0.018* RVHA 136.3 ± 25.96 126.3 ± 19.37 0.377

40
Table 7:
All 50 species that occurred within samples were classified based on traits. Spawning habits are rock-gravel spawners (RG), gravel-
sand spawners (GS), non-guarding lithophils (NGL), cavity spawners (CAV), Lithophilic spawners in sand or rock (LSR) and clean
gravel spawners (CGS). Trophic levels are invertivore-piscivore (IP), invertivore (IN), macro-omnivore (MO), and omnivore-herbivore
(OH). Tolerance levels are intolerant (I), moderately tolerant (M), and tolerant (T). Other classifications included benthic species (B)
and game species (G).
Common Scientific Code Family Spawn Trophic Tol. Other
Yellow Bullhead Ameiurus natalis AMNA Ictaluridae MO, OH T B, G
Brown Bullhead Ameiurus nebulosus AMNE Ictaluridae MO, OH T B, G
Rock bass Ambloplites rupestris AMRU Centrachidae IP M B, G
Central Stoneroller Campostoma anomalum CAAN Cyprinidae RG, CGS MO, OH T B
River Carpsucker Carpiodes carpio CACA Catostomidae MO, OH M B
White Sucker Catostomus commersoni CACO Catostomidae GS, NGL MO, OH T B
Southern Redbelly Dace Chrosomus erythrogaster PHER Cyprinidae MO, OH M
Redside Dace Clinostomus elongatus CLEL Cyprinidae RG IN, IP I
Mottled Sculpin Cottus bairdii COBA Cottidae CAV IN, IP M B
Spotfin Shiner Cyprinella spiloptera CYSP Cyprinidae CAV IN, IP T
Muskellunge Esox masquinongy ESMA Esocidae IP I G

41
Greenside Darter Etheostoma blennioides ETBL Percidae RG, NGL IN, IP I B
Rainbow Darter Etheostoma caeruleum ETCA Percidae RG, CGS IN, IP M B
Fantail Darter Etheostoma flabellare ETFL Percidae RG, CAV IN, IP M B
Johnny Darter Etheostoma nigrum ETNI Percidae RG, CAV IN, IP M B
Banded Darter Etheostoma zonale ETZO Percidae NGL IN, IP I B
Northern Hogsucker Hypentelium nigricans HYNI Catostomidae RG, CGS, NGL IN, IP M B
Channel Catfish Ictalurus punctatus ICPU Ictaluridae MO, OH T B, G
Least Brook Lamprey Lampetra aepyptera LAAE Petromyzontidae GS, CGS MO, OH I B
Redbreast Sunfish Lepomis auritus LEAU Centrachidae GS IP M G
Green Sunfish Lepomis cyanellus LECY Centrachidae IP T G
Pumpkinseed Lepomis gibbosus LEGI Centrachidae IN, IP M
Bluegill Lepomis macrochirus LEMA Centrachidae IN, IP T G
Longear Sunfish Lepomis megalotis LEME Centrachidae IN, IP M G
Striped Shiner Luxilus chrysocephalus LUCH Cyprinidae RG OH T
Redfin Shiner Lythrurus umbratilis LYUM Cyprinidae IN, IP T
Smallmouth Bass Micropterus dolomieu MIDO Centrachidae IP M G
Spotted Sucker Minytrema melanops MIME Catostomidae RG, NGL OH M B
Spotted Bass Micropterus punctulatus MIPU Centrachidae IP M G

42
Largemouth Bass Micropterus salmoides MISA Centrachidae IP M G
Black Redhorse Moxostoma duquesni MODU Catostomidae RG, NGL IN, IP I B
Golden Redhorse Moxostoma erythrurum MOER Catostomidae GS, CGS, NGL IN, IP I B
Emerald Shiner Notropis atherinoides NOAT Cyprinidae MO, OH M
Silverjaw Minnow Notropis buccatus NOBU Cyprinidae GS, NGL IN, IP T
Mountain Madtom Noturus eleutherus NOEL Ictaluridae CAV IN, IP I B
Stonecat Noturus flavus NOFU Ictaluridae CAV IN, IP M B
River Chub Nocomis micropogon NOMI Cyprinidae RG, CGS IN, IP M
Brindled Madtom Naturus miurus NOMU Ictaluridae CAV IN, IP M B
Silver Shiner Notropis photogenis NOPH Cyprinidae IN, IP T
Rosyface Shiner Notropis rubellus NORU Cyprinidae RG, NGL IN, IP I
Sand Shiner Notropis stramineus NOST Cyprinidae LSR OH M
Mimic Shiner Notropis volucellus NOVO Cyprinidae IN, IP M
Logperch Percina caprodes PECA Percidae GS, CGS IN, IP M B
Blackside Darter Percina maculate PEMC Percidae GS, CGS IN, IP M B
Trout-perch Percopsis omiscomaycus PEOM Percopsidea IN, IP M B
Bluntnose Minnow Pimephales notatus PINO Cyprinidae CAV MO, OH T
Eastern Blacknose Dace Rhinichthys atratulus RHAT Cyprinidae GS, CGS MO, OH T B

43
Longnose Dace Rhinichthys cataractae RHCA Cyprinidae CGS IN, IP M B
Brook Trout Salvelinus fontinalis SAFO Salmonidae CGS IP I G
Creek Chub Semotilus atromaculatus SEAT Cyprinidae GS IP T

44
Table 8:
Results of a generalized linear effects model comparing species within the Invertivore-Piscivore
and Benthic metrics. Raw counts were used to determine mean and standard deviation for the
Invertivore-Piscivore metric. Relative abundances were used to determine mean and standard
deviation for the benthic metric.
Invertivore–Piscivore Metric
Species Period Mean (±SD) p value
Redside Dace Pre 7.5±21.2
<0.001 Post 0.375±1.06
Rainbow Darter Pre 22.75±27.07
0.026 Post 17.75±22.96
Johnny Darter Pre 22.5±20.42
<0.001 Post 7.875±9.88
Longear Sunfish Pre 5.125±12.9
<0.001 Post 0.625±1.41
Golden Redhorse Pre 5.75±13.9
<0.001 Post 0.125±0.35
Mimic Shiner Pre 10.875±22.28
<0.001 Post 2.5±5.24
Benthic Metric
Central Stoneroller Pre 0.345±0.264
<0.001 Post 0.40±0.234
Mottled Sculpin Pre 0.011±0.038
0.020 Post 0.021±0.032
Northern Hogsucker Pre 0.054±0.060
0.007 Post 0.062±0.060
Logperch Pre 0.0008±0.002
<0.001 Post 0.0087±0.022
Eastern Blacknose Dace Pre 0.072±0.071
<0.001 Post 0.123±0.172

45
REFERENCES
Anderson, A. M., J. T. Petty, G. Merovich, S. A. Welsh, Y. Park, and N. P. Hitt. 2015. Fish
communities as indicators of ecological health in West Virginia. West Virginia University.
Aspey, W. P., and S. I. Lustick. 1983. Behavioral energetics : the cost of survival in vertebrates.
Ohio State University Press.
Barbour, M. T., J. Gerritsen, B. D. Snyder, and J. B. Stribling. 1999. Rapid bioassessment
protocols for use in streams and rivers: Periphyton, Benthic Macroinvertebrates and Fish,
Second Edition. Washington, D.C.
Brittingham, M. C., K. O. Maloney, A. M. Farag, D. D. Harper, and Z. H. Bowen. 2014.
Ecological Risks of Shale Oil and Gas Development to Wildlife, Aquatic Resources and
their Habitats. Environmental Science & Technology 48(19):11034–11047.
Brown, S. P. A., M. K. Yucel, and M. K. Yücel. 2013. The Shale Gas and Tight Oil Boom: U.S.
States’ Economic Gains and Vulnerabilities. Council of Foreign Relations (October):1–12.
Cuffney, T. F., M. R. Meador, S. D. Porter, and M. E. Gurtz. 2000. Responses of Physical,
Chemical, and Biological Indicators of Water Quality to a Gradient of Agricultural Land Use
in the Yakima River Basin, Washington. Environmental Monitoring and Assessment
64(1):259–270. Kluwer Academic Publishers.
Entrekin, S., M. Evans-White, B. Johnson, and E. Hagenbuch. 2011. Rapid expansion of natural
gas development poses a threat to surface waters. Ecology and the Environment
9204(9):503–511.
Fausch, K. D., C. E. Torgersen, C. V. Baxter, and H. W. Li. 2002. Landscapes to Riverscapes:
Bridging the Gap between Research and Conservation of Stream FishesA Continuous
View of the River is Needed to Understand How Processes Interacting among Scales Set
the Context for Stream Fishes and Their Habitat. BioScience 52(6):483–498. Narnia.
Freund, J. G., and J. T. Petty. 2007. Response of Fish and Macroinvertebrate Bioassessment
Indices to Water Chemistry in a Mined Appalachian Watershed. Environmental

46
Management 39(5):707–720.
Gagic, V., I. Bartomeus, T. Jonsson, A. Taylor, C. Winqvist, C. Fischer, E. M. Slade, I. Steffan-
Dewenter, M. Emmerson, S. G. Potts, T. Tscharntke, W. Weisser, and R. Bommarco.
2015. Functional identity and diversity of animals predict ecosystem functioning better than
species-based indices. Proceedings of the Royal Society B: Biological Sciences
282(1801):20142620–20142620.
Gammon, J. 1980. The Use of Community Parameters Derived From Electrofishing Catches of
River Fish as Indicators of Environmental Quality, in Seminar on Water Quality
Management Tradeoffs. Washington, D.C.
Harding, J. S., E. F. Benfield, P. V. Bolstad, G. S. Helfman, and E. B. D. Jones. 1998. Stream
biodiversity: The ghost of land use past. Proceedings of the National Academy of Sciences
95(25).
Heino, J., A. S. Melo, T. Siqueira, J. Soininen, S. Valanko, and L. M. Bini. 2015. Metacommunity
organisation, spatial extent and dispersal in aquatic systems: patterns, processes and
prospects. Freshwater Biology 60(5):845–869. John Wiley & Sons, Ltd (10.1111).
Hense, Z., R. W. Martin, and J. T. Petty. 2010. Electrofishing Capture Efficiencies for Common
Stream Fish Species to Support Watershed-Scale Studies in the Central Appalachians.
North American Journal of Fisheries Management 30(4):1041–1050.
Karr, J. R. 1981. Assessment of Biotic Integrity Using Fish Communities. Fisheries 6(6):21–27.
Karr, J. R. 1990. Biological Integrity and the Goal of Environmental Legislation : Lessons for
Conservation Biology. Conservation Biology 4(3):244–250.
King, R. S., M. E. Baker, D. F. Whigham, D. E. Weller, T. E. Jordan, P. F. Kazyak, and M. K.
Hurd. 2005. Spatial consideration for linking watershed land cover to ecological indicators
in streams. Ecological Applications 15(1):137–153.
Leibold, M. A., M. Holyoak, N. Mouquet, P. Amarasekare, J. M. Chase, M. F. Hoopes, R. D.
Holt, J. B. Shurin, R. Law, D. Tilman, M. Loreau, and A. Gonzalez. 2004. The

47
metacommunity concept: a framework for multi-scale community ecology. Ecology Letters
7(7):601–613. John Wiley & Sons, Ltd (10.1111).
Mazur, M. M., and D. A. Beauchamp. 2003. A comparison of Visual Prey Detection Among
Species of Piscivorous Salmonids: Effects of Light and Low Turbidities. Environmental
Biology of Fishes 67(4):397–405. Kluwer Academic Publishers.
McCormick, F. H., R. M. Hughes, P. R. Kaufmann, D. V. Peck, J. L. Stoddard, and A. T. Herlihy.
2001. Development of an Index of Biotic Integrity for the Mid-Atlantic Highlands Region.
Transactions of the American Fisheries Society 130(5):857–877.
McDonald, T. L., W. P. Erickson, and L. . McDonald. 2000. Analysis of Count Data from Before-
after Control-Impact Studies. Journal of Agricultural, Biological, and Environmental
Statistics 5(3):262–279.
Merovich, G. T., and J. T. Petty. 2007. Interactive effects of multiple stressors and restoration
priorities in a mined Appalachian watershed. Hydrobiologia 575(1):13–31. Kluwer
Academic Publishers.
Merovich, G. T., J. T. Petty, M. P. Strager, and J. B. Fulton. 2013. Hierarchical classification of
stream condition: a house–neighborhood framework for establishing conservation priorities
in complex riverscapes. Freshwater Science 32(3):874–891. Society for Freshwater
Science.
Merriam, E. R., and J. T. Petty. 2016. Under siege : Isolated tributaries are threatened by
regionally impaired metacommunities. Science of the Total Environment 560–561:170–
178. The Authors.
Merriam, E. R., J. T. Petty, G. T. Merovich, J. B. Fulton, and M. P. Strager. 2011. Additive
effects of mining and residential development on stream conditions in a central
Appalachian watershed. Journal of the North American Benthological Society 30(2):399–
418.
Merriam, E. R., J. T. Petty, M. P. Strager, A. E. Maxwell, and P. F. Ziemkiewicz. 2015.

48
Landscape-based cumulative effects models for predicting stream response to
mountaintop mining in multistressor Appalachian watersheds. Freshwater Science
34(3):1006–1019.
Meyer, J., A. Sutherland, K. Barnes, D. Walters, and B. Freeman. 1999. A scientific basis for
erosion and sedimentation standards in the Blue Ridge physiographic province. Pages
321–324Georgia Water Resources Conference.
Morse, C. C., A. D. Huryn, and C. Cronan. 2003. Impervious surface area as a predictor of the
effects of urbanization on stream insect communities in Maine, U.S.A. Environmental
Monitoring and Assessment 89(95–127):33.
Moutopoulos, D. K., and K. I. Stergiou. 2002. Length-weight and length-length relationships of
fish species from the Aegean Sea (Greece). Journal of Applied Ichthyology 18(3):200–203.
John Wiley & Sons, Ltd (10.1111).
Nico, L., and P. Fuller. 2019. Semotilus atromaculatus (Mitchill, 1818).
https://nas.er.usgs.gov/queries/factsheet.aspx?SpeciesID=649.
Peters, R. H. 1983. The Ecological Implications of Body Size. Cambridge University Press.
Petty, J. T., J. B. Fulton, M. P. Strager, G. T. Merovich, J. M. Stiles, and P. F. Ziemkiewicz.
2010. Landscape indicators and thresholds of stream ecological impairment in an
intensively mined Appalachian watershed Landscape. Journal of the North American
Benthological Society 29(4):1292–1309.
Pirhalla, D. E. 2004. Evaluating Fish–Habitat Relationships for Refining Regional Indexes of
Biotic Integrity: Development of a Tolerance Index of Habitat Degradation for Maryland
Stream Fishes. Transactions of the American Fisheries Society 133(1):144–159.
Rahm, B. G., and S. J. Riha. 2012. Toward strategic management of shale gas development:
Regional, collective impacts on water resources. Environmental Science & Policy 17:12–
23.
Reiss, M. J. 1989. The Allometry of Growth and Reproduction. Cambridge University Press.

49
Ricker, W. E. 1975. Computation and Interpretation of Biological Statistics of Fish Populations.
Department of the Enivronment Fisheries and Marine Service.
Riedel, R., L. M. Caskey, and S. H. Hurlbert. 2007. Length-weight relations and growth rates of
dominant fishes of the Salton Sea: implications for predation by fish-eating birds. Lake and
Reservoir Management 23(5):528–535.
Shields, P. A., and S. C. Carlson. 1996. Effects of Formalin and Alcohol Preservation on
Lengths and Weights of Juvenile Sockeye Salmon. Alaska Fishery Research Bulletin
3(2):81–93.
Shrestha, N., G. Chilkoor, Ovinda, J. Wilder, V. Gadhamshetty, and J. J. Stone. 2017. Potential
water resource impacts of hydraulic fracturing from unconventional oil production in the
Bakken shale. Water Research 108:1–24.
Stoddard, J. L., A. T. Herlihy, D. V Peck, R. M. Hughes, R. Thomas, J. L. Stoddard, A. T.
Herlihy, D. V Peck, and T. R. Whittier. 2008. A process for creating multimetric indices for
large-scale aquatic surveys. Jounral of the North American Benthological Society
27(4):878–891.
Stoddard, J. L., D. P. Larsen, C. P. Hawkins, R. K. Johnson, and R. H. Norris. 2006. Setting
expectations for the ecological condition of streams: The concept of reference condition.
Ecological Applications 16(4):1267–1276.
Stone, M. K., and J. B. Wallace. 1998. Long-term recovery of a mountain stream from clear- cut
logging: the effects of forest succession on benthic invertebrate community structure.
Freshwater Biology 39:151–169.
Walters, D. M., M. C. Freeman, D. S. Leigh, B. J. Freeman, M. J. Paul, and C. M. Pringle. 2001.
Bed texture and turbidity as indicators of fish biotic integrity in the Etowah River system.
Pages 233–236Georgia Water Resources Conference.
Weltman-Fahs, M., and J. M. Taylor. 2013a. Hydraulic Fracturing and Brook Trout Habitat in the
Marcellus Shale Region : Potential Impacts and Research Needs 2415.

50
Weltman-Fahs, M., and J. M. Taylor. 2013b. Hydraulic Fracturing and Brook Trout Habitat in the
Marcellus Shale Region: Potential Impacts and Research Needs. Fisheries 38(1):4–15.
Williams, J. E. 2000. The Coefficient of Condition of Fish. Page Manual of Fisheries Survey
Methods II.
WVDEP. 2018. Watershed Assessment Branch Field Standard Operating Procedures 2018.
Yarnell, S. L. 1998. The Southern Appalachians: A History of the Landscape. Page Gen. Tech.
Rep. SRS-18. Asheville, NC: U.S. Department of Agriculture, Forest Service, Southern
Research Station. 52 p.

51
CHAPTER 3: HEMATOCRIT AS A PREDICTOR OF SEMOTILUS ATROMACULATUS
STRESS DERIVED FROM UNCONVENTIONAL OIL AND GAS DISTURBANCE
Joshua N. Ankeny, J. Todd Petty, Kevin Eliason, Quinton E. Phelps, Eric R. Merriam
ABSTRACT
Unconventional Oil and Gas (UOG) production has been steadily expanding throughout
the mid-Atlantic since early 2008. Increased sedimentation, degraded water chemistry and an
overall decrease in habitat quality due to UOG is anticipated to negatively impact aquatic
inhabitants, a common observation in other stressed landscapes (i.e., mining, agriculture,
development). We tested for differences in Semotilus atromaculatus hematological responses
within eleven UOG impacted sites and eight reference sites with a linear mixed effect model.
Treatment type was found to be a significant predictor of hematocrit levels in resident S.
atromaculatus within UOG impacted streams (p = 0.029). With the findings outlined in this
manuscript, we predict that the steady expansion of horizontal wells could lead to an overall
degradation of resident fish populations as they become increasingly stressed.

52
INTRODUCTION
Headwater streams are an essential element of the holistic ecosystem as they provide
resources through functions that cannot occur elsewhere. Headwater systems are the nexus
between land and higher order streams. They transform allochthonous nutrients into fine
particulate organic matter and dissolved organic matter that can be processed by downstream
residents (Vannote et al. 1980; Cuffney et al. 2000). They provide habitat, thermal refugia and
spawning grounds to higher order residents (Curry et al. 1997; Power et al. 1999; Petty et al.
2005; Meyer et al. 2007). These headwater streams are vital to the preservation of fish taxa and
they are in jeopardy as they are highly susceptible to anthropogenic disturbances (Trexler et al.
2014).
Unconventional Oil and Gas (UOG), also known as hydraulic fracturing or horizontal
drilling, has been rapidly increasing throughout North America since the early 2000s (Rahm and
Riha 2012; Brown et al. 2013). UOG, like other land use stressors (i.e., mining, agriculture,
development), has been shown to stress aquatic systems. UOG increases sediment load
through the construction of impermeable surfaces (i.e., roadways, cement well pads) and the
deforestation of pipeline corridors (Williams et al. 2008; Adams et al. 2011), leaches chemicals
associated with the fracturing process into both surface and ground waters (Rahm and Riha
2012) and alters the natural hydrologic regimes by means of rapid withdrawal or dispersal of
water used in the fracturing process (Entrekin et al. 2011; Weltman-Fahs and Taylor 2013a).
With a rapid spike in a field that is so minimally explored, a major concern is how UOG
impacts receiving freshwater residents. Previous lab studies have analyzed alterations in
various physiological functions of fishes after the introduction of UOG produced brines
(Papoulias and Velasco 2013; Blewett et al. 2017). These studies have concluded that fishes
exposed to UOG produced brines have damaged gill morphology and decreased organ
function. Although these studies are integral, they do not take into account the flashy nature of

53
produced water spills, nor do they account for the natural fluctuation in flows that alter chemical
concentrations. The only way to ensure that these parameters are accounted for is to study
streams in situ.
In this study, we sampled wild populations of Semotilus atromaculatus with regard to
their exposure to upstream UOG. We used hematocrit levels to compare fishes residing in
impacted conditions to those residing in reference conditions. Hematocrit is the volume ratio of
packed red blood cells in a given blood sample and can be used as a stress indicator for fishes
(Sopinka et al. 2016). Studies have shown that hematocrit levels have the potential to decrease
in fish exposed to heavy metals as erythrocyte production is inhibited (Wepener et al. 1992;
Buthelezi et al. 2000; Nussey et al. 2006). The same is true for fish exposed to synthetic
chemicals commonly found in anthropogenically stressed landscapes (Ghaffar et al. 2016,
2018; Qureshi et al. 2016). For the first time, this study showed a decrease in the hematocrit
levels of fishes residing in systems impacted by UOG.
METHODS
Site Selection:
Sites were selected with regard to their exposure to upstream UOG, watershed land use
attributes (i.e., mining, development, agriculture), watershed size and sampling date. Using
version 10.3 ArcGIS software (Environmental Systems Research Institute [ESRI] 2005), UOG
well pad polygons were overlaid on an accumulation land use file. Eight reference sites were
selected by the following criteria: there were no upstream mining impacts, sites had an
upstream agricultural disturbance less than 17%, an upstream developmental disturbance less
than 2.5%, and no UOG well pads within their watershed. Eleven impacted sites were selected
if they had UOG well pads with one or more active wells within their watersheds, had no
upstream mining impacts, an upstream agricultural disturbance less than 17%, an upstream

54
developmental disturbance less than 2.5% and had a sampling date prior to the spud date of the
UOG operation. Land cover values were accumulated from the 2011 edition of the National
Land Cover Database (U.S. Geological Survey, 2014).
Fish and Blood Sampling:
Approximately thirty S. atromaculatus were sampled at each site using singlepass
backpack electrofishing techniques outlined in the WVDEP Fish Collection Protocols (WVDEP,
2011). Smith-Root Model 24LR backpack electrofishers (Vancouver, WA, USA) were used
alongside ¼” mesh nets. Table 10 of the WVDEP Fish and Collection Protocol was used to
determine how many electrofishers and netters to use (WVDEP, 2011). Debilitated fish were
immediately euthanized and a single blood sample from the caudal artery was collected in a
70μL heparinized glass microhematocrit capillary tube and sealed with Sigillum Wax (LW
Scientific, Lawrenceville, Georgia). Upon collection of the blood sample, the specimen and
corresponding blood sample were placed in a Whirl-Pak bag (Nasco, Fork Atkinson, Wisconsin)
and placed on ice. Once in the lab, the blood samples were centrifuged using a CritSpin
Microhematocrit Centrifuge Model M961 (IRIS International, Chatsworth, Los Angeles,
California). The centrifuged samples were read using the Digital Reader (IRIS International,
Chatsworth, Los Angeles, CA, USA). Samples too small to read in the Digital Reader were read
with a microscope.
Physical and Chemical Parameters:
To assess habitat quality, we performed U.S. Environmental Protection Agency (EPA)
rapid visual habitat assessments (RVHA) at each site (Barbour et al. 1999). Using RVHA,
various physiological parameters were assessed to give the site a score (maximum possible
RVHA = 200).

55
A YSI 650 equipped with a 600XL sonde was used to measure dissolved O2, pH,
temperature, total dissolved solids, and specific conductivity (Yellow Springs Instruments,
Yellow Springs, OH, USA). A single filtered sample was obtained using a Nalgene ® filtration
device with a 0.45 μm mixed cellulose-ester membrane filter. This sample was used to measure
Al, Ca, Fe, Mg, Mn, K, Na, Sr, Zn (EPA method 200.7) as well as Ba, Cd, Cr, Ni and Se. (EPA
method 200.8). Three unfiltered samples were obtained and used to measure Br-, Cl-, SO42-
(EPA method 300.0), NO2-, NO3
- (EPA method SM4110B-2000), total P (EPA method SM4500-
P BE-1999), total dissolved solids (EPA method SM2540 C-1997), total and bicarbonate
alkalinity (EPA method SM2320 B-1997). The samples were stored at 4℃ until they were
analyzed at Research Environmental and Industrial Consultants Inc. (Beaver, WV, USA).
Statistical Analysis:
The goal of this study was to determine if hematocrit levels of Semotilus atromaculatus
inhabiting reference streams were significantly different than those of individuals inhabiting
impacted streams. Hematocrit results were tested for normality using a Q-Q plot. We used a
linear mixed effects model, with sampling site as a random effect, to analyze the raw hematocrit
data. A two-sample Kolmogorov-Smirnov test was used to compare the cumulative frequency
distributions of hematocrit for both reference and impacted treatments. A two-sample t-test was
used to compare land use attributes between reference and impacted sites. Land use attributes
were selected based on their likelihood to impact aquatic habitats. All statistical analyses were
performed in R 3.4.1 (R Core Team). The significance level (⍺) used for this study was 0.05.
Two-sample t-tests were used to compare water quality parameters and RVHA between
treatment conditions (Table 2).

56
RESULTS
Hematocrit:
Blood samples were taken from 200 specimens within eight reference sites and 269
specimens within eleven UOG impacted sites. Hematocrit levels from these blood samples were
recorded. A linear mixed effects model, with sampling site as a random effect, revealed that
hematocrit levels are significantly lower in S. atromaculatus residing within UOG impacted
systems (p = 0.029). Compared to reference conditions (51.95 ± 12.5), hematocrit levels
decreased significantly in impacted sites (47.20 ± 14.3). A cumulative frequency plot of the
hematocrit results supports this finding (Figure 1). A two-sample Kolmogorov-Smirnov test was
used to compare frequency distributions within both treatment conditions (p < 0.001 [Figure 1]).
Comparison of upstream well density to average hematocrit levels revealed a slightly negative
correlation, though insignificant (r = -0.397, p = 0.092 [Figure 2]).
Water Chemistry:
Analysis of land uses as a percent of watershed area determined that only UOG was
significantly different (p < 0.001) between impacted and reference sites. Upstream agriculture,
development, forest cover, open water, roads, wetlands and mine lands were not significantly
different between treatment types (p > 0.05 for all parameters [Table 1]). Water chemistry
values differed significantly in calcium (p = 0.005), strontium (p = 0.040) and TDS (p = 0.049)
between treatment types. All three parameters were higher in UOG impacted systems (Table 2).
DISCUSSION
As we advance and progress as a civilization, it is critical to ensure that our exploitation
of oil and gas reserves does not result in diminished ecosystems. Our technological advances
allow for the extraction of hydrocarbons that were previously inaccessible. Consequently, the
environmental side effects of these extraction methods are understudied. In the present study,

57
we explored the negative environmental impacts of UOG (i.e., sedimentation, chemical
leaching, alterations of the hydrological regime [Weltman-Fahs and Taylor 2013]) and studied
their hematological effect on resident Semotilus atromaculatus. Blood samples were taken from
individuals residing in aquatic systems downstream of UOG operations as well as reference
conditions. These blood samples were used to determine hematocrit levels, a common stress
level indicator (Sopinka et al. 2016). Other studies have performed lab experiments that subject
specimen to UOG produced waters and surrogates (Papoulias and Velasco 2013; Blewett et al.
2017; He et al. 2017). To our knowledge this is the first study that analyzes hematological
responses to UOG disturbance in situ.
Land use stressors (i.e., agriculture, mining, development, UOG) have been known to
degrade receiving aquatic systems (Cuffney et al. 2000; Fitzpatrick et al. 2004; Merriam et al.
2011; Weltman-Fahs and Taylor 2013a). Because of these underlying effects, our site selection
methods controlled for UOG as the only significantly different land use attribute between
treatment types (p, 0.001 [Table 2]). Other land uses of concern for this study were agriculture,
development, forest cover, open water, roads, wetland, and both pre- and post- SMCRA mine
lands.
When exploring the water chemistry data, we did observe significantly higher strontium
between our sites. This could indicate a long-term impact of UOG development in the watershed
as high strontium levels have been found in produced waters (Cozzarelli et al. 2017; Geeza et
al. 2018). Although strontium appeared significant within the UOG impacted systems, other
water parameters (i.e., magnesium, conductivity, bromide and barium) which have been found
to be positively correlated with UOG activity did not stand out (Cozzarelli et al. 2017; Austin et
al. 2018; Keller et al. 2018). The flashy nature of produced water spills and leaching suggests
that the chemicals are readily diluted and transported downstream. From the water quality data
we collected, we can argue that single sample water chemistry analysis at baseflow is not an
effective way to measure UOG’s impact on stream chemistry.

58
Compared to control sites, hematocrit levels significantly decreased in UOG impacted
specimens (p < 0.001 [Table 1]). Hematocrit decrease after exposure to pollutants agrees with
the finding of other aquatic studies. Wepener et al. (1992) determined that the presence of
chromium in aquatic systems has the potential to decrease hematocrit levels (Wepener et al.
1992). A similar response was seen with copper exposure (Nussey et al. 2006), manganese
exposure (Barnhorn 1996), arsenic exposure (Ghaffar et al. 2016) and exposure to pesticides
(Qureshi et al. 2016; Ghaffar et al. 2018). In these studies, as well as the present study, it is
assumed that exposure to chemical pollutants (i.e. strontium and calcium) and degraded water
quality (i.e., TDS) result in either an inhibition of erythrocyte formation or hemolysis. Both
physiological responses contribute to reduced red blood cell counts and decreased hematocrit
levels.
In Figure 2, we compared the average hematocrit levels to the density of UOG wells
within the watershed (wells/km2) at the site level. A negative correlation (r = -0.397) revealed
that as upstream well density increased the health of resident Semotilus atromaculatus
decreased. This finding could aid the Department of Environmental Protection (DEP) in making
better informed decisions regarding the permitting of UOG wells. With future studies to support
our finding, there is potential to create permitting restrictions that take into account the density of
UOG wells within a given watershed.
The methods outlined in this study provide a fast and cost-effective way to analyze the
effects of land use stressors on aquatic systems. Previous study methods require either a large
team of technicians (i.e., fish community analyses), an intricate knowledge of invertebrate
species (i.e., aquatic macroinvertebrate studies), access to laboratory space or access to
expensive equipment (i.e., water chemistry analyses). The present study requires the following:
a small team of technicians, the ability to identify the target species and access to inexpensive
microhematocrit sampling equipment.

59
CONCLUSION
In the Ohio and Monongahela River Basins of northern West Virginia, an area known for
its anthropogenically stressed landscape, we discovered that UOG is negatively impacting the
health of resident Semotilus atromaculatus. When compared to reference conditions, fish
residing in UOG impacted systems had significantly lower hematocrit levels. Previous studies
have attributed this decrease in hematocrit levels to hemolysis or hindered erythrocyte
production. Consequently, as UOG is the only significantly different land use between treatment
types, we are confident in suggesting that an increase in sedimentation and chemical leaching
associated with UOG operations is responsible for the decreased health of the inhabitants.
ACKNOWLEDGEMENTS
We thank the NSF for their funding of this project. We would like to thank the West
Virginia Division of Natural Resources and West Virginia Department of Environmental
Protection for their assistance in the site selection process. Dr. Shawn Grushecky of the West
Virginia University Energy and Land Management Division provided detailed maps of UOG
wells within the study area. Jacquelyn Strager of the Natural Resource Analysis Center provided
the accumulated land use data that was used for site selection. We greatly appreciate the field
help provided by Rebecca Long, Brian Gordon, Jillian Clemente, Kurt Sigler, Timothy Robine,
Connor Cunningham. We would also like to thank Donna Hartman for her logistical support.

60
FIGURES AND TABLES
Figure 1:
A cumulative frequency plot of hematocrit data. The dark gray bars represent the
frequency of hematocrit values for the impacted sites while the light gray bars represent the
control sites. The solid line represents to the percentage frequency for the impacted sites while
the dashed line represents the reference sites. p = significance factor, NR = number of reference
samples, NI = number of impacted samples

61
Figure 2:
The relationship between upstream UOG density (wells/km2) and average hematocrit
levels. The points represent individual sites. The dotted line represents the best fit line.

62
Table 1:
Comparison of watershed land uses between treatment types. Unconventional Oil and
Gas was calculated as wells per upstream area. Other land uses were calculated as a percent
of total upstream area. An asterisk (*) denotes statistically significant parameters.
Watershed Land Uses Average Area ± SD (km2) P-Value
Reference Impacted Agriculture (%) 7.88 ± 5.04 8.72 ± 3.17 0.685 Development (%) 0.74 ± 0.86 0.57 ± 0.39 0.611 Forest Cover (%) 89.1 ± 6.55 88.8 ± 3.56 0.927 Open Water (%) 0.050 ± 0.059 0.060 ± 0.080 0.758 Roads (%) 1.86 ± 0.51 1.71 ± 0.66 0.605 Herbaceous Wetlands (%) 0.016 ± 0.040 0.028 ± 0.046 0.543 Woody Wetlands (%) 0 0.0008 ± 0.002 0.249 UOG (Wells/km2) 0 1.03 ± 0.66 < 0.001*
Pre SMCRA Grass (%) 0 0 NA Pre SMCRA Barren (%) 0 0 NA Pre SMCRA Forest (%) 0 0 NA Post SMCRA Grass (%) 0.094 ± 0.21 0 0.238 Post SMCRA Barren (%) 0.018 ± 0.047 0 0.329 Post SMCRA Forest (%) 0.21 ± 0.37 0.0003 ± 0.0009 0.148

63
Figure 3:
11 impacted sites (★) and 8 reference sites (●) were sampled within both the
Monongahela River drainage basin (light grey) and the Ohio River drainage basin (dark grey).
Dashed polygon represents the Marcellus shale formation. Map created in ArcGIS version 10.3
(ESRI, 2005).

64
Table 2:
Comparison of water quality and habitat parameters between treatment types. An
asterisk (*) denotes statistically significant parameters. All metrics are mg/L except for those
specified. RVHA is a score ranging between 0 and 200.
Parameters Mean ± SD P-Value
Reference Impacted Aluminum 0.024 ± 0.030 0.045 ± 0.050 0.300 Calcium 19.55 ± 6.73 30.44 ± 7.11 0.005* Iron 0.109 ± 0.092 0.120 ± 0.073 0.804 Magnesium 3.56 ± 1.66 5.06 ± 1.40 0.065 Manganese 0.030 ± 0.040 0.043 ± 0.059 0.616 Potassium 1.81 ± 0.88 1.92 ± 0.42 0.767 Sodium 7.44 ± 7.56 16.16 ± 20.10 0.253 Strontium 0.080 ± 0.047 0.148 ± 0.074 0.040* Zinc 0.003 ± 0.005 0.006 ± 0.013 0.509 Barium 0.058 ± 0.022 0.062 ± 0.018 0.747 Bromide 0.008 ± 0.021 0.131 ± 0.299 0.251 Chloride 4.85 ± 3.82 15.53 ± 24.98 0.240 Sulfate 20.49 ± 22.53 13.15 ± 7.30 0.403 Nitrate 0.473 ± 1.00 0.078 ± 0.077 0.302 Phosphorous 0.01 ± 0.013 0.007 ± 0.007 0.535 pH 7.97 ± 1.12 8.03 ± 0.324 0.881 Conductivity (μS/cm) 157.88 ± 83.63 223.78 ± 107.12 0.176 TDS 99.5 ± 39.89 162.1 ± 74.45 0.049* Dissolved Oxygen 7.22 ± 1.90 8.28 ± 2.39 0.356 Alkalinity 56.94 ± 38.76 90.59 ± 33.31 0.077 RVHA 127.38 ± 18.85 129.14 ± 21.07 0.868

65
REFERENCES
Adams, M. B., P. J. Edwards, W. M. Ford, J. B. Johnson, T. M. Schuler, M. Thomas-Van Gundy,
and F. Wood. 2011. Effects of development of a natural gas well and associated pipeline
on the natural and scientific resources of the Fernow Experimental Forest.
Austin, B. J., J. E. Kelso, M. A. Evans-White, S. A. Entrekin, and B. E. Haggard. 2018. Can high
volume hydraulic fracturing effects be detected in large watersheds? A case study of the
South Fork Little Red River. Current Opinion in Environmental Science & Health 3:40–46.
Elsevier.
Barbour, M. T., J. Gerritsen, B. D. Snyder, and J. B. Stribling. 1999. Rapid bioassessment
protocols for use in streams and rivers: Periphyton, Benthic Macroinvertebrates and Fish,
Second Edition. Washington, D.C.
Barnhorn, I. 1996. Effects of Manganese on the Haematology of Oreochromis Mossambicus
and the Bioaccumulation of Metals in Labeo Umbratus. Rand Afrikaans University.
Blewett, T. A., A. M. Weinrauch, P. L. M. Delompré, and G. G. Goss. 2017. The effect of
hydraulic flowback and produced water on gill morphology, oxidative stress and antioxidant
response in rainbow trout (Oncorhynchus mykiss). Scientific Reports 7(1):46582.
Brown, S. P. A., M. K. Yucel, and M. K. Yücel. 2013. The Shale Gas and Tight Oil Boom: U.S.
States’ Economic Gains and Vulnerabilities. Council of Foreign Relations (October):1–12.
Buthelezi, P. P., V. Wepener, and D. P. Cyrus. 2000. The sublethal effects of zinc at different
water temperatures on selected haematological variables in Oreochromis mossambicus.
African Journal of Aquatic Science 25:146–151.
Cozzarelli, I. M., K. J. Skalak, D. B. Kent, M. A. Engle, A. Benthem, A. C. Mumford, K. Haase, A.
Farag, D. Harper, S. C. Nagel, L. R. Iwanowicz, W. H. Orem, D. M. Akob, J. B. Jaeschke,
J. Galloway, M. Kohler, D. L. Stoliker, and G. D. Jolly. 2017. Environmental signatures and
effects of an oil and gas wastewater spill in the Williston Basin, North Dakota. Science of
The Total Environment 579:1781–1793. Elsevier.
66
Cuffney, T. F., M. R. Meador, S. D. Porter, and M. E. Gurtz. 2000. Responses of Physical,
Chemical, and Biological Indicators of Water Quality to a Gradient of Agricultural Land Use
in the Yakima River Basin, Washington. Environmental Monitoring and Assessment
64(1):259–270. Kluwer Academic Publishers.
Curry, A. R., C. Brady, D. L. Noakes, and R. G. Danzmann. 1997. Use of Small Streams by
Young Brook Trout Spawned in a Lake. Transactions of the American Fisheries Society
126:77–83.
Entrekin, S., M. Evans-White, B. Johnson, and E. Hagenbuch. 2011. Rapid expansion of natural
gas development poses a threat to surface waters. Ecology and the Environment
9204(9):503–511.
Fitzpatrick, F. A., M. A. Harris, T. L. Arnold, and K. D. Richards. 2004. Urbanization influences
on aquatic communities in northeastern illinois streams. Journal of the American Water
Resources Association 40(2):461–475. John Wiley & Sons, Ltd (10.1111).
Geeza, T. J., D. P. Gillikin, B. McDevitt, K. Van Sice, and N. R. Warner. 2018. Accumulation of
Marcellus Formation Oil and Gas Wastewater Metals in Freshwater Mussel Shells.
Environmental Science & Technology 52(18):10883–10892.
Ghaffar, A., R. Hussain, G. Abbas, M. Kalim, A. Khan, S. Ferrando, L. Gallus, and Z. Ahmed.
2018. Fipronil (Phenylpyrazole) induces hemato-biochemical, histological and genetic
damage at low doses in common carp, Cyprinus carpio (Linnaeus, 1758). Ecotoxicology
27(9):1261–1271.
Ghaffar, A., R. Hussain, M. Aslam, G. Abbas, and A. Khan. 2016. Arsenic and Urea in
Combination Alters the Hematology , Biochemistry and Protoplasm in Exposed Rahu Fish (
Labeo rohita ) ( Hamilton , 1822 ) 296:289–296.
He, Y., E. J. Folkerts, Y. Zhang, J. W. Martin, D. S. Alessi, and G. G. Goss. 2017. Effects on
Biotransformation, Oxidative Stress, and Endocrine Disruption in Rainbow Trout (
Oncorhynchus mykiss ) Exposed to Hydraulic Fracturing Flowback and Produced Water.

67
Environmental Science & Technology 51(2):940–947. American Chemical Society.
Keller, D. H., P. M. Zelanko, J. E. Gagnon, R. J. Horwitz, H. S. Galbraith, and D. J. Velinsky.
2018. Linking otolith microchemistry and surface water contamination from natural gas
mining. Environmental Pollution 240:457–465.
Merriam, E. R., J. T. Petty, G. T. Merovich, J. B. Fulton, and M. P. Strager. 2011. Additive
effects of mining and residential development on stream conditions in a central
Appalachian watershed. Journal of the North American Benthological Society 30(2):399–
418.
Meyer, J. L., D. L. Strayer, J. B. Wallace, S. L. Eggert, G. S. Helfman, and N. E. Leonard. 2007.
The Contribution of Headwater Streams to Biodiversity in River Networks1. JAWRA
Journal of the American Water Resources Association 43(1):86–103. John Wiley & Sons,
Ltd (10.1111).
Nussey, G., J. H. J. Van Vuren, and H. H. du Preez. 2006. Effect of copper on the haematology
and osmoregulation of the Mozambique tilapia , Oreochromis mossambicus ( Cichlidae ).
Comp. Biochem. Physiol. 111c(3):369–380.
Papoulias, D. M., and A. L. Velasco. 2013. Histopathological Analysis of Fish from Acorn Fork
Creek , Kentucky , Exposed to Hydraulic Fracturing Fluid Releases. Southeastern
Naturalist 12(4):92–111.
Petty, J. T., P. J. Lamothe, and P. M. Mazik. 2005. Spatial and Seasonal Dynamics of Brook
Trout Populations Inhabiting a Central Appalachian Watershed; Spatial and Seasonal
Dynamics of Brook Trout Populations Inhabiting a Central Appalachian Watershed.
Transactions of the American Fisheries Society 134:572–587.
Power, G., R. S. Brown, and J. G. Imhof. 1999. Groundwater and fish—insights from northern
North America. Hydrological Processes 13(3):401–422. John Wiley & Sons, Ltd.
Qureshi, I. Z., A. Bibi, S. Shahid, and M. Ghazanfar. 2016. Exposure to sub-acute doses of
fipronil and buprofezin in combination or alone induces biochemical , hematological ,

68
histopathological and genotoxic damage in common carp ( Cyprinus carpio L .). Aquatic
Toxicology 179:103–114. Elsevier B.V.
Rahm, B. G., and S. J. Riha. 2012. Toward strategic management of shale gas development:
Regional, collective impacts on water resources. Environmental Science & Policy 17:12–
23.
Sopinka, N. M., M. R. Donaldson, C. M. O’Connor, C. D. Suski, and S. J. Cooke. 2016. Stress
Indicators in Fish. Pages 405–462Fish Physiology.
Trexler, R., C. Solomon, C. J. Brislawn, J. R. Wright, A. Rosenberger, E. E. McClure, A. M.
Grube, M. P. Peterson, M. Keddache, O. U. Mason, T. C. Hazen, C. J. Grant, and R.
Lamendella. 2014. Assessing impacts of unconventional natural gas extraction on
microbial communities in headwater stream ecosystems in Northwestern Pennsylvania.
Frontiers in Microbiology 5:522.
Vannote, R. L., G. W. Minshall, K. W. Cummins, J. R. Sedell, and C. E. Cushing. 1980. The
River Continuum Concept. Canadian Journal of Fisheries and Aquatic Sciences 37(1):130–
137. NRC Research Press Ottawa, Canada .
Weltman-Fahs, M., and J. M. Taylor. 2013. Hydraulic Fracturing and Brook Trout Habitat in the
Marcellus Shale Region: Potential Impacts and Research Needs. Fisheries 38(1):4–15.
Wepener, V. E. O. H. C. A. D. pH V. O. T. H. O. Tilap. S. (CICHLIDAE), J. Van Vuren, and H.
Du Preez. 1992. The effect of hexavalent chromium at different pH values on the
haematology of Tilapia Sparrmanii (Cichlidae). Comp. Biochem. Physiol. I01C(2):375–381.
Williams, H. F. L., D. L. Havens, K. E. Banks, and D. J. Wachal. 2008. Field-based monitoring of
sediment runoff from natural gas well sites in Denton County, Texas, USA. Environmental
Geology 55(7):1463–1471.