analysis of urgent care attendances by patients … of urgent care attendances by patients...
TRANSCRIPT

Analysis of urgent care attendances by patients registered in the West Lancashire CCG footprint
Author: Simon Collins Public Health Analyst
Contributor: Angela Tucker Specialty Registrar in PH
Sponsor: Karen Thompson Consultant in Public Health
Date: 5th September 2014

Analysis of urgent care attendances by patients registered in the West Lancashire CCG footprint
1
Introduction
Avoiding emergency hospital admissions is a major concern for the National Health Service (NHS), not only because of the rising unit costs of emergency admissions compared with other forms of care, but also because of the disruption it causes to elective health care. Most notably to inpatient waiting lists and to the individuals admitted (Audit Commission 2009). It is important to be clear which admissions are potentially avoidable and which interventions are likely to be effective. Clarity of disease coding is essential. Nationally the growth of new forms of urgent care, such as walk-in and minor injury centres, has failed to reduce A&E attendances (Cooke et al 2004). These grew by 30 per cent between 2003/4 and 2011/12 (Department of Health 2011) The search for ways to reduce the need for emergency care continues and there is an ongoing lack of consensus on whether preventive or community interventions can deliver changes in this area in the timescale required (Nuffield Trust 2014). However new initiatives and tools are being developed constantly. What is needed is constant monitoring of the many dimensions of quality of care delivered both inside and outside secondary care settings, considering the whole system for those patients who use urgent care.
Summary
Around 108,775 patients registered in the West Lancashire Clinical Commissioning Group (CCG) footprint have generated 216,689 urgent care attendances during the three year period 2011/12 to 2013/14.
The volume of urgent care attendances remains consistent over the three year period with some slight variations in year
The age profile of attendances occurring outside the North West show that 32% were aged 15-24 and 70% of these were aged 19-22,
99% (214,666) of all activity over the past three financial years occurs in the North West across 5 main providers
The weekend seems the quietest period of the week, accounting for 25% of attendances.
The Walk in Centre and the Minor Injury A&E units are at their busiest between the hours of 0700 and 1100
38% (79,834) of patients were discharged without requiring any follow up treatment
Practices with a taxonomy classification of either triangle or oval, had recorded a rate above the CCG average
Data Quality issues
The data used for this report has come from the Secondary Uses Service (SUS), which is the largest repository for healthcare data in England. However, it is not without its issues including data duplications, poor coding and inconsistencies. These issues are not entirely down to the I.T systems or the hospital coders. Poor quality clinical notes can also play their part. In the case of urgent care, the data quality issues mostly affect the level detail around the diagnosis of the patient limiting our understanding of what was wrong with the patient and why they attended urgent care. The data set received by the public health intelligence team, at Lancashire County Council required an extensive clean up before our analysis could begin. One of the main issues was that the initial dataset we received included a number of attendances from patients registered to non –West Lancashire clinical commissioning group (CCG) practices, including patients from practices in Northern Ireland and North Wales. These had to be removed before we could being our analysis. Additionally, as data spanned a number of years, it included a number of practices which are either no longer open or that have merged with other practices within the CCG. To resolve this, we had to identify which practices the patients of the closed practices now belong to and merge the data sets together. In most cases we were able to do this, in the case of two practices (P81767-Dr Bb Singh and Y02903-West Lancashire Health Centre) we were unable to identify the correct practices codes to assign to the patients. However, the attendances assigned to these practices have been included in this report, as we know that the patients would have been West Lancashire patients at the time of treatment. For ease of understanding, throughout this report we have collectively referred to the A&E, specialists A&E, Minor Injury and Walk-in Centres as Urgent Care Centres.

Analysis of urgent care attendances by patients registered in the West Lancashire CCG footprint
2
Site location Count of Atts. % of total
North West 214,666 99.07%
Yorkshire and The Humber 364 0.17%
London 329 0.15%
West Midlands 298 0.14%
South West 274 0.13%
North East 221 0.10%
East Midlands 177 0.08%
East Of England 153 0.07%
South Central 107 0.05%
South East Coast 99 0.05%
Unknown/Blanks 1 0.0005%
Grand Total 216,689 100%
Urgent Care Attendances for the three year period 2011/12 – 2013/14 Over the past three financial years (April 1st 2011 – March 31st 2014) around 108,7751 patients registered in the West Lancashire Clinical Commissioning Group (CCG) footprint, have generated 216,689 urgent care attendances at 192 different providers from all over England. This works out at just under two attendances (1.99:1) for every one patient. Figure 1 below shows that the volume of urgent care attendances seems to remain consistent over a calendar year and that over the three year period examined, attendance levels have been gradually coming down. Of particular interest is the large drop in attendances after the launch of the NHS 111 service (April 2013). However, using these figures it is impossible to confirm, if that has come about as a direct result of the service launch, particularly as a large increase in attendances occurred in the following month (May 2013). However, activity levels over the 12 month period after the launch are lower than those during the 12 months prior to it. We also observed a slight increase in attendances, at the beginning of each calendar year (Jan-Mar).
Figure 1 : Urgent care centre attendances (All providers), from West Lancashire CCG registered patients, 2011/12 – 2013/14
A nationwide picture Looking at this from a national provider perspective, attendances have been recorded at almost 200 different providers nationwide. However, when broken down by region (Figure 2), 99% of attendances have occurred within the North West region.
Figure 2: Urgent care attendances by region
1 Based on a count of the total number of pseudonymised NHS numbers and excluding 70 attendances with no recorded NHS number

Analysis of urgent care attendances by patients registered in the West Lancashire CCG footprint
3
Count of
Atts.% of row
Count of
Atts.% of row
Count of
Atts.% of row
0-4 43 2.13% 52 2.57% 20 0.99% 115 5.68%
05-14 52 2.57% 72 3.56% 0.00% 124 6.13%
15-24 354 17.50% 287 14.19% 6 0.30% 647 31.98%
25-34 111 5.49% 183 9.05% 1 0.05% 295 14.58%
35-44 50 2.47% 109 5.39% 0.00% 159 7.86%
45-54 61 3.02% 135 6.67% 2 0.10% 198 9.79%
55-64 85 4.20% 82 4.05% 0.00% 167 8.26%
65-74 99 4.89% 72 3.56% 0.00% 171 8.45%
75+ 75 3.71% 68 3.36% 4 0.20% 147 7.27%
Grand Total 930 45.97% 1,060 52.40% 33 0.44% 2,023 100%
Female Male Not Known/Not
Age bandTotal
Atts.
% Of
Total
Possible explanations for this dispersal of urgent care activity across the country include the effect of university age students moving away from home to study, but not registering with a local health provider and people requiring health care whilst on holiday. Data quality issues, may also have played a part. Looking at the age band breakdown of the attendances that have occurred outside of the North West region (Figure 3), 32% were aged 15-24 and of these 70% were aged 19-22, which fits the theory that many of these patients could be students studying away from home.
Figure 3: Age-banded, urgent care centre attendances, recorded outside of the North West region (2011/12 – 2013/14)
Continuing to focus on the patients aged 15-24, we found that 77% (497) had self-referred, with 68% of the attendances occurring between 07:00 and 19:00. Looking at the reasons why these patients had attended urgent care, it was found that 43% (280) of these attendances had one of the following diagnosis: Blank/Other/Unknown (29% │ 187) or Diagnosis not classifiable (14% │ 93). It was also noted that 55% (356) of these attendances had a recorded treatment of Guidance/Advice Only (35%│228), Blank/Other/Unknown (10% │64) or None [Consider Guidance/Advice Option] (10% │64). Looking at the attendance outcome field, 45% (289) of these attendances, from 15-25 year olds, where coded to Discharged - did not require any follow up treatment and 26% (169) where coded as Discharged - follow up treatment to be provided by General Practitioner. The average length of stay was found to be 2hr 11mins, with the longest period spent in urgent care being 16 hours for a patient in their early twenties, who was eventually admitted to hospital; however, no diagnosis code was recorded. The shortest period was three minutes, for a patient also aged in their early twenties who was discharged, with follow-up treatment to be provided by their GP.
The North West picture Brining our analysis a little closer to home, this section focuses on the attendances that were recorded at providers in the North West region, which accounted for 99% (214,666) of all activity over the past three financial years. Whilst the activity is split over 31 different providers (Appendix A), 91% (194,839) of attendances, in the North West, have been coded to either the Southport & Ormskirk Hospitals Trust (68% │ 146,241) or the West Lancashire Health Care Centre (23% │ 48,598). Additionally, these attendances make up 90% of all urgent care activity recorded for the CCG over the past three financial years (2011/12 – 2013/14). When the activity for the next three biggest providers, in terms of total activity recorded, is taken into account, it equates to 97% (208,081) of all urgent care attendances over the past three financial years. As such, the analysis will now focus on these five providers.
The main providers
As discussed previously, 97% of all urgent care activity, recorded by patients registered in the West Lancashire CCG footprint, occurred at just five different providers and when we examined this data in more detail (Figure 4 and 5) we found that 56% (122,155) of attendances had been coded to either the Skelmersdale Walk-in Centre (29% │ 62,977) or the West Lancashire Health Centre (27% │ 59,178). This suggests that people are either finding the Walk-in Centres are more convenient to attend than the A&E units or that the message around not attending A&E unless it is an emergency is working. However, it would be impossible to confirm these assumptions from this data set.

Analysis of urgent care attendances by patients registered in the West Lancashire CCG footprint
4
Provider Site 2011-12 2012-13 2013-14Grand
Total% Grand total
RVY30 : The Skelmersdale Walk In Centre 19,428 21,993 21,556 62,977 29%
RVY01 : Southport & Formby District General
Hospital14,326 13,865 13,692 41,883 19%
RVY02 : Ormskirk & District General Hospital 10,415 10,394 9,992 30,801 14%
RVY39 : West Lancs Health Centre 10,580 10,580 5%
West Lancashire Health Care : (NM1) NM1 : West Lancashire Health Care 22,027 24,729 1,842 48,598 22%
Wrightington, Wigan And Leigh NHS
Foundation Trust : (RRF)
RRF00 : Wrightington, Wigan And Leigh NHS
Foundation Trust2,572 2,974 2,979 8,525 4%
Lancashire Teaching Hospitals NHS
Foundation Trust : (RXN)
RXN00 : Lancashire Teaching Hospitals NHS
Foundation Trust770 834 841 2,445 1%
Aintree University Hospital Trust :
(REM)REM00 : Aintree University Hospital 692 821 759 2,272 1%
70,230 75,610 62,241 208,081 96%
2,176 2,216 2,193 6,585 3%
649 664 710 2,023 1%
73,055 78,490 65,144 216,689
Main five total
All providers, nationwide
Grand total
Other North West Providers
Southport And Ormskirk Hospitals
Trust : (RVY)
Figure 4: The five main providers of urgent care, for the West Lancashire CCG, registered population, by total count of attendance, 2011/12 – 2013/14
Looking at the attendances by provider site and over time reveals that the activity recoded at the West Lancashire Health Care centre ceased being coded against site code NM1 after April 2013 and began being coded under RVY39 from June of that year. Additionally, we can see that no activity seems to have been recorded during May 2013 and that activity levels under the new code, are much lower than those before the change. This could also be an indication of a data quality issue and it is recommended that the local Commissioning Support Unit be asked to check these figures before any conclusions or assumptions can be made regarding the drop in attendances to this Walk-in Centre. The Ormskirk & District General Hospital saw a drop of activity after the introduction of the NHS 111 Service. However, this site also saw a similar drop in activity between December 2012 and January 2013 and a gradual increase in activity after August 2013. It is also interesting to note that the Skelmersdale Walk-in Centre saw a large increase in attendances between December 2011 and March 2012, after which point activity seems to have stabilised at a higher level.
Figure 5: The five main providers of urgent care, for the West Lancashire CCG, registered population, 2011/12 – 2013/14

Analysis of urgent care attendances by patients registered in the West Lancashire CCG footprint
5
WeekdayCount of
Attendances
% of
total
1: Mon 34,035 16.4%
2: Tue 31,087 14.9%
3: Wed 31,569 15.2%
4: Thu 30,105 14.5%
5: Fri 29,943 14.4%
6: Sat 25,658 12.3%
7: Sun 25,684 12.3%
Total 208,081
Time of attendance across the five main providers Combining the activity for all three years and looking at it by weekday (Figure 6), it seems that the weekend is the quietest period, accounting for just 25% of attendances whilst Monday was found to be the busiest day of the week accounting for 16% of all attendances.
Figure 6: The five main providers of urgent care, for the West Lancashire CCG, registered population, 2011/12 – 2013/14
Combining the days of the week with the actual attendance time reveals that 91% of activity occurred between 0700 hours and 2100 hours across the seven days of the week (Appendix B).
When grouping the activity by the type of Urgent Care Centre (Appendix C shows how the different sites are classified), it was found that the Walk in Centre and the Minor Injury A&E units are at their busiest between the hours of 0700 and 1100 after which time activity levels stabilise and gradually decline. Activity levels for the adult and specialist A&E units have remained consistently high between the hours of 0930 and 2230, with their quieter periods occurring during the early hours (Figure 7).
Figure 7: Urgent care activity at the five main providers of care, by attendance time (Monday - Sunday), for the West Lancashire CCG, registered population, 2011/12 – 2013/14
Repeating this analysis, but only looking at attendances occurring Monday to Friday (Figure 8) revealed an almost identical pattern, suggesting that the urgent care centres are at their busiest while other primary care and community care providers are open.

Analysis of urgent care attendances by patients registered in the West Lancashire CCG footprint
6
Count of
atts.
% of row
total
Count of
atts.
% of row
total
Count of
atts.
% of row
total
Count of
atts.
% of row
total
None (Consider Guidance/Advice Option) 3,784 5.69% 794 1.19% 2,094 3.15% 59,879 89.97% 66,551 32.05%
Guidance/Advice Only 16,847 33.77% 10,231 20.51% 20,543 41.18% 2,263 4.54% 49,884 23.97%
Medication Administered 7,071 41.34% 7,297 42.66% 2,555 14.94% 183 1.07% 17,106 8.21%
Prescription\Medicines Prepared To Take Away 2,805 17.11% 2,751 16.78% 10,732 65.47% 105 0.64% 16,393 7.86%
Top four only 30,507 20.35% 21,073 14.05% 35,924 23.96% 62,430 41.64% 149,934 72.09%
Others 24,618 42.34% 9,725 16.72% 23,257 40.00% 547 0.94% 58,147 27.91%
Grand Total 55,125 26.49% 30,798 14.80% 59,181 28.44% 62,977 30.27% 208,081 100%
Treatment
Total
count of
atts.
% of
grand
total
Main Adult A&E Specialist A&E (inc Minor injury A&E Walk in Centre
Figure 8: Urgent care activity at the five main providers of care, by attendance time (Monday - Friday), for the West Lancashire CCG registered population, 2011/12 – 2013/14
Reasons for attending
It was found that 50% (106,004) of the attendances, at the five main providers (Figure 4) had a diagnosis of either diagnosis not classifiable (89,384 │43%) or that field had been left blank or coded with an unidentified code (15,620│8%) [Appendix D
provides a full list of the diagnosis codes used]. Looking at the treatment codes used, the top four codes, in terms of total count of attendances, had accounted for 72% (149,934) of all attendances over the period examined (Figure 9). Figure 9: Top four treatment codes used by the five main providers, split by urgent care centre type, 2011/12 – 2013/14
The Outcomes Looking at the attendance outcomes, 38% (79,834) of attendances resulted in the patient being discharged without requiring any follow up treatment and of these 20% (41,380) had attended either a Walk-in Centre or Minor Injury Unit. This suggests that the majority of those patients had attended the most appropriate Urgent Care Centre for them. However, this means that the other 18% (38,454) of these attendances had occurred at the main adult A&E or the specialist A&E units. Examining these attendances further, 49% (39,457) of patients who were discharged without requiring any follow-up treatment, were aged between 0 and 24 and 65% had a treatment code of either None (37% │29,643) or Guidance/Advice only (28% │22,130). Incidentally, only 11% (22,647) of attendances resulted in the patient being admitted into the hospital of the urgent care centre.

Analysis of urgent care attendances by patients registered in the West Lancashire CCG footprint
7
Count of
atts.
% of row
total
Count of
atts.
% of row
total
Count of
atts.
% of row
total
Count of
atts.
% of row
total03: Discharged - did not require any follow up
treatment18,635 23.34% 19,819 24.83% 11,838 14.83% 29,542 37.00% 79,834 38.37%
02: Discharged - follow up treatment to be
provided by General Practitioner8,708 10.91% 2,263 2.83% 19,591 24.54% 19,378 24.27% 49,940 24.00%
14: Other 270 0.34% 423 0.53% 17,297 21.67% 12,119 15.18% 30,109 14.47%
01: Admitted to hospital bed/became a
LODGED PATIENT of the same Health Care
Provider
18,437 23.09% 4,210 5.27% - - - - 22,647 10.88%
04: Referred to A&E Clinic 533 0.67% 633 0.79% 5,628 7.05% 56 0.07% 6,850 3.29%
05: Referred to Fracture Clinic 2,289 2.87% 1,478 1.85% 1,072 1.34% 9 0.011% 4,848 2.33%
11: Referred to other health care professional 854 1.07% 746 0.93% 2,457 3.08% 414 0.52% 4,471 2.15%
12: Left Department before being treated 1,601 2.01% 256 0.32% 402 0.50% 883 1.11% 3,142 1.51%
06: Referred to other Out-Patient Clinic 2,407 3.02% 550 0.69% 93 0.12% 5 0.006% 3,055 1.47%
07: Transferred to other Health Care Provider 757 0.95% 407 0.51% 661 0.83% 492 0.62% 2,317 1.11%
13: Left Department having refused treatment 416 0.52% 12 0.02% 130 0.16% 78 0.10% 636 0.31%
10: Died in Department 193 0.24% 1 0.0013% 1 0.00% - - 195 0.09%
25 0.03% - - 11 0.01% 1 0.0013% 37 0.02%
Grand Total 55,125 69.05% 30,798 38.58% 59,181 74.13% 62,977 78.88% 208,081 100%
Main Adult A&E Specialist A&E (inc Minor injury A&E Walk in Centre Total
count of
atts.
% of
grand
total
Attendance outcome
No. of Attendances 1 2 3 4 5 6-10 11-15 16-20 21-30 31-40 41-50 51-60 61-80 81-100 100+ Total
Count of patients 61,213 18,846 9,042 4,916 2,701 4,201 731 225 109 33 10 9 7 2 2 102,047
% of total 60% 18% 9% 5% 3% 4% 1% 0.2% 0.1% 0.03% 0.01% 0.01% 0.01% 0.002% 0.002%
Figure 10: Attendance outcomes, of patients attending an urgent care centre at one of the five main providers, split by urgent care centre type, 2011/12 – 2013/14
The patients
The 208,081 attendances recorded over the three year period examined, were generated by 102,047 patients2, which works out at around two attendances for every one patient (2.04:1). However, things are never this straight forward and when examining the patient level data in more detail, it shows that around 40% (40,834) of the patients had two or more attendances to urgent care between 2011/12 and 2013/14 (Figure 10). 22% of patients had, had three or more attendances over this period with 20 (0.02%) patients having recorded over 50 attendances, with two patients having recorded over 100 attendances (Figure 11).
Figure 11: Multiple attendances to urgent care, 2011/12 – 2013/14 (The five main providers only)
Looking at the two patients who had over 100 attendances recoded, one was a male with multiple attendances relating to lacerations and the other was a female who had also had multiple attendances relating to lacerations. Although, impossible to confirm from this data, both cases suggest possible psychiatric conditions, however neither patient has this recorded as either a primary or secondary diagnosis. However, the majority of attendances, for both these patients, have an attendance disposal (outcome) code of 14: Other, which could suggest some kind of intervention has occurred. Concentrating on those patients that have recorded multiple urgent care attendances during the most recent financial period (Quarter 4 2013/14 - January – March 2014), thirteen patients were found to have recorded 10 or more attendances to urgent care during this three-month period, three of which recorded over 20 attendances. In total, these 13 patients have recorded 213 attendances in just three months, which works out as a ratio of around over 16 attendances each (16.38:1). An age, gender breakdown of these attendances revealed that with the exception of the early ages (0-14) more women than men seem to be attending urgent care and that 15% of all patients attending urgent care, between 2011/12 and 2013/14, are aged between 15-24.
2 Based on a count of the total number of pseudonymised NHS numbers and excluding 32 attendances with no recorded NHS number

Analysis of urgent care attendances by patients registered in the West Lancashire CCG footprint
8
Practice NameMain Adult
A&E
% of
column
total
Specialist
A&E (inc
Paed)
% of
column
total
Minor
injury A&E
% of
column
total
Walk in
Centre
% of
column
total
Grand
Total
% of
column
total
P81112 : Dr S Biswas & Partners 5,832 11% 3,945 13% 6,266 11% 10,908 17% 26,951 13%
P81208 : Dr S K Sur & Partners 4,425 8% 3,525 11% 2,911 5% 12,780 20% 23,641 11%
P81014 : Ormskirk Medical Practice 4,040 7% 2,293 7% 7,111 12% 583 1% 14,027 7%
P81201 : Ashurst Primary Care 2,507 5% 2,002 7% 2,055 4% 7,390 12% 13,954 7%
P81084 : Hall Green Surgery 3,834 7% 1,208 4% 1,432 2% 7,328 12% 13,802 7%
P81039 : Manor Primary Care 2,661 5% 2,160 7% 1,940 3% 6,255 10% 13,016 6%
P81045 : The Elms 2,829 5% 1,600 5% 7,634 13% 422 1% 12,485 6%
P81041 : Parkgate Surgery 2,699 5% 1,537 5% 5,631 10% 647 1% 10,514 5%
Top 8 only 28,827 52% 18,270 60% 34,980 61% 46,313 74% 128,390 62%
P81695 : Aughton Surgery 2,240 4% 1,644 5% 4,081 7% 261 0% 8,226 4%
P81096 : Parbold Surgery 3,081 6% 1,116 4% 1,709 3% 1,814 3% 7,720 4%
P81646 : Lathom House Surgery 2,241 4% 1,346 4% 3,404 6% 481 1% 7,472 4%
P81710 : Tarleton Group Practice 4,270 8% 1,461 5% 1,372 2% 200 0% 7,303 4%
P81674 : Stanley Court Surgery 2,275 4% 1,434 5% 2,832 5% 646 1% 7,187 3%
P81136 : Dr A K Bisarya & Partner 1,268 2% 833 3% 1,529 3% 3,210 5% 6,840 3%
P81774 : Dr A D Littler 1,119 2% 553 2% 1,302 2% 2,743 4% 5,717 3%
P81121 : Dr J L Jain 973 2% 697 2% 678 1% 3,060 5% 5,408 3%
P81764 : Dr J S Modha 1,081 2% 785 3% 1,096 2% 1,918 3% 4,880 2%
P81727 : The County Road Surgery 1,241 2% 660 2% 1,955 3% 291 0.5% 4,147 2%
P81138 : Burscough Family Practice 1,248 2% 586 2% 1,710 3% 392 1% 3,936 2%
P81758 : Matthew Ryder Clinic 1,404 3% 376 1% 351 1% 1,391 2% 3,522 2%
P81772 : North Meols Medical Centre 2,146 4% 444 1% 269 0% 66 0.1% 2,925 1%
P81177 : Dr V Gulati & Dr M J Hindle 1,596 3% 481 2% 389 1% 50 0.1% 2,516 1%
Grand Total 55,010 100% 30,686 100% 57,657 100% 62,836 100% 206,189 100%
Figure 12: Age, Gender breakdown of urgent care attendances with the five main providers, 2011/12 – 2013/14
Age band Female% of row
totalMale
% of row
total
Not
Known/Not
Specified
% of row
total
Grand
Total
% of grand
total
0-4 10,481 45% 13,000 55% 4 0.02% 23,485 11%
05-14 11,067 48% 12,197 52% 2 0.009% 23,266 11%
15-24 17,665 57% 13,123 43% - - 30,788 15%
25-34 11,568 54% 9,775 46% 1 0.00% 21,344 10%
35-44 11,664 54% 10,074 46% - - 21,738 10%
45-54 12,703 52% 11,889 48% 1 0.004% 24,593 12%
55-64 10,320 51% 9,868 49% 1 0.005% 20,189 10%
65-74 9,821 50% 9,808 50% - - 19,629 9%
75+ 13,518 59% 9,527 41% 4 0.02% 23,049 11%
Grand Total 108,807 52% 99,261 48% 13 0.01% 208,081 100%
Practice level analysis Further to the data cleaning process undertaken the beginning of this project (page 1) for this section of the report we have also removed attendances by patients registered to the now closed practices of P81767-Dr Bb Singh and Y02903-West Lancashire Health Centre. This was done due to lack of clarity regarding where the patients transferred to after the practices closed. Leaving 206,189 attendances split up over 22 practices, for the three year financial period 2011/12 – 2013/14.
Breaking the activity down by practice revealed that the patients from just eight practiced accounted for 62% (128,390) of all attendances (figure 13)
Figure 13: Practice level breakdown of urgent care attendances, with the five main providers of care 2011/12 – 2013/14
Figure 14, presents a graphical interpretation of this data, showing how the use of the different kinds of urgent care varies between practices. The biggest influence on this pattern will be where the patient was, when they required urgent care and that location's proximity to an Urgent Care Centre.

Analysis of urgent care attendances by patients registered in the West Lancashire CCG footprint
9
Figure 14: Urgent care attendances by practice, broken down by urgent care type, with the five main providers - 2011/12-2013/14
Figure 15 provides a Crude Attendance Rate per 1000 population between the practices, of attendances recorded for the financial year 2013/14, with their assigned taxonomy groupings (Appendix F) to provide us with a fair comparison. From this, it was found that the CCG had an average Crude Attendance Rate of 558.39 per 1000 with nine practices recording a rate above this average. The majority of the practices, that recorded the higher rates, were classed in either triangle or oval taxonomy groups. These two classifications represent practices with higher levels of deprivation, than the average, with the triangle grouping representing practices with a higher percentage of children than average and the oval grouping representing practices that tend to have higher levels of older people3 (Figure 15).
Figure 15: Urgent care attendances at the five main providers, by practice and taxonomy group
3 Note of caution, these classifications were published in 2011, however a sense check of the latest practice populations found that 39% of
persons registered to triangle practices in this CCG were under the age of 15 and 22% of persons registered to oval practices were 65 or over.

Analysis of urgent care attendances by patients registered in the West Lancashire CCG footprint
10
(Blank)% of row
total1
% of row
total2
% of row
total3
% of row
total4
% of row
total5
% of row
total
Walk in Centre 60 0% 33,781 54% 13,004 21% 4,299 7% 7,240 11% 4,593 7% 62,977 30%
Minor injury A&E 77 0% 9,709 16% 11,092 19% 13,380 23% 13,049 22% 11,874 20% 59,181 28%
Main Adult A&E 286 1% 12,699 23% 12,069 22% 10,131 18% 10,237 19% 9,703 18% 55,125 26%
Specialist A&E (inc Paed) 59 0% 9,968 32% 6,150 20% 5,046 16% 5,030 16% 4,545 15% 30,798 15%
Grand Total 482 0% 66,157 32% 42,315 20% 32,856 16% 35,556 17% 30,715 15% 208,081 100%
Unit type
National Quintile (1 = Most Deprived Quintile)Grand
Total
% of Grand
total
-% of row
total1
% of row
total2
% of row
total3
% of row
total4
% of row
total5
% of row
total
Grand
Total
RVY30 : The Skelmersdale Walk In Centre 60 0.1% 33,781 54% 13,004 21% 4,299 7% 7,240 11% 4,593 7% 62,977
NM1 : West Lancashire Health Care 71 0.1% 8,006 16% 9,282 19% 10,755 22% 10,689 22% 9,795 20% 48,598
RVY01 : Southport & Formby District General Hospital 194 0.5% 9,582 23% 9,801 23% 8,174 20% 7,244 17% 6,888 16% 41,883
RVY02 : Ormskirk & District General Hospital 59 0.2% 9,969 32% 6,151 20% 5,046 16% 5,030 16% 4,546 15% 30,801
RVY39 : West Lancs Health Centre 6 0.1% 1,702 16% 1,809 17% 2,625 25% 2,360 22% 2,078 20% 10,580
RRF00 : Wrightington, Wigan And Leigh NHS Foundation Trust 18 0.2% 2,406 28% 1,565 18% 1,114 13% 2,062 24% 1,360 16% 8,525
RXN00 : Lancashire Teaching Hospitals NHS Foundation Trust 58 2% 170 7% 278 11% 345 14% 548 22% 1,046 43% 2,445
REM00 : Aintree University Hospital 16 1% 541 24% 425 19% 498 22% 383 17% 409 18% 2,272
Grand Total 482 0.2% 66,157 32% 42,315 20% 32,856 16% 35,556 17% 30,715 15% 208,081
National Quintile (1 = Most Deprived Quintile)
Site
LSOA level analysis
LSOA level data allows us to analyse where the patients have come from and brings in the latest deprivation4 scores to get more of an understanding of the patients behind the attendances, based on their home postcode. Additionally, for this analysis, it includes the activity coded to the P81767-Dr Bb Singh and Y02903-West Lancashire Health Centre practices, which had been removed for the previous section. The findings in Figure 16 suggest that 54% (33,781) of patients who had attended the Walk-in Centre in Skelmersdale were from LSOAs classed in Quintile 1, which contains those LSOAs with the highest deprivation scores. This could be due to convenience and proximity to the centre, with the most deprived LSOAs in the West Lancashire district falling within the Skelmerdale area (Appendix G).
Figure 16: Deprivation quintile (based on patient address) breakdown of urgent care attendances with the five main providers, 2011/12 – 2013/14, split by unit type
Figure 17, replicates the above table, replacing the unit type field with the Site description, to give more of an idea where the attendances are occurring.
Figure 17: Deprivation quintile (based on patient address) breakdown of urgent care attendances with the five main providers, 2011/12 – 2013/14, split by Site description
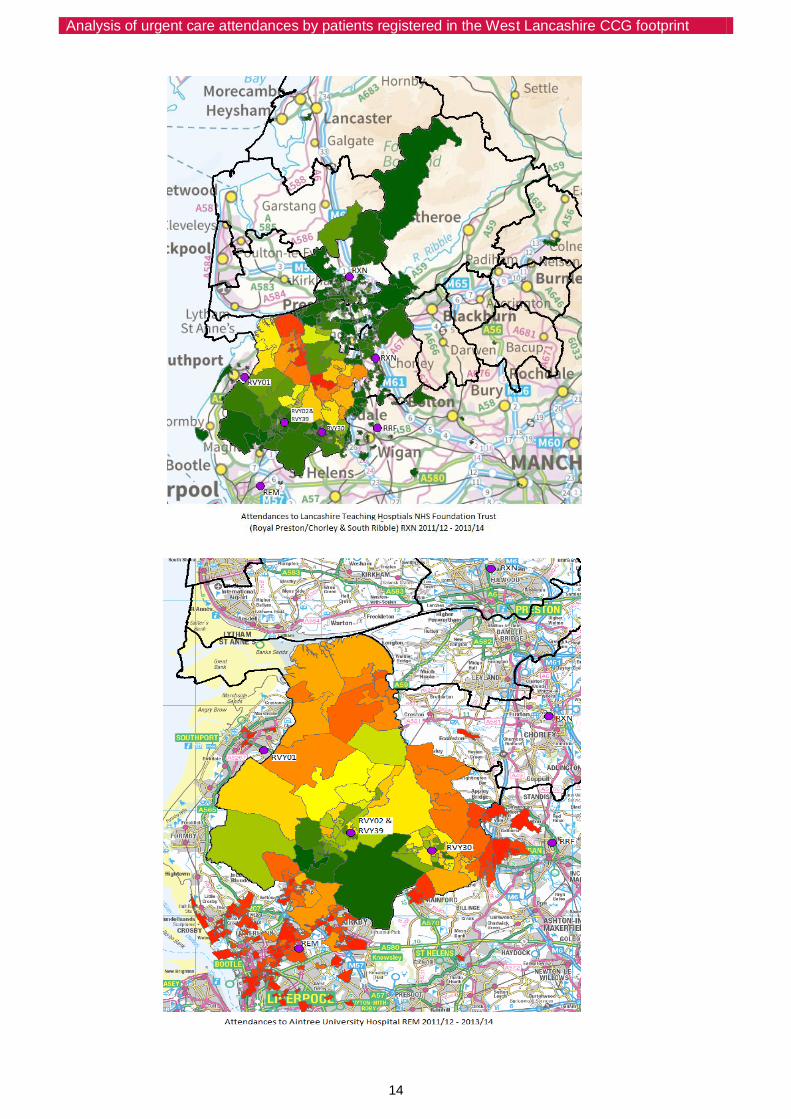
Using the LSOA details to map the attendances for the full three year period examined, there is a clearer picture of not just the patients living within West Lancashire but also those living outside of the district, who perhaps travel into West Lancashire for reasons such as work and education but registered with West Lancashire GPs for convenience. However, for those cases where activity was found to originate from patients living in areas such as Manchester, Liverpool, Leeds, Derby and Cambridge, it may be of value to the CCG, to obtain further understanding of the methodology used by the Commissioning Support Unit (CSU) to extract this data set and also what systems are in place to ensure that only the correct patients are coming through the commissioning data sets. When looking at differences between where the patients came from and which site they attended, it is important to bear in the mind that the LSOAs are based where the patients' live and not where they were when they required urgent care. However, if we assume that the majority of patients were at home when they required urgent care, then the maps below suggest that not all patients are using the most convenient centre for them. Figure 18, provides a series of maps, detailing the home LSOAs of the West Lancashire registered patients, who have attended urgent care, with each of the five main providers between 2011/12 and 2013/14.
4 English indices of deprivation (IMD) 2010 (https://www.gov.uk/government/publications/english-indices-of-deprivation-2010)

Analysis of urgent care attendances by patients registered in the West Lancashire CCG footprint
11
Figure 18 : Choropleth (thematic) map of urgent care attendances by Site and LSOAs, colour coded by number of attendances (Red equals the LSOAs where the most attendances originated from, based on the patient's home address, dark
green indicates those LSOAs were the least attendances originated)

Analysis of urgent care attendances by patients registered in the West Lancashire CCG footprint
12

Analysis of urgent care attendances by patients registered in the West Lancashire CCG footprint
13
Analysis of urgent care attendances by patients registered in the West Lancashire CCG footprint
14

Analysis of urgent care attendances by patients registered in the West Lancashire CCG footprint
15
Next steps
Identify the 13 patients, who incurred 213 attendances to urgent care during the first three months of 2014
Establish what systems are in place to identify patients with multiple attendances to A&E within a short time period
Establish what data cleansing processes are in place at the CSU
Discuss why some patients are not attending the most appropriate Urgent Care Centre for them
Discuss if more could be done to provide additional health care within primary and community settings during the hours 0700 to 2100 to reduce the need for urgent care
Meet with secondary care providers to discuss ways of improving coding practices for urgent care providers

Analysis of urgent care attendances by patients registered in the West Lancashire CCG footprint
1
providerMain Adult
A&E
Specialist
A&E (inc
Paed)
Minor
injury A&E
Walk in
Centre-
Grand
Total% of total
Southport and Ormskirk Hospital NHS Trust (RVY) 41,883 30,798 10,583 62,977 146,241 68%
West Lancashire Health Centre : (NM1) 48,598 48,598 23%
Wrightington, Wigan And Leigh NHS Foundation Trust : (RRF) 8,525 8,525 4%
Lancashire Teaching Hospitals NHS Foundation Trust : (RXN) 2,445 2,445 1%
Aintree University Hospital NHS Foundation Trust : (REM) 2,272 2,272 1%
Royal Liverpool and Broadgreen University Hospitals NHS Trust : (RQ6) 826 694 1,520 1%
Alder Hey Children's NHS Foundation Trust : (RBS) 1,015 1,015 0.5%
St Helens and Knowsley Teaching Hospitals NHS Trust : (RBN) 816 64 880 0.4%
Bridgewater Community Healthcare NHS Trust : (RY2) 1 16 372 389 0.2%
Central Manchester University Hospitals NHS Foundation Trust : (RW3) 258 65 7 3 333 0.2%
5 Boroughs Partnership NHS Foundation Trust : (RTV) 328 328 0.2%
Warrington And Halton Hospitals NHS Foundation Trust : (RWW) 220 21 241 0.1%
University Hospitals Of Morecambe Bay NHS Trust : (RTX) 187 35 222 0.1%
East Lancashire Hospitals NHS Trust : (RXR) 147 56 203 0.1%
Ashton, Leigh and Wigan PCT : (5HG) 178 178 0.1%
Pennine Acute Hospitals NHS Trust : (RW6) 114 32 10 156 0.1%
Royal Bolton Hospital NHS Foundation Trust : (RMC) 86 38 124 0.1%
University Hospital Of South Manchester NHS Foundation Trust : (RM2) 115 115 0.1%
Salford Royal NHS Foundation Trust : (RM3) 113 113 0.1%
Wirral University Teaching Hospital NHS Foundation Trust : (RBL) 109 109 0.1%
Blackpool, Fylde And Wyre Hospitals NHS Foundation Trust : (RXL) 108 108 0.1%
Liverpool Women's NHS Foundation Trust : (REP) 107 107 0.05%
Liverpool Community Health Nhs Trust : (RY1) 101 101 0.05%
North Cumbria University Hospitals NHS Trust : (RNL) 73 73 0.03%
Cumbria Partnership NHS Foundation Trust: (RNN) 67 67 0.03%
Countess Of Chester Hospital NHS Foundation Trust : (RJR) 56 56 0.03%
Mid Cheshire Hospitals NHS Foundation Trust : (RBT) 31 10 41 0.02%
Airedale NHS Foundation Trust: (RCF) 31 31 0.01%
Stockport NHS Foundation Trust : (RWJ) 31 31 0.01%
Tameside Hospital NHS Foundation Trust : (RMP) 26 26 0.01%
East Cheshire NHS Foundation Trust : (RJN) 18 18 0.01%
Grand Total 59,684 31,664 59,454 63,791 73 214,666 100%
Appendix A: North West Providers of urgent care to the registered patients of the West Lancashire CCG, 2011/12 – 2013/14

Analysis of urgent care attendances by patients registered in the West Lancashire CCG footprint
1
Type Site description Total Atts.
RVY01 : Southport & Formby District General Hospital 41,883
RRF00 : Wrightington, Wigan And Leigh NHS Foundation Trust 8,525
RXN00 : Lancashire Teaching Hospitals NHS Foundation Trust 2,445REM00 : Aintree University Hospital 2,272
Specialist A&E (inc Paed) RVY02 : Ormskirk & District General Hospital 30,798
RVY39 / NM1 : West Lancs Health Centre 59,178
RVY02 : Ormskirk & District General Hospital 3
Walk in Centre RVY30 : The Skelmersdale Walk In Centre 62,977
208,081
Main Adult A&E
Grand total
Minor injury A&E
Appendix B: Urgent care activity, at the five main providers of care, by attendance time and week day, 2011/12 – 2013/14
Appendix C: Hospital Sites, of the five main providers by unit type, 2011/12 – 2013/14

Analysis of urgent care attendances by patients registered in the West Lancashire CCG footprint
1
Diagnosis simplified Count of Atts. % of Total
Diagnosis not classifiable 89,384 42.96%
Blank/Other/Unknown 15,620 7.51%
Laceration 13,660 6.56%
Soft tissue inflammation 10,680 5.13%
Respiratory conditions 9,788 4.70%
Sprain/ligament injury 7,494 3.60%
Dislocation/fracture/joint
injury/amputation7,091 3.41%
Gastrointestinal conditions 6,207 2.98%
Ent conditions 6,007 2.89%
Urological conditions (including
cystitis) 4,085 1.96%
Local infection 3,883 1.87%
Contusion/abrasion 3,636 1.75%
Head injury 3,397 1.63%
Muscle/tendon injury 3,384 1.63%
Ophthalmological conditions 2,874 1.38%
Dermatological conditions 2,537 1.22%
Cardiac conditions 2,519 1.21%
Nothing abnormal detected 2,033 0.98%
Burns and scalds 1,501 0.72%
Bites/stings 1,445 0.69%
Central nervous system conditions
(excluding strokes)1,424 0.68%
Other vascular conditions 1,381 0.66%
Infectious disease 1,166 0.56%
Foreign body 1,047 0.50%
Psychiatric conditions 1,005 0.48%
Poisoning (including overdose) 886 0.43%
Allergy (including anaphylaxis) 838 0.40%
Gynaecological conditions 814 0.39%
Cerebro-vascular conditions 678 0.33%
Facio-maxillary conditions 338 0.16%
Septicaemia 326 0.16%
Social problem (includes chronic
alcoholism and homelessness259 0.12%
Haematological conditions 250 0.12%
Diabetes and other endocrinological
conditions180 0.09%
Obstetric conditions 108 0.05%
Nerve injury 102 0.05%
Vascular injury 37 0.02%
Electric shock 16 0.01%
Visceral injury 1 0.0005%
Grand Total 208,081 100%
Appendix D: Breakdown of diagnosis codes used, against the attendances to the five main providers of care, 2011/12 – 2013/14
Analysis of urgent care attendances by patients registered in the West Lancashire CCG footprint
2
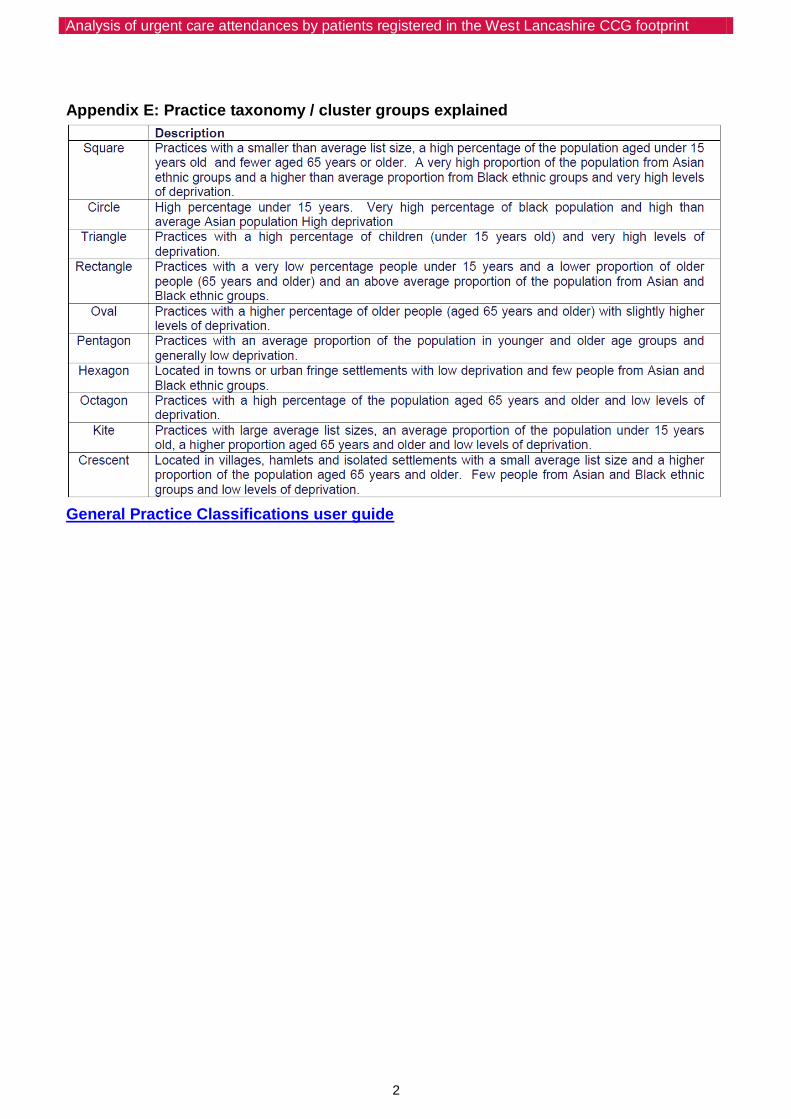
Appendix E: Practice taxonomy / cluster groups explained
General Practice Classifications user guide

Analysis of urgent care attendances by patients registered in the West Lancashire CCG footprint
3
Appendix G: Map of West Lancashire district LSOAs, with colour coded deprivation (IMD2010) scores (Dark green least deprived, Red most deprived) including the main urgent care sites