population-based analysis of urgent care … analysis of urgent care attendances in children and...
TRANSCRIPT

Population-based analysis of urgent care attendances in children and young people in West Lancashire
Author: Dr Angela Tucker, Public Health Registrar
Contributors: Simon Collins, Public Health Analyst
Karen Thompson, Consultant in Public Health
Christine Graham, Public Health Analyst
Farhat Abbas, Public Health Analyst
Date: 3
rd December 2014
Population-based analysis of urgent care attendances in children and young people in West Lancashire
1
Contents Introduction ................................................................................................................................... 2
Background .................................................................................................................................... 3
Descriptive data analysis ................................................................................................................ 5
Person ................................................................................................................................................ 5 Age .................................................................................................................................................................................. 5 Gender ............................................................................................................................................................................ 2 Deprivation ..................................................................................................................................................................... 2 Diagnoses and outcomes ................................................................................................................................................ 2 Repeat attenders ............................................................................................................................................................ 3
Time .................................................................................................................................................. 5 Attendances by year ....................................................................................................................................................... 5 Attendances by month .................................................................................................................................................... 5 Attendances by time of day and day of the week .......................................................................................................... 6
Place .................................................................................................................................................. 9 Service location ............................................................................................................................................................... 9 Type of urgent care ......................................................................................................................................................... 9 Comparison of urgent care attendances by GP practice .............................................................................................. 10
Discussion .................................................................................................................................... 18
Summary of findings .......................................................................................................................... 18
Strengths and limitations ................................................................................................................... 19
Effectiveness of interventions on reducing A&E attendances............................................................... 19 Asthma .......................................................................................................................................................................... 19 Unintentional injuries ................................................................................................................................................... 20 Self-harm ....................................................................................................................................................................... 20 Generic evidence .......................................................................................................................................................... 20
Recommendations ............................................................................................................................. 21
Further work ..................................................................................................................................... 22
Appendix: Number and percentage of attendances by North West provider .................................. 23

Population-based analysis of urgent care attendances in children and young people in West Lancashire
2
Introduction This report explores urgent care attendances in children and young people under the age of 25 in West Lancashire. The work takes a population perspective looking at attendances in all children and young people registered with a West Lancashire CCG Practice. Aim: To provide a detailed insight into urgent care attendances in children and young people under the age of 25 years in West Lancashire. Objectives:
Perform a descriptive epidemiological analysis of urgent care attendance data in under
25s in West Lancashire over the 3 year period 2011/12-2013/14
Undertake a brief literature review on the effectiveness of interventions to reduce
urgent care attendances
Make recommendations regarding approaches to reducing need and demand for
urgent care services in this age group
Make recommendations for further work to address the questions raised by the
analysis

Population-based analysis of urgent care attendances in children and young people in West Lancashire
3
Background Demand on urgent care continues to increase placing pressure on the capacity of urgent care and on financial resources. Over 20 million people visited urgent care centres in England in 2012/13, a 32% increase in the past decade.1 Alternative urgent care services such as walk in centres and minor injury units introduced in 2004 accounted for almost all of this increase and did not result in a reduction in Accident and Emergency department attendances (figure 1). This could reflect a previously unmet need or it may be indicative of supply-induced demand secondary to the availability of new services.
Figure 1 Numbers of unplanned urgent care attendances in England 1987/88-2012/13
Source: NHS England
2
Benchmarking of A&E attendances in children in West Lancashire with the national average demonstrates that West Lancashire has significantly higher rates, in particular in the 0-4 age group (figure 2).
1 NICE Press Release. Available at: http://www.nice.org.uk/news/press-and-media/nice-consults-on-plans-to-
develop-new-guideline-for-people-in-need-of-emergency-care [accessed 26th Novemner 2014] 2 NHS England. Transforming urgent and emergency care services in England. Available at:
http://www.nhs.uk/NHSEngland/keogh-review/Documents/UECR.Ph1Report.Appendix%201.EvBase.FV.pdf [accessed 26
th November 2014]

Population-based analysis of urgent care attendances in children and young people in West Lancashire
4
Figure 2
Data source: National General Practice Profiles
3
This discrepancy between West Lancashire and the national average prompted the need to perform an up to date in depth analysis of urgent care attendances in West Lancashire children and young people up to the age of 25 in order to gain a clearer picture of the use of urgent care services in the area.
3 Public Health England general practice profiles:http://fingertips.phe.org.uk/profile/general-practice

Population-based analysis of urgent care attendances in children and young people in West Lancashire
5
Descriptive data analysis Data on all urgent care attendances in patients registered with a West Lancashire GP over the 3 year period (2011/12-2013/14) was obtained from the Secondary Uses Service (SUS). Data specifically for the under 25s was extracted from this larger dataset. A descriptive epidemiological analysis was performed and structured in the format person, time and place. “Urgent care” centres included major and single specialty A&E departments, minor injury units and walk-in centres.
Person The first section of the analysis looks at under 25’s urgent care attendances by person: age, sex, deprivation, diagnoses and outcomes and repeat attendances.
Age The 15-24 age group account for the highest proportion of urgent care attendances in the under 25's (41%) (figure 3). However, this would be expected since this age group accounts for the largest proportion of the registered population (44%). The 0-4 group only represents 18% of the population but accounts for 30% of attendances and conversely, the 5-14 age group represents 38% of the population but only accounts for 30% of attendances. Figure 3 Pie charts comparing proportions of attendances by age group with proportions of registered
patients by age group

Population-based analysis of urgent care attendances in children and young people in West Lancashire
2
Gender Overall, the numbers of male and female attendances are similar, however differences between males and females are evident when the data are observed by age group. There are higher proportions of male attendances in age groups <1, 1-4 and 5-14 and a higher proportion of female attendances in the 15-24 age group. The largest difference is for the 15-24 age group in which 57% of attendances are for females (table 1).
Table 1 Attendances by age group and gender
Age group Total attendances % Female % Male
<1 year 6302 44.73% 55.27%
1-4 years 17980 44.50% 55.50%
5-14 years 24234 47.34% 52.66%
15-24 years 33138 57.06% 42.94%
Total 81654* 50.46% 49.54% *36 attendances unknown/unspecified gender not included in analysis
Deprivation Patients residing in Index of Multiple Deprivation (IMD) quintile 1 (the most deprived 20% nationally) account for nearly 40% of total attendances whereas patients residing in quintile 5 (the least deprived 20% nationally) account for less than 15% of total attendances (figure 4). This relationship between patient area-level deprivation and urgent care attendance is consistent with that seen for GP practice-level deprivation and attendance (see figure 18). Higher levels of deprivation are associated with higher levels of urgent care attendances.
Figure 4

Population-based analysis of urgent care attendances in children and young people in West Lancashire
2
Diagnoses and outcomes Table 2 displays the top 6 recorded diagnostic categories by age group. There is a clear distinction between the under 5's, in whom the most common diagnoses were respiratory and gastrointestinal, and the over 5's in whom injuries were more prominent. Head injury was however more common in the under 5’s. A large proportion of attendances (40%) are coded as “diagnosis not classifiable”. The reason for this is not clear. Potential explanations include the difficulties of making a specific diagnosis during a short A&E visit, particularly if the presenting symptoms are non-specific, or that the current coding system does not reflect the physicians’ written diagnoses well. The effect of this is significant inaccuracy in the percentage of attendances in each diagnostic category. For example 21% of attendances in the under 1’s are respiratory conditions. Given the number of “not classifiable” attendances this is likely to be an underestimate, the extent of which is not known.
Table 2 Diagnostic category by age group
Table 3 summarises attendance outcomes by age group. The proportion of attendances admitted to hospital was highest in the infants (< 1 year) with 24% of those attending being admitted, followed by the 1-4 age group in which 10% of those who attended were admitted. The under 5's together accounted for 51% of all the under 24's admissions to hospital over the 3 years. Overall 51% of patients were discharged with no follow-up. Differences between males and females were pronounced for referrals to fracture clinic with males accounting for 64% of these. Notable gender differences were also evident for discharged with follow up by GP where females accounted for 56% of this group. Referrals to fracture clinic were most common in children aged 12 years (199 referrals over the 3 years). Ages 10-15 together account for 43% of all the fracture clinic referrals and the lowest numbers occurred in the under 5's.
<1
1-4
5-14
15-24
Diagnosis not classifiable 37% Diagnosis not classifiable 37% Diagnosis not classifiable 39% Diagnosis not classifiable 43%
Respiratory conditions 21% Respiratory conditions 17% Soft tissue inflammation 8% Other/unknown 9%
Gastrointestinal conditions 11% Ent conditions 8% Sprain/ligament injury 6% Soft tissue inflammation 5%
Dermatological conditions 6%
Gastrointestinal conditions 5%
Dislocation/fracture/joint injury/amputation 6% Laceration 5%
Ent conditions 4% Head injury 4% Ent conditions 5% Sprain/ligament injury 5%
Head injury 3% Dermatological conditions 4% Respiratory conditions 5%
Dislocation/fracture/joint injury/amputation 4%

Population-based analysis of urgent care attendances in children and young people in West Lancashire
3
Table 3 Outcome by age group
Outcome 0-1 1-4 5-14 15-24 Total
Discharged - did not require any follow up treatment 52% 59% 58% 41% 51%
Discharged - follow up treatment to be provided by General Practitioner 12% 14% 13% 25% 18%
Other 6% 9% 10% 16% 12%
Admitted to hospital 24% 10% 6% 5% 8%
Referred to Fracture Clinic 0% 1% 5% 3% 3%
Referred to other health care professional 2% 2% 2% 3% 2%
Referred to A&E Clinic 1% 1% 2% 3% 2%
Left Department before being treated 1% 1% 1% 2% 2%
Referred to other Out-Patient Clinic 1% 1% 2% 1% 1%
Transferred to other Health Care Provider 1% 1% 2% 1% 1%
Left Department having refused treatment 0% 0% 0% 0% 0%
Died in Department 0% 0% 0% 0% 0%
Repeat attenders Over the 3 years there were 81,637 attendances generated by 39,306 patients (based on counts of patient unique identifiers and excluding 53 attendances with no patient id); an average of 2.08 attendances per patient over the 3 year period. The number of attendances per patient ranged from 1 to 141 over the 3 year period with a median of 1 attendance. 57% of patients attended once, 20% twice and 10% 3 times over the 3 year period. 5.3% of patients attended more than 5 times over the 3 years and this small group of patients accounted for 17,921 attendances or 22% of total attendances.
For the purpose of this report, “repeat attenders” will be classified as those patients who attended more than 5 times over the 3 years. Using this definition, repeat attenders account for the highest proportion of attendances in the 0-4 age group where they account for 29% of all attendances (table 4). In the 15-19 age group repeat attenders account for 15.5% of all attendances and in the 15-24 age group they account for 21.6% of all attendances.
Table 4 Proportion of all attendances in each age group accounted for by repeat attenders
0-4 5-19 15-24 All
Number of repeat attenders 918 621 815 2098
Number of attendances in repeat attenders 6993 3753 7175 17921
Total attendances in age group 24306 24236 33148 81690
% of total attendances accounted for by repeat attenders 28.8 15.5 21.6 21.9 The main diagnoses were examined for repeat attenders alone and did not differ significantly from those described for all attendances (table 5). One difference to note was that laceration was the top diagnosis for repeat attenders in the 15-24 age-group (after diagnosis not classifiable). This may be related to this age group being more prone to repeated injury, for example sport-related injuries. On the other hand it could be an indicator of self-harm, a

Population-based analysis of urgent care attendances in children and young people in West Lancashire
4
condition with a high risk of re-attendance. However, only speculative explanations can be made based on the available data.
Table 5 Top 6 diagnostic categories by age group in repeat attenders
0-1 1-4 5-14 15-24
Diagnosis not classifiable 30%
Diagnosis not classifiable 35%
Diagnosis not classifiable 43%
Diagnosis not classifiable 59%
Resp 25% Resp 23% Resp 8% Laceration 7%
GI 14% ENT 9% Soft tissue inflammation 8% Other/unknown 4%
Derm 5% GI 5% Sprain/ligament injury 7% Soft tissue inflammation 3%
Ent 5% Derm 4% Dislocation/fracture/joint injury/amputation 5% Local infection 3%
Contusion/abrasion 3% Head injury 4% ENT 4% ENT 3%
The gender differences described earlier are accentuated when repeat attenders are examined separately. Amongst repeat attenders, males account for 60% of attendances in the under 5’s and females account for 66% of attendances in the 15-24 age group. Possible explanations for these differences include a higher risk of physical injury in young males and obstetric/gynaecological conditions, psychiatric conditions and being more willing to seek help in females age 15-24.
Table 6 Gender differences in repeat attenders compared to all attenders
Repeat attendances All attendances
Age Total attendances Female Male Total attendances Female Male
<1 1747 40.07 59.93 6302 44.73% 55.27%
1-4 5246 40.70 59.30 17980 44.50% 55.50%
5-14 3753 50.07 49.93 24234 47.34% 52.66%
15-24 7175 66.31 33.69 33138 57.06% 42.94%
Total 17921 52.85 47.15 81654* 50.46% 49.54% *36 attendances unknown/unspecified gender not included in analysis

Population-based analysis of urgent care attendances in children and young people in West Lancashire
5
Time The second part of the analysis looks at under 25’s urgent care attendances by time: year, month, day of week and time of day.
Attendances by year Attendances increased slightly from 2011/12-2012/13 but then decreased noticeably in 2013/14 for all age groups (figure 5). 2013/14 saw a mild winter which may have had an effect on overall attendances that year.
Figure 5
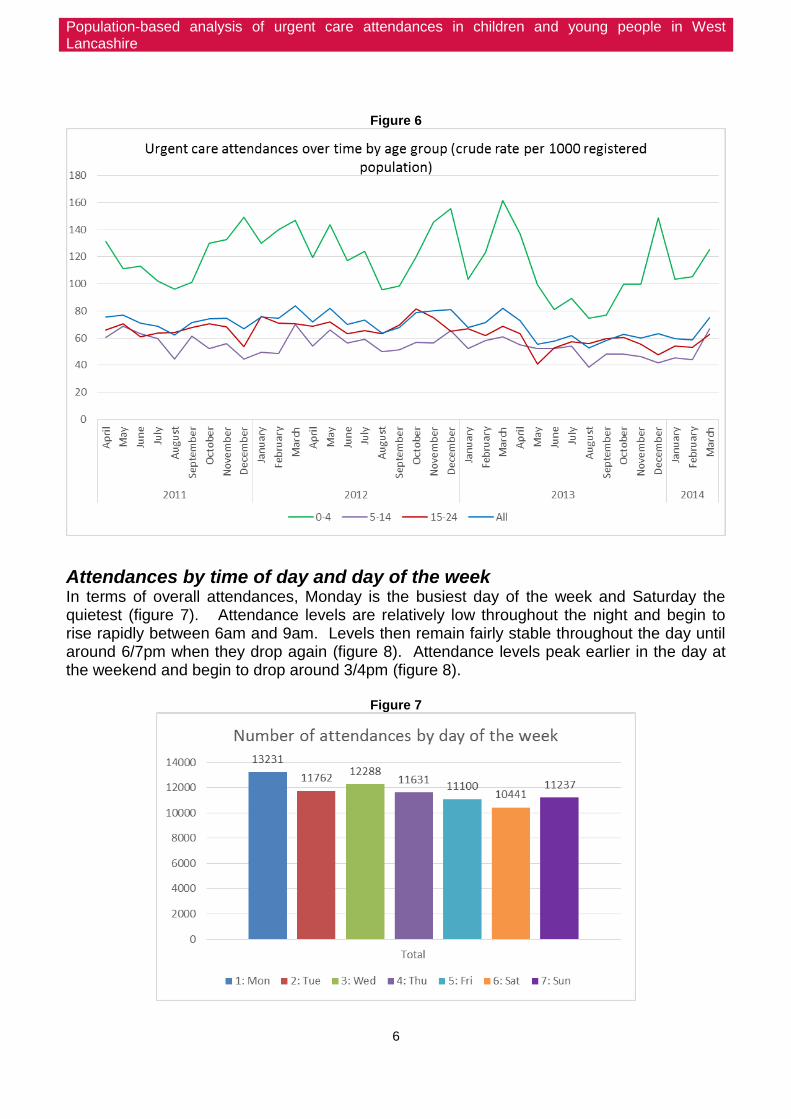
Attendances by month Figure 6 shows crude attendance rates by age group and month throughout the 3 year period. The graph clearly shows the highest rates of attendances are in the 0-4 age group and the lowest in the 5-14 group. Winter peaks and summer dips in attendances are evident for the 0-4 age group which may reflect the susceptibility of young children to respiratory infections such as bronchiolitis during the winter months.
Population-based analysis of urgent care attendances in children and young people in West Lancashire
6
Figure 6
Attendances by time of day and day of the week In terms of overall attendances, Monday is the busiest day of the week and Saturday the quietest (figure 7). Attendance levels are relatively low throughout the night and begin to rise rapidly between 6am and 9am. Levels then remain fairly stable throughout the day until around 6/7pm when they drop again (figure 8). Attendance levels peak earlier in the day at the weekend and begin to drop around 3/4pm (figure 8).
Figure 7

Population-based analysis of urgent care attendances in children and young people in West Lancashire
7
Figure 8
This pattern of attendances throughout the day is similar for all 3 age groups (figure 9) but differs according to the type of urgent care (figure 10). Attendances are highest at the walk in centres and the specialist A&Es. In the specialist A&Es attendances peak around 6/7pm compared to 3/4pm for the walk in centres. The gap in the line graph for minor injury A&E represents times when there were no attendances, and the gap in the line graph for the walk-in centre represents times when the centre is closed.

Population-based analysis of urgent care attendances in children and young people in West Lancashire
8
Figure 9
Figure 10

Population-based analysis of urgent care attendances in children and young people in West Lancashire
9
Place The third section of the analysis examines under 25’s urgent care attendances by place: service location, type of urgent care and GP practice including referral type and deprivation.
Service location Patients attended urgent care at 175 different providers but 99% of attendances were in the North West region. Within the North West region patients attended 31 different providers but 5 main providers accounted for 97% of attendances (table 7) (see appendix for full list of North West providers). The main provider was Southport and Ormskirk Hospitals Trust accounting for 76% of all attendances. The majority of attendances were at the paediatric A&E at Ormskirk and District General Hospital, followed by the Skelmersdale Walk In Centre.
Table 7 Number of attendances by year at the 5 main providers
11/12 12/13 13/14 Total
RVY : Southport and Ormskirk Hospitals Trust
RVY01 : Southport & Formby District General Hospital 2054 1907 1914 5875
RVY02 : Ormskirk & District General Hospital 10407 10389 10026 30822
RVY30 : The Skelmersdale Walk In Centre 7968 7336 7546 22850
RVY39 : West Lancs Health Centre
1721 1721
NM1 : West Lancashire Health Care 5881 7010 530 13421
RRF00 : Wrightington, Wigan And Leigh NHS Foundation Trust 608 693 715 2016
RBS25 : Alder Hey Children's NHS Foundation Trust 297 353 363 1013
RXN00 : Lancashire Teaching Hospitals NHS Foundation Trust 278 276 253 807
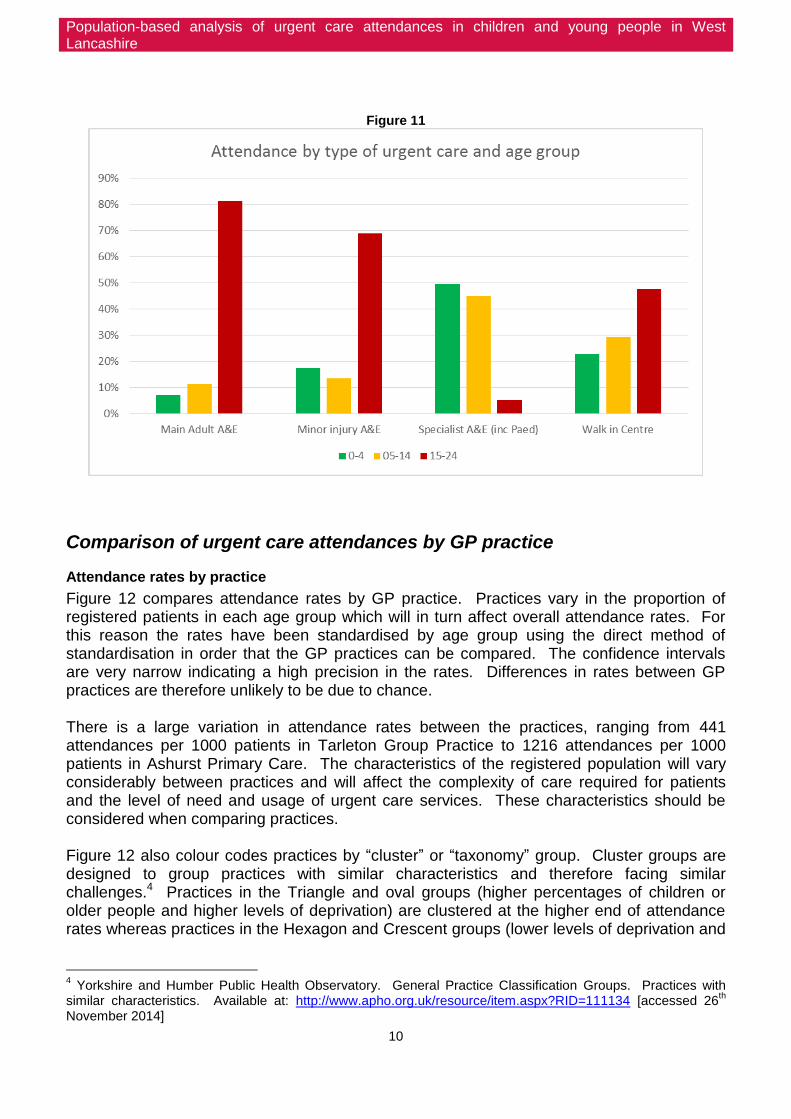
Type of urgent care Different types of urgent care services are dominated by different age groups. As expected paediatric A&E is dominated by the under 15s whereas main adult A&E, minor injury A&E and walk in centres are dominated by the 15-24 age group (figure 11). It may be that parents prefer to take younger children to a specialist paediatric A&E rather than a general A&E perhaps with the view that they will receive better care, a specialist opinion or perhaps they find it more accessible and welcoming.
Population-based analysis of urgent care attendances in children and young people in West Lancashire
10
Figure 11
Comparison of urgent care attendances by GP practice
Attendance rates by practice
Figure 12 compares attendance rates by GP practice. Practices vary in the proportion of registered patients in each age group which will in turn affect overall attendance rates. For this reason the rates have been standardised by age group using the direct method of standardisation in order that the GP practices can be compared. The confidence intervals are very narrow indicating a high precision in the rates. Differences in rates between GP practices are therefore unlikely to be due to chance. There is a large variation in attendance rates between the practices, ranging from 441 attendances per 1000 patients in Tarleton Group Practice to 1216 attendances per 1000 patients in Ashurst Primary Care. The characteristics of the registered population will vary considerably between practices and will affect the complexity of care required for patients and the level of need and usage of urgent care services. These characteristics should be considered when comparing practices. Figure 12 also colour codes practices by “cluster” or “taxonomy” group. Cluster groups are designed to group practices with similar characteristics and therefore facing similar challenges.4 Practices in the Triangle and oval groups (higher percentages of children or older people and higher levels of deprivation) are clustered at the higher end of attendance rates whereas practices in the Hexagon and Crescent groups (lower levels of deprivation and
4 Yorkshire and Humber Public Health Observatory. General Practice Classification Groups. Practices with
similar characteristics. Available at: http://www.apho.org.uk/resource/item.aspx?RID=111134 [accessed 26th
November 2014]

Population-based analysis of urgent care attendances in children and young people in West Lancashire
11
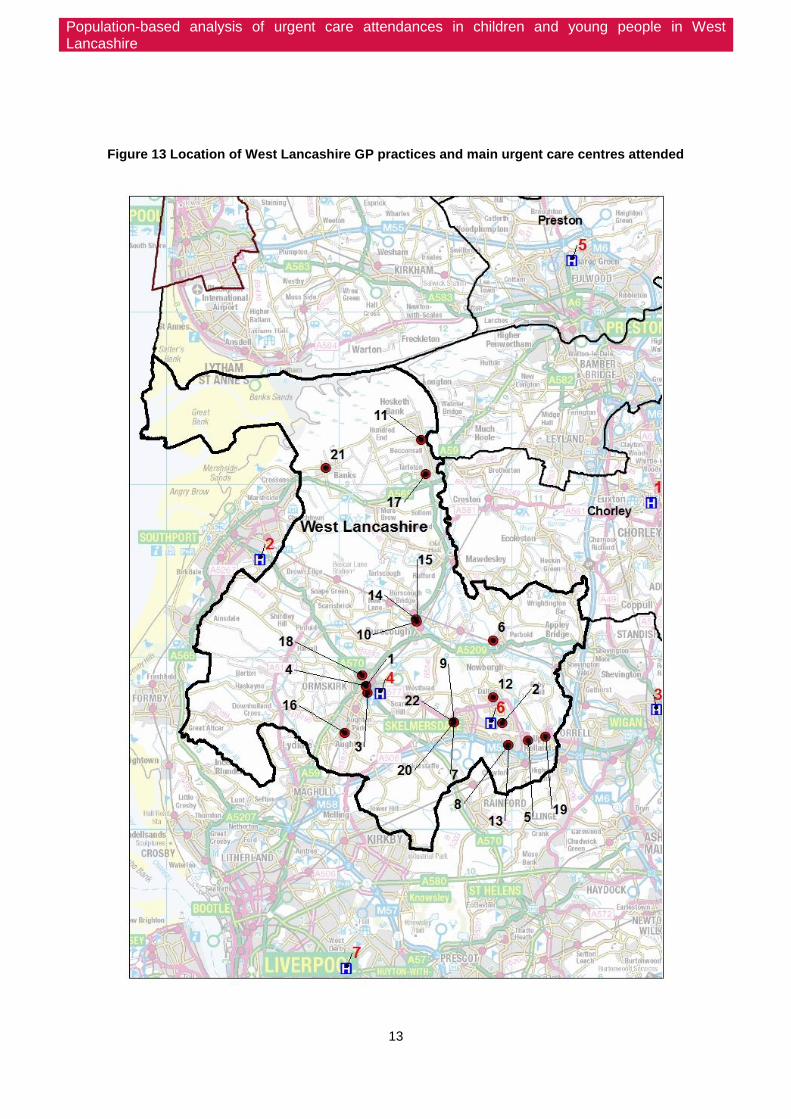
few people from Asian and Black ethnic groups) are clustered at the lower end of attendance rates. Square, circle and rectangle groups are not represented in West Lancashire. Referring to the map of West Lancashire practices and urgent care centres in figure 13 it can be seen that the 7 practices with the highest rates of attendances are all located in and around the town of Skelmersdale. In addition all practices in West Lancashire that have been classified in the Triangle group are located in and around Skelmersdale, an area with high levels of deprivation. The map also shows the close proximity of these practices to the Skelmersdale walk-in centre and it would be useful to distinguish those attendances related to behaviour and convenience from those related to higher levels of need in this area.

Population-based analysis of urgent care attendances in children and young people in West Lancashire
12
Figure 12
Triangle Practices with a high percentage of children (under 15 years old) and very high levels of deprivation.
Oval Practices with a higher percentage of older people (aged 65 years and older) with slightly higher levels of deprivation.
Pentagon Practices with an average proportion of the population in younger and older age groups and generally low deprivation.
Hexagon Located in towns or urban fringe settlements with low deprivation and few people from Asian and Black ethnic groups
Octagon Practices with a high percentage of the population aged 65 years and older and low levels of deprivation.
Kite Practices with large average list sizes, an average proportion of the population under 15 years old, a higher proportion aged 65 years and older and low levels of deprivation.
Crescent
Located in villages, hamlets and isolated settlements with a small average list size and a higher proportion of the population aged 65 years and older. Few people from Asian and Black ethnic groups and low levels of deprivation.
Square
Practices with a smaller than average list size, a high percentage of the population aged under 15 years old and fewer aged 65 years or older. A very high proportion of the population from Asian ethnic groups and a higher than average proportion from Black ethnic groups and very high levels of deprivation.
Circle High percentage under 15 years. Very high percentage of black population and high than average Asian population High deprivation
Rectangle Practices with a very low percentage people under 15 years and a lower proportion of older people (65 years and older) and an above average proportion of the population from Asian and Black ethnic groups.
Population-based analysis of urgent care attendances in children and young people in West Lancashire
13
Figure 13 Location of West Lancashire GP practices and main urgent care centres attended
Population-based analysis of urgent care attendances in children and young people in West Lancashire
14
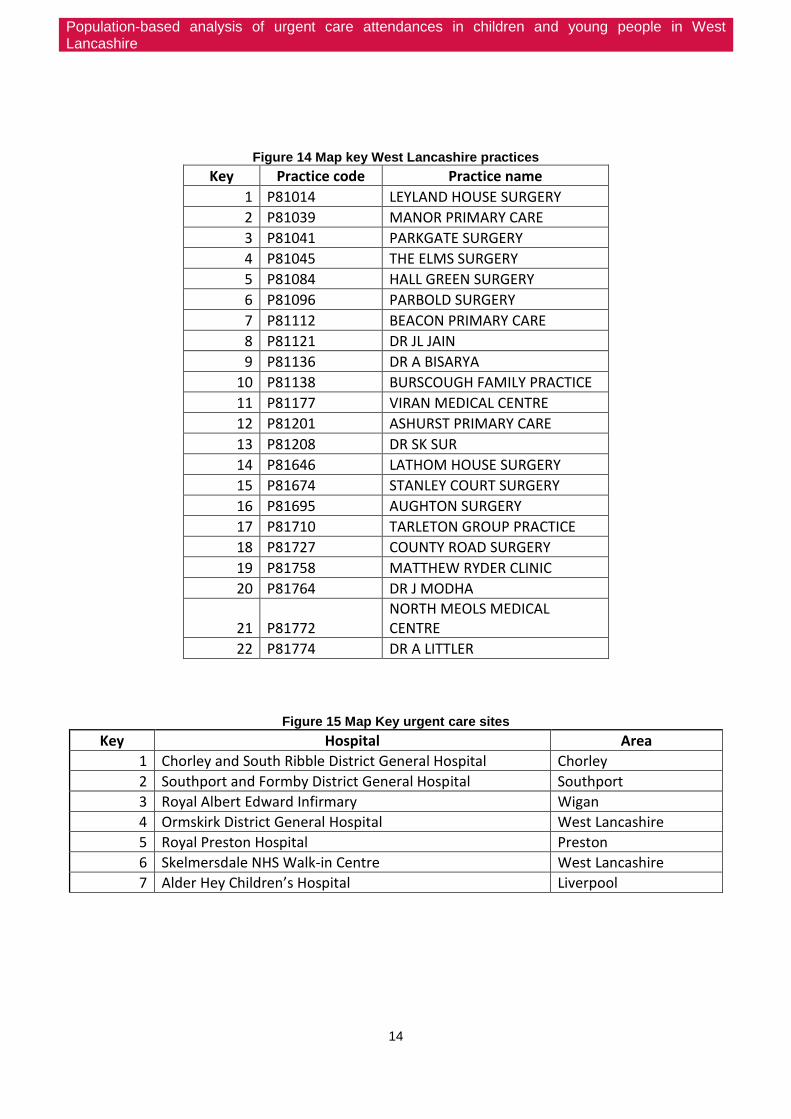
Figure 14 Map key West Lancashire practices
Key Practice code Practice name
1 P81014 LEYLAND HOUSE SURGERY
2 P81039 MANOR PRIMARY CARE
3 P81041 PARKGATE SURGERY
4 P81045 THE ELMS SURGERY
5 P81084 HALL GREEN SURGERY
6 P81096 PARBOLD SURGERY
7 P81112 BEACON PRIMARY CARE
8 P81121 DR JL JAIN
9 P81136 DR A BISARYA
10 P81138 BURSCOUGH FAMILY PRACTICE
11 P81177 VIRAN MEDICAL CENTRE
12 P81201 ASHURST PRIMARY CARE
13 P81208 DR SK SUR
14 P81646 LATHOM HOUSE SURGERY
15 P81674 STANLEY COURT SURGERY
16 P81695 AUGHTON SURGERY
17 P81710 TARLETON GROUP PRACTICE
18 P81727 COUNTY ROAD SURGERY
19 P81758 MATTHEW RYDER CLINIC
20 P81764 DR J MODHA
21 P81772 NORTH MEOLS MEDICAL CENTRE
22 P81774 DR A LITTLER
Figure 15 Map Key urgent care sites
Key Hospital Area
1 Chorley and South Ribble District General Hospital Chorley
2 Southport and Formby District General Hospital Southport
3 Royal Albert Edward Infirmary Wigan
4 Ormskirk District General Hospital West Lancashire
5 Royal Preston Hospital Preston
6 Skelmersdale NHS Walk-in Centre West Lancashire
7 Alder Hey Children’s Hospital Liverpool

Population-based analysis of urgent care attendances in children and young people in West Lancashire
15
Referral type by practice
The majority of attendances are self-referrals (57%). Only 8% of attendances are GP referrals and just 2% from emergency services. The remaining 33% are accounted for by referrals from health care providers, social services, work, educational establishments, police, dental practitioners and those classified as "other". Figure 16 shows the proportion of referrals of each category by GP practice. Self-referrals account for the majority of attendances from most practices but this proportion varies.
Figure 16
Urgent care type by practice
Figure 17 shows the number of attendances by GP practice broken down by type of urgent care. Note that the y axis represents number of attendances not rate of attendances therefore the order of the GP practices differs from figure 12 above. The proportions of attendances by type of urgent care vary significantly between practices. As expected, practices situated close to the Skelmersdale walk-in centre have a higher proportion of walk

Population-based analysis of urgent care attendances in children and young people in West Lancashire
16
in centre attendances. The Elms stands out with an unusually high proportion of minor injury A&E attendances.
Figure 17 Number of attendances by type of urgent care and by practice
Urgent care attendances and practice deprivation
The scatterplot in figure 18 displays a clear association between deprivation and attendance rates, with practices located in areas with higher levels of deprivation having higher attendance rates. A correlation coefficient of 0.8 indicates a strong positive linear correlation between practice IMD and attendance rates. Practices with higher levels of deprivation are likely to face the challenges of higher numbers of more complex patients. This places an increased demand on these practices as well as meaning they are more likely to require input from secondary care. In addition many of the practices with higher levels of deprivation are located close to the Skelmersdale walk-in centre, a feature which may influence patients’ choice of care.

Population-based analysis of urgent care attendances in children and young people in West Lancashire
17
Figure 18
*Rates directly standardised by age group
Ratio of GP referrals to self referrals by practice deprivation
There is a moderate negative linear correlation (R= 0.5) between IMD and ratio of GP referrals to self-referrals (figure 19). Practices with higher levels of deprivation have a higher number of self-referrals relative to GP referrals. Potential explanations include those related to access, behaviour and understanding of where to seek appropriate care. The 3 practice outliers on the graph with high ratios of GP referrals to self-referrals are the 3 practices with the lowest rates of urgent care attendances (North Meols Medical Centre, Tarleton Group Practice and Viran Medical Centre).
Figure 19
Population-based analysis of urgent care attendances in children and young people in West Lancashire
18
Discussion Summary of findings
There were 81,690 urgent care attendances over 3 years 2011/12-2013/14 in West
Lancashire patients under the age of 25
These attendances were made by 39,306 patients, an average of 2.08 attendances
per patient over the 3 year period
The average attendance rate was 822 attendances per 1000 registered population per
year
Person:
The highest rates of attendance are seen in the 0-4 year olds
There are higher numbers of male attendances in younger children and higher
numbers of female attendances in older children/young adults
Patients living in more deprived areas account for a higher proportion of attendances
than patients living in less deprived areas
Respiratory and gastrointestinal conditions are the most common diagnoses in the
under 5’s whereas injuries are more common in the older children/young adults
40% of attendances are coded as “diagnosis not classifiable”
Admissions to hospital were highest in the under 1’s with 24% of attendances being
admitted. The under 5’s accounted for 51% of all admissions to hospital
51% of attendances resulted in discharge with no follow-up
Repeat attenders (more than 5 attendances over the 3 years) made up just 5% of
patients but accounted for 22% of attendances.
The highest number of repeat attenders were in the 0-4 age group
Time:
Attendances decreased slightly in 2013/14
Winter peaks and summer troughs are evident for the under 5s but not the other age
groups
Monday is the busiest day of the week and Saturday the quietest
The majority of attendances are between 8am and 7pm
Place:
The majority of attendances were at the paediatric A&E at Ormskirk and District
General Hospital followed by the Skelmersdale Walk In Centre
Attendance rates varied significantly by GP practice
Higher rates of attendances were seen in practices in the Triangle cluster group
(Practices with a high percentage of children (under 15 years old) and very high levels
of deprivation)
Practice area deprivation was positively correlated with attendance rates
The majority of attendances were self-referrals and only a small proportion were GP
referrals but these proportions varied by practice
There were higher numbers of walk-in centre attendances from practices located close
to the walk-in centre

Population-based analysis of urgent care attendances in children and young people in West Lancashire
19
Strengths and limitations The strengths of the analysis included the large number of attendances available for analysis which increased the precision of the results, the use of data over a 3 year period to enable analysis of trends in attendances, the availability of several different variables to assess, and the completeness of the dataset. Limitations included the poor quality diagnostic data limiting our understanding of why people attended urgent care, missing data and potential errors from data inputting. In addition, unregistered patients were not represented in this analysis yet they are likely to be a vulnerable group for whom urgent care may be their only access to health care.
Effectiveness of interventions on reducing A&E attendances This section briefly reviews some high quality evidence relating to reducing A&E attendances focusing on 3 common conditions: asthma, unintentional injuries and self-harm, followed by a review of some generic evidence from NHS England’s review of urgent care. It is intended to give a brief insight into potential interventions rather than be a detailed review of the evidence. Since this is such an expansive area, more detailed examination of the evidence would require a narrower focus, perhaps for a specific condition, and would constitute separate pieces of work.
Asthma Respiratory problems are responsible for large number of attendances in West Lancashire especially in younger children. Although the true number of attendances specifically for asthma is unclear, it is the most common chronic childhood illness and known to be a leading cause for paediatric hospital admissions. A Cochrane review examining educational interventions aimed at children and their carers presenting at the emergency department with acute exacerbations concluded that they can reduce the risk of future emergency attendances and admissions.5 The long term effects of such interventions on asthma morbidity remain unclear as does which educational packages are the most effective. Another Cochrane review examined the effectiveness of primary care based clinics for asthma.6 These are increasingly used in the UK and are usually nurse-led and doctor-supported. They often involve recalling patients on an asthma register and comprise education, symptom review and management. The review found no statistically significant difference between the asthma clinic group and control group for most outcomes including A&E visits, however, only 3 studies were included and confidence intervals were wide therefore the efficacy of asthma clinic remains inconclusive and further research is required.
5 Boyd M, Lasserson TJ, McKean MC, Gibson PG, Ducharme FM, Haby M. Interventions for educating children
who are at risk of asthma-related emergency department attendance. Cochrane Database of Systematic Reviews 2009 6 Baishnab E, Karner C. Primary care based clinics for asthma. Cochrane Database of Systematic Reviews
2012

Population-based analysis of urgent care attendances in children and young people in West Lancashire
20
Unintentional injuries A recent Cochrane review concluded that parent education and training programmes are effective in reducing unintentional injury in children under 18 years.7 The majority of studies in the review were of home-based programmes but also included studies of practice-based interventions. The majority of studies were of socially disadvantaged families or families who may benefit from extra support such as single mothers.
Self-harm Research has shown that approximately 20% of patients who present with self-harm re-present within a year. 8 In addition people who self-harm are 50-100 times more likely to die by suicide in the 12 months following the episode than people who do not self harm.9 This highlights the importance of effective management and secondary prevention for people who self-harm. NICE have produced comprehensive evidence-based guidelines on the short and long-term management and secondary prevention of self-harm.10,11 In particular people receiving support for self-harm should have a collaboratively developed risk management plan and a discussion about the potential benefits of psychological interventions. Children and young people who have self-harmed should normally be admitted overnight and assessed fully by the Child and Adolescent Mental Health Team before discharge.
Generic evidence NHS England’s review of urgent care (2013)12 found:
Patients who have good general practice experiences are less likely to use A&E
departments
Access to urgent GP appointments is variable across England and practices in areas
of high deprivation deal with larger numbers of complex patients. This may lead to
avoidable A&E attendances
Systematic use of telephone consultations is linked to reduced use of A&E
departments
A wide range of services are available and there is a lack of standardisation and
fragmentation leading to confusion, and patients presenting at services that don’t best
suit their needs
Self-care and self-management improve quality of life and reduce dependency on
urgent care services. But there is a lack of awareness on how to access support
especially in lower socioeconomic groups.
7 Kendrick D, Mulvaney CA, Ye L, Stevens T, Mytton JA, Stewart-Brown S. Parenting interventions for the
prevention of unintentional injuries in childhood. Cochrane Database of Systematic Reviews 2013, 8 Bergen H, Hatwon K, Napur N et al. (2010) Epidemiology and trends in non-fatal self-harm in three centres in
England, 2000 to 2007. British Journal of Psychiatry 197: 493–8. 9 NICE quality standards [QS34] June 2013. Quality standard for self-harm. Available at:
https://www.nice.org.uk/guidance/QS34/chapter/Introduction-and-overview [accessed 15th July 2014] 10
NICE quality standards [QS34] June 2013. Quality standard for self-harm. Available at: https://www.nice.org.uk/guidance/QS34/chapter/Introduction-and-overview 11
NICE commissioning guides [CMG50] June 2013. Support for commissioning for self-harm. Available at: https://www.nice.org.uk/guidance/CMG50/chapter/1-Introduction 12
NHS England. Transforming urgent and emergency care services in England. Available at: http://www.nhs.uk/NHSEngland/keogh-review/Documents/UECR.Ph1Report.Appendix%201.EvBase.FV.pdf [accessed 26
th November 2014]

Population-based analysis of urgent care attendances in children and young people in West Lancashire
21
Recommendations Based on the findings from this work combined with the evidence discussed the following approaches could be considered to address urgent care attendances, many of which the CCG may already be addressing:
1. Best practice in urgent care
Discharge planning and risk stratification to reduce the risk of re-attendance
2. Community interventions
Improve urgent care services outside hospital such as same-day access to GPs, local
mental health teams and community nurses for patients with urgent care needs.
Use of telephone consultations
Education and advice on how to access the appropriate type of care. NHS England
recommend enhancing NHS 111 service
Provide better support for self-care and self-management including increasing the
quality and accessibility of information, especially in lower socioeconomic groups, to
help children and parents prevent illnesses and accidents, treat minor ailments and
manage long term conditions themselves. Community pharmacy services may help
improve self-care.
Condition-specific evidence-based interventions. For example, educational
interventions for asthma discussed above.
Targeting interventions to children with repeat attendances/admissions as they are
more likely to have more severe illness and/or poor self-management skills.
Targeting of interventions to practices and/or areas with higher levels of attendances
3. Broader population health perspective
Prevention of illness and injuries in children further upstream is a desirable approach. Although immediate effects will not be seen, success would mean a reduction in the need for urgent care down the line as well as a reduction in illness and suffering. This will involve consideration of starting well (e.g. breastfeeding, smoking in pregnancy), living well (e.g. smoking, alcohol, diet and exercise) and the wider determinants of health (e.g. housing and road safety). NICE are currently developing guidelines on providing care in acute medical emergencies. This will focus on standardising best practice across the country and will address issues such as access to services, staff skill mix, discharge planning and alternatives to acute care in hospital.13
13
NICE Press Release. Available at: http://www.nice.org.uk/news/press-and-media/nice-consults-on-plans-to-develop-new-guideline-for-people-in-need-of-emergency-care [accessed 26th Novemner 2014]

Population-based analysis of urgent care attendances in children and young people in West Lancashire
22
Further work The results of this data analysis have raised more questions than they have answered and further work may provide a more useful insight into these areas that can then be acted on. The following are suggestions for potential further work:
Understanding repeat attendances. A small number of patients account for a large
number of urgent care attendances. Research into the specific characteristics of
repeat attenders including the reasons for attendance and diagnoses would aid in
understanding how their needs can be addressed and attendances reduced. Due to
the limitations of the coding data this is likely to involve analysis of individual case
notes.
Discuss potential for improving diagnostic coding data to better understand most
common reasons for attendance. More robust data on diagnosis would help establish
the areas where prevention/community interventions need to be focussed.
Explore the reasons for variations in attendance rates between practices to aid
targeting of interventions.
In-depth review of specific preventive interventions with regards to specific conditions
that account for large numbers of attendances. Different conditions will necessitate
different interventions and will need to be addressed individually as well as generically.
Case studies of other areas successful in reducing urgent care attendances in children
and young people.
Elicit the perspectives of parents and young people on urgent care services in order to
understand their needs and what influences their decisions on where to seek care.

Population-based analysis of urgent care attendances in children and young people in West Lancashire
23
Appendix: Number and percentage of attendances by North West provider
North West Provider Number of
attendances % of total
SOUTHPORT AND ORMSKIRK HO: (RVY) 61268 75.84%
WEST LANCASHIRE HEALTHCAR: (NM1) 13421 16.61%
WRIGHTINGTON, WIGAN AND L: (RRF) 2016 2.50%
ALDER HEY CHILDREN'S NHS : (RBS) 1013 1.25%
LANCASHIRE TEACHING HOSPI: (RXN) 807 1.00%
AINTREE UNIVERSITY HOSPIT: (REM) 422 0.52%
ROYAL LIVERPOOL AND BROAD: (RQ6) 310 0.38%
ST HELENS AND KNOWSLEY HO: (RBN) 242 0.30%
5 BOROUGHS PARTNERSHIP NH: (RTV) 197 0.24%
BRIDGEWATER COMMUNITY HEA: (RY2) 155 0.19%
CENTRAL MANCHESTER UNIVER: (RW3) 149 0.18%
UNIVERSITY HOSPITALS OF M: (RTX) 98 0.12%
EAST LANCASHIRE HOSPITALS: (RXR) 97 0.12%
CUMBRIA PARTNERSHIP NHS F: (RNN) 64 0.08%
WARRINGTON AND HALTON HOS: (RWW) 60 0.07%
PENNINE ACUTE HOSPITALS N: (RW6) 60 0.07%
ASHTON, LEIGH AND WIGAN P: (5HG) 51 0.06%
BOLTON NHS FOUNDATION TRU: (RMC) 48 0.06%
SALFORD ROYAL NHS FOUNDAT: (RM3) 40 0.05%
WIRRAL UNIVERSITY TEACHIN: (RBL) 37 0.05%
LIVERPOOL COMMUNITY HEALT: (RY1) 36 0.04%
UNIVERSITY HOSPITAL OF SO: (RM2) 34 0.04%
NORTH CUMBRIA UNIVERSITY : (RNL) 30 0.04%
BLACKPOOL TEACHING HOSPIT: (RXL) 30 0.04%
LIVERPOOL WOMEN'S NHS FOU: (REP) 23 0.03%
COUNTESS OF CHESTER HOSPI: (RJR) 21 0.03%
TAMESIDE HOSPITAL NHS FOU: (RMP) 15 0.02%
AIREDALE NHS FOUNDATION T: (RCF) 14 0.02%
MID CHESHIRE HOSPITALS NH: (RBT) 10 0.01%
STOCKPORT NHS FOUNDATION : (RWJ) 10 0.01%
EAST CHESHIRE NHS TRUST: (RJN) 4 0.00%
Total 80782 80782