analysis photogrammetry data isim june 1,2007...analysis of photogrammetry data from isim mockup...
TRANSCRIPT

Analysis of Photogrammetry Data from ISIM Mockup June 1,2007
Maria Nowak and Mike Hill Goddard Space Flight Center
Greenbelt, MD 20771
Introduction
During ground testing of the Integrated Science Instrument Module (ISIM) for the James Webb Space Telescope (JWST), the ISIM Optics group plans to use a Photogrammetry Measurement System for cryogenic calibration of specific target points on the ISIM composite structure and Science Instrument optical benches and other GSE equipment. This testing will occur in the Space Environmental Systems (SES) chamber at Goddard Space Flight Center.
Close range photogrammetry is a 3 dimensional metrology system using triangulation to locate custom targets in 3 coordinates via a collection of digital photographs taken from various locations and orientations. These photos are connected using coded targets, special targets that are recognized by the software and can thus correlate the images to provide a 3 dimensional map of the targets, and scaled via well calibrated scale bars. Photogrammetry solves for the camera location and coordinates of the targets simultaneously through the bundling procedure contained in the V-STARS software, proprietary software owned by Geodetic Systems Inc.
Obiectives The primary objectives of the metrology performed on the ISIM mock-up were (1) to quantify the accuracy of the INCA3 photogrammetry camera on a representative full scale version of the ISIM structure at ambient temperature by comparing the measurements obtained with this camera to measurements using the Leica laser tracker system and (2), empirically determine the smallest increment of target position movement that can be resolved by the PG camera in the test setup, i.e., precision, or resolution. In addition, the geometrical details of the test setup defined during the mockup testing, such as target locations and camera positions, will contribute to the final design of the photogrammetry system to be used on the ISIM Flight Structure.
A preliminary analysis of the bare ISIM cryogenic metrology was performed to determine target separation and number for the surrogate,Science Instrument Interface Plates (SIIPs), as well as the number of photogrammetry runs necessary to detect that the structure meets the not-to- exceed requirements for changes in SIIP alignment of <0.44 mm for the monopod SIIPs and <0.27mm bipod SIIPs in translation and <4.3 arcminute SIIPs rotation. For this analysis, a 2- sigma photogrammetry measurement error of 0.100 mm was assumed, and a 2-sigma laser tracker measurement error of 0.05 mm was assumed. These assumptions relied on the errors inherent in the two metrology systems based on the noise floor in heritage test data. Although we require 0.100 mm for the 2-sigma error in the PG measurements, we set a goal of decreasing it to 0.05 mm in order to reduce the number of PG runs needed to obtain good statistics in the interest of schedule during I&T. We will show how this top-level measurement error for the PG metrology system breaks down in a formal error budget in a future requirements document.
https://ntrs.nasa.gov/search.jsp?R=20080039635 2020-03-05T15:45:50+00:00Z
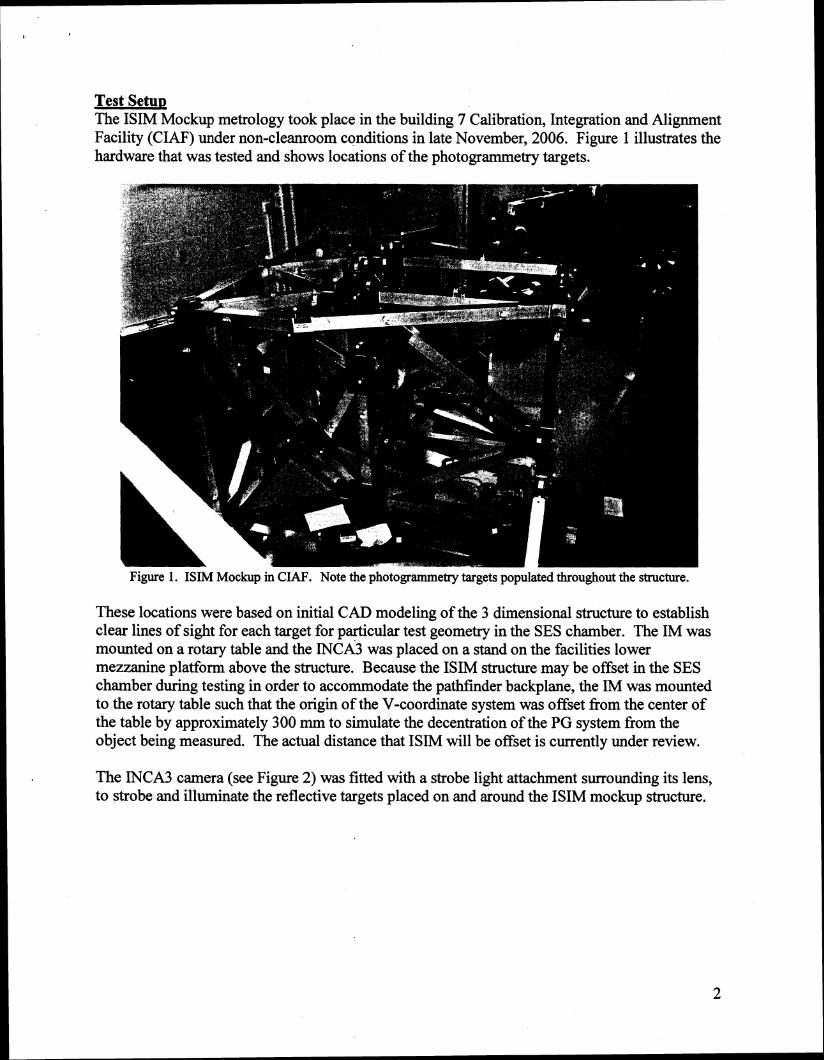
Test S e t u ~ The ISIM Mockup metrology took place in the building 7 Calibration, Integration and Alignment Facility (CIAF) under non-cleanroom conditions in late November, 2006. Figure 1 illustrates the hardware that was tested and shows locations of the photogrammetry targets.
Figure 1 . ISIM Mockup in CIAF. Note the photogrammetry targets populated throughout the structure.
These locations were based on initial CAD modeling of the 3 dimensional structure to establish clear lines of sight for each target for particular test geometry in the SES chamber. The IM was mounted on a rotary table and the INCA3 was placed on a stand on the facilities lower mezzanine platform above the structure. Because the ISIM structure may be offset in the SES chamber during testing in order to accommodate the pathfinder backplane, the IM was mounted to the rotary table such that the origin of the V-coordinate system was offset from the center of the table by approximately 300 mm to simulate the decentration of the PG system from the object being measured. The actual distance that ISIM will be offset is currently under review.
The INCA3 camera (see Figure 2) was fitted with a strobe light attachment surrounding its lens, to strobe and illuminate the reflective targets placed on and around the ISIM mockup structure.

Figure 2. The INCA3 camera.
The INCA3 is a 12-bit, 8 MP (3500 x 2350) camera with a field of view of 77' x 56' and is Geodetic System's latest high resolution model. The camera lens was located approximately 3.2 meters horizontally and 3.2 meters vertically fiom the center of the rotary table. Preliminary modeling indicated that this would be the optimum position for viewing the ISIM targets. The final position of the camera during thermal vacuum testing is still under review, due to new developments in the shroud design. Multiple camera stations were obtained by rotating the structure on a precision rotary table and maintaining the camera in a fixed position relative to the table. This is similar but inverse to the system that will be installed in the SES chamber for thermal vacuum cycling, in which the camera will rotate about the structure on a large boom arm.
A total of 73 photogrammetry targets were distributed throughout the structure. 37 were spherical targets, 10 were 45-degree angle targets, and 26 were stick-on dot targets. In addition, 69 coded targets and three mutually orthogonal aluminum scale-bars were used. The 26 dot targets were originally placed on the structure to resolve some early issues with the software bundling that later turned out to be an artifact of the software. "Bundling" is the process by which the V-STARS software simultaneously solves for the target positions, resect the pictures and calibrate the camera. Photogrammetry photos were taken at approximately every 7.5 degree rotation of the rotary table, which optimizes the number of targets that can be seen as well as the number of pictures used in the sokware bundle. Photos were also taken at each rotary table position with the camera axis rolled 0,90, 180, and 270 degrees in order to calibrate the internal errors of the camera. Additional photos were taken fiom the upper mezzanine for the first photogrammetry run to afford a greater variety of geometry. These photos were used to create the software template that was used to bundle subsequent photogrammetry jobs. A software template is a list of target names and approximate positions in the appropriate coordinate system so that the time consuming computational task of naming each target and establishing a coordinate system need not be repeated for each subsequent photograrnrnetry data run.

Three sets of laser tracker data were taken and averaged to provide blueprint values to establish the ISIM Mockup V-coordinates (IM-coordinates) that were subsequently transferred to the photogrammetry system. A blueprint data set is an important input to the photogrammetry bundle adjustment algorithm, as it drives the iterative calculation to a solution that is most similar to that measured by another technique or ideal design. The laser tracker data also provide a metric of known absolute accuracy for comparison to the photogrammetry data. The laser tracker data were taken using multiple tracker positions, or "stations." This data is fit together in the Spatial Analyzer software via "tie points" or targets that are either placed on stands or attached to the walls surrounding the IM and can be viewed from multiple stations. In between data sets, the IM was rotated approximately 120 degrees to ensure that rotation of the structure does not induce any systematic errors or stresses. A cube mounted to the structure was monitored periodically to check that the structure did not drift or sag during the course of a measurement cycle.
Lakeshore temperature sensor diodes were attached at various points on the structure and monitored every half hour during the laser tracker measurement cycles and photogrammetry runs. The average temperature of the IM structure during laser tracker measurements was 19.0 degrees Centigrade, with a high temperature of 19.4 and a low temperature of 18.8 degrees. The average temperature of the IM structure during photogrammetry measurements was 19.4 degrees with a high temperature of 19.9 degrees and a low temperature of 18.9 degrees. The CTE of aluminum 6061 is 23.6 um/ml°C. The average temperature difference between the laser tracker work and the photogrammetry runs was .4 degrees Centrigrade. For a section of structure 2 meters long, this would lead to an error of less than 20 microns, which is within the error of both systems. The temperature fluctuations within each test were on the order of a degree Centigrade, which would lead to an error of around 46 microns, which again does not exceed the errors of each system.
Data Analvsis
The laser tracker data were used to define a coordinate system via a 3-2-1 fitting system; three points were used to define a plane (IM2-IM3 plane), two points roughly within this plane to define a line to fix the rotation of the IM2 axis, and 1 point to locate an arbitrary "origin" of the system. The photogrammetry data were then fit to this coordinate system by fitting eight points located at the corners of the structure to values determined during the laser tracker blueprint calibration cycles. Note that the axes IM1, IM2, and IM3 are approximately parallel to V1, V2, and V3, respectively.
The V-Coordinate system will be defined on the as-built Flight ISIM structure by frtting metrology target measurements of the B-references to design blueprint values. Future mockup work will incorporate this fitting system to provide data that is more representative of that which will involve the flight structure.
Results
The photogrammetry data agreed with the laser tracker data on average to about 0.06 mm, or 60 microns (see Table 1). This number was obtained by taking the average coordinate value from

10 PG runs on a target by target basis and subtracting each location fiom the average data value for 3 laser tracker cycles and then computing the RMS average of these differences for three dimensions.
Table 1. PG and LT data comparisons.
The standard deviation for the laser tracker data across all targets was on average around 30 microns which is fairly typical for these types of measurements. However, the standard deviations of the measurements of each target were somewhat large for some targets as discussed below.
The standard deviation for the photogrammetry data is less than 10 microns, indicating that photogrammetry is highly repeatable (precise), making it especially well suited to measuring changes in target locations, such as during thermal cycling.
In order to get a feel for how well photogrammetry data agrees with the laser tracker data on a target by target basis, the deviations were plotted for each individual point. This was done by plotting the aforementioned deltas for each point (see figure 3.)
~hotogrammetry vs. Laser Tracker Target Measurements for lSlM Mockup
4.15
points
Figure 3. Deviations of photogrammetry data fiom laser tracker data on a target by target basis. The ordering of the points is nurnerical/alphabetical.

Although there are a few outlying points, most agree to within 100 microns. On the surface, this is not a promising result and would indicate a larger than expected source of systematic error than what is assumed in the current ISIM alignment error budget. However, the picture would not be complete without examining the individual standard deviations across all data sets on a target by target basis for LT and PG separately. This is shown in Figures 4 and 5.
Standard Deviations of 3 LT Cycles
points
Figure 4. Standard deviations of 3 LT data sets on a target by target basis. The break is where LT could not measure target(s) due to an obscuration.

points
Standard Deviations of 10 PG runs
Figure 5. Standard deviations of 10 PG data sets on a target by target basis.
025 -
0.2
- E 5 0 1 5 - c 0 .- Y .B
5 3 1 -
Note that figures 4 and 5 are plotted on the same scale. The individual standard deviations for the LT data vary much more widely than that of PG. It is worth noting that we have data for only 3 LT cycles; performing more cycles would yield a more representative data set. However, the individual deviations indicate that the data may not be as accurate as possible; LT standard deviations in general should be less than 0.05 mm. Standard deviations of the LT measurements of each target could be reduced in the future by perhaps using more stable tie points. Some tie points were hot-glued to the wall and may have been subjected to shocks as the tracker target was pulled fiom its magnetic nest between measurements. It is also possible that since the rotary table cannot be locked into position without electronic operation (the electronics are currently non-functional), the structure may have moved slightly during the course of the laser tracker measurements. This is being examined for future mockup work. Also, reducing the number of stations required to view the entire IM structure would reduce the errors associated in fitting stations together. Thus, the PG data agrees with the LT data to within values that are approximately equal to the laser tracker standard deviations. Lowering the LT standard deviations may lead to better agreement between the laser tracker and photogrammetry measurements and will be investigated further in a future study.
--
+ PG IM2

It is also important to determine how fine a change in target position the photogrammetry system can detect. To do so, a spherical target was mounted on a translation stage near ISIM datum B and moved in the IM3 direction via an attached micrometer. A total of five PG runs were taken for each target position and averaged, using the 10 previous runs to determine the baseline target position. The nominal position to which the PG data was compared was read fiom the micrometer. Error in the nominal position may be present due to the fact that the translation axis of the target may be slightly misaligned from the IM3 axis of the IM. The results are summarized in Table 2.
-~ -. -- - -... ~ - - -.-- - .~ -.-- - - - .-.-.- - b n d a r d devlatlon (mm) ! 0.005 1 0.0031 0.009l
Table 2. Measured displacement of photogrammetry target.
The photogrammetry system could detect very small changes to the target position, as low as 25 microns. Although the PG measurements of the 15 micron change compared favorably to the micrometer reading, the standard deviation is around 9 microns, which is more than half of the dimension being measured. These data are a good indication that the PG system can determine the 0.13 mm warm to cold SIIP position change during cryogenic testing previously mentioned. A future study is planned to measure changes along all three of the IM coordinate axes at different locations on the structure.
45-degree angle targets were placed on an 8-inch plate that was attached to a tiphilt mount near ISIM datum B. The tiphilt mount was adjusted in 4.3,2.15, and 1.05 arcminute increments via a theodolite viewing an alignment cube on the plate. Although the data for the five runs at each tilt position yielded standard deviations on the order of a few seconds, there was a consistent, unidirectional systematic offset of around 24 seconds. The cause of this error is unknown and will be investigated during future IM photogrammetry measurements.
We also address the number of photogrammetry runs necessary to provide the most accurate data. It is important to remember that this is an ambient test and therefore does not reflect other noise sources that would be present during a cryogenic test, such as additional coordinate system uncertainty. The normalized directional error (NDE) was calculated for various sample sizes by subtracting each individual data value fiom the mean data value on a target by target basis for a sample of size N. The variance (2) of the NDE was calculated for each sample. The average and standard deviation of the variance across all targets for each dimension was then plotted as a function of sample size (see figures 6 and 7.)

Average NDE Variance vs. Number of Datasets
0.00E+00 2 3 4 5 6 7 8 9 10
number of datasets
Figure 6. Average NDE variance as a function of sample size.
Based on the Student-T distribution, which is a measure of how accurately a small sample size represents its parent population, 10 datasets is the minimum number suggested to attempt a reasonable sample, based on previous knowledge of the camera resolution. However, we show in Figure 6 that, as sample size increases, the average NDE fluctuates less drastically for samples of N greater than about 6.

Standard Deviation of NDE Variance vs. Number of Datasets
o.m+oo 4 1 2 3 4 5 6 7 8 9 10
number of datasets
Figure 7. Standard deviation of variance as a function of sample size.
Furthermore, from figure 7, it can be seen that the standard deviation of the variance of the NDE decreases drastically for samples of size N=4 and greater.
Figures 6 and 7 indicate the NDE variances and standard deviations of the NDE variances are higher in the IM1 direction, which is approximately parallel to gravity and is the largest component to ISIM focus alignment. Presumably this is caused by the photogrammetry camera looking almost "down" along this axis and does not have as much variation in geometry as the other two axes as the camera rotates around. To get a feel for whether being closer to the camera helps to mitigate some of these errors, the average NDE variance and standard deviation of the NDE variance were calculated for targets along the "upper" deck of the ISIM mockup structure (closer to the camera) and the "lower" deck (farther from the camera). The results are shown in Figures 8-1 1 .

Average NDE Variance vs, Number of Datasets--Lower Targets
1.80E-04
1.60E-04
1.40E-04
T - '"" e 1.00~-04
f W 2 8.00E-05
1 8.00E-05 w
number d datasets
Figure 8. Average NDE variance for the lower targets.
Average NDE Variance vs. Number of Datasets-Upper Targets
1 BE-04
Figure 9. Average NDE variance for the upper targets.

Standard Deviation of NDE Variance vs. Number of Datasets--Lower Targets
O.M)E+W + 1 2 3 4 5 6 7 8 9 10
number of datasets
Figure 10. Standard deviation of the NDE variance for the lower targets
Standard Deviation of NDE Variance vs. Number of Datasets--Upper Targets
number of datasets
Figure 11. Standard deviation of the NDE variance for the upper targets

The NDE variances and standard deviations of the NDE variances are larger for the lower targets. This could be due to decreased resolution at farther distances, or the fact that the upper targets undergo a broader change of geometry with respect to the camera than the lower targets as the mockup rotates. The standard deviations of the NDE variances are approximately equal along all three axes for the upper targets. We conclude that the uncertainty level is greater in IM1 for all targets by about 50%, and greater still for a target farther away from the PG cameras (i.e., lower on the structure by another 50%.)
The photogrammetry data is highly repeatable, with a standard deviation of 10 microns for 10 data sets, and can detect changes as small as 25 microns in our ambient mockup test to -2 sigma. Minimum detectable changes in a cryo-vac chamber with additional sources of noise would be larger (a formal error budget will be covered in a later document). The photogrammetry data agreed with the tracker data on average to about 75 microns; most of this error can be attributed to unusually high standard deviations within the tracker data. Our measurements of INCA3 PG system resolution and repeatability are consistent with values published by other groups for similar ambient testing (1). Our measurements of PG system absolute accuracy with respect to the laser tracker data set are worse than those observed by other groups for similar applications (2). Future studies are planned to further investigate photogrammetry accuracies and capabilities. Our next mockup measurements will ensure more careful calibration with the LT system to minimize errors. Other issues it will explore will include the smallest change that can be detected along all three coordinate axes at actual SIIP (science instrument interface plate) locations, possible reduction in the number of coded targets, particularly at harness locations, and targeting similar to that of the ICVF.
We gratefully acknowledge Henry Sampler for his assistance in planning laser tracker operations, Jairnee Gill and Nick Spartana for their assistance with laboratory activities, Phil Young, Pam Davila and Ray Oh1 for their help with data analysis and this report.
1. Glick, Gary, "Cost Effective Videogrammetry Measurement Methodology Used for Material Yield Testing on Structural Elements," ppt presentation, GSI User Group Meeting, 2007 Hilton Melbourne Beach Oceanfront, Florida, January 24-26,2007
2. Brown, John, "Acceptance Test Results at Boeing", htt~://www.g.eodetic.com/v- stars/info.asp?~a~ersdownload