analysis plan: statistical procedures lu ann aday, ph.d. the university of texas school of public...
TRANSCRIPT

ANALYSIS PLAN: STATISTICAL PROCEDURES
Lu Ann Aday, Ph.D.The University of Texas School of Public Health

TYPE OF ANALYSIS PROCEDURES: Alternative Assumptions
DESCRIPTIVE STATISTICS
Estimate for a sample EXISTENCE OF
ASSOCIATION Statistically test
the presence of a relationship
INDEPENDENT SAMPLES
Distinct or unrelated groups
INFERENTIAL STATISTICS
Infer to a population STRENGTH OF
ASSOCIATION Statistically measure
the strength of a relationship
RELATED SAMPLES
Matched or correlated groups
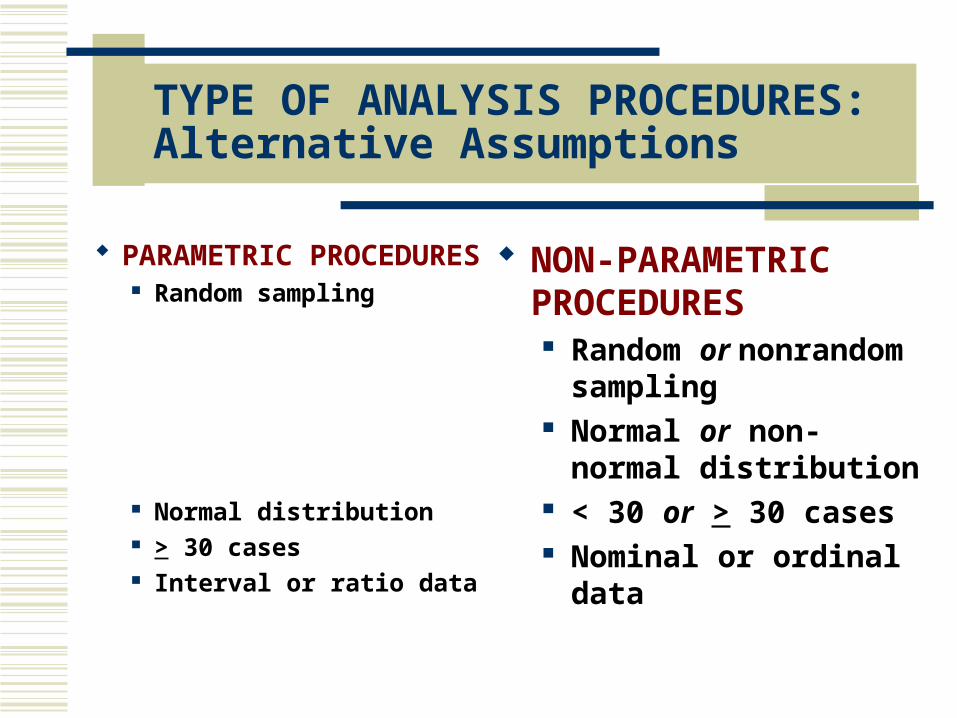
TYPE OF ANALYSIS PROCEDURES: Alternative Assumptions
PARAMETRIC PROCEDURES Random sampling
Normal distribution > 30 cases Interval or ratio
data
NON-PARAMETRIC PROCEDURES Random or
nonrandom sampling
Normal or non-normal distribution
< 30 or > 30 cases Nominal or ordinal
data

RELATE STUDY OBJECTIVES & TYPE OF ANALYSIS
STUDY OBJECTIVES 1. TO DESCRIBE X, Y, or Z
2. TO COMPARE Y by X, or Z by X
3. TO TEST THE IMPACT/ANALYZE THE RELATIVE IMPORTANCE of X on Y [controlling for Z] (assumes Ho)
TYPE OF ANALYSIS Univariate
Bivariate
Multivariate

UNIVARIATE STATISTICS: Measures of Central Tendency
LEVEL/MEASURE
Nominal Ordinal Interval or Ratio
Frequencies
X X X
Mode X X XMedian X XMean X

UNIVARIATE STATISTICS: Measures of Dispersion
LEVEL/MEASURE
Nominal Ordinal Interval or Ratio
Range XVariance XStandardDeviation
X

BIVARIATE STATISTICS: Nonparametric Tests of Association
SAMPLE/LEVEL
IndependentSamples
RelatedSamples
Nominal Fisher’s exact test(2X2 table)Chi-square contingency table analysis
McNemar test for significance of changes (2X2 table)Cochran Q-test
Ordinal Chi-square contingency table analysis
--
Mixed (differences in ranks between groups)
Median test Mann-Whitney U test Kolmogorov-Smirnov Wald-Wolfowitz runs test Kruskal-Wallis (3+ groups)
Sign test Wilcoxon matched-pairs signed ranks test Friedman two-way analysis of variance (3+ groups)

BIVARIATE STATISTICS: Nonparametric Measures of Strength of Association
MEASURE/LEVEL
MEASURES OF STRENGTH OF ASSOCIATION
Nominal Phi coefficient, Yule’s Q (2XK table), Coefficient of contingency, Cramer’s V, Lambda, Odds ratio
Ordinal Goodman and Kruskal’s gamma, Kendall’s tau-a, tau-b, tau-c, Somer’s d, Spearman rank order coefficient
Mixed(differences in ranks between groups)
Lambda, uncertainty coefficient, Goodman and Kruskal’s gamma, Somer’s d, Eta coefficient

BIVARIATE STATISTICS: Parametric Tests of Association
SAMPLE/ LEVEL
Independent Samples
Related Samples
Interval or Ratio (extent to which Y has linear relationship with X)
Bivariate regression
Bivariate regression (where Y = change or difference score)
Mixed (differences in means between groups)
t-test of difference between means (2 groups)One-way ANOVA (3+groups)
Paired t-test of difference between means (2 groups) One-way ANOVA w/ repeated measures(3+related measures)

BIVARIATE STATISTICS: Parametric Measures of Strength of Association
MEASURE/LEVEL
MEASURES OF STRENGTH OF ASSOCIATION
Interval or Ratio (extent to which Y has linear relationship with X)
Pearson correlation coefficient
Mixed (differences in means between groups)
Biserial correlation (2 groups) Eta coefficient (3+ groups)

MULTIVARIATE STATISTICS: Nonparametric Tests of Association
SAMPLE/ LEVEL
Independent Samples
Related Samples
Nominal (cross-tabulation of dependent variable by independent by control variables)
Chi-square multi-dimensional contingency table analysisLog linear analysisWeighted least squaresMantel-Haenszel chi-square
Cochran Q-test
Ordinal (association of ranks between three or more rank variables)
Chi-square multi-dimensional contingency table analysis
--

MULTIVARIATE STATISTICS: Nonparametric Measures of Strength of Association
MEASURE/ LEVEL
MEASURES OF STRENGTH OF ASSOCIATION
Nominal (cross-tabulation of dependent variable by independent by control variable)
Coefficient of contingency, Cramer’s V, Lambda, Symmetric Lambda, Odds ratio
Ordinal (association of ranks between three or more rank variables)
Kendall coefficient of concordance

MULTIVARIATE STATISTICS: Parametric Tests of Association
SAMPLE/LEVEL
Independent Samples
Related Samples
Interval or Ratio (extent to which Y has linear relationship with X, Z, etc.)
Multiple regression
Multiple regression(where Y = change or difference score)
Mixed (differences in means between groups, controlling for Z)
ANOVA, when Z=nominalANCOVA, when Z=interval
ANOVA w/repeated measuresANCOVA w/repeated measures
Mixed (differences in proportions between groups, controlling for Z)
Logistic regression Logistic regression of change in status

MULTIVARIATE STATISTICS: Parametric Measures of Strength of Association
MEASURE/LEVEL
MEASURES OF STRENGTH OF ASSOCIATION
Interval or Ratio (extent to which Y has linear relationship with X, Z, etc.)
Multiple correlation coefficient
Mixed (differences in means between groups, controlling for Z)
Multiple correlation coefficient
Mixed (differences in proportions between groups, controlling for Z)
Odds ratio

DATA ANALYSIS MATRIX
STUDY OBJECTIVES
TYPES OF VARIABLES
ANALYTIC PROCEDURES
TO DESCRIBE One variable (neither independent or dependent)
Univariate
TO COMPARE One independent and one dependent variable
Bivariate
TO ANALYZE THE RELATIVE IMPORTANCE
Two or more independent/controlvariables and one dependent variable
Multivariate


STATISTICAL PROCEDURE SELECTION: SOFTWARE
SELECTING STATISTICS You could access and use the
“Selecting Statistics” website in deciding which statistical procedures are most appropriate, given your study objectives and associated level of measurement of study variables: http://www.socialresearchmethods.net/selstat/ssstart.htm

SAMPLE MOCK & ANALYSIS TABLES
See Word file with Sample Mock Tables and Analysis Tables.
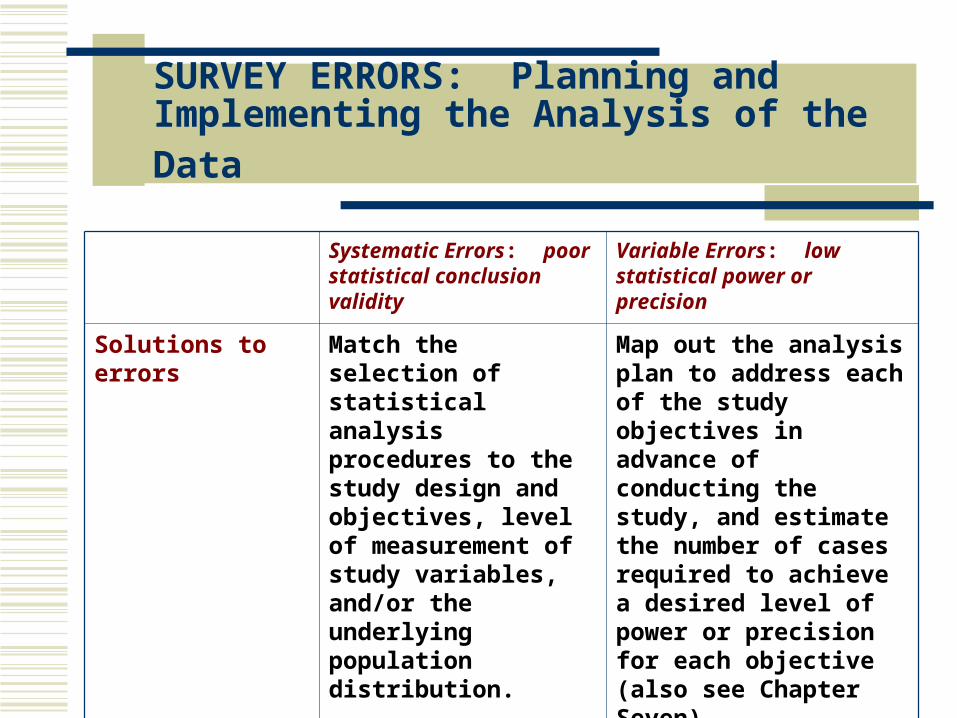
SURVEY ERRORS: Planning and Implementing the Analysis of the Data
Systematic Errors: poor statistical conclusion validity
Variable Errors: low statistical power or precision
Solutions to errors
Match the selection of statistical analysis procedures to the study design and objectives, level of measurement of study variables, and/or the underlying population distribution.
Map out the analysis plan to address each of the study objectives in advance of conducting the study, and estimate the number of cases required to achieve a desired level of power or precision for each objective (also see Chapter Seven).