analyst meeting - listed company
TRANSCRIPT

ANALYST MEETING
FY2020
February 23, 2021
2
TABLE OF CONTENT
01
03 Business Direction and 2021 Guidance
2020 A Busy Year
02 2020 Business & Financial Performance
3
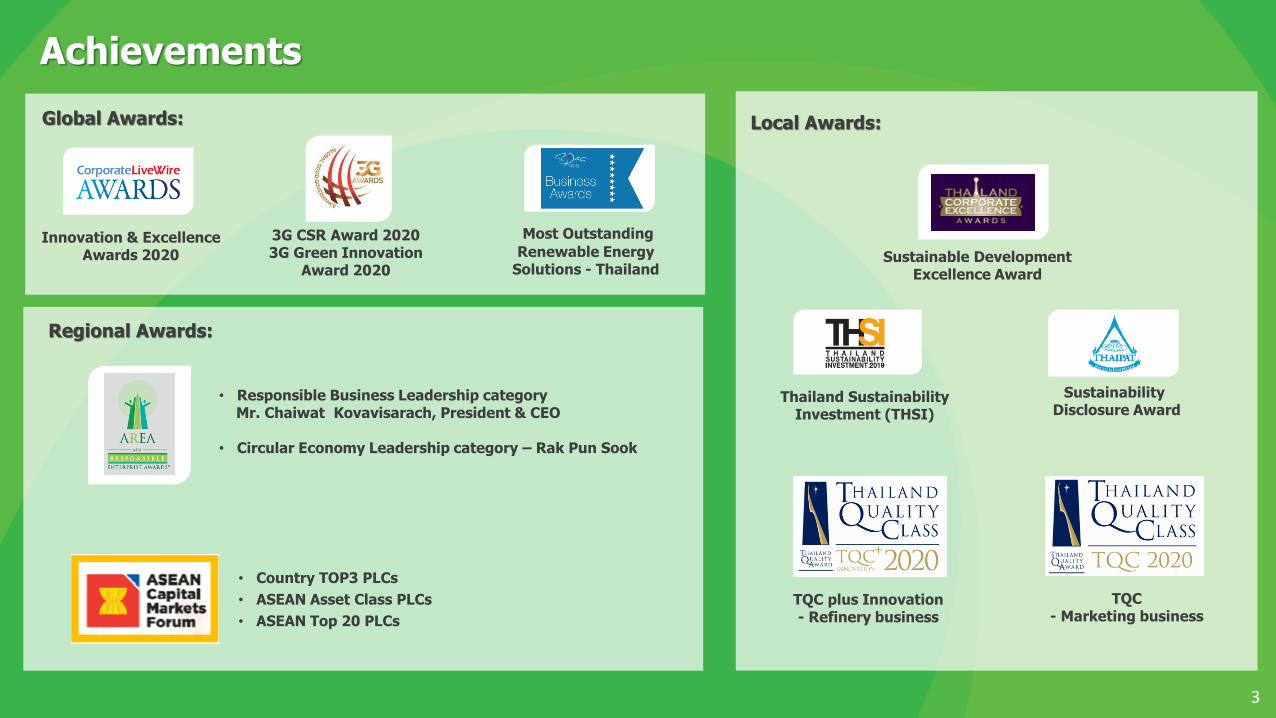
Achievements
Innovation & Excellence Awards 2020
3G CSR Award 20203G Green Innovation
Award 2020
• Responsible Business Leadership category Mr. Chaiwat Kovavisarach, President & CEO
• Circular Economy Leadership category – Rak Pun Sook
Sustainable Development Excellence Award
Thailand Sustainability Investment (THSI)
Sustainability Disclosure Award
Local Awards:
Regional Awards:
Global Awards:
Most Outstanding
Renewable Energy Solutions - Thailand
• Country TOP3 PLCs
• ASEAN Asset Class PLCs
• ASEAN Top 20 PLCs
TQC plus Innovation - Refinery business
TQC- Marketing business

4
2020 DJSI Ranking: Oil & Gas Refining & Marketing Industry
83
Thailand
Thailand
Korea
Finland
Korea
Thailand
Chile
Chile
India
New Zealand
Thailand
Thailand
Finland
Thailand
Korea
Korea
Chile
US
Brazil
India
2020 DJSI Ranking2018 DJSI Ranking
Source: spglobal.com/yearbook
5
0
20
40
60
80
100
120
140
160
180
200
Jan-20 Feb-20 Mar-20 Apr-20 May-20 Jun-20 Jul-20 Aug-20 Sep-20 Oct-20 Nov-20 Dec-20
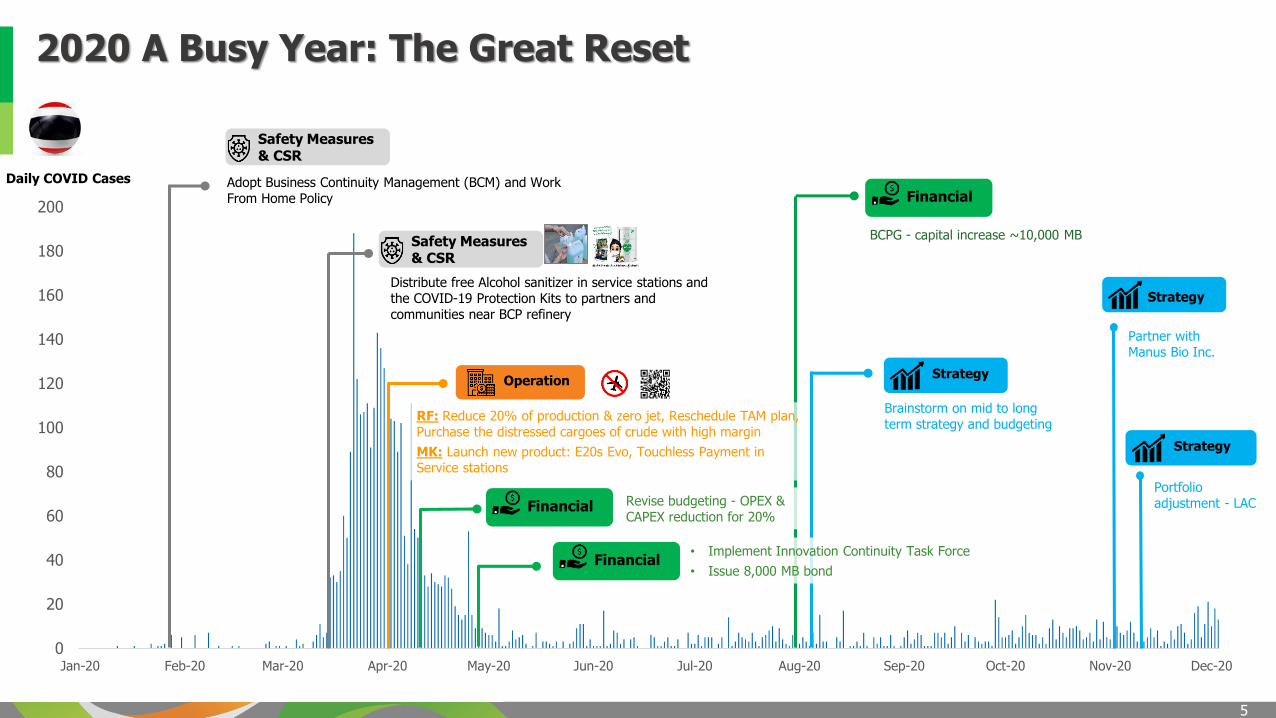
Brainstorm on mid to long term strategy and budgeting
Strategy
Daily COVID Cases Adopt Business Continuity Management (BCM) and Work From Home Policy
Safety Measures & CSR
Distribute free Alcohol sanitizer in service stations and the COVID-19 Protection Kits to partners and communities near BCP refinery
BCPG - capital increase ~10,000 MB
Portfolio adjustment - LAC
RF: Reduce 20% of production & zero jet, Reschedule TAM plan, Purchase the distressed cargoes of crude with high margin
MK: Launch new product: E20s Evo, Touchless Payment in Service stations
Operation
• Implement Innovation Continuity Task Force
• Issue 8,000 MB bondFinancial
2020 A Busy Year: The Great Reset
Strategy
Financial
Safety Measures & CSR
Revise budgeting - OPEX & CAPEX reduction for 20%
Financial
Strategy
Partner with Manus Bio Inc.
6
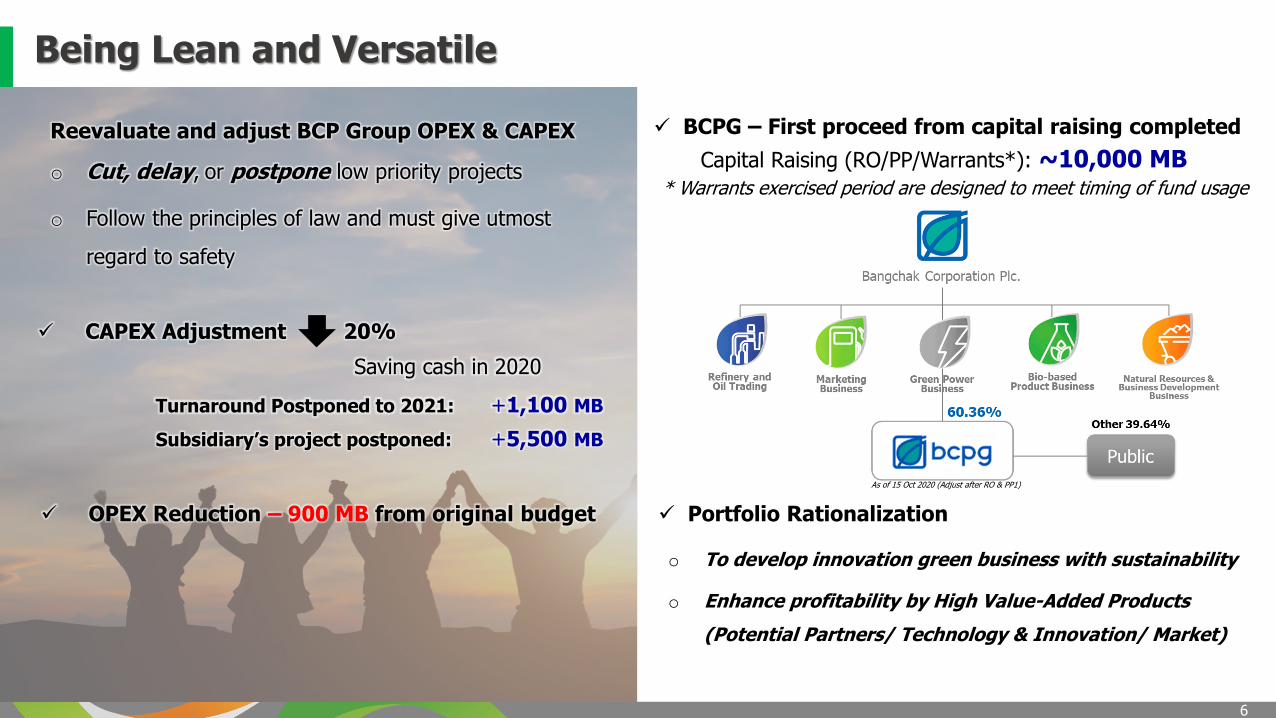
Reevaluate and adjust BCP Group OPEX & CAPEX
o Cut, delay, or postpone low priority projects
o Follow the principles of law and must give utmost
regard to safety
CAPEX Adjustment 20%
Saving cash in 2020
Turnaround Postponed to 2021: +1,100 MB
Subsidiary’s project postponed: +5,500 MB
OPEX Reduction – 900 MB from original budget
* Warrants exercised period are designed to meet timing of fund usage
BCPG – First proceed from capital raising completed
Capital Raising (RO/PP/Warrants*): ~10,000 MB
Portfolio Rationalization
o To develop innovation green business with sustainability
o Enhance profitability by High Value-Added Products
(Potential Partners/ Technology & Innovation/ Market)
As of 15 Oct 2020 (Adjust after RO & PP1)
Being Lean and Versatile
7
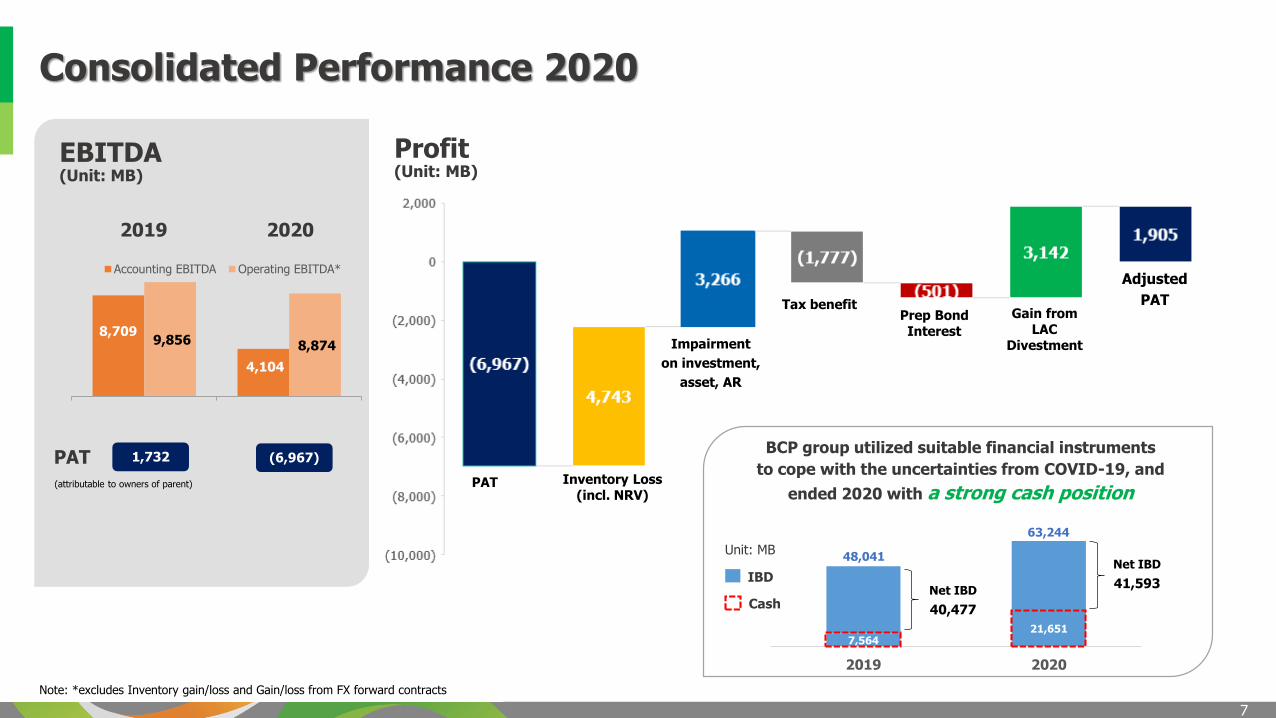
Consolidated Performance 2020
Adjusted
PAT
Inventory Loss(incl. NRV)
PAT
Prep Bond Interest
Impairment
on investment,
asset, AR
Tax benefitGain from
LAC Divestment
Profit(Unit: MB)
EBITDA(Unit: MB)
2019 2020
8,709
4,104
9,856 8,874
Accounting EBITDA Operating EBITDA*
PAT 1,732 (6,967)
(attributable to owners of parent)
Note: *excludes Inventory gain/loss and Gain/loss from FX forward contracts
7,56421,651
2019 2020
48,041
63,244
Net IBD
41,593Net IBD
40,477
BCP group utilized suitable financial instruments
to cope with the uncertainties from COVID-19, and
ended 2020 with a strong cash position
Cash
IBD
Unit: MB
8
01
TABLE OF CONTENT
2020 A Busy Year
03 2021 Business Direction and Guidance
02 2020 Business & Financial Performance
1,732
(757)
(68)
(1,701)
(5,032)
-
(34)
614
8,709
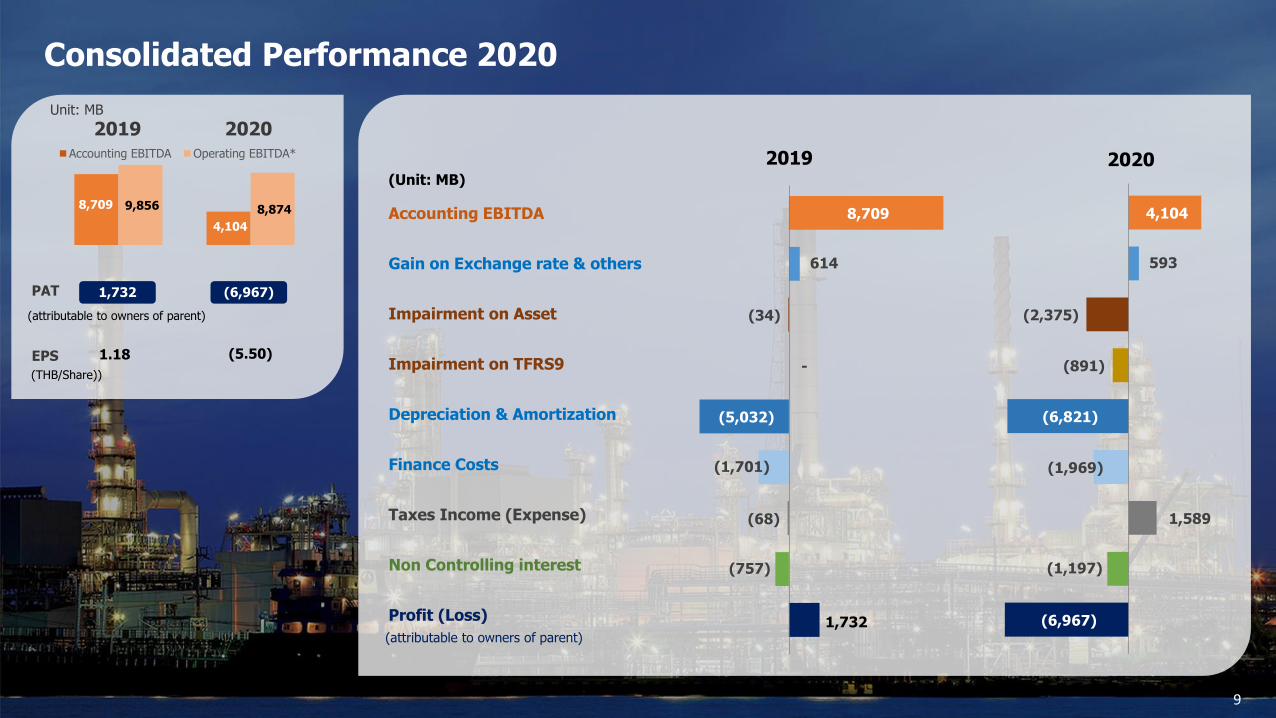
Consolidated Performance 2020
Accounting EBITDA
Depreciation & Amortization
Gain on Exchange rate & others
Impairment on Asset
Impairment on TFRS9
Finance Costs
Taxes Income (Expense)
Non Controlling interest
Profit (Loss)
(Unit: MB)
2019
(attributable to owners of parent)
9
Unit: MB
2019 2020
8,709
4,104
9,856 8,874
Accounting EBITDA Operating EBITDA*
PAT 1,732 (6,967)
(attributable to owners of parent)
(6,967)
(1,197)
1,589
(1,969)
(6,821)
(891)
(2,375)
593
4,104
2020
EPS (5.50)
(THB/Share))
1.18
10
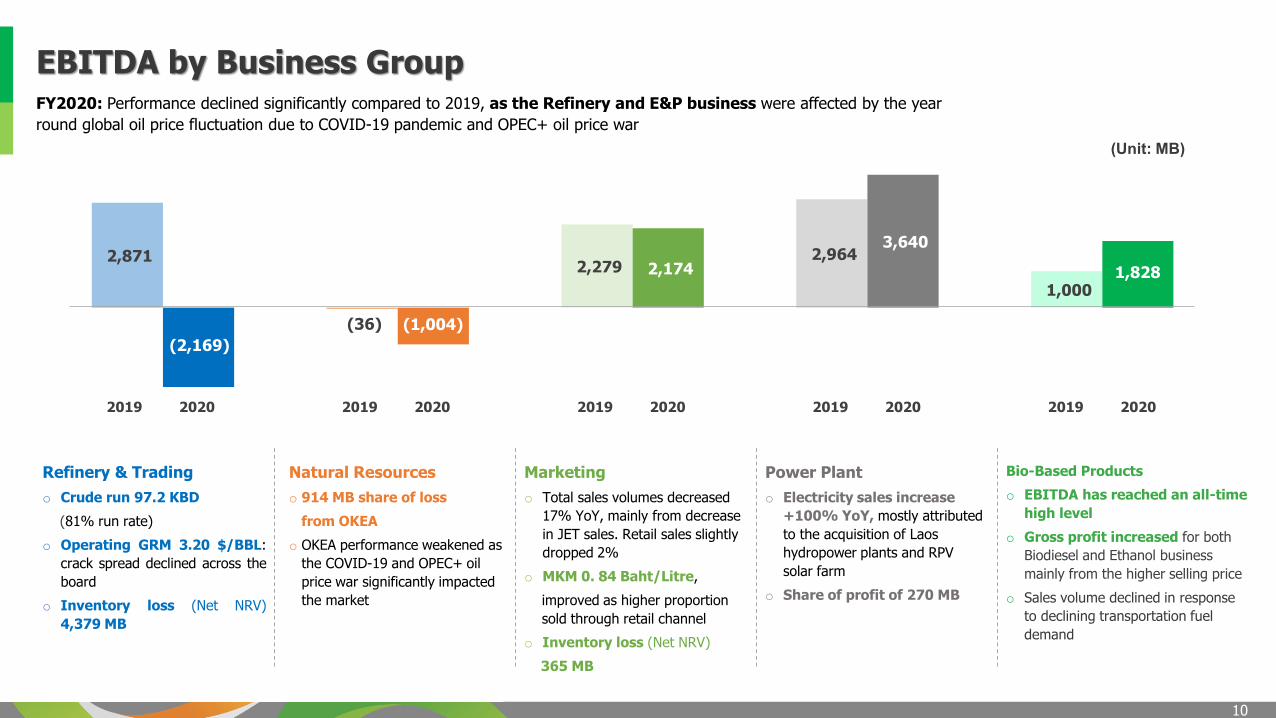
2,871
(36)
2,279 2,964
1,000
(2,169)
(1,004)
2,174
3,640
1,828
EBITDA by Business Group
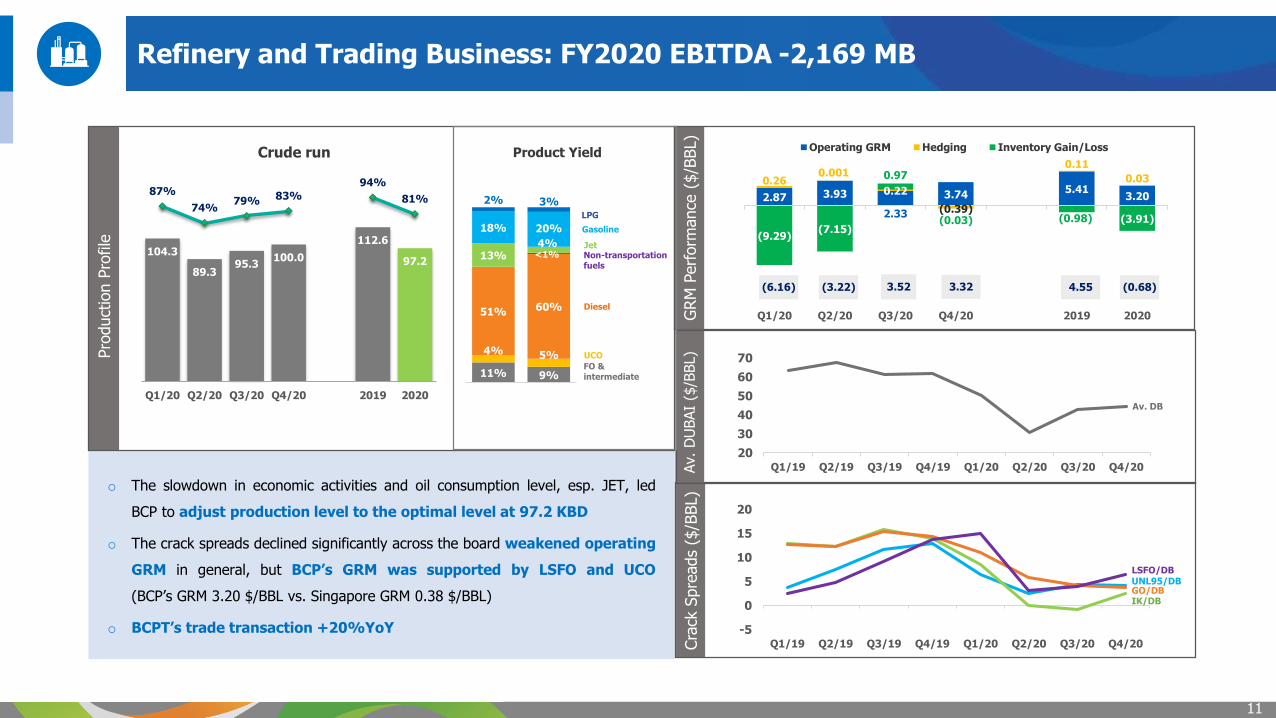
Refinery & Trading
o Crude run 97.2 KBD
(81% run rate)
o Operating GRM 3.20 $/BBL:
crack spread declined across the
board
o Inventory loss (Net NRV)
4,379 MB
Natural Resources
o 914 MB share of loss
from OKEA
o OKEA performance weakened as
the COVID-19 and OPEC+ oil
price war significantly impacted
the market
Power Plant
o Electricity sales increase
+100% YoY, mostly attributed
to the acquisition of Laos
hydropower plants and RPV
solar farm
o Share of profit of 270 MB
Marketing
o Total sales volumes decreased
17% YoY, mainly from decrease
in JET sales. Retail sales slightly
dropped 2%
o MKM 0. 84 Baht/Litre,
improved as higher proportion
sold through retail channel
o Inventory loss (Net NRV)
365 MB
Bio-Based Products
o EBITDA has reached an all-time
high level
o Gross profit increased for both
Biodiesel and Ethanol business
mainly from the higher selling price
o Sales volume declined in response
to declining transportation fuel
demand
(Unit: MB)
FY2020: Performance declined significantly compared to 2019, as the Refinery and E&P business were affected by the year
round global oil price fluctuation due to COVID-19 pandemic and OPEC+ oil price war
2019 2020 2019 2020 2019 20202019 20202019 2020
11
104.3
89.395.3
100.0
112.6
97.2
87%
74%79% 83%
94%
81%
-50%
-30%
-10%
10%
30%
50%
70%
90%
0.010.020.030.040.050.060.070.080.090.0100.0110.0120.0130.0140.0
Q1/20 Q2/20 Q3/20 Q4/20 2019 2020
11% 9%
4% 5%
51% 60%
13%4%
18% 20%
2% 3%
2019 2020
-5
0
5
10
15
20
Q1/19 Q2/19 Q3/19 Q4/19 Q1/20 Q2/20 Q3/20 Q4/20
o The slowdown in economic activities and oil consumption level, esp. JET, led
BCP to adjust production level to the optimal level at 97.2 KBD
o The crack spreads declined significantly across the board weakened operating
GRM in general, but BCP’s GRM was supported by LSFO and UCO
(BCP’s GRM 3.20 $/BBL vs. Singapore GRM 0.38 $/BBL)
o BCPT’s trade transaction +20%YoY
2.87 3.93
2.33
3.74 5.41
3.20
0.26 0.001
0.22
(0.39)
0.11
0.03
(9.29)(7.15)
0.97
(0.03) (0.98) (3.91)
Q1/20 Q2/20 Q3/20 Q4/20 2019 2020
Operating GRM Hedging Inventory Gain/Loss
Refinery and Trading Business: FY2020 EBITDA -2,169 MB
GO/DBUNL95/DB
IK/DB
LSFO/DB
Cra
ck S
pre
ads
($/B
BL)
GRM
Perf
orm
ance
($/B
BL)
Pro
duct
ion P
rofile
Crude run
LPG
Gasoline
Diesel
UCO
FO & intermediate
Product Yield
JetNon-transportation fuels
(6.16) (3.22) 3.52 4.55 (0.68)3.32
<1%
20
30
40
50
60
70
Q1/19 Q2/19 Q3/19 Q4/19 Q1/20 Q2/20 Q3/20 Q4/20
Av. DB
Av. D
UBAI
($/B
BL)
12
15.9
%
12.2
%
11.8
%
10.0
%
4.1
%
2.0
%
1.8
%
1.7
%15.6
%
11.0
%
11.6
%
9.6
%
4.2
%
2.4
%
2.0
%
1.5
%
FY2019 FY2020
Retail
Industrial
Marketing Business: FY2020 EBITDA 2,174MB
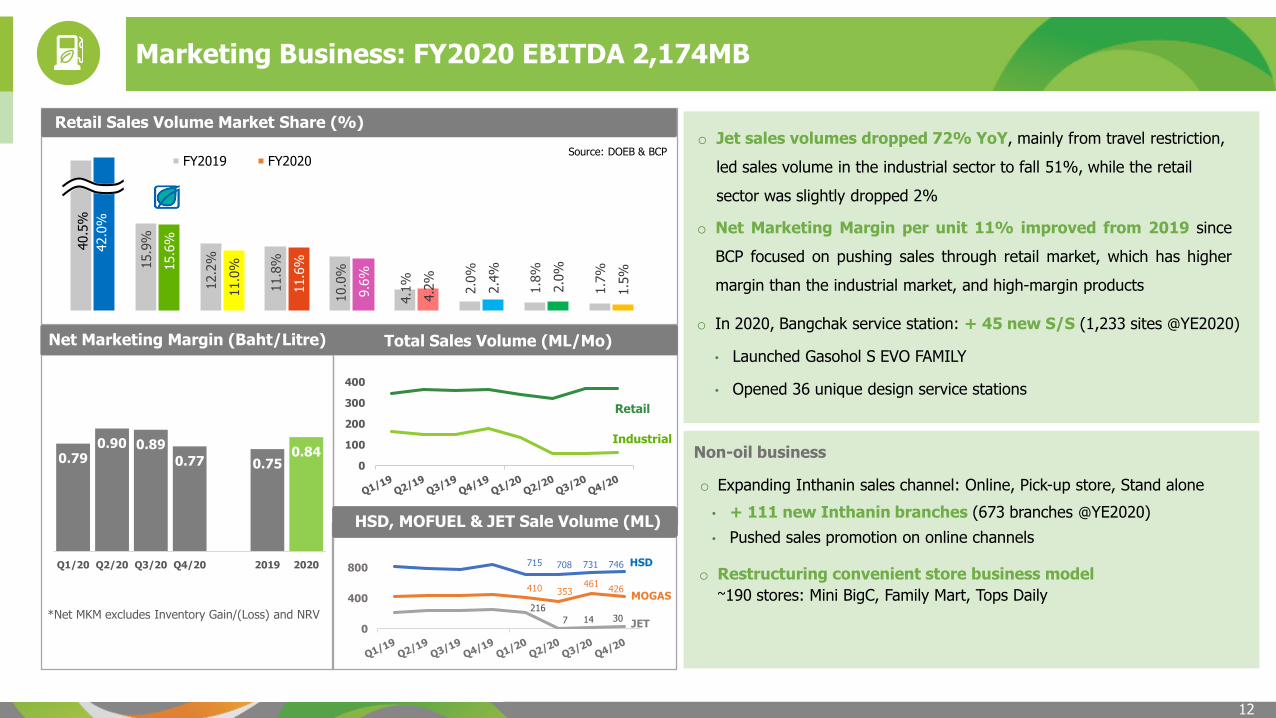
o Net Marketing Margin per unit 11% improved from 2019 since
BCP focused on pushing sales through retail market, which has higher
margin than the industrial market, and high-margin products
0.790.90 0.89
0.77 0.750.84
Q1/20 Q2/20 Q3/20 Q4/20 2019 2020
*Net MKM excludes Inventory Gain/(Loss) and NRV
Net Marketing Margin (Baht/Litre) Total Sales Volume (ML/Mo)
Source: DOEB & BCP
Retail Sales Volume Market Share (%)
0
100
200
300
400
Non-oil business
o Expanding Inthanin sales channel: Online, Pick-up store, Stand alone
• + 111 new Inthanin branches (673 branches @YE2020)
• Pushed sales promotion on online channels
715 708 731 746
410 353 461
426
216
7 14 30 0
400
800HSD
MOGAS
JET
HSD, MOFUEL & JET Sale Volume (ML)
o In 2020, Bangchak service station: + 45 new S/S (1,233 sites @YE2020)
• Launched Gasohol S EVO FAMILY
• Opened 36 unique design service stations
o Restructuring convenient store business model
~190 stores: Mini BigC, Family Mart, Tops Daily
40.5
%
42.0
%
o Jet sales volumes dropped 72% YoY, mainly from travel restriction,
led sales volume in the industrial sector to fall 51%, while the retail
sector was slightly dropped 2%
13
Power Plant Business: FY2020 EBITDA 3,640 MB
152 152172 172 150 172
15 1515 15
1515
158 158158 158
158158
14 1414 14
1414
114 114114 114
69
114
452 452472 472
406
472
Q1/20 Q2/20 Q3/20 Q4/20 2019 2020
Solar & Wind
Solar
Geothermal
Wind
Hydro
Operating Capacity (MW PPA)
75 74 76 77
297 303
3 5 5 4
1817
34 73189 157
72
453
113 151
270 239
387
773
Q1/20 Q2/20 Q3/20 Q4/20 2019 2020
Laos JP TH
Electricity Sales (Million kWh)
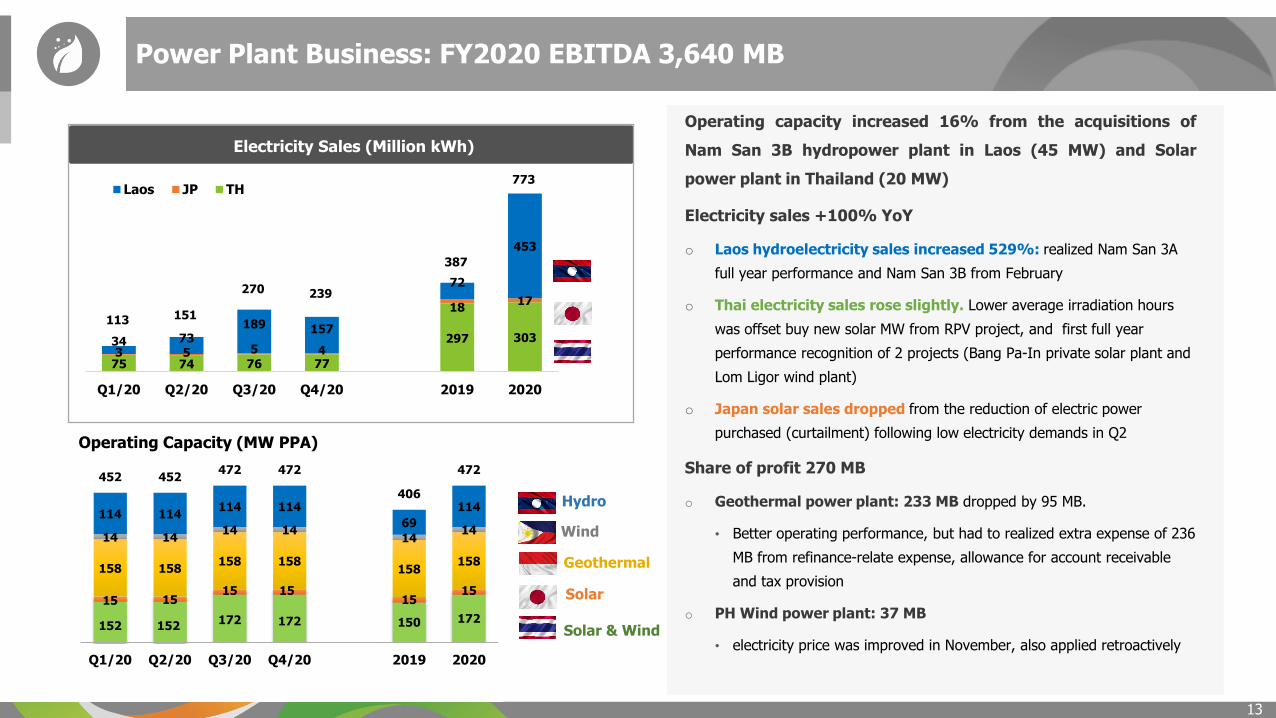
Operating capacity increased 16% from the acquisitions of
Nam San 3B hydropower plant in Laos (45 MW) and Solar
power plant in Thailand (20 MW)
Electricity sales +100% YoY
o Laos hydroelectricity sales increased 529%: realized Nam San 3A
full year performance and Nam San 3B from February
o Thai electricity sales rose slightly. Lower average irradiation hours
was offset buy new solar MW from RPV project, and first full year
performance recognition of 2 projects (Bang Pa-In private solar plant and
Lom Ligor wind plant)
o Japan solar sales dropped from the reduction of electric power
purchased (curtailment) following low electricity demands in Q2
Share of profit 270 MB
o Geothermal power plant: 233 MB dropped by 95 MB.
• Better operating performance, but had to realized extra expense of 236
MB from refinance-relate expense, allowance for account receivable
and tax provision
o PH Wind power plant: 37 MB
• electricity price was improved in November, also applied retroactively
14
POWER PLANT BUSINESSBio-Based Product Business: FY2020 EBITDA 1,828 MB
61
60
66
72
29
9
25
8
69
63
67
77
32
8
27
6
Q1/20 Q2/20 Q3/20 Q4/20 2019 2020
Production Sales volume
41.49
42.29
15
20
25
30
35
40
45
Ja
n-1
9
Ap
r-1
9
Ju
l-1
9
Oct-
19
Ja
n-2
0
Ap
r-2
0
Ju
l-2
0
Oct-
20
Ja
n-2
1
Source: EPPO
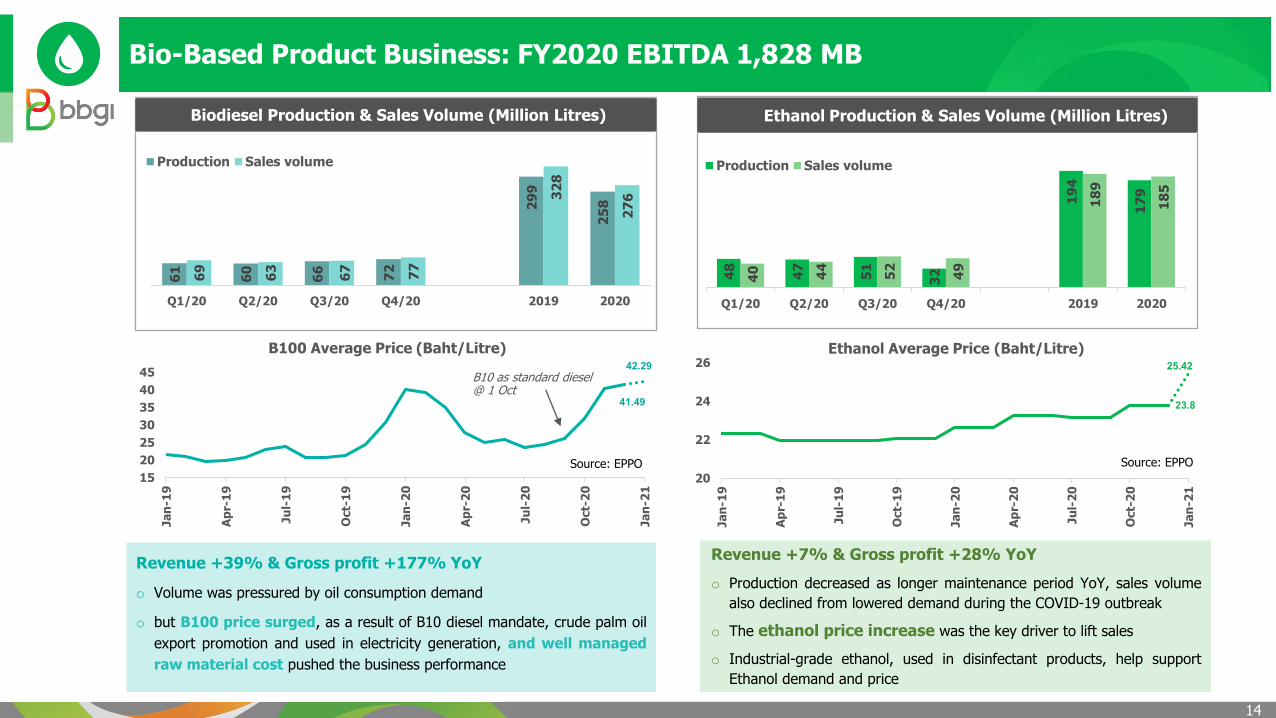
Revenue +39% & Gross profit +177% YoY
o Volume was pressured by oil consumption demand
o but B100 price surged, as a result of B10 diesel mandate, crude palm oil
export promotion and used in electricity generation, and well managed
raw material cost pushed the business performance
B100 Average Price (Baht/Litre)
Biodiesel Production & Sales Volume (Million Litres) Ethanol Production & Sales Volume (Million Litres)
48
47
51
32
19
4
17
9
40 44
52
49
18
9
18
5
Q1/20 Q2/20 Q3/20 Q4/20 2019 2020
Production Sales volume
Ethanol Average Price (Baht/Litre)
23.8
25.42
20
22
24
26
Ja
n-1
9
Ap
r-1
9
Ju
l-1
9
Oct-
19
Ja
n-2
0
Ap
r-2
0
Ju
l-2
0
Oct-
20
Ja
n-2
1
Source: EPPO
Revenue +7% & Gross profit +28% YoY
o Production decreased as longer maintenance period YoY, sales volume
also declined from lowered demand during the COVID-19 outbreak
o The ethanol price increase was the key driver to lift sales
o Industrial-grade ethanol, used in disinfectant products, help support
Ethanol demand and price
B10 as standard diesel @ 1 Oct
15
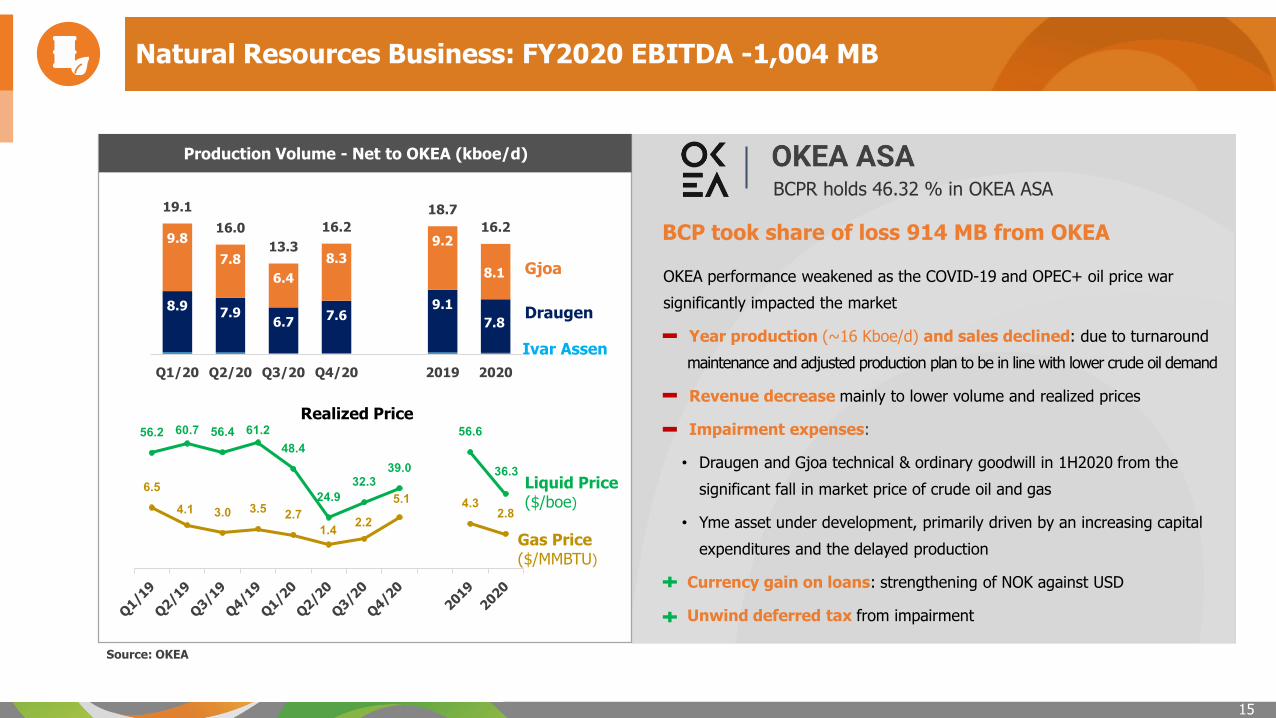
OKEA performance weakened as the COVID-19 and OPEC+ oil price war
significantly impacted the market
Year production (~16 Kboe/d) and sales declined: due to turnaround
maintenance and adjusted production plan to be in line with lower crude oil demand
Revenue decrease mainly to lower volume and realized prices
Impairment expenses:
• Draugen and Gjoa technical & ordinary goodwill in 1H2020 from the
significant fall in market price of crude oil and gas
• Yme asset under development, primarily driven by an increasing capital
expenditures and the delayed production
Currency gain on loans: strengthening of NOK against USD
Unwind deferred tax from impairment
Natural Resources Business: FY2020 EBITDA -1,004 MB
Realized Price
Source: OKEA
8.97.9
6.77.6
9.1
7.8
9.8
7.8
6.4
8.3
9.2
8.1
19.1
16.0
13.3
16.2
18.7
16.2
Q1/20 Q2/20 Q3/20 Q4/20 2019 2020
Ivar Assen
Gjoa
Draugen
56.2 60.7 56.4 61.248.4
24.932.3
39.0
56.6
36.36.5
4.1 3.0 3.5 2.71.4 2.2
5.1 4.3 2.8
Gas Price ($/MMBTU)
Liquid Price ($/boe)
Production Volume - Net to OKEA (kboe/d)
BCPR holds 46.32 % in OKEA ASA
BCP took share of loss 914 MB from OKEA
16
Unit: MB
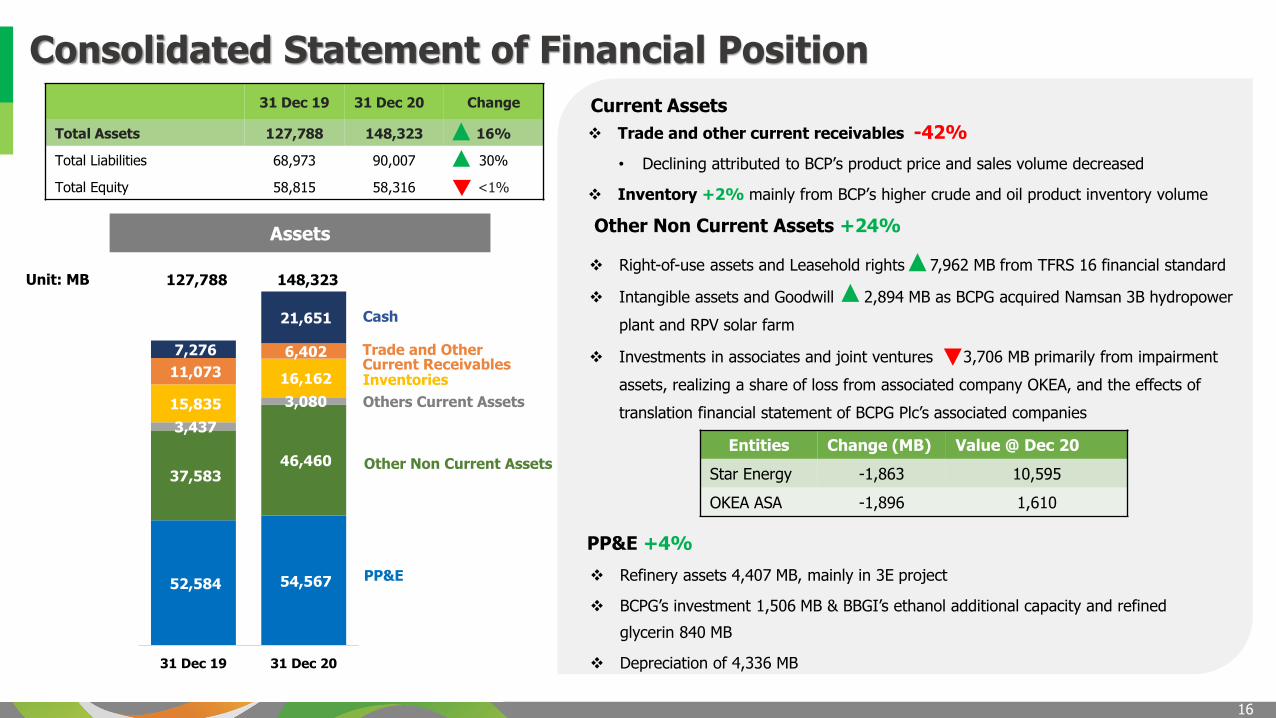
Assets
31 Dec 19 31 Dec 20 Change
Total Assets 127,788 148,323 16%
Total Liabilities 68,973 90,007 30%
Total Equity 58,815 58,316 <1%
Trade and other current receivables -42%
• Declining attributed to BCP’s product price and sales volume decreased
Inventory +2% mainly from BCP’s higher crude and oil product inventory volume
Other Non Current Assets +24%
Current Assets
Right-of-use assets and Leasehold rights 7,962 MB from TFRS 16 financial standard
Intangible assets and Goodwill 2,894 MB as BCPG acquired Namsan 3B hydropower
plant and RPV solar farm
Investments in associates and joint ventures 3,706 MB primarily from impairment
assets, realizing a share of loss from associated company OKEA, and the effects of
translation financial statement of BCPG Plc’s associated companies
PP&E +4%
Refinery assets 4,407 MB, mainly in 3E project
BCPG’s investment 1,506 MB & BBGI’s ethanol additional capacity and refined
glycerin 840 MB
Depreciation of 4,336 MB
52,584 54,567
37,583 46,460
3,437
3,080 15,835
16,162 11,073
6,402 7,276
21,651
31 Dec 19 31 Dec 20
Cash
Others Current Assets
PP&E
Inventories
Other Non Current Assets
148,323127,788
Trade and Other Current Receivables
Entities Change (MB) Value @ Dec 20
Star Energy -1,863 10,595
OKEA ASA -1,896 1,610
Consolidated Statement of Financial Position
17
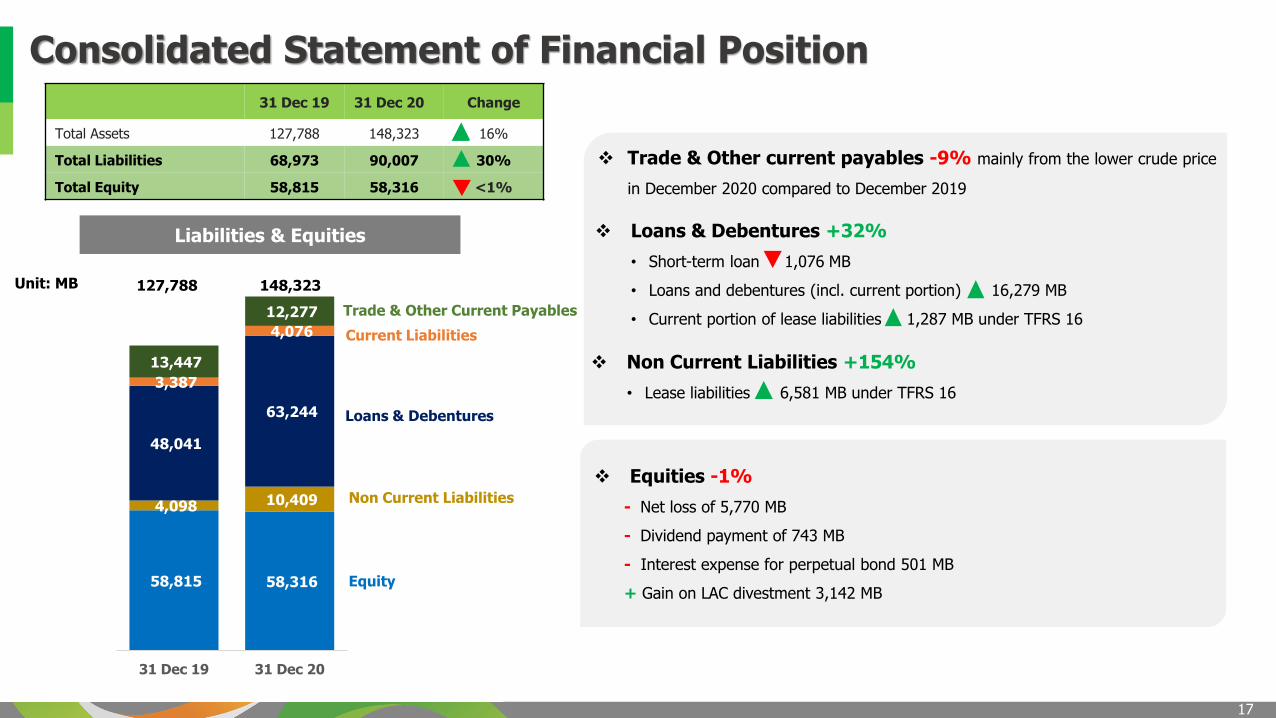
Unit: MB
Liabilities & Equities
Equities -1%
- Net loss of 5,770 MB
- Dividend payment of 743 MB
- Interest expense for perpetual bond 501 MB
+ Gain on LAC divestment 3,142 MB
Trade & Other current payables -9% mainly from the lower crude price
in December 2020 compared to December 2019
Non Current Liabilities +154%
• Lease liabilities 6,581 MB under TFRS 16
Loans & Debentures +32%
• Short-term loan 1,076 MB
• Loans and debentures (incl. current portion) 16,279 MB
• Current portion of lease liabilities 1,287 MB under TFRS 16
31 Dec 19 31 Dec 20 Change
Total Assets 127,788 148,323 16%
Total Liabilities 68,973 90,007 30%
Total Equity 58,815 58,316 <1%
58,815 58,316
4,098 10,409
48,041
63,244
3,387
4,076
13,447
12,277
31 Dec 19 31 Dec 20
Trade & Other Current Payables
Loans & Debentures
Equity
Current Liabilities
Non Current Liabilities
148,323127,788
Consolidated Statement of Financial Position
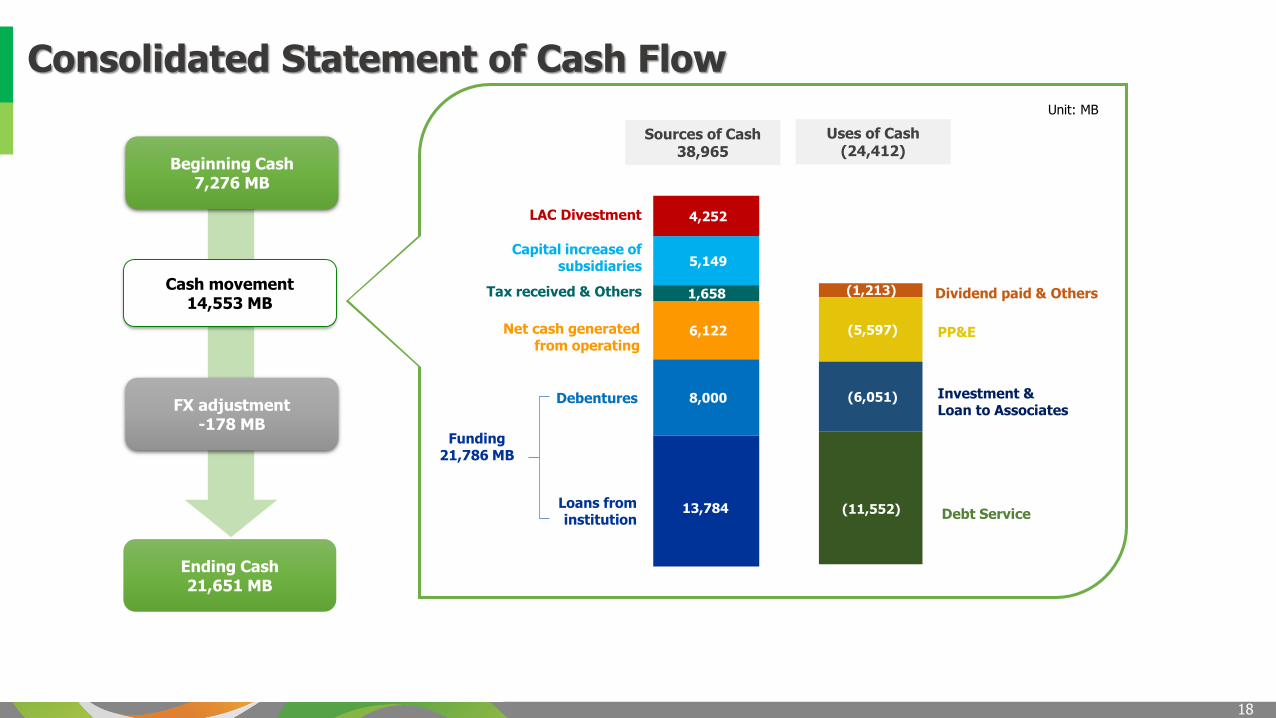
18
Beginning Cash7,276 MB
Ending Cash21,651 MB
FX adjustment-178 MB
Cash movement 14,553 MB
Consolidated Statement of Cash Flow
13,784
8,000
6,122
1,658
5,149
4,252
(1,213)
(5,597)
(6,051)
(11,552) Debt Service
PP&E
Investment & Loan to Associates
Dividend paid & OthersTax received & Others
Funding21,786 MB
Unit: MB
Sources of Cash38,965
Uses of Cash(24,412)
Net cash generated from operating
Loans from institution
Debentures
Capital increase of subsidiaries
LAC Divestment
19
01
03
TABLE OF CONTENT
2020 A Busy Year
02 2020 Business & Financial Performance
Business Direction and 2021 Guidance
20
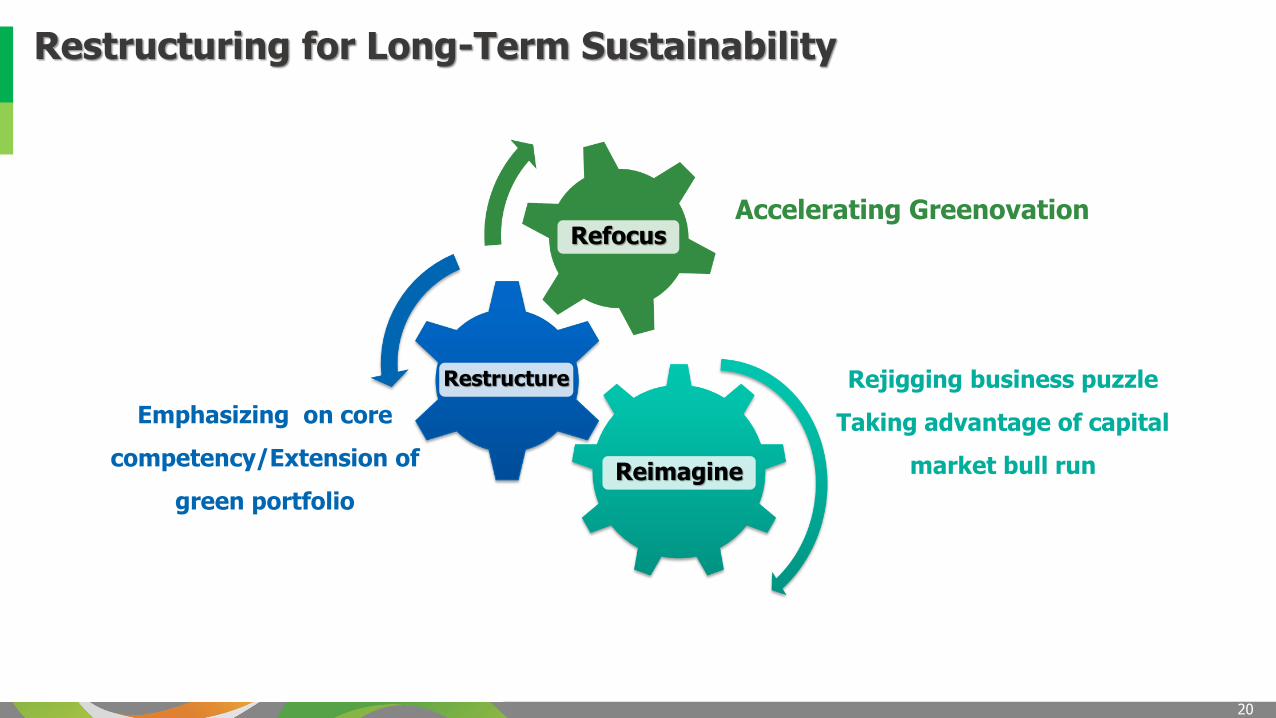
Refocus
Reimagine
Restructure Rejigging business puzzle
Taking advantage of capital
market bull run
Emphasizing on core
competency/Extension of
green portfolio
Accelerating Greenovation
Restructuring for Long-Term Sustainability
21
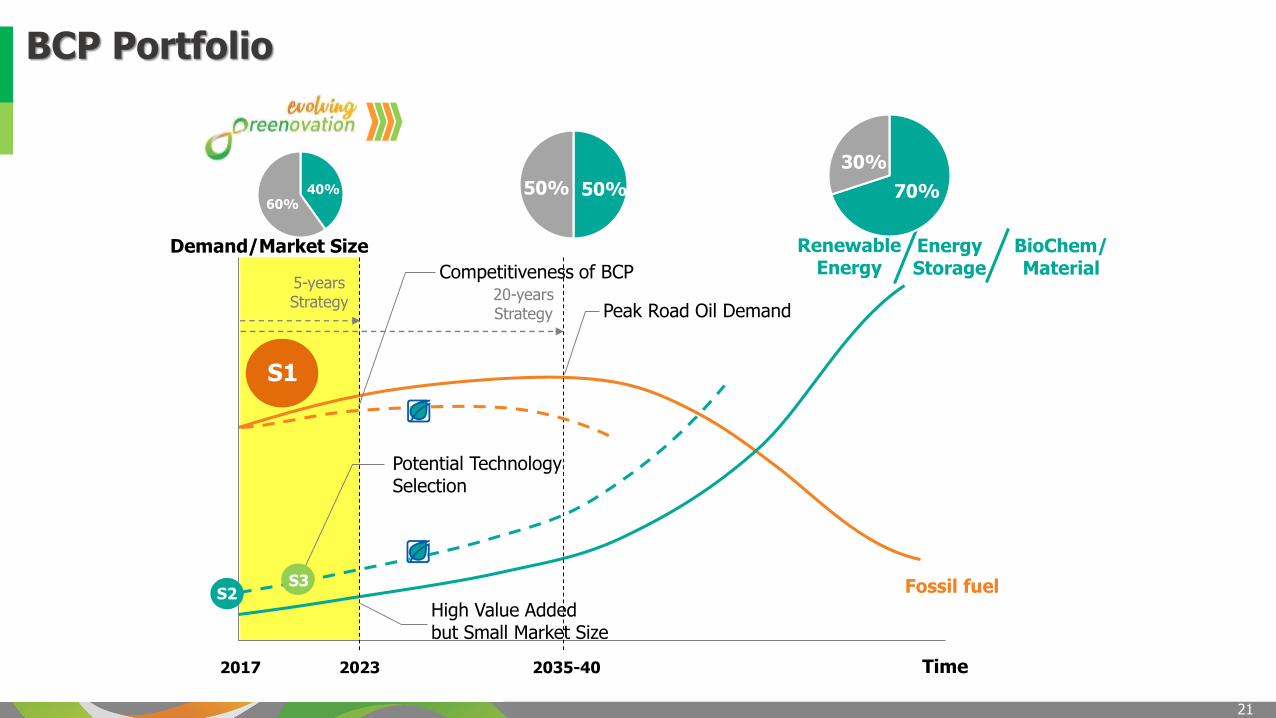
2017 2023 2035-40
Demand/Market Size
Time
Peak Road Oil Demand
5-yearsStrategy
High Value Added but Small Market Size
20-yearsStrategy
Competitiveness of BCP
Potential TechnologySelection
Fossil fuel
RenewableEnergy
S1
50%50%
EnergyStorage
BioChem/Material
40%60%
70%
30%
S2S3
BCP Portfolio
22
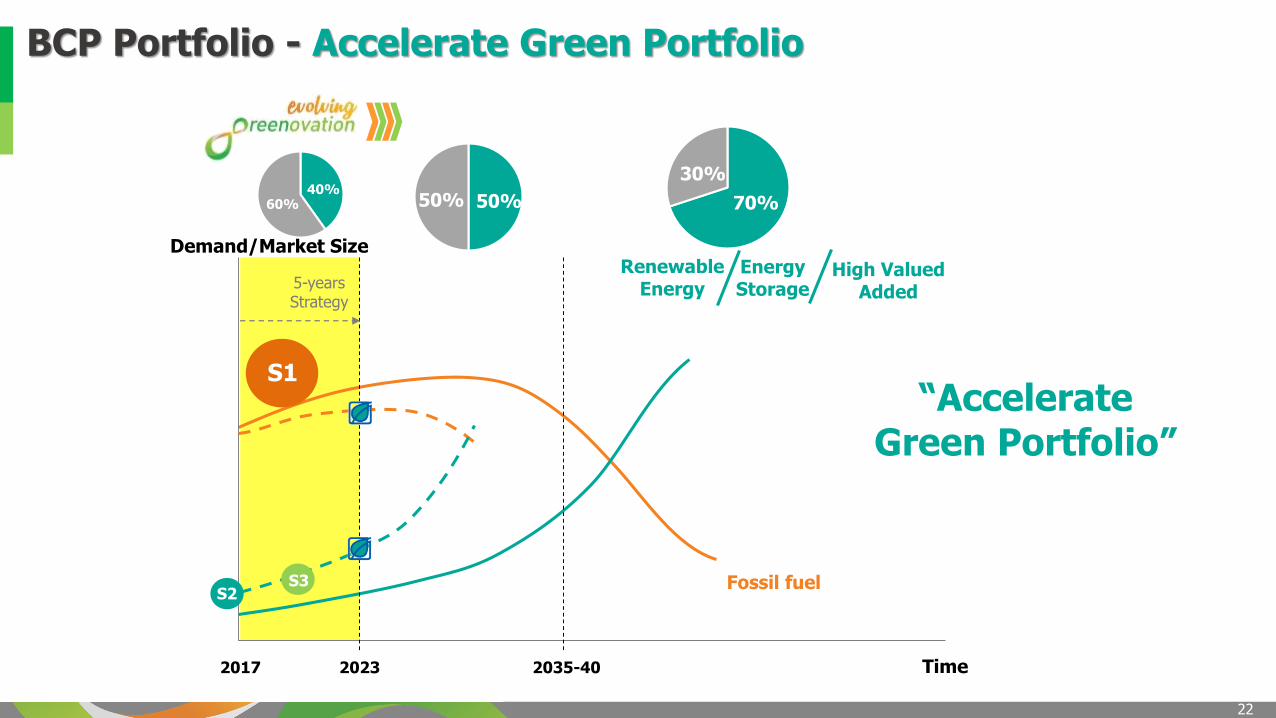
BCP Portfolio - Accelerate Green Portfolio
2017 2023 2035-40
Demand/Market Size
Time
5-yearsStrategy
Fossil fuel
RenewableEnergy
S1
50%50%
EnergyStorage
High ValuedAdded
40%60% 70%
30%
S2S3
“Accelerate Green Portfolio”
23
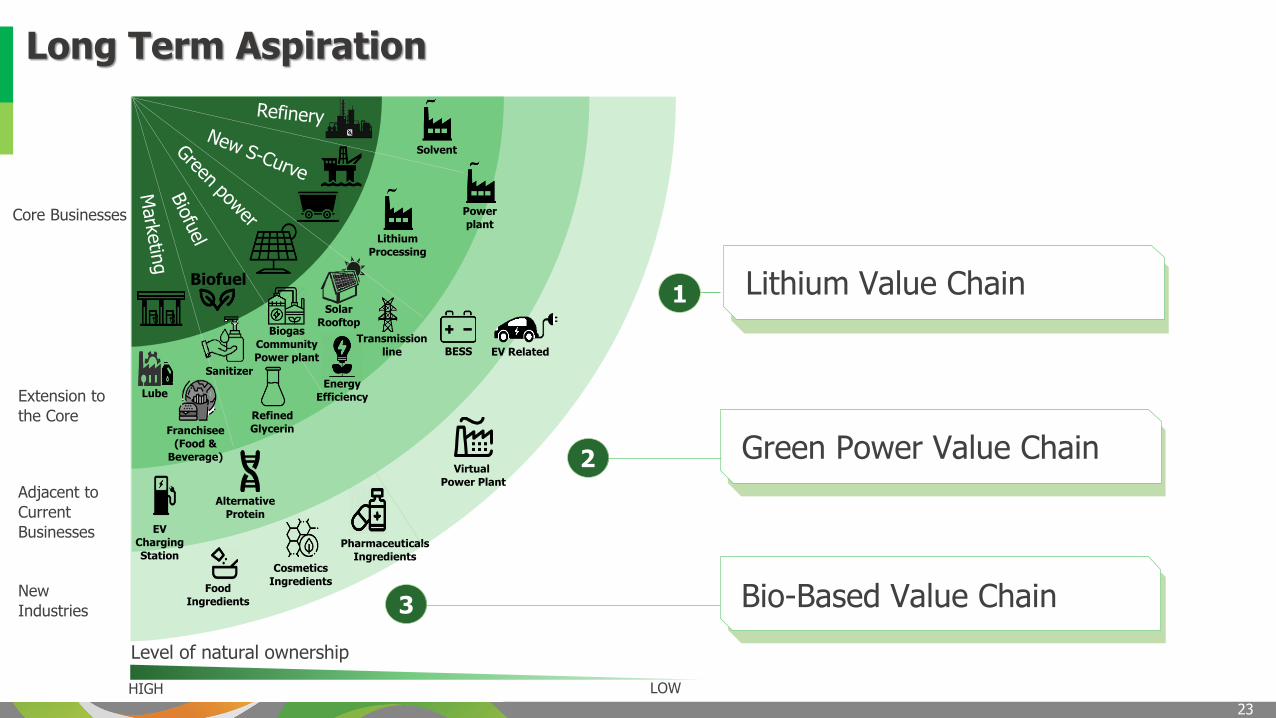
Long Term Aspiration
HIGH LOW
Level of natural ownership
Core Businesses
Extension to
the Core
Adjacent to
Current
Businesses
Lube
Food
Ingredients
Cosmetics
Ingredients
Pharmaceuticals
Ingredients
Refined
Glycerin
EV
Charging
Station
Lithium
Processing
New
Industries
Alternative
Protein
Virtual
Power Plant
Solvent
Power
plant
Franchisee
(Food &
Beverage)
Biofuel
Energy
Efficiency
Transmission
line
Sanitizer
EV Related
Solar
RooftopBiogas
Community
Power plantBESS
1
Green Power Value Chain2
Bio-Based Value Chain3
Lithium Value Chain
24
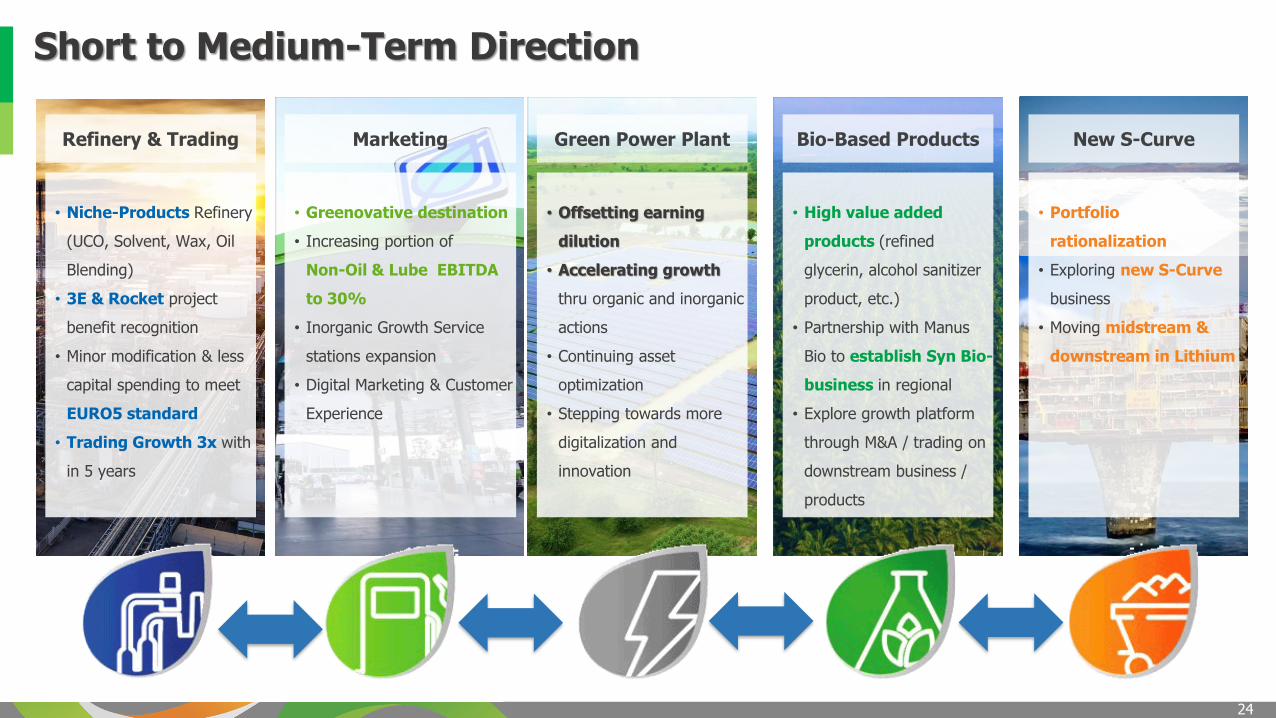
Short to Medium-Term Direction
• Niche-Products Refinery
(UCO, Solvent, Wax, Oil
Blending)
• 3E & Rocket project
benefit recognition
• Minor modification & less
capital spending to meet
EURO5 standard
• Trading Growth 3x with
in 5 years
Refinery & Trading Marketing Green Power Plant Bio-Based Products New S-Curve
• Greenovative destination
• Increasing portion of
Non-Oil & Lube EBITDA
to 30%
• Inorganic Growth Service
stations expansion
• Digital Marketing & Customer
Experience
• Offsetting earning
dilution
• Accelerating growth
thru organic and inorganic
actions
• Continuing asset
optimization
• Stepping towards more
digitalization and
innovation
• High value added
products (refined
glycerin, alcohol sanitizer
product, etc.)
• Partnership with Manus
Bio to establish Syn Bio-
business in regional
• Explore growth platform
through M&A / trading on
downstream business /
products
• Portfolio
rationalization
• Exploring new S-Curve
business
• Moving midstream &
downstream in Lithium
25
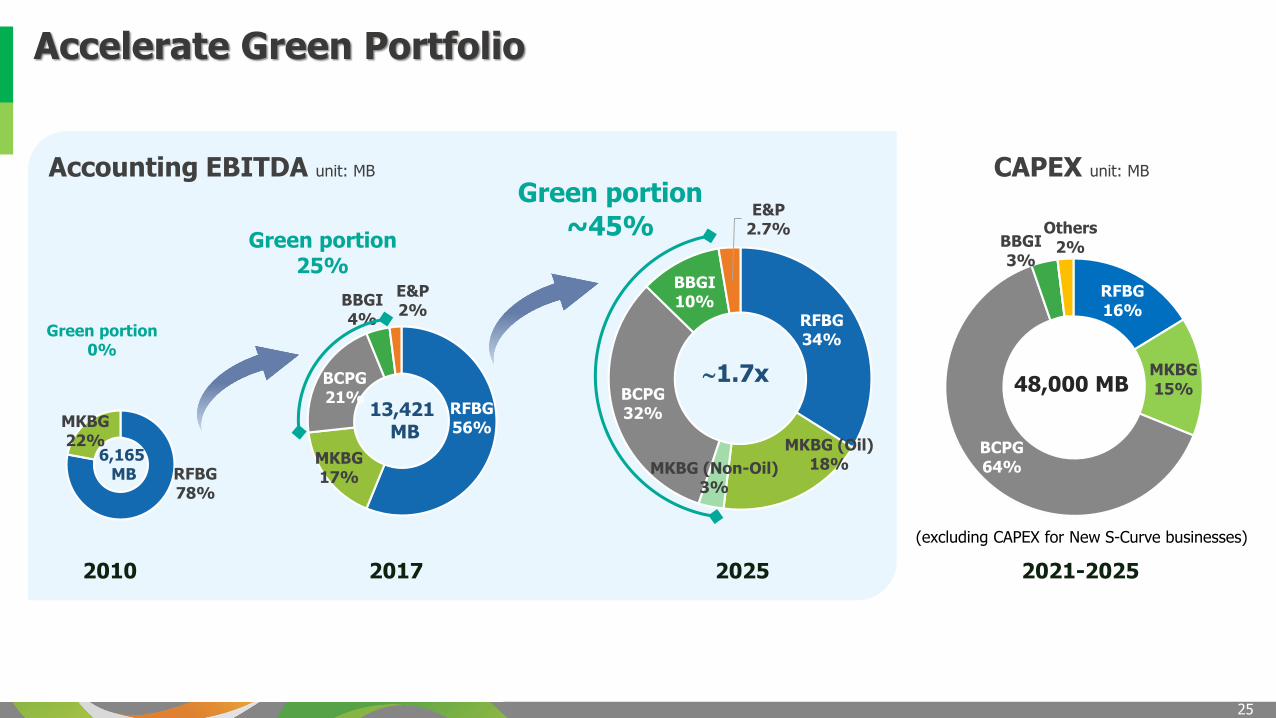
RFBG34%
MKBG (Oil)18%MKBG (Non-Oil)
3%
BCPG32%
BBGI10%
E&P2.7%
Accelerate Green Portfolio
RFBG56%
MKBG17%
BCPG21%
BBGI4%
E&P2%
Accounting EBITDA unit: MB
RFBG78%
MKBG22%
6,165 MB
Green portion0%
13,421 MB
Green portion
~45%Green portion
25%
2010 2017
1.7x
2025
RFBG16%
MKBG15%
BCPG64%
BBGI3%
Others2%
2021-2025
48,000 MB
(excluding CAPEX for New S-Curve businesses)
CAPEX unit: MB

26
Refinery
• Average crude run of 95 – 100 KBD
• TAM for ~40 days during first quarter
• DB @ 46$/BBL
• Benefit 200 MB from 3E project and 500 MB from rocket project
• Shifting to high-margin products
Power Plant
• Proceed from capital increased of THB 7.4 bn
soon to be gearing and deployed to projects
• EBITDA target Growth by 30 – 40%
Bio-Based Products
• Seek new opportunities in high-value bio-based products for B2B and B2C customers, Thailand as the regional production hub
• Plan to submit IPO filing in late 2021
Marketing• Network expansion (Cluster expansion and JV models)
100 more service stations
• Sales growth ~ 6%
• Focus more on Greenovative and higher margin products
• Traffic boost through synergies with retail developers
• Inthanin ~150 new stores
2021 Business Guidance: Heading toward The Light
OKEA
• To benefit from higher oil & gas price
• Two new production wells in Gjøa in Q1/21
• Yme first oil in 2H/2021
• Production guiding of 15.5-16.5 Kboe/d
• New additional licenses added to portfolio
27
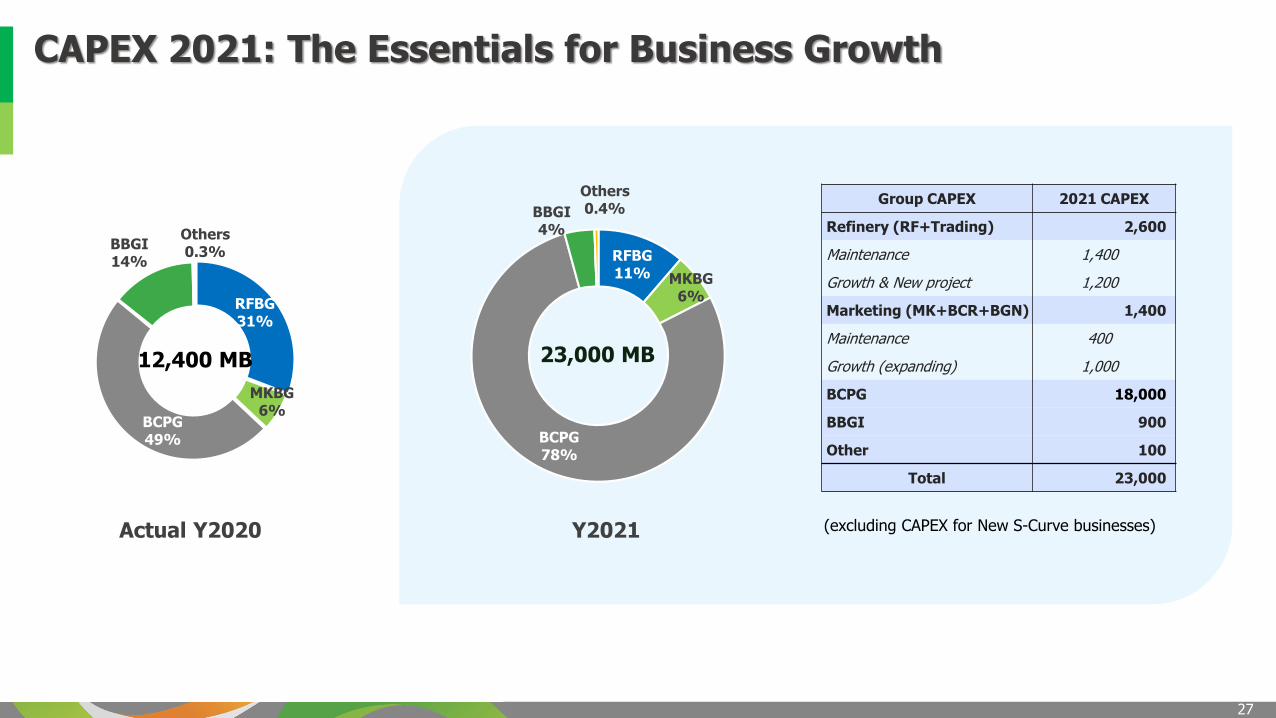
CAPEX 2021: The Essentials for Business Growth
RFBG11% MKBG
6%
BCPG78%
BBGI4%
Others0.4%
23,000 MB
Group CAPEX 2021 CAPEX
Refinery (RF+Trading) 2,600
Maintenance 1,400
Growth & New project 1,200
Marketing (MK+BCR+BGN) 1,400
Maintenance 400
Growth (expanding) 1,000
BCPG 18,000
BBGI 900
Other 100
Total 23,000
(excluding CAPEX for New S-Curve businesses)
RFBG31%
MKBG6%
BCPG49%
BBGI14%
Others0.3%
12,400 MB
Actual Y2020 Y2021
28
Appendix
2021 Business Update
29
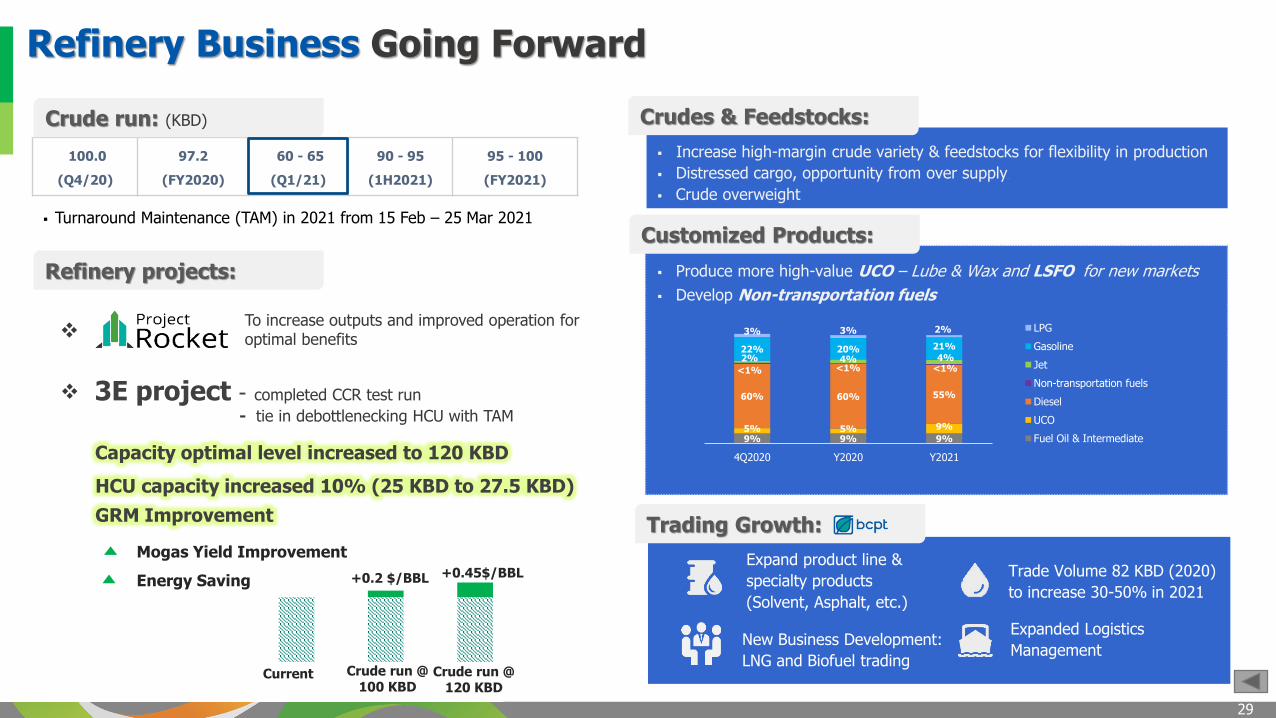
Trading Growth:
Expanded Logistics
Management
Expand product line &
specialty products
(Solvent, Asphalt, etc.)
New Business Development:
LNG and Biofuel trading
Trade Volume 82 KBD (2020)
to increase 30-50% in 2021
Crudes & Feedstocks:
Increase high-margin crude variety & feedstocks for flexibility in production
Distressed cargo, opportunity from over supply ,
Crude overweight
Customized Products:
Produce more high-value UCO – Lube & Wax and LSFO for new markets
Develop Non-transportation fuels
9% 9% 9%5% 5% 9%
60% 60% 55%
<1% <1% <1%2% 4% 4%22% 20% 21%
3% 3% 2%
4Q2020 Y2020 Y2021
LPG
Gasoline
Jet
Non-transportation fuels
Diesel
UCO
Fuel Oil & Intermediate
100.0
(Q4/20)
97.2
(FY2020)
60 - 65
(Q1/21)
90 - 95
(1H2021)
95 - 100
(FY2021)
Turnaround Maintenance (TAM) in 2021 from 15 Feb – 25 Mar 2021
Mogas18%
+0.2 $/BBL +0.45$/BBL
GRM Improvement
Current Crude run @ 100 KBD
Mogas Yield Improvement
Energy Saving
3E project - completed CCR test run
- tie in debottlenecking HCU with TAM
Crude run @ 120 KBD
To increase outputs and improved operation for optimal benefits
Refinery projects:
Crude run: (KBD)
Refinery Business Going Forward
Capacity optimal level increased to 120 KBD
HCU capacity increased 10% (25 KBD to 27.5 KBD)

30
as of Dec 2020
1,233
Standard Type 619 sites
COOP Type 614 sites
Unique Design Service Stations
Network Expansion
Strengthening Marketing Network
2020 2021
1,233
stations
+100
stationsDec 2020 2021
33
stations
+17
stations
Service station
Focus on:• Standard type• Non-Company Own
• Cluster development in main roads, commercial and tourism area
• Unique Design/Flagship service stations in high-potential area
Increase non oil & lube EBITDA portion
New retail strategic partner
• To draw more customers to service station
Uplifting current businessvia car care expansion
• Opening more sites in service stations
Stores as of Dec 2020
6732020 2021
673 sites +150 sites
456 sites in S/S
217 sites out S/S• Leading in Arabica 100% Coffee bean and
Best in class cocoa beverage• Adaptive outlet types for new customer bases• Get more into delivery & take away market
with “Inthanin the natural cups” concepts
31
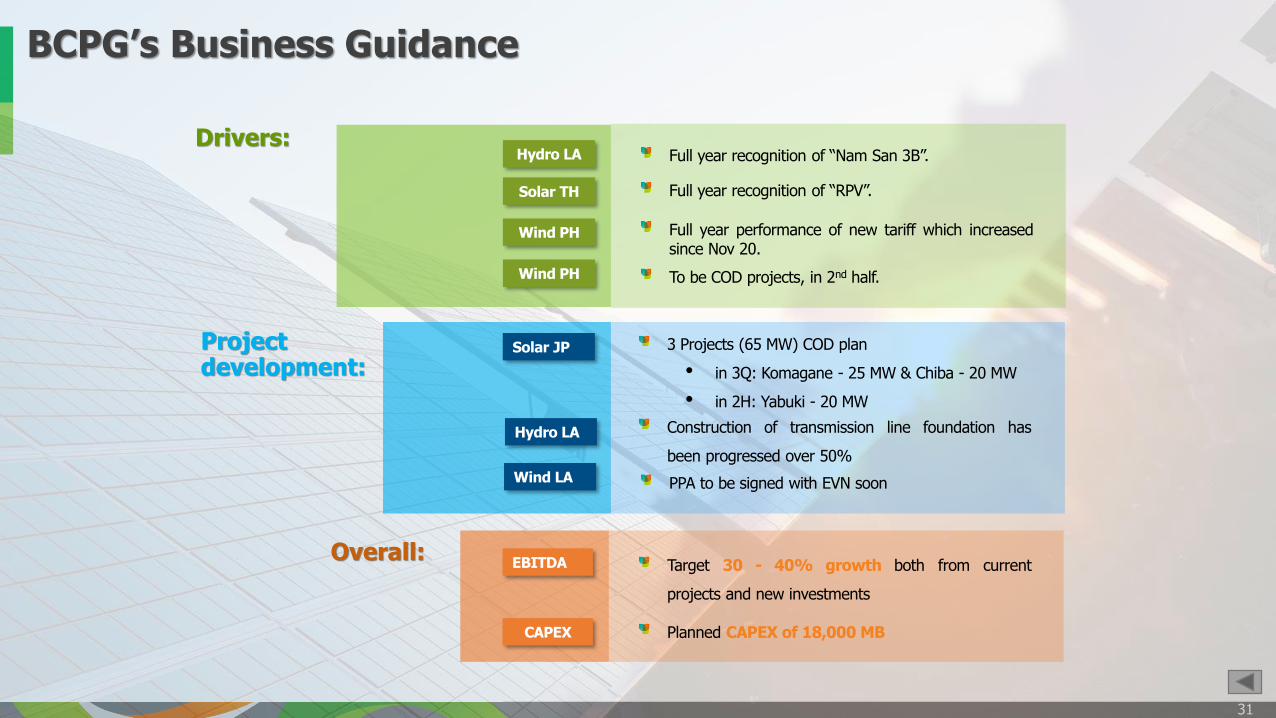
BCPG’s Business Guidance
Full year recognition of “Nam San 3B”.Hydro LA
Wind PH Full year performance of new tariff which increased since Nov 20.
Hydro LA Construction of transmission line foundation has
been progressed over 50%
Wind LA PPA to be signed with EVN soon
EBITDA
CAPEX
Target 30 - 40% growth both from current
projects and new investments
Planned CAPEX of 18,000 MB
Drivers:
Project development:
Overall:
Solar TH Full year recognition of “RPV”.
Wind PH To be COD projects, in 2nd half.
Solar JP 3 Projects (65 MW) COD plan
• in 3Q: Komagane - 25 MW & Chiba - 20 MW
• in 2H: Yabuki - 20 MW
32
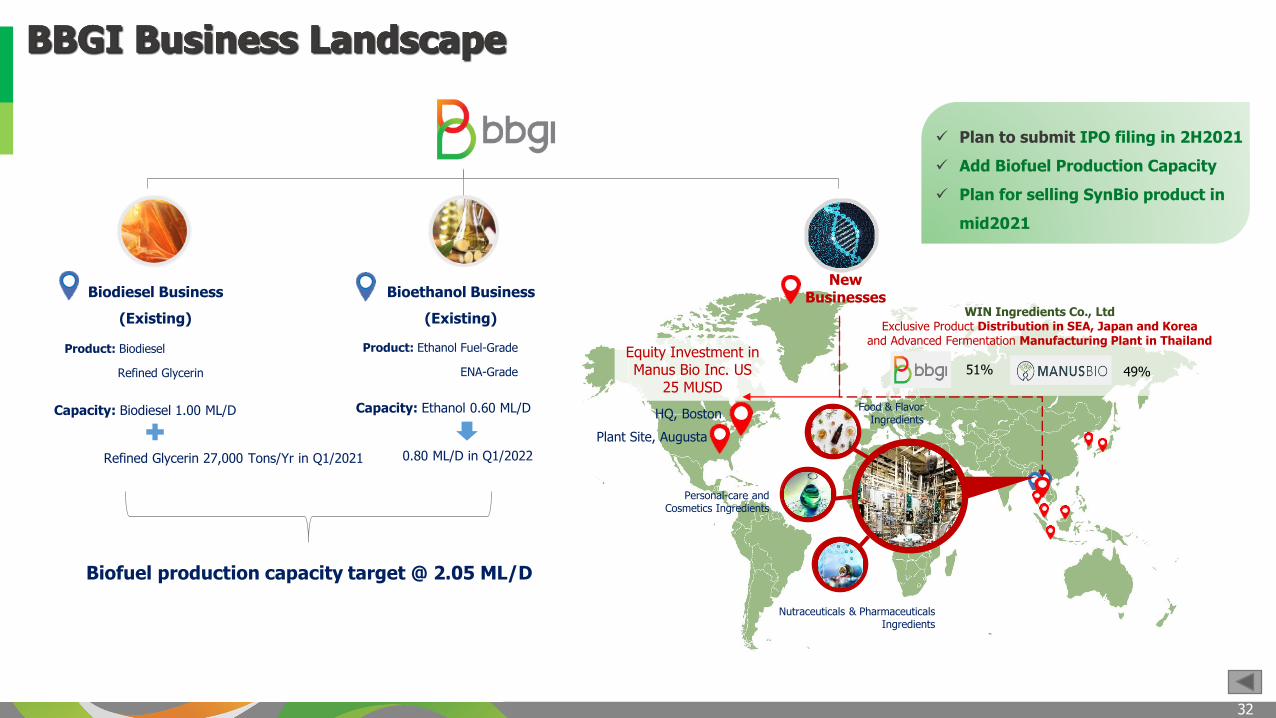
BBGI Business LandscapeBBGI Business LandscapeBBGI Business Landscape
Equity Investment in Manus Bio Inc. US
25 MUSD
HQ, Boston
Plant Site, Augusta
WIN Ingredients Co., LtdExclusive Product Distribution in SEA, Japan and Korea
and Advanced Fermentation Manufacturing Plant in Thailand
51% 49%
Biodiesel Business
(Existing)
Bioethanol Business
(Existing)
New Businesses
Food & Flavor Ingredients
Nutraceuticals & Pharmaceuticals Ingredients
Personal-care and Cosmetics Ingredients
Capacity: Biodiesel 1.00 ML/D
Refined Glycerin 27,000 Tons/Yr in Q1/2021
Product: Biodiesel
Refined Glycerin
Product: Ethanol Fuel-Grade
ENA-Grade
Capacity: Ethanol 0.60 ML/D
0.80 ML/D in Q1/2022
Biofuel production capacity target @ 2.05 ML/D
Plan to submit IPO filing in 2H2021
Add Biofuel Production Capacity
Plan for selling SynBio product in
mid2021
33
Appendix
Financials

34
Consolidated Statement of Income (Unit: THB Million) Q4/2020 Q3/2020 QoQ Q4/2019 YoY
Revenue from sale of goods and rendering of services 33,134 33,652 -2% 50,146 -34%
Cost of sale of goods and rendering of services (30,741) (31,058) -1% (47,130) -35%
Gross Profit 2,393 2,593 -8% 3,017 -21%
Other income 120 121 -1% 140 -14%
Selling and administrative expenses (2,180) (1,613) 35% (2,262) -4%
Gain (loss) from derivatives 165 (72) N/A 142 N/A
Gain (loss) on foreign exchange 140 134 N/A 274 N/A
Loss on impairment assets 115 (1,003) N/A (34) N/A
Profit (loss) before finance costs and income tax expense 752 160 369% 1,277 -41%
Finance costs (484) (504) -4% (425) 14%
Impairment gain and reversal of impairment loss (impairment loss) determined in accordance with TFRS 9
23 (24) N/A - N/A
Share of profit of associates and joint ventures 264 58 N/A 52 N/A
Profit (loss) before income tax expense 555 (310) 279% 903 -39%
Tax income (expense) 46 (19) N/A (36) N/A
Profit (loss) for the period 601 (329) 282% 867 -31%
Owners of parent 251 (647) 139% 620 -59%
Non-controlling interests 349 318 247
Basic earnings (loss) per share (Baht per Share) 0.09 (0.57) 0.38
Profit and Loss (Consolidated)
2020 2019 YoY
136,450 190,489 -28%
(132,122) (180,257) -27%
4,328 10,232 -58%
533 495 8%
(7,141) (7,614) -6%
17 160 N/A
732 614 N/A
(2,375) (34) N/A
(3,907) 3,853 -201%
(1,969) (1,701) 16%
(891) - N/A
(592) 404 N/A
(7,359) 2,556 -388%
1,589 (68) N/A
(5,770) 2,488 -332%
6,967) 1,732 -502%
1,197 757
(5.50) 1.18
35
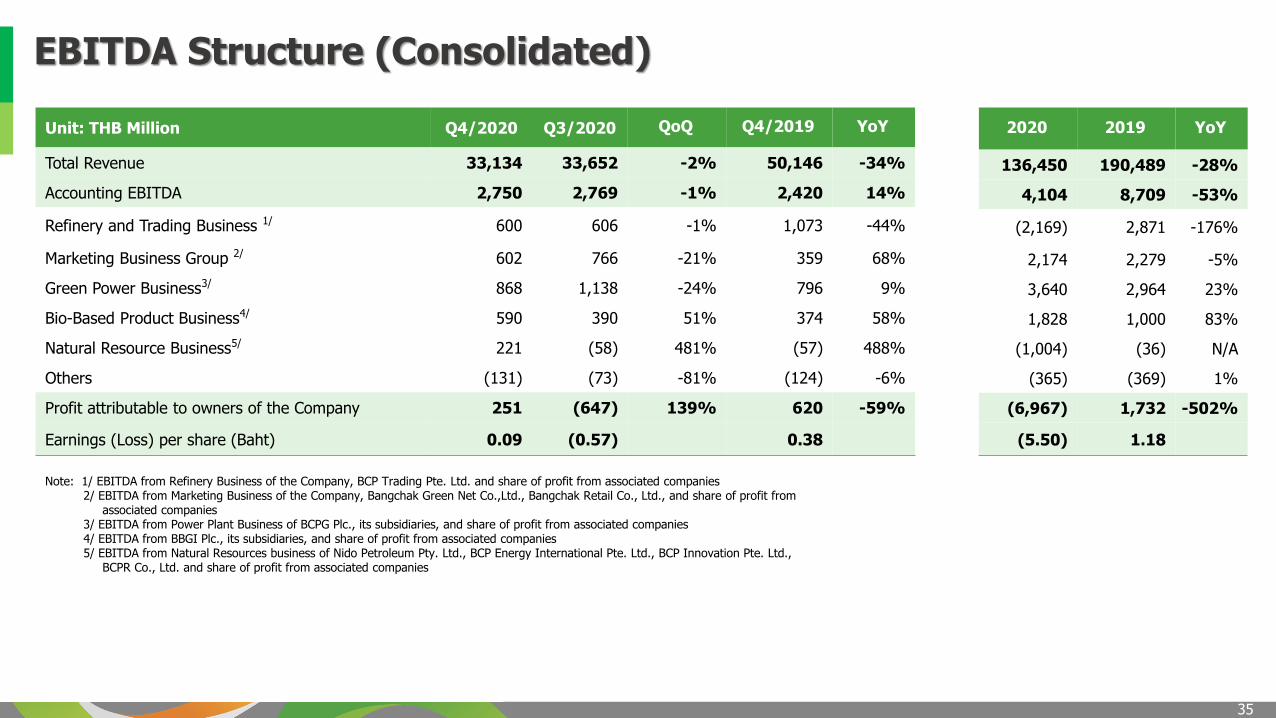
Note: 1/ EBITDA from Refinery Business of the Company, BCP Trading Pte. Ltd. and share of profit from associated companies2/ EBITDA from Marketing Business of the Company, Bangchak Green Net Co.,Ltd., Bangchak Retail Co., Ltd., and share of profit from
associated companies3/ EBITDA from Power Plant Business of BCPG Plc., its subsidiaries, and share of profit from associated companies4/ EBITDA from BBGI Plc., its subsidiaries, and share of profit from associated companies5/ EBITDA from Natural Resources business of Nido Petroleum Pty. Ltd., BCP Energy International Pte. Ltd., BCP Innovation Pte. Ltd.,
BCPR Co., Ltd. and share of profit from associated companies
Unit: THB Million Q4/2020 Q3/2020 QoQ Q4/2019 YoY
Total Revenue 33,134 33,652 -2% 50,146 -34%
Accounting EBITDA 2,750 2,769 -1% 2,420 14%
Refinery and Trading Business 1/ 600 606 -1% 1,073 -44%
Marketing Business Group 2/ 602 766 -21% 359 68%
Green Power Business3/ 868 1,138 -24% 796 9%
Bio-Based Product Business4/ 590 390 51% 374 58%
Natural Resource Business5/ 221 (58) 481% (57) 488%
Others (131) (73) -81% (124) -6%
Profit attributable to owners of the Company 251 (647) 139% 620 -59%
Earnings (Loss) per share (Baht) 0.09 (0.57) 0.38
EBITDA Structure (Consolidated)
2020 2019 YoY
136,450 190,489 -28%
4,104 8,709 -53%
(2,169) 2,871 -176%
2,174 2,279 -5%
3,640 2,964 23%
1,828 1,000 83%
(1,004) (36) N/A
(365) (369) 1%
(6,967) 1,732 -502%
(5.50) 1.18
36
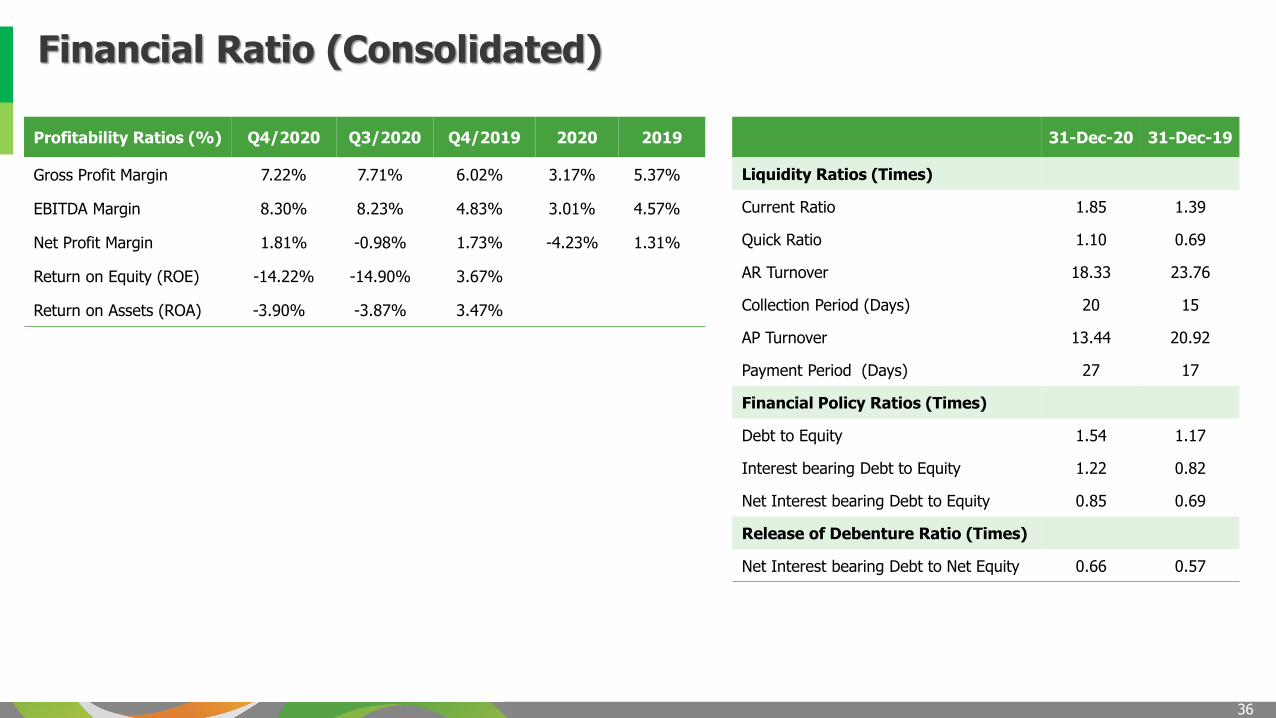
Financial Ratio (Consolidated)
Profitability Ratios (%) Q4/2020 Q3/2020 Q4/2019
Gross Profit Margin 7.22% 7.71% 6.02%
EBITDA Margin 8.30% 8.23% 4.83%
Net Profit Margin 1.81% -0.98% 1.73%
Return on Equity (ROE) -14.22% -14.90% 3.67%
Return on Assets (ROA) -3.90% -3.87% 3.47%
2020 2019
3.17% 5.37%
3.01% 4.57%
-4.23% 1.31%
31-Dec-20 31-Dec-19
Liquidity Ratios (Times)
Current Ratio 1.85 1.39
Quick Ratio 1.10 0.69
AR Turnover 18.33 23.76
Collection Period (Days) 20 15
AP Turnover 13.44 20.92
Payment Period (Days) 27 17
Financial Policy Ratios (Times)
Debt to Equity 1.54 1.17
Interest bearing Debt to Equity 1.22 0.82
Net Interest bearing Debt to Equity 0.85 0.69
Release of Debenture Ratio (Times)
Net Interest bearing Debt to Net Equity 0.66 0.57

THANK YOU
Disclaimer
The information contained herein is being furnished on a confidential basis for discussion purposes only and onlyfor the use of the recipient, and may be subject to completion or amendment through the delivery of additionaldocumentation. Except as otherwise provided herein, this document does not constitute an offer to sell or purchaseany security or engage in any transaction.
The information contained herein has been obtained from sources that Bangchak Corporation Public CompanyLimited (“BCP”) considers to be reliable; however, BCP makes no representation as to, and accepts noresponsibility or liability for, the accuracy or completeness of the information contained herein.
Any projections, valuations and statistical analyses contained herein have been provided to assist the recipient inthe evaluation of the matters described herein; such projections, valuations and analyses may be based onsubjective assessments and assumptions and may utilize one among alternative methodologies that producediffering results; accordingly, such projections, valuations and statistical analyses are not to be viewed as facts andshould not be relied upon as an accurate representation of future events. The recipient should make anindependent evaluation and judgment with respect to the matters contained herein.
Tel. +66 2335 8663 / 8518 / 4370
www.bangchak.co.th