analyst presentation -...
TRANSCRIPT

February 15, 2018
Analyst Presentation
Cautionary Statements
2
EQT Corporation (NYSE: EQT)
EQT Plaza
625 Liberty Avenue, Suite 1700
Pittsburgh, PA 15222
Pat Kane - Chief Investor Relations Officer (412) 553-7833
The Securities and Exchange Commission (SEC) permits oil and gas companies, in their filings with the SEC, to disclose only proved, probable and possible reserves that a company anticipates as of a given
date to be economically and legally producible and deliverable by application of development projects to known accumulations. We use certain terms in this presentation, such as “EUR” (estimated ultimate
recovery) and total resource potential, that the SEC’s rules strictly prohibit us from including in filings with the SEC. We caution you that the SEC views such estimates as inherently unreliable and these
estimates may be misleading to investors unless the investor is an expert in the natural gas industry. We also note that the SEC strictly prohibits us from aggregating proved, probable and possible (3P)
reserves on filings with the SEC due to the different levels of certainty associated with each reserve category.
Disclosures in this presentation contain certain forward-looking statements within the meaning of Section 21E of the Securities Exchange Act of 1934, as amended, and Section 27A of the Securities Act of
1933, as amended. Statements that do not relate strictly to historical or current facts are forward-looking. Without limiting the generality of the foregoing, forward-looking statements contained in this
presentation specifically include the expectations of plans, strategies, objectives and growth and anticipated financial and operational performance of EQT Corporation and its subsidiaries (EQT), including
guidance regarding EQT’s strategy to develop its reserves; drilling plans and programs (including the number, type, depth, lateral lengths, and locations of wells to be drilled, number of frac crews and number
and type of rigs); projected natural gas prices, liquids price impact, basis, premium and average differential; total resource potential, reserves and EUR; projected EQT and third party production sales
volumes and growth rates (including liquids sales volumes and growth rates); internal rate of return (IRR), compound annual growth rate (CAGR) and expected after-tax returns per well; technology (including
drilling and completion techniques); projected drilling and completions (D&C) costs, other well costs, G&A expenses, expense reductions and unit costs; projected frac stage lengths, proppant per foot and
water per foot; projected market mix; projected gathering and transmission volume and growth rates; infrastructure programs (including the timing, cost and capacity of expected gathering and transmission
expansion projects); the cost, capacity, timing of regulatory approvals, and anticipated in-service date of the Mountain Valley Pipeline (MVP) project; the ultimate terms, partners, and structure of the MVP joint
venture; acquisition transactions; the projected capital efficiency savings and other operating efficiencies and synergies resulting from EQT’s acquisition of Rice; EQT’s ability to achieve the anticipated
synergies and efficiencies from its acquisition of Rice; monetization transactions, including asset sales, joint ventures or other transactions involving EQT’s assets, including the terms and timing of the
anticipated sale of EQT’s retained Ohio gathering assets to EQT Midstream Partners, LP (EQM) and whether EQT will complete such transaction or transactions; the timing of EQT’s announcement of a
decision to address its sum-of-the-parts discount, and the impact of the results of such review; dividend and distribution amounts and rates; projected return of capital; the projected cash flows resulting from
EQT’s limited partner interests in EQT GP Holdings, LP (EQGP) and limited partner interests and incentive distribution rights in Rice Midstream Partners LP (RMP) and related growth rates; projected cash
flows, including the ability to fund the 2018 drilling program through cash from operations; projected adjusted operating cash flow attributable to EQT, adjusted operating cash flow attributable to EQT
Production, pipeline, water and net marketing services revenue, and net income attributable to noncontrolling interests; projected capital contributions and capital expenditures; liquidity and financing
requirements, including funding sources and availability; changes in credit ratings; potential future impairments of EQT’s assets; hedging strategy; the effects of government regulation and litigation; and tax
position and the expected impact of changes to tax laws. These forward-looking statements involve risks and uncertainties that could cause actual results to differ materially from projected results.
Accordingly, investors should not place undue reliance on forward-looking statements as a prediction of actual results. EQT has based these forward-looking statements on current expectations and
assumptions about future events. While EQT considers these expectations and assumptions to be reasonable, they are inherently subject to significant business, economic, competitive, regulatory and other
risks and uncertainties, many of which are difficult to predict and beyond EQT’s control. The risks and uncertainties that may affect the operations, performance and results of EQT’s business and forward-
looking statements include, but are not limited to, those set forth under Item 1A, “Risk Factors,” of EQT’s Form 10-K for the year ended December 31, 2017, as filed with the SEC and as updated by any
subsequent Form 10-Qs. Any forward-looking statement speaks only as of the date on which such statement is made and EQT does not intend to correct or update any forward-looking statement, whether as
a result of new information, future events or otherwise.
Information in this presentation regarding EQGP and its subsidiaries, including EQM, and RMP and its subsidiaries, is derived from publicly available information published by EQGP, EQM and RMP, as
applicable.

Key Investment Highlights
Leading natural gas producer in the United States
Focused on development of the Marcellus Shale
Industry-leading cost structure
Pipeline capacity portfolio assures market access and improved basis
EQGP and EQM growth opportunity resulting from recent acquisition
Cash flows from EQGP to double over next three years
Strong balance sheet and liquidity
Committed to address sum-of-the-parts discount by end of February
3
Unmatched combination of scale, growth, inventory, financial quality and cost structure

(1)As of 12/31/17
(2)Enterprise value is calculated by utilizing EQT share price as of 12/31/17 and excludes net debt of EQM and RMP
(3)Acres and locations as of 12/31/17
EQT Profile
4
Well-positioned to improve overall well economics and deliver stronger returns
Market Cap(1) $ 15.1 B
Enterprise Value(2) $ 20.9 B
Net Marcellus Acres(3) 1,000,000
Core Net Marcellus Acres(3) 680,000
Core Marcellus Undeveloped Locations(3) 2,500
2017 Sales (pro forma) 1,317 Bcfe
2018E Production 1,520 – 1,560 Bcfe
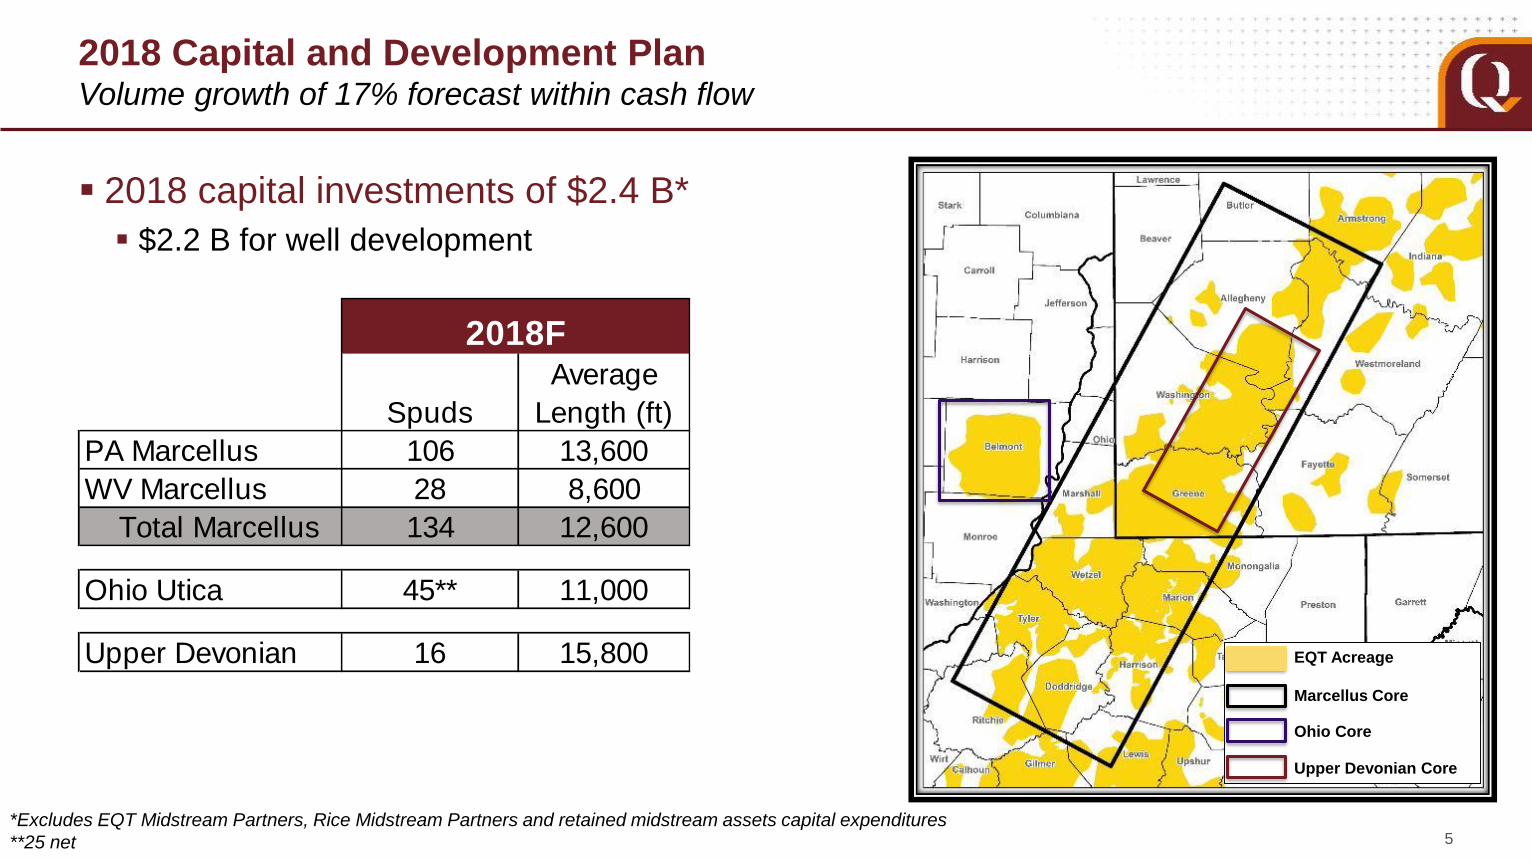
2018 Capital and Development Plan
2018 capital investments of $2.4 B*
$2.2 B for well development
5
Volume growth of 17% forecast within cash flow
*Excludes EQT Midstream Partners, Rice Midstream Partners and retained midstream assets capital expenditures
**25 net
EQT Acreage
Marcellus Core
Ohio Core
Upper Devonian Core
Spuds
Average
Length (ft)
PA Marcellus 106 13,600
WV Marcellus 28 8,600
Total Marcellus 134 12,600
Ohio Utica 45** 11,000
Upper Devonian 16 15,800
2018F

Rice Acquisition Implementation Strategy
2018 17% production growth with cash flow breakeven
Approve plan to address the sum-of-the-parts discount by end of February
Begin to realize capital, operational and administrative synergies
Average PA Marcellus well 13,600 feet vs 12,000 target
Same EUR for $210 million less capital compared to 8,000 foot wells
G&A $110 million less than pre-deal total
LOE per unit $0.04 less – approximately $62 million savings
Refinanced Rice debt – approximately $45 million savings
Drop-down retained midstream assets to EQM
Gathering system integrations begin
2019 Fully realize synergies
35% fewer wells with same total feet of pay
Targeting production cash-flow breakeven
2020+ Return of capital to shareholders
6
Significant progress in synergies next year

Marcellus Play
1,000,000 total net acres
680,000 core acres
2,500 core undeveloped locations*
134 wells in 2018
106 PA, 28 WV
12,600 ft. average lateral length
$11.3 MM / well
2.4 Bcfe EUR / 1,000’
100% working interest
86% NRI
7
Development strategically focused on core
Development
area
*Assumes 12,000 foot lateral

Improving Economics – Marcellus
8
Longer laterals and more wells per pad reduce cost per foot
-
2,000
4,000
6,000
8,000
10,000
12,000
14,000
2013 2014 2015 2016 2017 2018E
La
tera
l le
ng
th (
ft.)
Includes Upper Devonian
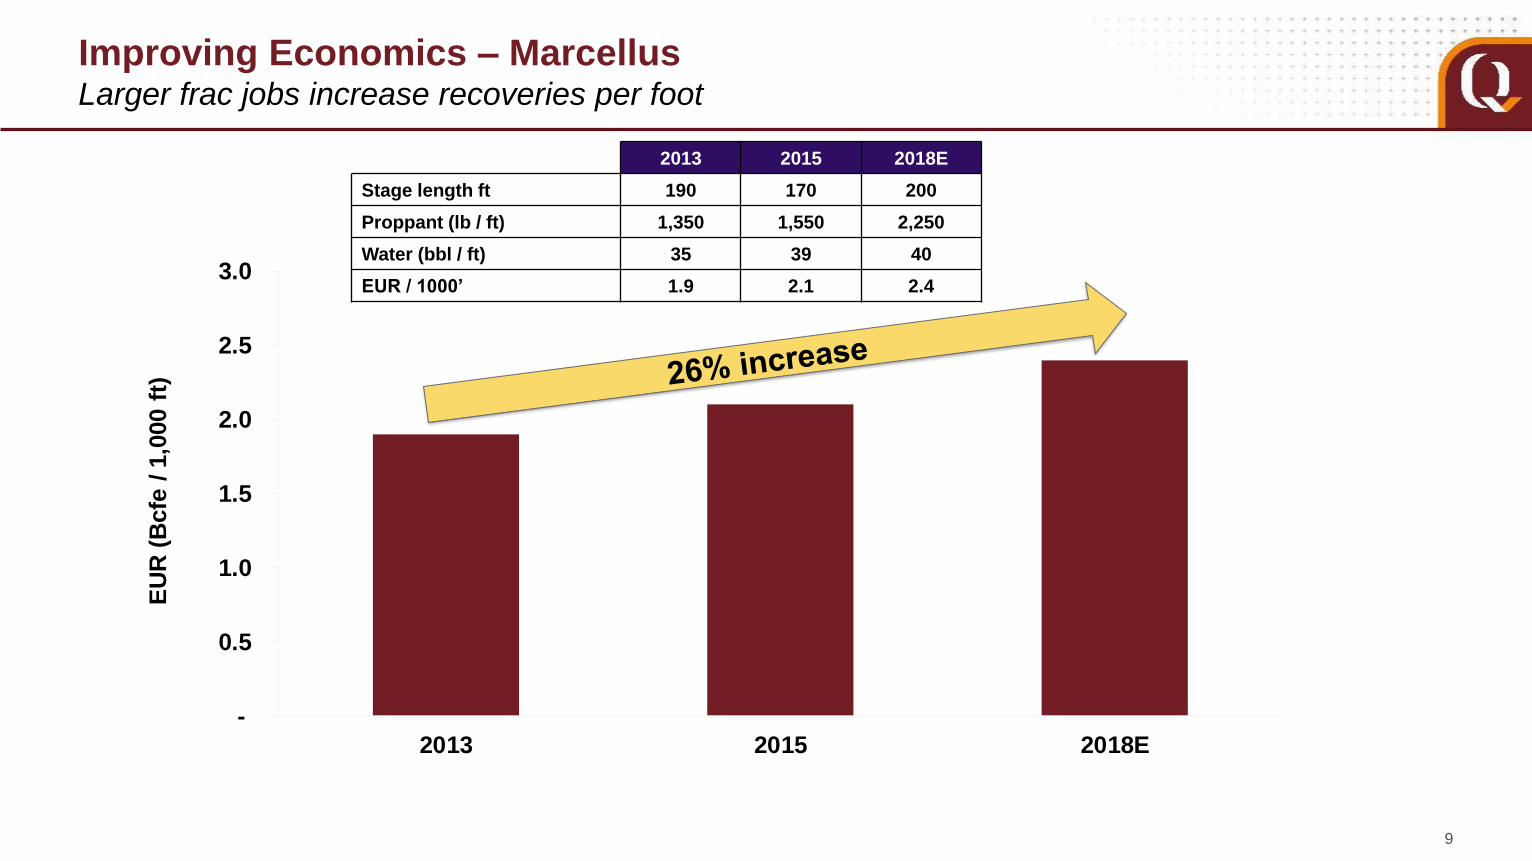
Improving Economics – Marcellus
9
Larger frac jobs increase recoveries per foot
-
0.5
1.0
1.5
2.0
2.5
3.0
2013 2015 2018E
EU
R (
Bcfe
/ 1
,000 f
t)2013 2015 2018E
Stage length ft 190 170 200
Proppant (lb / ft) 1,350 1,550 2,250
Water (bbl / ft) 35 39 40
EUR / 1000’ 1.9 2.1 2.4

$-
$0.20
$0.40
$0.60
$0.80
2013 2014 2015 2016 2017 2018E
Dri
llin
g &
Co
mp
leti
on
s C
os
t ($
/ M
cfe
)
Improving Economics – Marcellus
10
$0.37 per Mcfe in 2018
Lower drilling and completion cost per foot + higher productivity, drive lower cost per Mcfe
0%
20%
40%
60%
80%
100%
120%
140%
160%
6,000 8,000 12,000 14,000
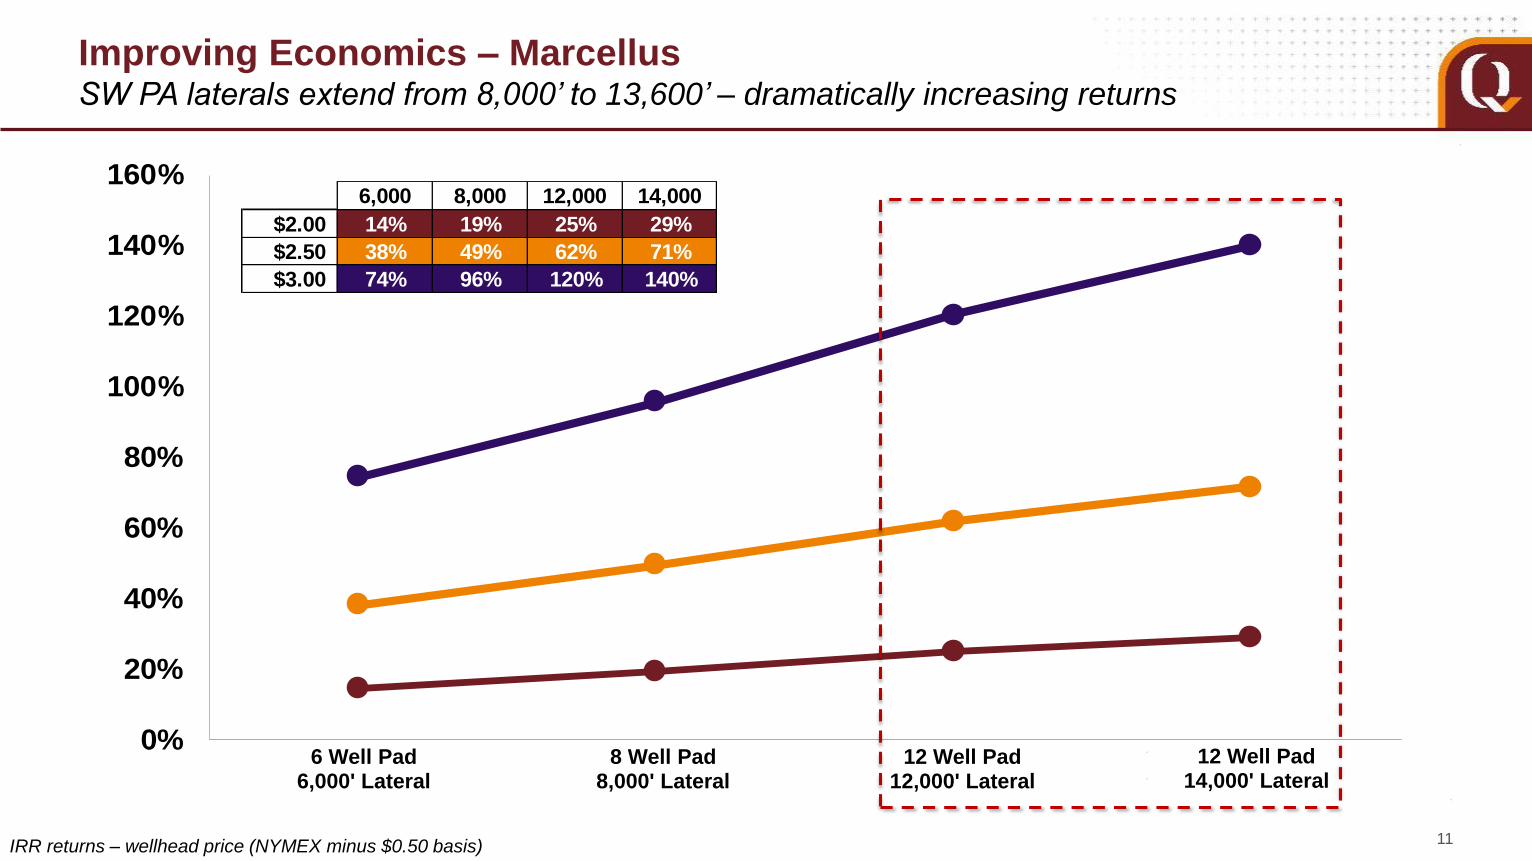
Improving Economics – Marcellus SW PA laterals extend from 8,000’ to 13,600’ – dramatically increasing returns
IRR returns – wellhead price (NYMEX minus $0.50 basis) 11
6 Well Pad6,000' Lateral
8 Well Pad8,000' Lateral
12 Well Pad12,000' Lateral
12 Well Pad14,000' Lateral
6,000 8,000 12,000 14,000
$2.00 14% 19% 25% 29%
$2.50 38% 49% 62% 71%
$3.00 74% 96% 120% 140%
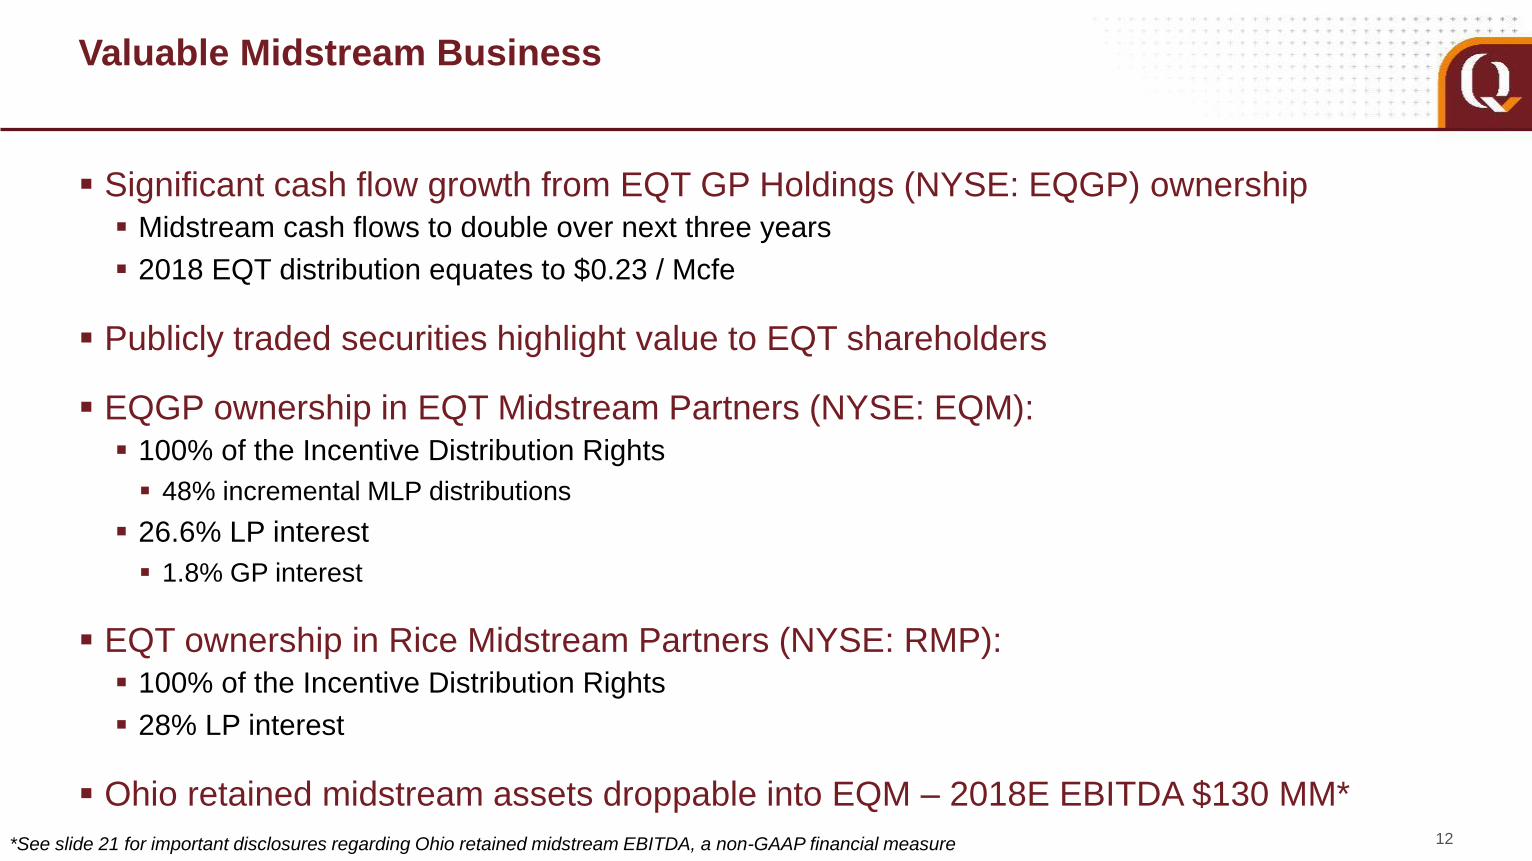
Valuable Midstream Business
Significant cash flow growth from EQT GP Holdings (NYSE: EQGP) ownership
Midstream cash flows to double over next three years
2018 EQT distribution equates to $0.23 / Mcfe
Publicly traded securities highlight value to EQT shareholders
EQGP ownership in EQT Midstream Partners (NYSE: EQM):
100% of the Incentive Distribution Rights
48% incremental MLP distributions
26.6% LP interest
1.8% GP interest
EQT ownership in Rice Midstream Partners (NYSE: RMP):
100% of the Incentive Distribution Rights
28% LP interest
Ohio retained midstream assets droppable into EQM – 2018E EBITDA $130 MM*12*See slide 21 for important disclosures regarding Ohio retained midstream EBITDA, a non-GAAP financial measure
$-
$100
$200
$300
$400
$500
$600
$700
2014 2015 2016 2017 2018 2019 2020
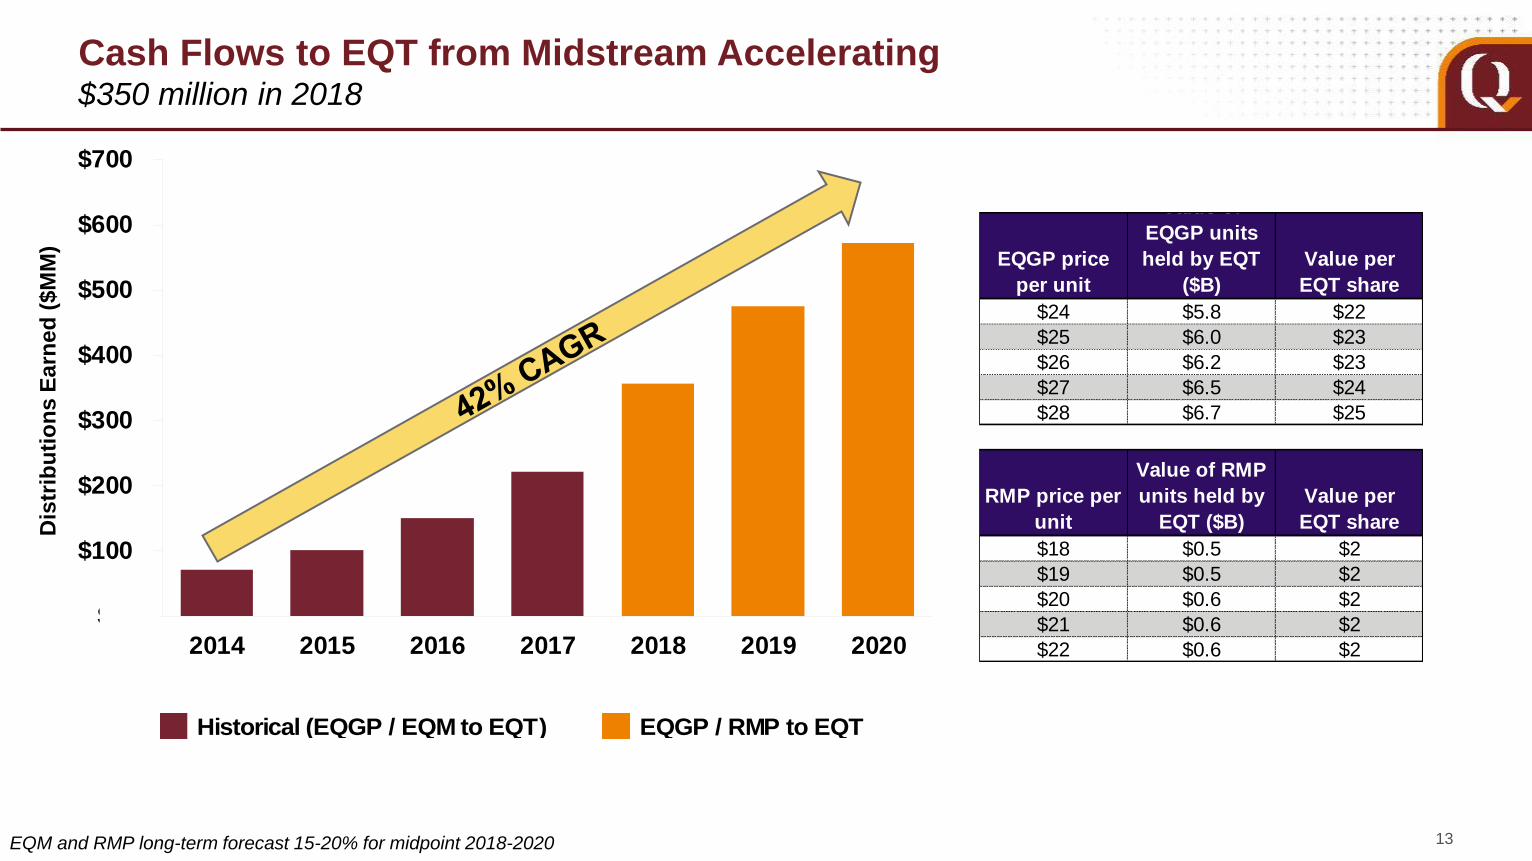
Cash Flows to EQT from Midstream Accelerating
13
$350 million in 2018
EQM and RMP long-term forecast 15-20% for midpoint 2018-2020
Dis
trib
uti
on
s E
arn
ed
($M
M)
Historical (EQGP / EQM to EQT) EQGP / RMP to EQT
EQGP price
per unit
Value of
EQGP units
held by EQT
($B)
Value per
EQT share
$24 $5.8 $22
$25 $6.0 $23
$26 $6.2 $23
$27 $6.5 $24
$28 $6.7 $25
RMP price per
unit
Value of RMP
units held by
EQT ($B)
Value per
EQT share
$18 $0.5 $2
$19 $0.5 $2
$20 $0.6 $2
$21 $0.6 $2
$22 $0.6 $2
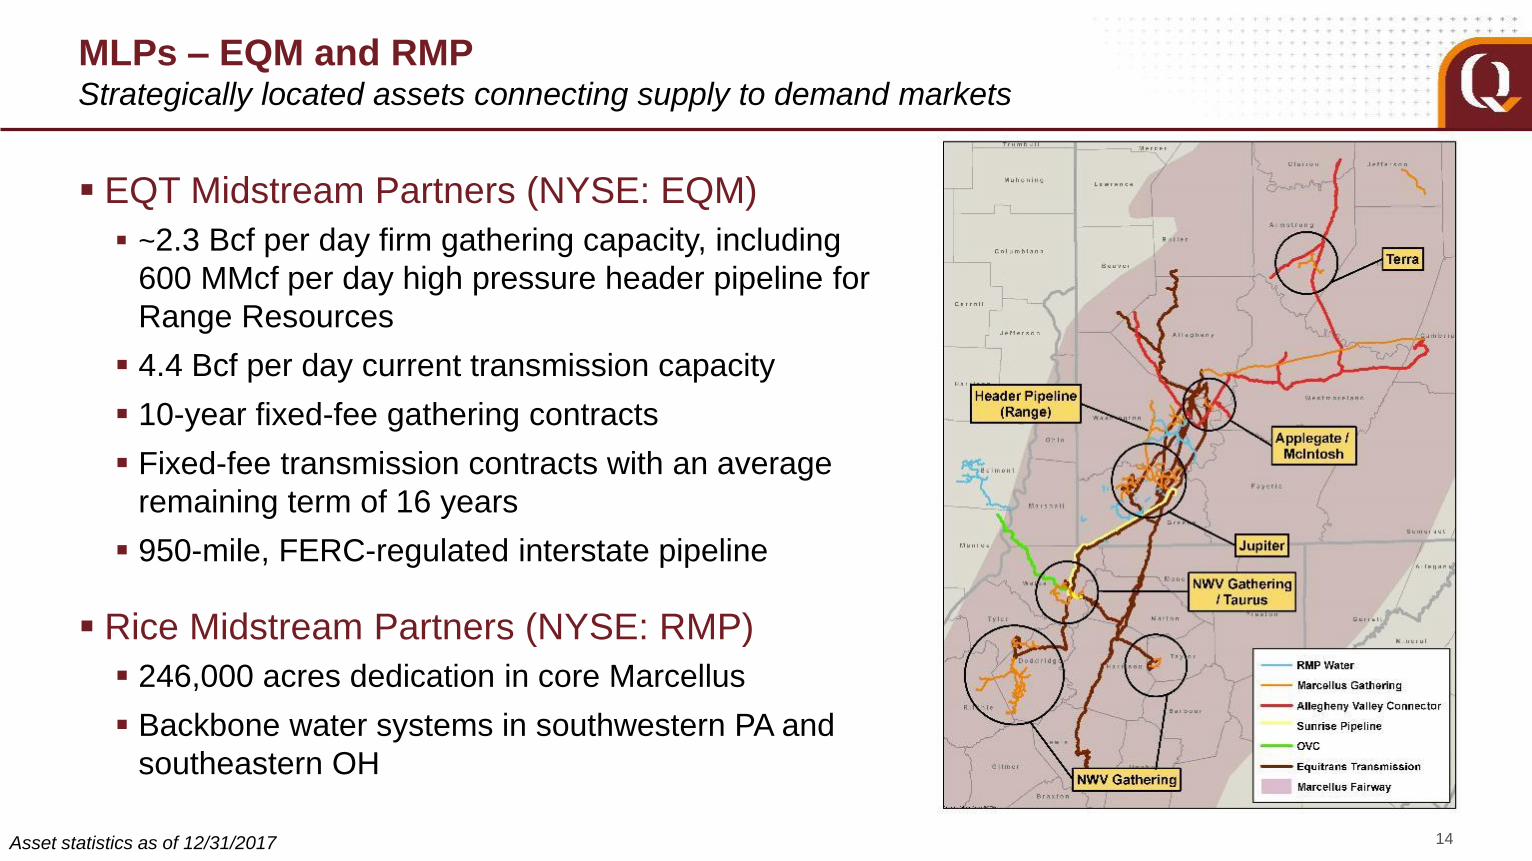
MLPs – EQM and RMP
EQT Midstream Partners (NYSE: EQM)
~2.3 Bcf per day firm gathering capacity, including
600 MMcf per day high pressure header pipeline for
Range Resources
4.4 Bcf per day current transmission capacity
10-year fixed-fee gathering contracts
Fixed-fee transmission contracts with an average
remaining term of 16 years
950-mile, FERC-regulated interstate pipeline
Rice Midstream Partners (NYSE: RMP)
246,000 acres dedication in core Marcellus
Backbone water systems in southwestern PA and
southeastern OH
14
Strategically located assets connecting supply to demand markets
Asset statistics as of 12/31/2017

EQT Midstream Partners
JV with NextEra, ConEd, WGL, RGC Resources
45.5% EQM ownership interest
EQM to construct and operate pipeline
$3.5 B total project cost
~$1.6 billion EQM investment
Q4 2018 targeted in-service
2 Bcf per day firm capacity commitments
1.3 Bcf per day by EQT Production
Expect $0.01 / Mcfe premium to NYMEX at
delivery point
Received FERC certificate on October 13, 2017
15
Mountain Valley Pipeline connects supply hub to southeast power generation markets
MVP significantly improves EQT pricing in 2019
Key Investment Highlights
Leading natural gas producer in the United States
Focused on development of the Marcellus Shale
Industry-leading cost structure
Pipeline capacity portfolio assures market access and improved basis
EQGP and EQM growth opportunity resulting from recent acquisition
Cash flows from EQGP to double over next three years
Strong balance sheet and liquidity
Committed to address sum-of-the-parts discount by end of February
16
Unmatched combination of scale, growth, inventory, financial quality and cost structure
Appendix

Non-GAAP Financial Measures
Adjusted operating cash flow attributable to EQT and adjusted operating cash flow attributable to EQT Production are non-GAAP supplemental financial measures that are presented as indicators of an oil and gas exploration and production company’s ability to internally fund exploration and development activities and to service or incur additional debt. EQT includes this information because management believes that changes in operating assets and liabilities relate to the timing of cash receipts and disbursements and therefore may not relate to the period in which the operating activities occurred. Adjusted operating cash flow attributable to EQT is EQT’s net cash provided by operating activities, less changes in other assets and liabilities, adjusted to exclude EQM and RMP adjusted EBITDA, plus EQM and RMP interest expense plus the EQGP and RMP cash distributions payable to EQT. Prior to EQT’s 2018 operational forecast announcement in December 2017, EQT’s calculation of adjusted operating cash flow attributable to EQT did not include the addition of EQM’s and RMP’s interest expense. EQT believes it is preferable to present this non-GAAP supplemental financial measure with this adjustment as it better reflects EQT’s cash flows by excluding the cost of debt for EQM and RMP. Management believes that removing the impact on operating cash flows of the public unitholders of EQM, EQGP and RMP that is otherwise required to be consolidated in EQT’s results provides useful information to an EQT investor. As used in this news release, adjusted operating cash flow attributable to EQT Production means the EQT Production segment’s total operating revenues less the EQT Production segment’s cash operating expense, less gains (losses) on derivatives not designated as hedges, plus net cash settlements received (paid) on derivatives not designated as hedges, plus premiums received (paid) for derivatives that settled during the period, plus EQT Production asset impairments (if applicable). Adjusted operating cash flow attributable to EQT and adjusted operating cash flow attributable to EQT Production should not be considered as alternatives to net cash provided by operating activities presented in accordance with GAAP.
EQT has not provided projected net cash provided by operating activities or a reconciliation of projected adjusted operating cash flow attributable to EQT or projected adjusted operating cash flow attributable to EQT Production to projected net cash provided by operating activities, the most comparable financial measure calculated in accordance with GAAP. EQT is unable to project net cash provided by operating activities because this metric includes the impact of changes in operating assets and liabilities related to the timing of cash receipts and disbursements that may not relate to the period in which the operating activities occurred. EQT is unable to project these timing differences with any reasonable degree of accuracy without unreasonable efforts such as predicting the timing of its and customers’ payments, with accuracy to a specific day, three or more months in advance. Furthermore, EQT does not provide guidance with respect to its average realized price or income taxes, among other items, that are reconciling items between net cash provided by operating activities and adjusted operating cash flow attributable to EQT and adjusted operating cash flow attributable to EQT Production, as applicable. Natural gas prices are volatile and out of EQT’s control, and the timing of transactions and the income tax effects of future transactions and other items are difficult to accurately predict. Therefore, EQT is unable to provide projected net cash provided by operating activities, or the related reconciliation of projected adjusted operating cash flow attributable to EQT and projected operating cash flow attributable to EQT Production to projected net cash provided by operating activities, without unreasonable effort.
18
Adjusted Operating Cash Flow Attributable to EQT and Adjusted Operating Cash Flow
Attributable to EQT Production
Non-GAAP Financial Measures
EQT Midstream Partners adjusted EBITDA means EQM’s net income plus EQM’s net interest expense, depreciation and amortization expense,
income tax expense (if applicable), preferred interest payments received post-conversion, and non-cash long-term compensation expense less
EQM’s equity income, AFUDC-equity, pre-acquisition capital lease payments for Allegheny Valley Connector, LLC (AVC), and adjusted EBITDA of
assets prior to acquisition. EQT Midstream Partners adjusted EBITDA is a non-GAAP supplemental financial measure that management and
external users of EQT’s consolidated financial statements, such as industry analysts, investors, lenders and rating agencies, use to assess the
effects of the noncontrolling interests in relation to:
EQT's operating performance as compared to other companies in its industry;
the ability of EQT's assets to generate sufficient cash flow to make distributions to its investors;
EQT's ability to incur and service debt and fund capital expenditures; and
the viability of acquisitions and other capital expenditure projects and the returns on investment of various investment opportunities.
EQT believes that EQT Midstream Partners adjusted EBITDA provides useful information to investors in assessing EQT's financial condition and
results of operations. EQT Midstream Partners adjusted EBITDA should not be considered as an alternative to EQM’s net income, operating
income, or any other measure of financial performance or liquidity presented in accordance with GAAP. EQT Midstream Partners adjusted
EBITDA has important limitations as an analytical tool because it excludes some, but not all, items that affect EQM's net income. Additionally,
because EQT Midstream Partners adjusted EBITDA may be defined differently by other companies in EQT's or EQM's industries, the definition of
EQT Midstream Partners adjusted EBITDA may not be comparable to similarly titled measures of other companies, thereby diminishing the utility
of the measure.
19
EQT Midstream Partners Adjusted EBITDA

Non-GAAP Financial Measures
Rice Midstream Partners (RMP) adjusted EBITDA means RMP’s net income (loss) before net interest expense, depreciation expense, acquisition
costs, amortization of intangible assets, non-cash equity compensation expense, incentive unit expense, amortization of deferred financing costs
and other nonrecurring items. RMP adjusted EBITDA is a non-GAAP supplemental financial measure that management and external users of
EQT’s consolidated financial statements, such as industry analysts, investors, lenders and rating agencies, use to assess the effects of the
noncontrolling interests in relation to:
EQT's operating performance as compared to other companies in its industry;
the ability of EQT's assets to generate sufficient cash flow to make distributions to its investors;
EQT's ability to incur and service debt and fund capital expenditures; and
the viability of acquisitions and other capital expenditure projects and the returns on investment of various investment opportunities.
EQT believes that RMP adjusted EBITDA provides useful information to investors in assessing EQT's financial condition and results of operations.
RMP adjusted EBITDA should not be considered as an alternative to RMP’s net income, operating income, or any other measure of financial
performance or liquidity presented in accordance with GAAP. RMP adjusted EBITDA has important limitations as an analytical tool because it
excludes some, but not all, items that affect RMP's net income. Additionally, because RMP adjusted EBITDA may be defined differently by other
companies in EQT's or RMP's industries, the definition of RMP adjusted EBITDA may not be comparable to similarly titled measures of other
companies, thereby diminishing the utility of the measure.
20
Rice Midstream Partners Adjusted EBITDA

Non-GAAP Financial Measures
As used in this presentation, Ohio retained midstream earnings before interest, taxes, depreciation and amortization (EBITDA) means the earnings before interest, taxes and depreciation of EQT’s Ohio retained midstream assets. EBITDA is a non-GAAP supplemental financial measure that management and external users of EQT’s consolidated financial statements, such as industry analysts, investors, lenders and rating agencies, use to assess the potential contribution of the Ohio retained midstream assets to EQT’s future operating performance and cash flows.
EQT believes that the projected EBITDA of the Ohio retained midstream assets provides useful information to investors in assessing the present and future impact of the assets on EQT's financial condition and results of operations. EBITDA should not be considered as an alternative to net income, operating income or any other measure of financial performance or liquidity presented in accordance with GAAP. EBITDA has important limitations as an analytical tool because it excludes some, but not all, items that affect net income. Additionally, because EBITDA may be defined differently by other companies in EQT's industry, the definition of EBITDA may not be comparable to similarly titled measures of other companies, thereby diminishing the utility of the measure.
EQT has not provided projected net income from the Ohio retained midstream assets, the most comparable financial measure calculated in accordance with GAAP, or a reconciliation of projected EBITDA to projected net income of the assets. The Ohio retained midstream assets are operated as part of the EQT Production business segment, and EQT does not allocate certain costs, such as interest and tax expenses, to individual assets within its business segments. Therefore, the projected net income of the Ohio retained midstream assets and a reconciliation of projected EBITDA of the assets to projected net income from those assets are not available without unreasonable effort.
21
Ohio Retained Midstream Earnings Before Interest, Taxes, Depreciation and Amortization
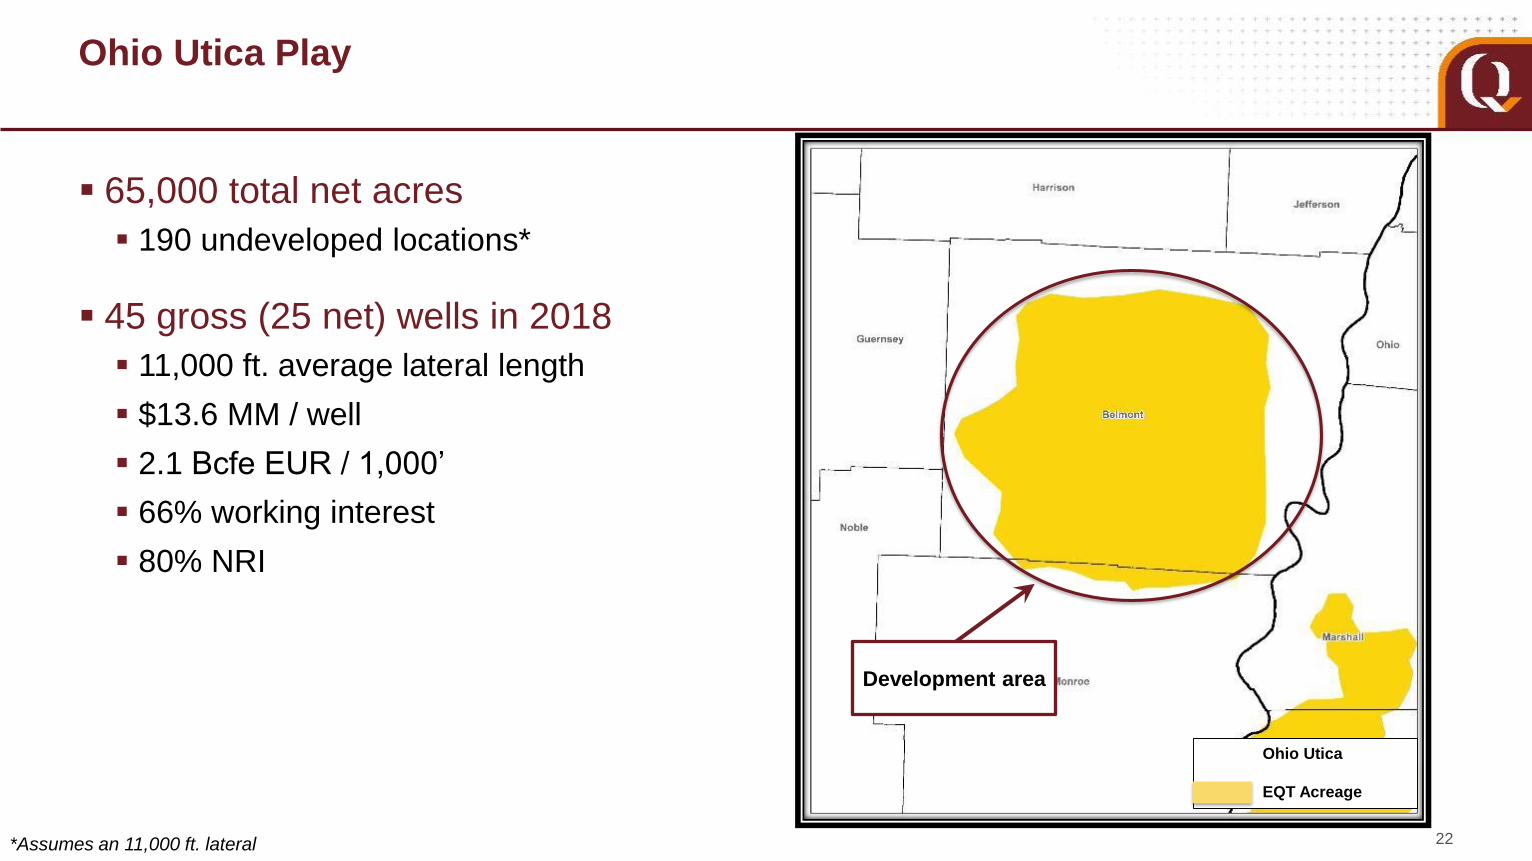
65,000 total net acres
190 undeveloped locations*
45 gross (25 net) wells in 2018
11,000 ft. average lateral length
$13.6 MM / well
2.1 Bcfe EUR / 1,000’
66% working interest
80% NRI
Ohio Utica Play
*Assumes an 11,000 ft. lateral 22
Development area
Ohio Utica
EQT Acreage
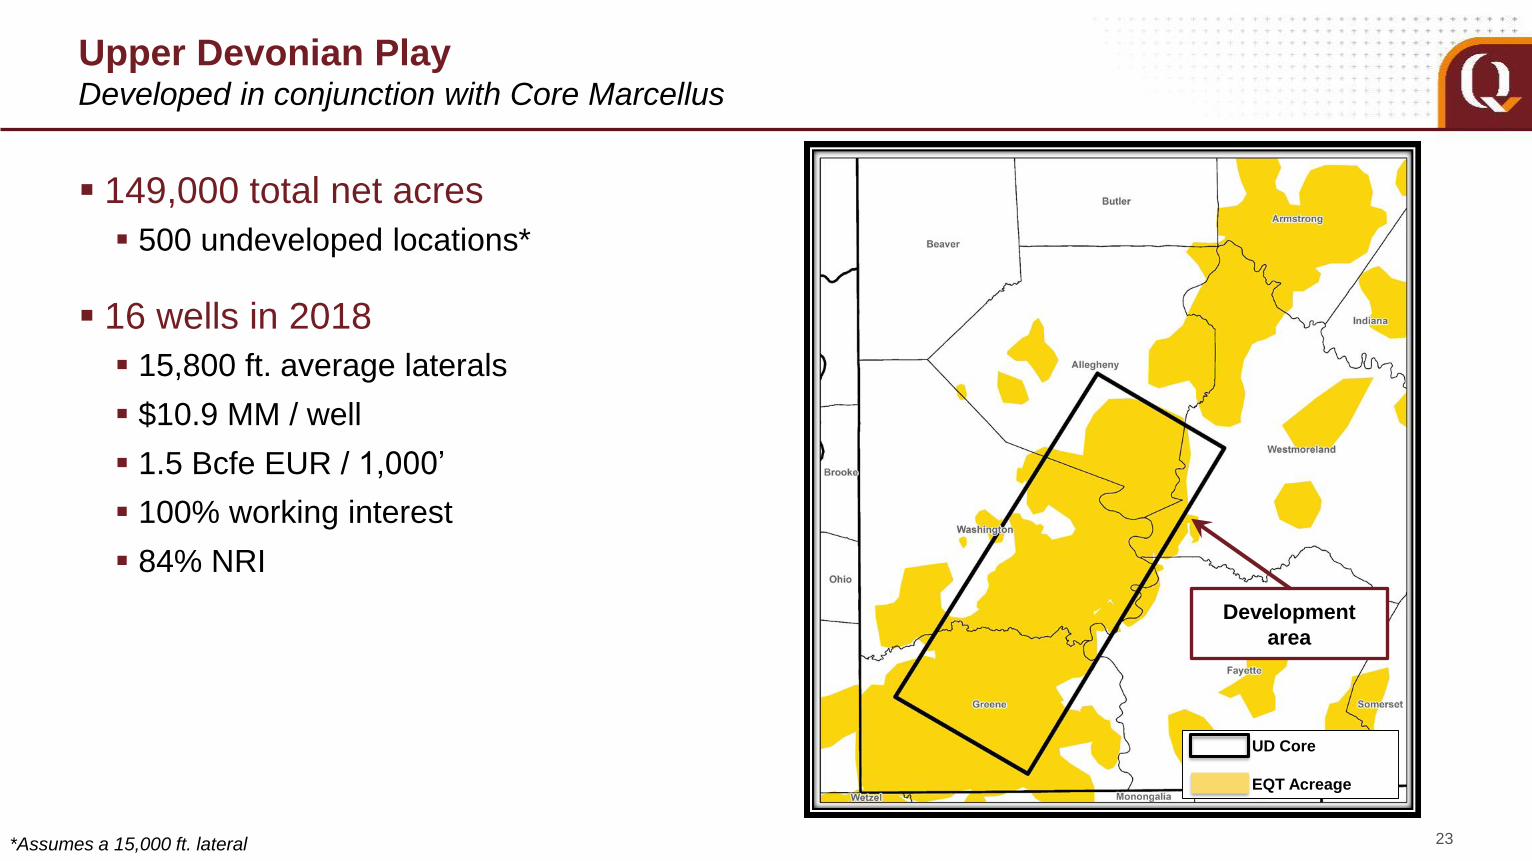
Upper Devonian Play
149,000 total net acres
500 undeveloped locations*
16 wells in 2018
15,800 ft. average laterals
$10.9 MM / well
1.5 Bcfe EUR / 1,000’
100% working interest
84% NRI
Developed in conjunction with Core Marcellus
*Assumes a 15,000 ft. lateral
Development
area
UD Core
EQT Acreage
23
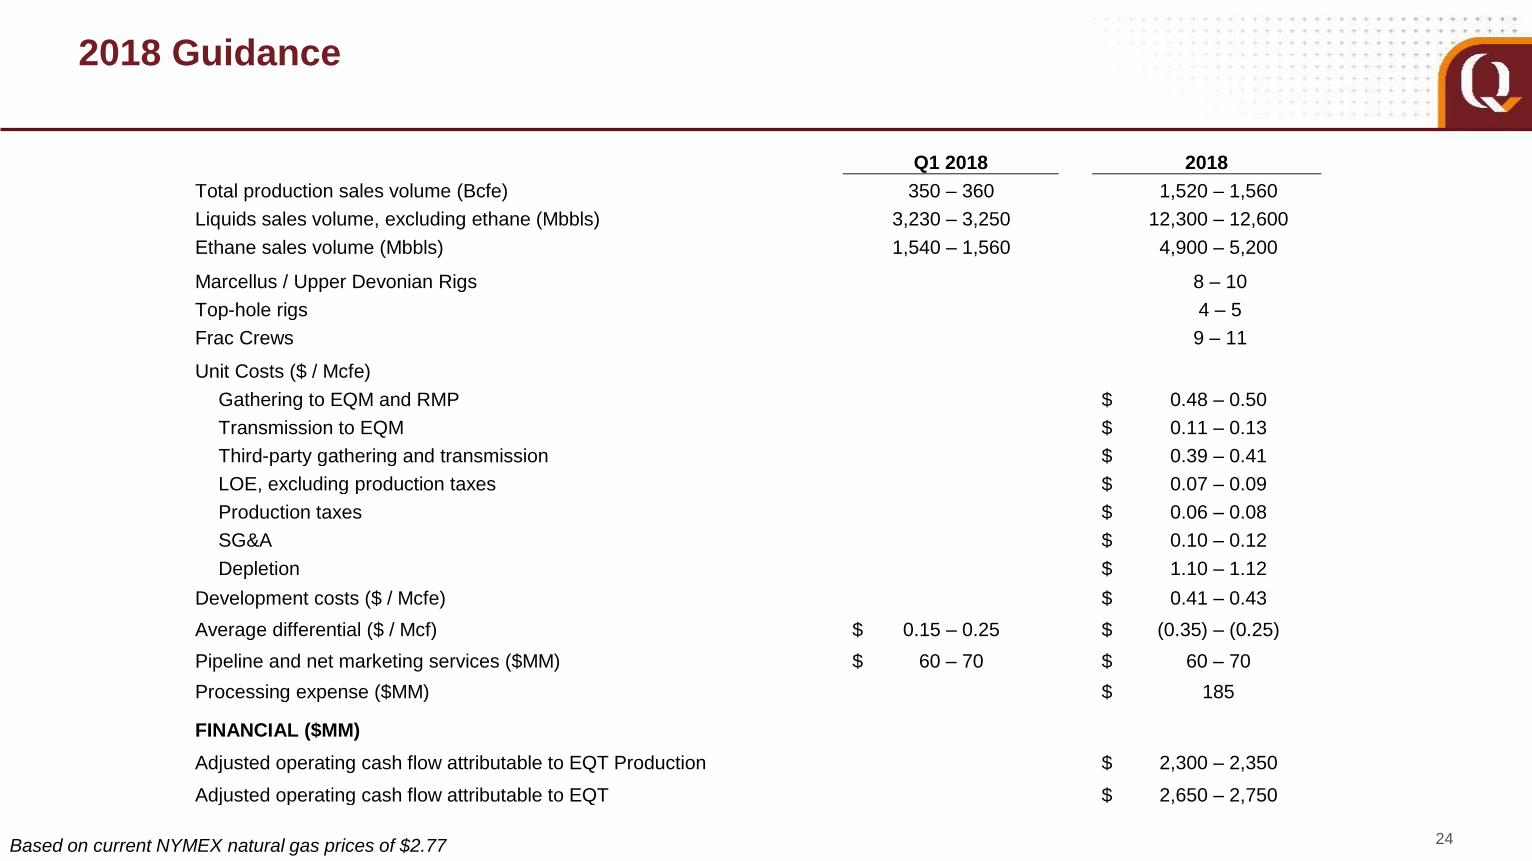
2018 Guidance
24Based on current NYMEX natural gas prices of $2.77
Q1 2018 2018
Total production sales volume (Bcfe) 350 – 360 1,520 – 1,560
Liquids sales volume, excluding ethane (Mbbls) 3,230 – 3,250 12,300 – 12,600
Ethane sales volume (Mbbls) 1,540 – 1,560 4,900 – 5,200
Marcellus / Upper Devonian Rigs 8 – 10
Top-hole rigs 4 – 5
Frac Crews 9 – 11
Unit Costs ($ / Mcfe)
Gathering to EQM and RMP $ 0.48 – 0.50
Transmission to EQM $ 0.11 – 0.13
Third-party gathering and transmission $ 0.39 – 0.41
LOE, excluding production taxes $ 0.07 – 0.09
Production taxes $ 0.06 – 0.08
SG&A $ 0.10 – 0.12
Depletion $ 1.10 – 1.12
Development costs ($ / Mcfe) $ 0.41 – 0.43
Average differential ($ / Mcf) $ 0.15 – 0.25 $ (0.35) – (0.25)
Pipeline and net marketing services ($MM) $ 60 – 70 $ 60 – 70
Processing expense ($MM) $ 185
FINANCIAL ($MM)
Adjusted operating cash flow attributable to EQT Production $ 2,300 – 2,350
Adjusted operating cash flow attributable to EQT $ 2,650 – 2,750
25
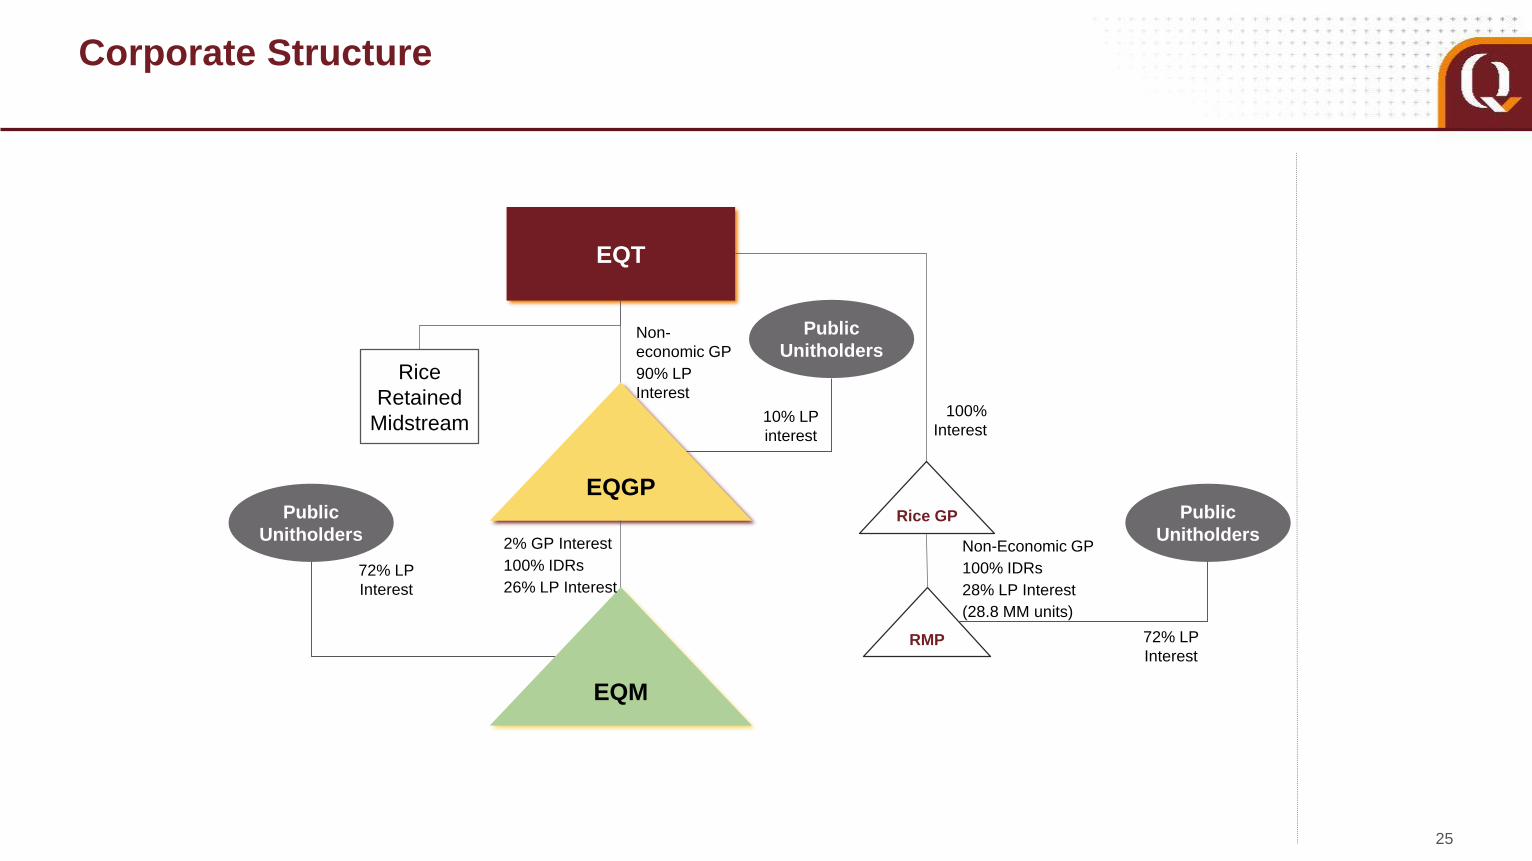
Corporate Structure
Legacy Rice
Shareholders
Public
Unitholders
EQM
EQGP
2% GP Interest
100% IDRs
26% LP Interest
Non-
economic GP
90% LP
Interest
Public
Unitholders
10% LP
interest
EQT
Rice
Retained
Midstream
RMP
72% LP
Interest
Public
Unitholders
72% LP
Interest
Rice GP
100%
Interest
Non-Economic GP
100% IDRs
28% LP Interest
(28.8 MM units)

Synergy Potential
26
Present value of economic savings for Rice acquisition ($B)
*Discounted at estimated WACC of 8.4% over 10 years, no terminal value
Base synergies of $2.5 billion
Capital Efficiencies*
Contiguous acreage leads to:
Longer laterals (12,000 ft)
Fewer wells
Lower surface costs
G&A*
Reduction of G&A for 10 years
Base Synergies
Average
Savings:
$200 MM in 2018
$350 MM / yr 2019-2027
~$100 MM / yr
2018-2027
Capital Efficiencies G&A Total Base Synergies
$1.9
$0.6 $2.5
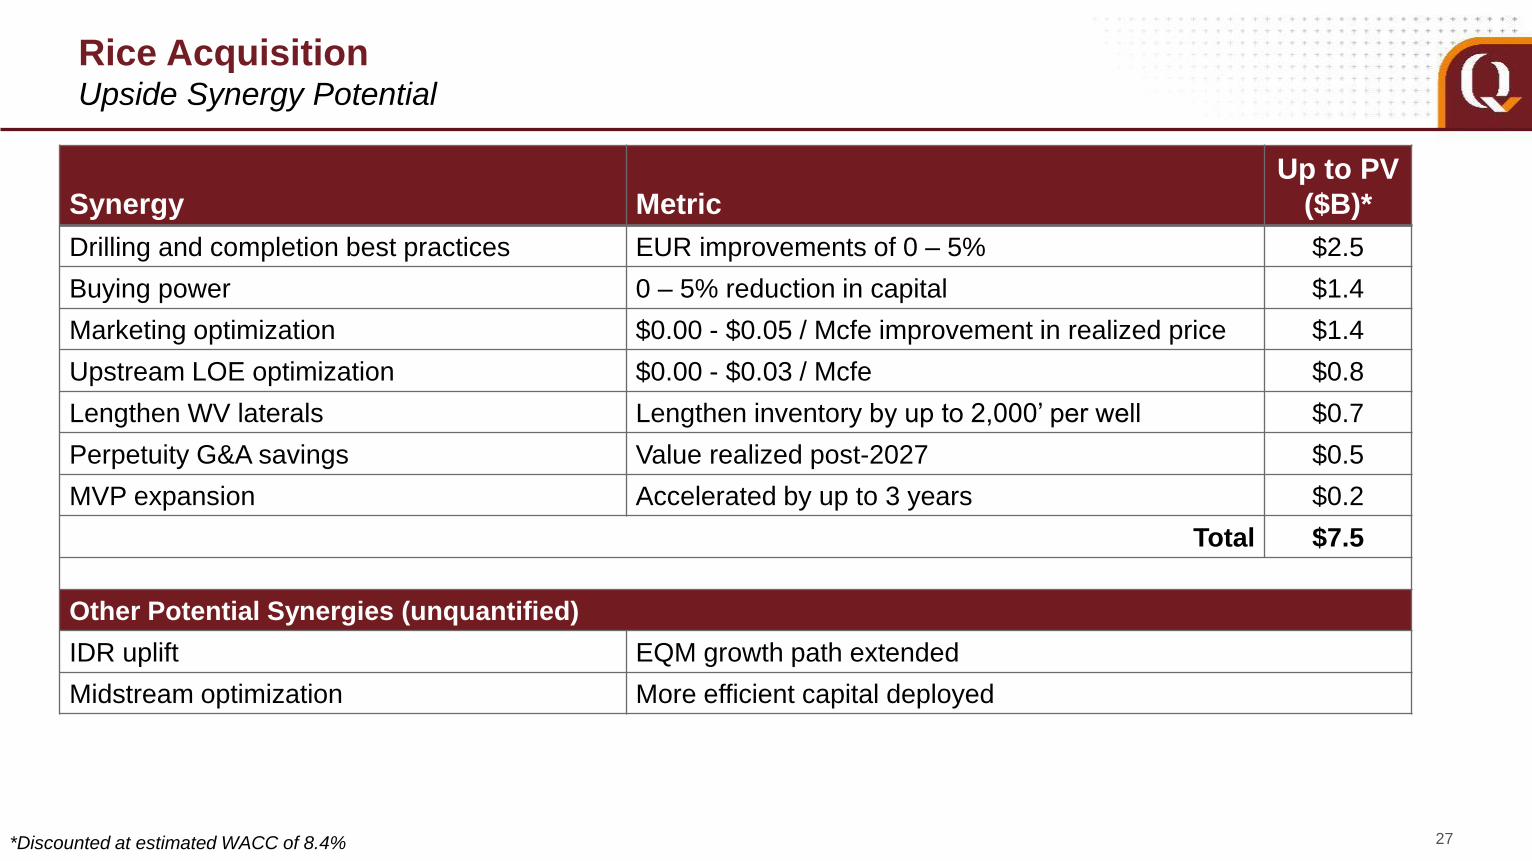
Rice Acquisition
Synergy Metric
Up to PV
($B)*
Drilling and completion best practices EUR improvements of 0 – 5% $2.5
Buying power 0 – 5% reduction in capital $1.4
Marketing optimization $0.00 - $0.05 / Mcfe improvement in realized price $1.4
Upstream LOE optimization $0.00 - $0.03 / Mcfe $0.8
Lengthen WV laterals Lengthen inventory by up to 2,000’ per well $0.7
Perpetuity G&A savings Value realized post-2027 $0.5
MVP expansion Accelerated by up to 3 years $0.2
Total $7.5
Other Potential Synergies (unquantified)
IDR uplift EQM growth path extended
Midstream optimization More efficient capital deployed
27
Upside Synergy Potential
*Discounted at estimated WACC of 8.4%

Risk Management
28
Hedge Position
• The Company sold calendar 2018 and 2019 calls for approximately 64 and 45 Bcf
at strike prices of $3.49 and $3.69 per Mcf, respectively.
• For 2018 the Company also sold puts for approximately 3 Bcf at a strike price of
$2.63 per Mcf
• The average price is based on a conversion rate of 1.05 MMBtu/Mcf
2018 2019 2020
NYMEX Price ($/Mcf) as of 1/31/18 $3.12 $2.97 $2.94
NYMEX Swaps
Total Volume (Bcf) 541 234 234
Average Price per Mcf (NYMEX) $3.14 $3.03 $3.05
Collars
Total Volume (Bcf) 117 66 -
Average Floor Price per Mcf (NYMEX) $3.28 $3.15 $0.00
Average Cap Price per Mcf (NYMEX) $3.78 $3.68 $0.00
Puts (Long)
Total Volume (Bcf) 10 7 -
Average Floor Price per Mcf (NYMEX) $2.91 $2.94 $0.00
668
307 234
$3.17
$3.06 $3.05 $3.12
$2.97 $2.94
$2.50
$2.60
$2.70
$2.80
$2.90
$3.00
$3.10
$3.20
$3.30
-
100
200
300
400
500
600
700
800
2018 2019 2020
$ /
Mc
f
Bc
f
Hedged Volume Average Hedge Price NYMEX Price

Marcellus Capacity
Significant exposure
to growing Gulf
markets
Multiple legs of
transport provide
flexibility to capture
highest netback
29
Diversified portfolio targeting premium markets
*Assumed NYMEX and realized price; as of February 12, 2018
490,000
1,2
90
,00
0
933,000
Southeast
Pipe Project ISD DTH/D
EQM MVPQ4 18/
Q1 191,290,000
Northeast
Pipe Project ISD DTH/D
TETCO TEAM 14 Current 150,000
TETCO TEMAX Current 295,000
TGP 300L Current 40,000
TETCO TME3 Current 5,000
Ohio/Midwest
Pipe Project ISD DTH/D
REX E2W Current 350,000
REX Z3 En. Current 200,000
TETCO U2GC Current 101,500
ANR ML-7 Current 31,500
ETP Rover Current 150,000
ETP Rover Q1 18 100,000
Gulf Coast
Pipe Project ISD DTH/D
TETCO TEAM 14 Current 150,000
TETCO Gulf Mkts Current 100,000
TETCO Backhaul Current 200,000
TETCO
Team
South Current 270,000
TETCO Open Current 50,000
TCO/CGT Westside Current 50,000
TETCO/
REX/NGPL
Gulfcoast
Exp Current 75,000
TETCO/
REX/ANR Mainline Current 105,000
TETCO
Access
South Current 320,000
TCO/CGT LXP/RXP Current 50,000
Market MixBal
2018E 2019E 2020E
TETCO M2 34% 16% 27%
TETCO M3 11% 10% 8%
TCO 4% 4% 3%
Midwest 21% 18% 16%
Gulf 30% 27% 23%
SE 0% 25% 22%
NYMEX* $2.69 $2.76 $2.77
Basis $(0.37) $(0.18) $(0.24)
Realized Price $2.23 $2.58 $2.53
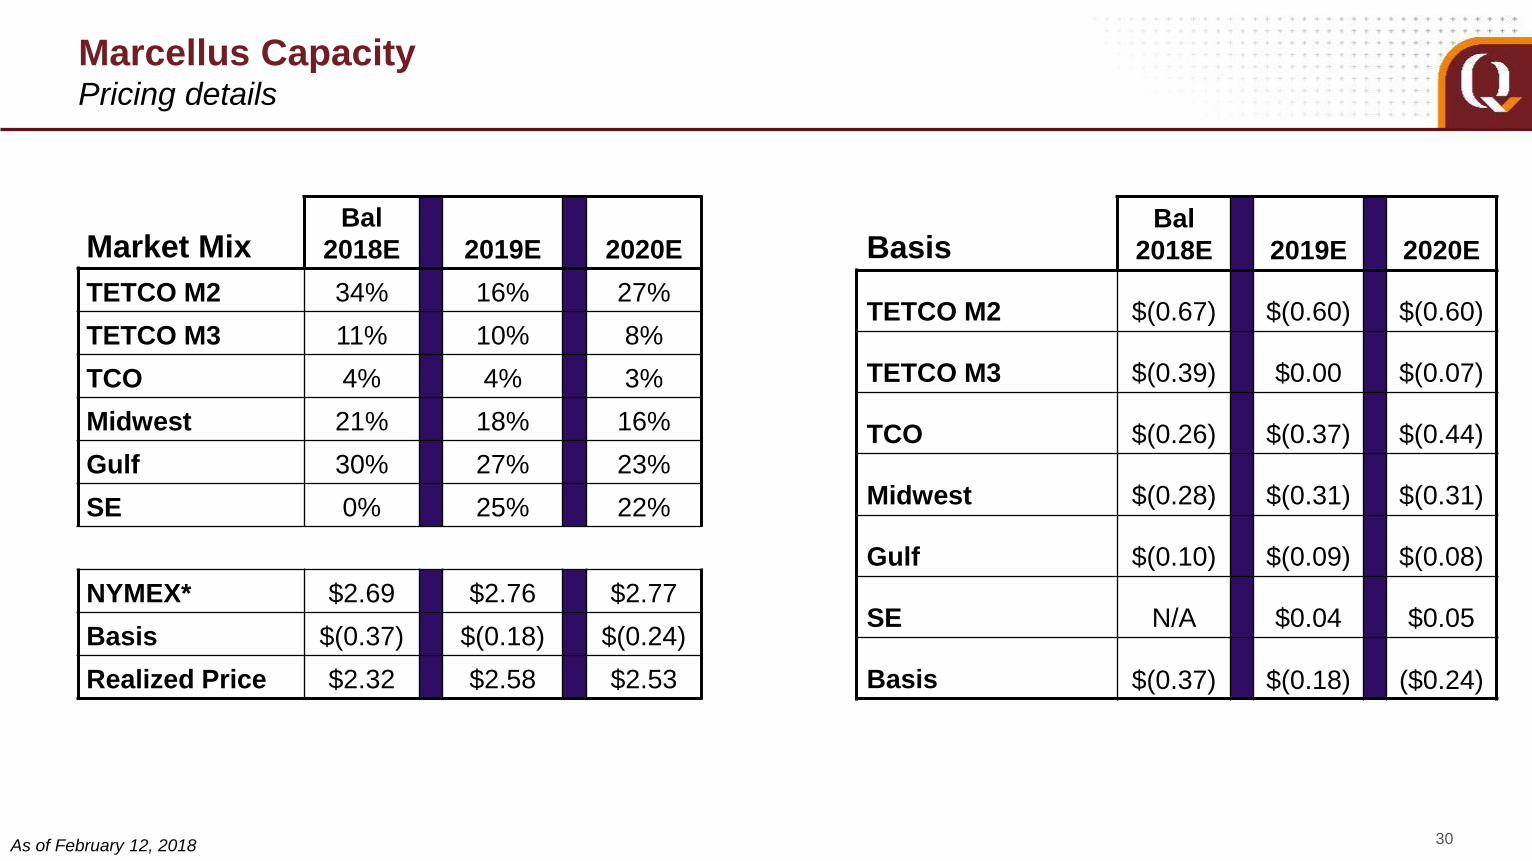
Marcellus Capacity
30
Pricing details
As of February 12, 2018
BasisBal
2018E 2019E 2020E
TETCO M2 $(0.67) $(0.60) $(0.60)
TETCO M3 $(0.39) $0.00 $(0.07)
TCO $(0.26) $(0.37) $(0.44)
Midwest $(0.28) $(0.31) $(0.31)
Gulf $(0.10) $(0.09) $(0.08)
SE N/A $0.04 $0.05
Basis $(0.37) $(0.18) ($0.24)
Market MixBal
2018E 2019E 2020E
TETCO M2 34% 16% 27%
TETCO M3 11% 10% 8%
TCO 4% 4% 3%
Midwest 21% 18% 16%
Gulf 30% 27% 23%
SE 0% 25% 22%
NYMEX* $2.69 $2.76 $2.77
Basis $(0.37) $(0.18) $(0.24)
Realized Price $2.32 $2.58 $2.53
$2.78 $2.78
$0.56$0.12
$0.81$3.34
$3.71
$0.00
$1.00
$2.00
$3.00
$4.00
$5.00
Not Processed Processed
$/M
cf
NGLs (1.6 Gal/Mcf)
Btu Premium
NYMEX
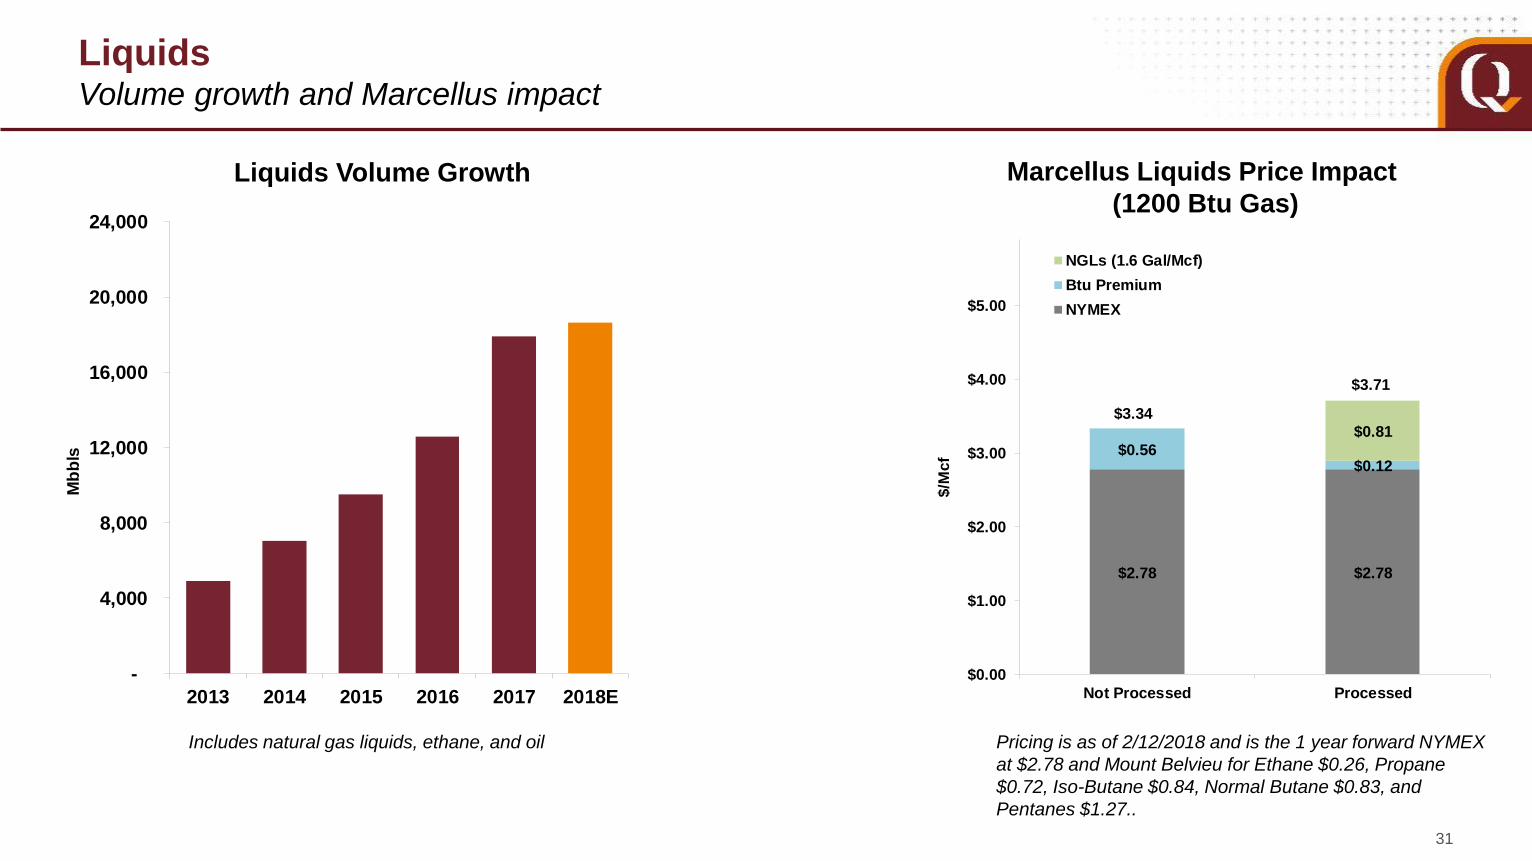
Liquids
31
Volume growth and Marcellus impact
Includes natural gas liquids, ethane, and oil
Liquids Volume Growth Marcellus Liquids Price Impact
(1200 Btu Gas)
Pricing is as of 2/12/2018 and is the 1 year forward NYMEX
at $2.78 and Mount Belvieu for Ethane $0.26, Propane
$0.72, Iso-Butane $0.84, Normal Butane $0.83, and
Pentanes $1.27..
-
4,000
8,000
12,000
16,000
20,000
24,000
2013 2014 2015 2016 2017 2018E
Mb
bls
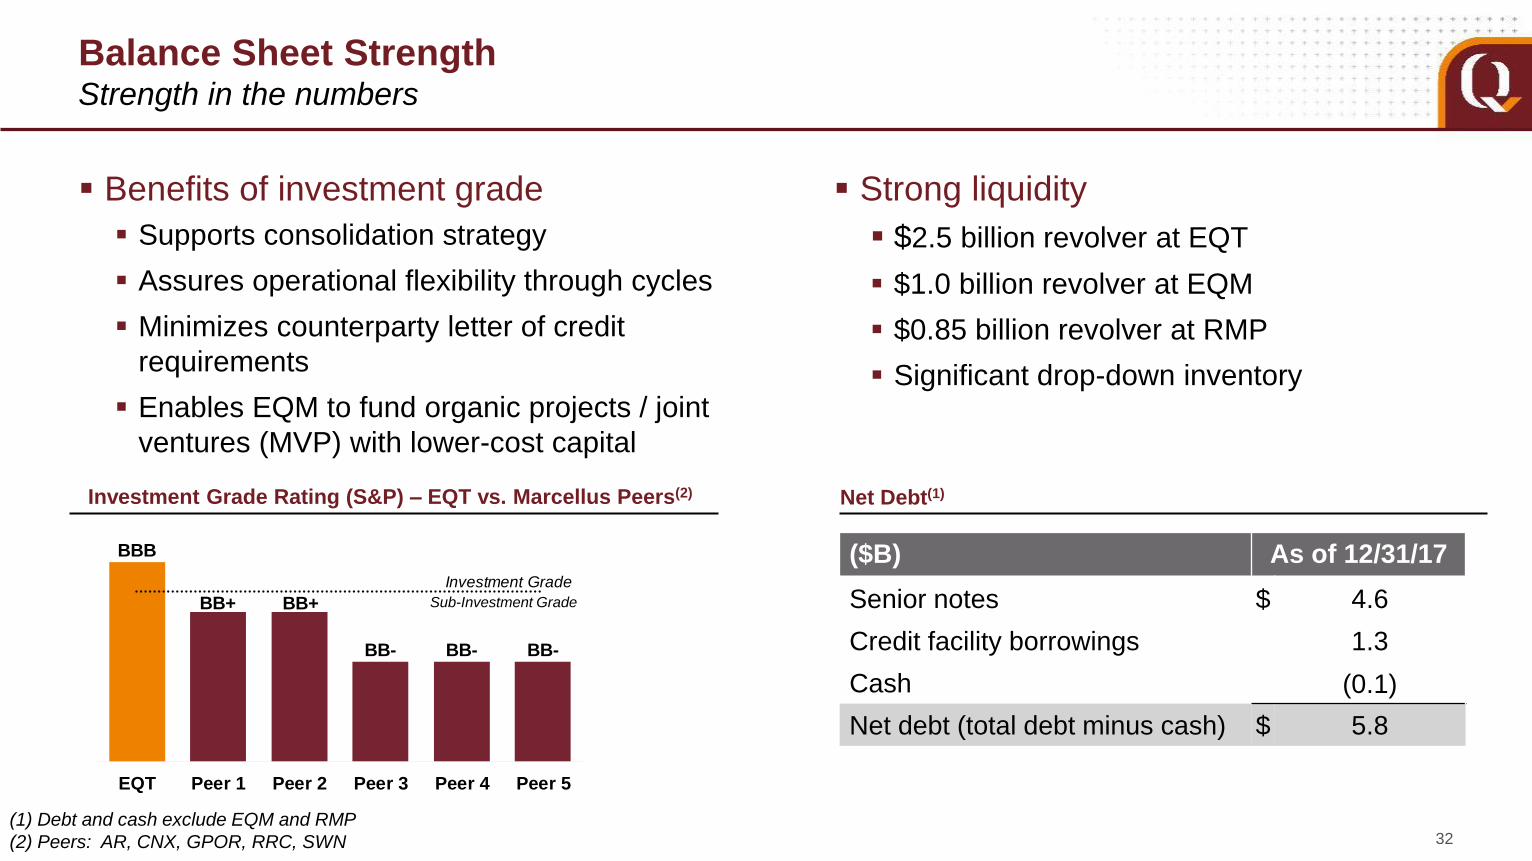
BBB
BB+ BB+
BB- BB- BB-
EQT Peer 1 Peer 2 Peer 3 Peer 4 Peer 5
Investment Grade
Balance Sheet Strength
Benefits of investment grade
Supports consolidation strategy
Assures operational flexibility through cycles
Minimizes counterparty letter of credit
requirements
Enables EQM to fund organic projects / joint
ventures (MVP) with lower-cost capital
Strong liquidity
$2.5 billion revolver at EQT
$1.0 billion revolver at EQM
$0.85 billion revolver at RMP
Significant drop-down inventory
32
Strength in the numbers
Sub-Investment Grade
Investment Grade Rating (S&P) – EQT vs. Marcellus Peers(2) Net Debt(1)
($B) As of 12/31/17
Senior notes $ 4.6
Credit facility borrowings 1.3
Cash (0.1)
Net debt (total debt minus cash) $ 5.8
(1) Debt and cash exclude EQM and RMP
(2) Peers: AR, CNX, GPOR, RRC, SWN
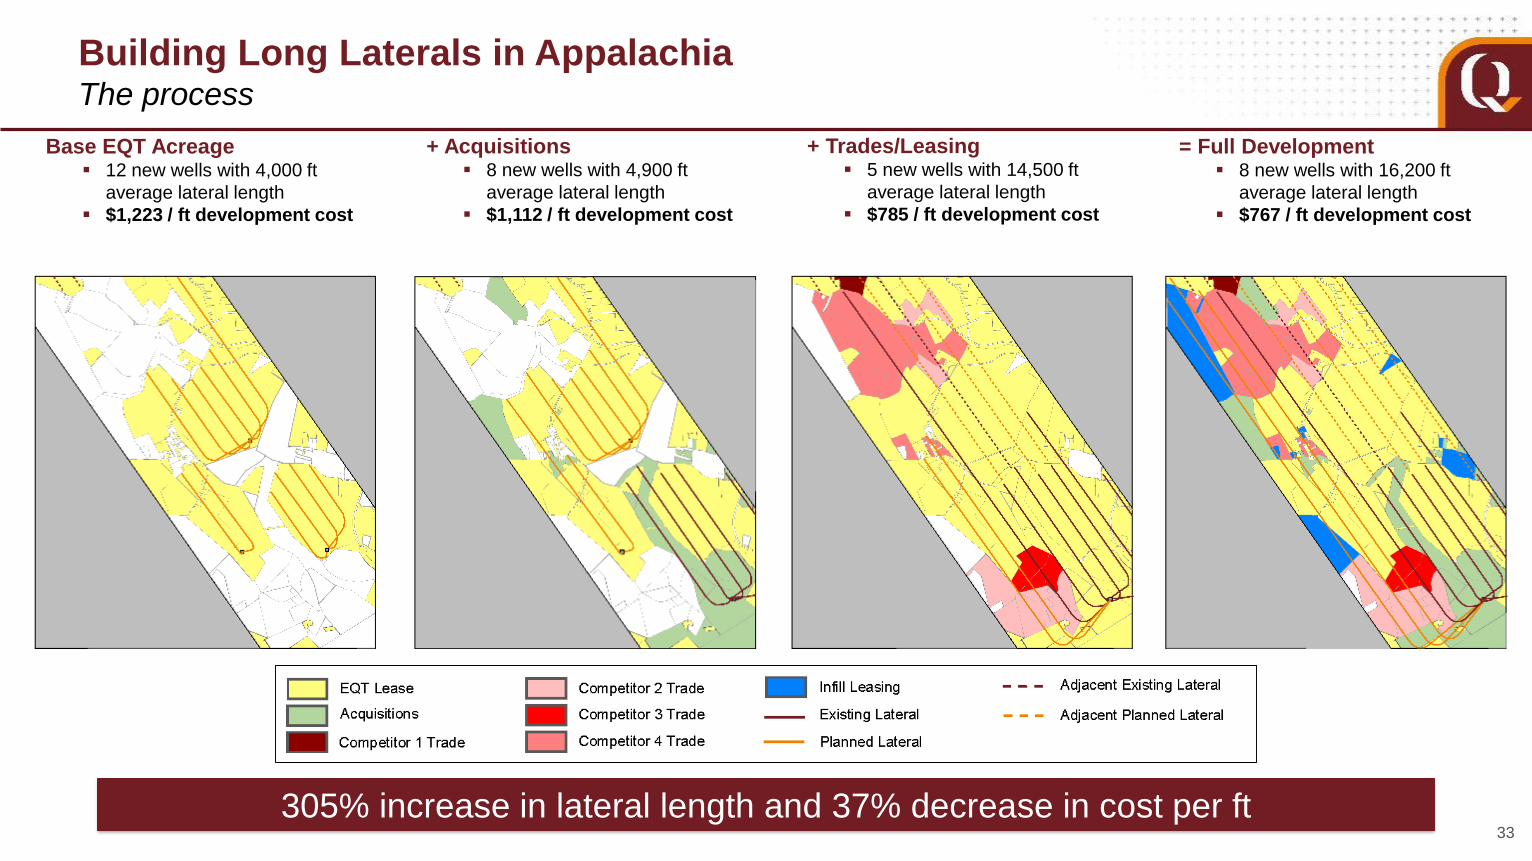
Building Long Laterals in Appalachia
Base EQT Acreage 12 new wells with 4,000 ft
average lateral length
$1,223 / ft development cost
The process
33
2017 Lateral Length: 4,500
+ Acquisitions 8 new wells with 4,900 ft
average lateral length
$1,112 / ft development cost
+ Trades/Leasing 5 new wells with 14,500 ft
average lateral length
$785 / ft development cost
= Full Development 8 new wells with 16,200 ft
average lateral length
$767 / ft development cost
Year: 2152017 Year: 2017 305% increase in lateral length and 37% decrease in cost per ft
