analyst presentation the trident, mumbai may 25, 2012 · the trident, mumbai ... affecting our...
TRANSCRIPT

1
Analyst Presentation
The Trident, Mumbai
May 25, 2012

Disclaimer
2
Certain statements in this Investors’ Forum concerning our future growth prospects are forward-looking statements, which involve a number of risks and
uncertainties that could cause actual results to differ materially from those in such forward-looking statements. The risks and uncertainties relating to
these statements include, but are not limited to, global economic conditions, the economic conditions of the regions, locations and industries that are
major markets for CGL, risks and uncertainties regarding fluctuations in earnings, our ability to manage growth, intense competition in sectors where we
operate including those factors which may affect our cost advantage, wage increases in India and worldwide, trends in raw material prices, market
acceptance of new products and services, changes in governmental regulations and costs associated with compliance activities, withdrawal of
governmental fiscal incentives, political instability and regional/locational conflicts, legal restrictions on raising capital or acquiring companies within and
outside India, and unauthorized use of our intellectual property, interest rates, fluctuations in currency exchange rates and general economic conditions
affecting our industry.
CG may, from time to time, make additional written and oral forward-looking statements, including statements contained in the company's filings with
the Stock Exchanges and Securities and Exchange Board of India and our reports to shareholders. The company does not intend or undertake to
update any forward-looking statements that may be made from time to time by or on behalf of the company.
Laurent DemortierCEO & Managing Director+91-22-24237777
Madhav AcharyaChief Financial Officer+91-22-24237777

FY 2011-12 Flashback
3
Q1
Power Business impacted in India and Europe
Reduced price level due to entry of Chinese players in EHV sector
Instability in Middle East and Eurozone
CG European manufacturing footprint sub-optimal
Fragmented sourcing of key commodities
Limited capacity increase potential in Indian plants
Consumer Business impacted in India
High sensitivity to pricing strategy
Industrial Business predominantly India centric

FY 2011-12 Flashback
4
Power Business impacted in India and Europe
Product portfolio and organization
CG European manufacturing footprint sub-optimal
Fragmented sourcing of key commodities
Limited capacity increase potential in Indian plants
Consumer Business impacted in India
Product portfolio evolution / Channel management
Industrial Business predominantly India centric
Increased exports

5
Q4 Results

29080
30774
Q4 2011 Q4 2012
25875
28961
Q4 2011 Q4 2012
6
Q4 Highlights – CG GlobalINR Mn.
+ 12%
+ 6%
Orders
Revenues
Q4 2011-12 vs Q4 2010-11
» Order Received +12%
» Revenue growth +6%
Q4 2011-12 vs Q3 2011-12
» Order Received -15%
» Revenue growth +2%

Qtr 1 Qtr 2 Qtr 3 Qtr 4
7
Orders by Region
India*
Asia + Pacific
EMEA
Americas15%
26%
50%
9%
* Includes India consumers Business
Qtr 1 Qtr 2 Qtr 3 Qtr 4
Qtr 1 Qtr 2 Qtr 3 Qtr 4
Qtr 1 Qtr 2 Qtr 3 Qtr 4

8
Consolidated Financials – Q4INR Mn.
Q4 Mar 2011 Q4 Mar 2012
Orders Received 25875 28961
12%
Revenues 29080 30774
6%
Order Backlog 71652 83664
17%
EBIDTA (W/O Other Income)
3731 2132
as % revenue 7%
EBIT 3134 1493
PAT 2514 1003
EPS (Rs) 3.92 1.56

9
Consolidated Segment Results – Q4INR Mn.
Q4 Mar 2011 Q4 Mar 2012 Δ Change
Power
Orders Received 21795 24521 13%
Revenues 19235 19682 2%
EBIT 2570 541
EBIT Margin 13.4% 2.7%
Industrial
Orders Received 4080 4440 9%
Revenues 4345 5001 15%
EBIT 649 542
EBIT Margin 14.9% 10.8%
Consumer
Revenues 5509 6066 10%
EBIT 789 740
EBIT Margin 14.3% 12.2%

71652
83664
Q4 2011 Q4 2012
10
UEOB Evolution
+ 17%
INR Mn.

21795
24521
Q4 2011 Q4 2012
+ 13%
11
Q4 Performance
»EHV» Record order for EHV Power
Transformers and reactors
» 22 Nos.765KV from PGCIL
» 350MVA,220kv and 500kv from PLN
»Exports» 14% increase from India and Hungary
(Key destinations – Latin America, ME,
Western Europe)
»Services» INR 170 Mn orders for pluri-annual
Service maintenance contracts (India,
France, Saudi Arabia and Algeria)
Rs Mn.
Power Business
Order Input
1923519682
Q4 2011 Q4 2012
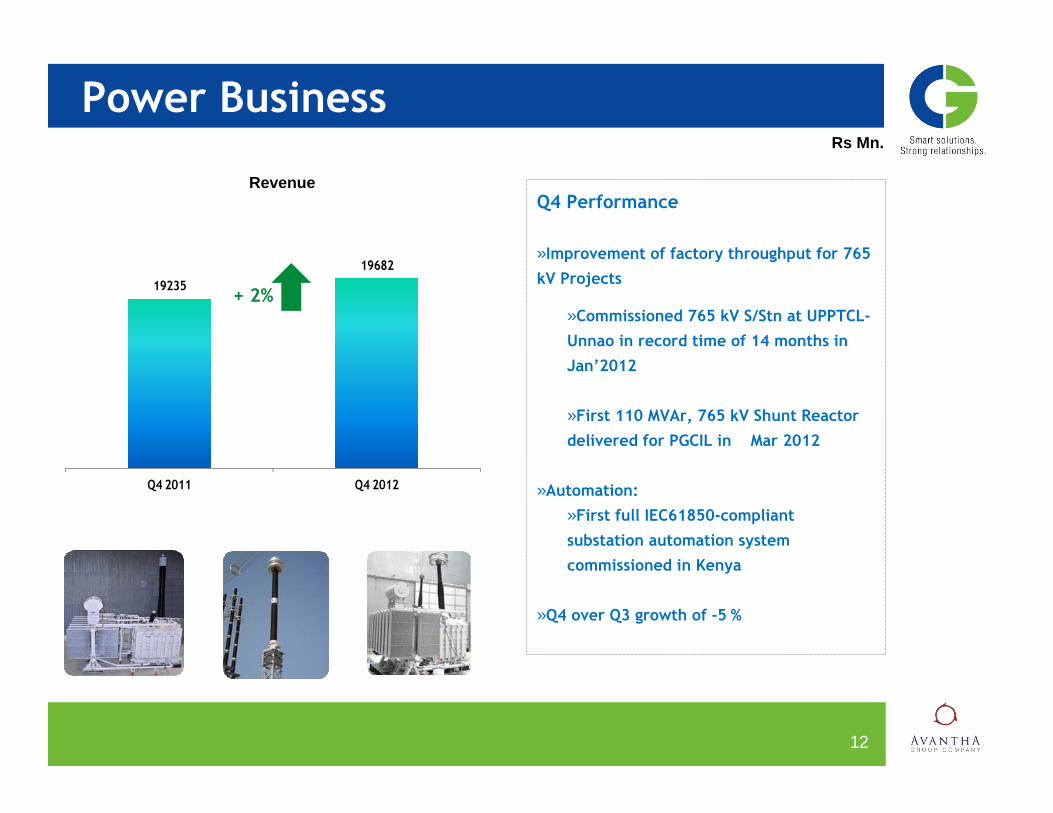
12
Q4 Performance
»Improvement of factory throughput for 765
kV Projects
»Commissioned 765 kV S/Stn at UPPTCL-
Unnao in record time of 14 months in Jan’2012
»First 110 MVAr, 765 kV Shunt Reactor
delivered for PGCIL in Mar 2012
»Automation:»First full IEC61850-compliant
substation automation system commissioned in Kenya
»Q4 over Q3 growth of -5 %
Rs Mn.
Power Business
+ 2%
Revenue

4345
5001
Q4 2011 Q4 2012
4080
4440
Q4 2011 Q4 2012
13
» Q4 Performance
» Exports
» 24% increase in export orders from India mainly to Western countries (HT and LT Motors)
» First 6.7 MW HT Motor order for German customer for Cement plant
» Smart Solutions
» 2.5 MW/6-P HT Motors and 6.6kV MV Drives from Steel Plant Central Asia
» Largest 4 MW 22-P motor for circulating water pump application in Nuclear Power plant in Russia
» Electrical Transportation» Order for 43 Nos Traction Motor
for Indian Railways
» Q4 vs Q3 growth of 5%
Rs. Mn
Industrial Systems
+ 9 %
Orders
Revenue
+ 15 %

5509
6066
Q4 2011 Q4 2012
14
» Fans » Successful introduction of the
New Premium range of fans
» Strong traction in volumes for Fans – 972 k Fans sold in Mar 12
» Lighting Solutions » Orders worth INR 100 Mn for
Special Applications in the
Infrastructure segment including Flame proof lighting
» Channel Management» “Best Business Partner” program
launched
» Growth of 21% in Q4 over Q3 2012
Consumer ProductsRs. Mn
4th consecutive Superbrandsaccreditation
with CG
Lighting solutions for all applications
+ 10 %
Premium range in Ceiling Fans
Orders/ Revenue
15
FY 2011-12 Results
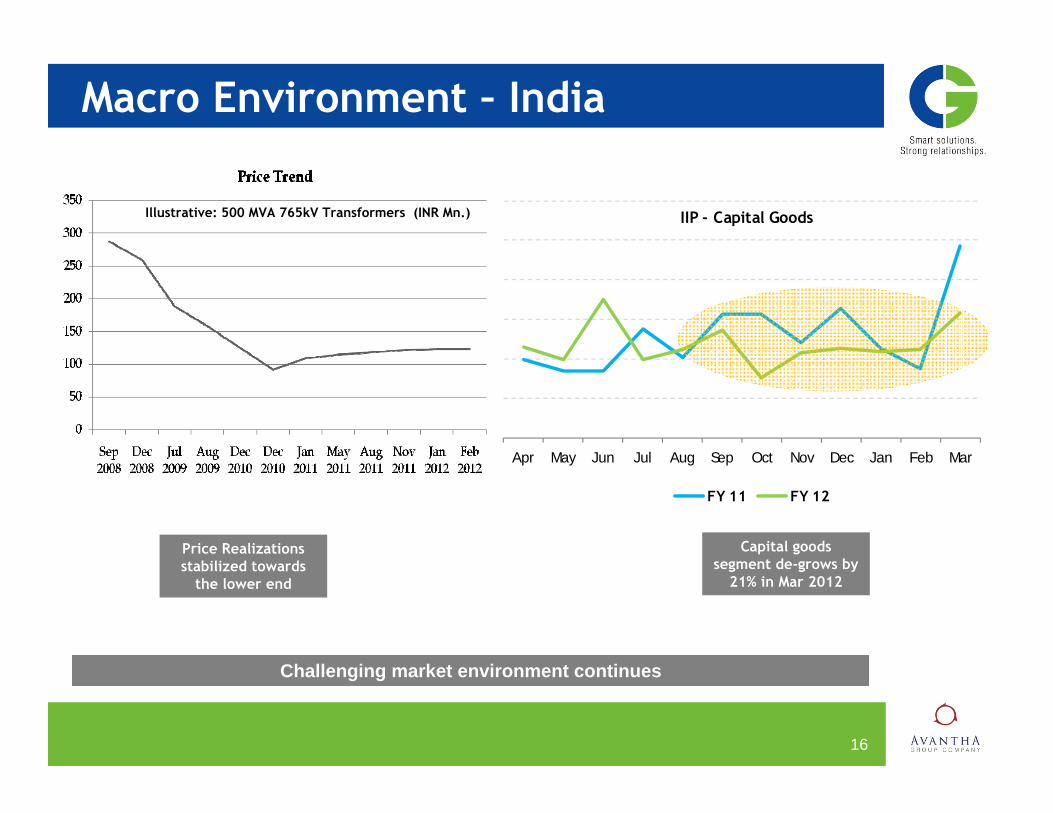
Apr May Jun Jul Aug Sep Oct Nov Dec Jan Feb Mar
IIP - Capital Goods
FY 11 FY 12
16
Macro Environment – India
Challenging market environment continues
Illustrative: 500 MVA 765kV Transformers (INR Mn.)
Capital goods segment de-grows by
21% in Mar 2012
Price Realizations stabilized towards
the lower end

17
Market Scenario
Renewables Wind offshore to support growth
Industrial market remains largest in the world. Utilities and industrial markets open to Asian product suppliers
Oil and Gas to support growth for both Power and Industrial segments
Americas
Asia Pacific
EMEA
Medium term outlook remains moderately positive
Moderate growth in Power and Industrial driven by increase in renewables generation in North America
Oil and Gas business to support growth for both Power and Industrial segments
ANEEL plans to auction more than 8,000 km of transmission line length and 20 substations in 2012
India
PGCIL orders and renewables to sustain growth in Power and Industrial segments
Industrial segment to remain weak. Railway transportation to supplement growth
Moderate outlook for Consumer segment

18
Consolidated Financials – FY 2012INR Mn.
FY 2010-11 FY 2011-12
Orders Received 89406 102644
15%
Revenues 100051 112486
12%
Order Backlog 71652 83664
17%
EBIDTA (W/O Other Income)
13438 8036
as % revenue 7%
EBIT 11502 5437
PAT 8887 3736
EPS (Rs) 13.85 5.82
Q1 Q2 Q3 Q4
Order Intake Sales

19
Consolidated Segment ResultsINR Mn.
FY Mar 2011 FY Mar 2012 Δ Change
Power
Orders Received 72120 84710 17%
Revenues 65029 73149 12%
EBIT 8068 2394
EBIT Margin 12.4% 3.3%
Industrial
Orders Received 17290 17930 4%
Revenues 14971 18202 22%
EBIT 2642 2103
EBIT Margin 17.6% 11.6%
Consumer
Revenues 20212 21336 6%
EBIT 2928 2629
EBIT Margin 14.5% 12.3%

20
Key Areas to Restore Value
Continuous Improvement
Projects
New offering in Premium segments
Sourcing
Manufacturing footprint

Strategic Agenda – Three Year PlanStrategic levers
Offering
Move to High value added offerings 1200/765 kV Power Transformers, CVT and Surge Arrestors Energy efficient Motors for global market
New segments: Engineering services for utilities Enter new geographies – Middle East, Brazil Additional EBIDTA of 150 bps
Continuous Improvement
21
Sourcing
Manufacturing Footprint
Global sourcing organization in place Sourcing office established in Shanghai, China in July 2011 Additional EBIDTA of 150 bps
European platforms to be consolidated by 2012-13 Additional capacity in India +50,000 MVA CGPS implementation in European plants Additional EBIDTA of 100 bps
Actions Steps
Six sigma program roll out world wide Sustainability program deployed in each unit Additional EBIDTA of 50 bps

22
Outlook 2012-13
Sales growth to remain strong at 12-14% supported by
Healthy Order Book
Robust Order Intake
Power BU - UHV and Renewables in Asia, Europe and Americas
Industrial BU - Penetration of European and Middle East markets and development of railway transportation in India
Consumer BU - Portfolio expansion and consolidation of the Trade channel
EBIDTA Margin to be in the range of 8-9%

23