analyst presentation y2014
TRANSCRIPT
A n a l y s t P r e s e n t a t i o n
H E R A G R O U P
Y 1 4 F I N A N C I A L R E S U L T S
25 MARCH 2015
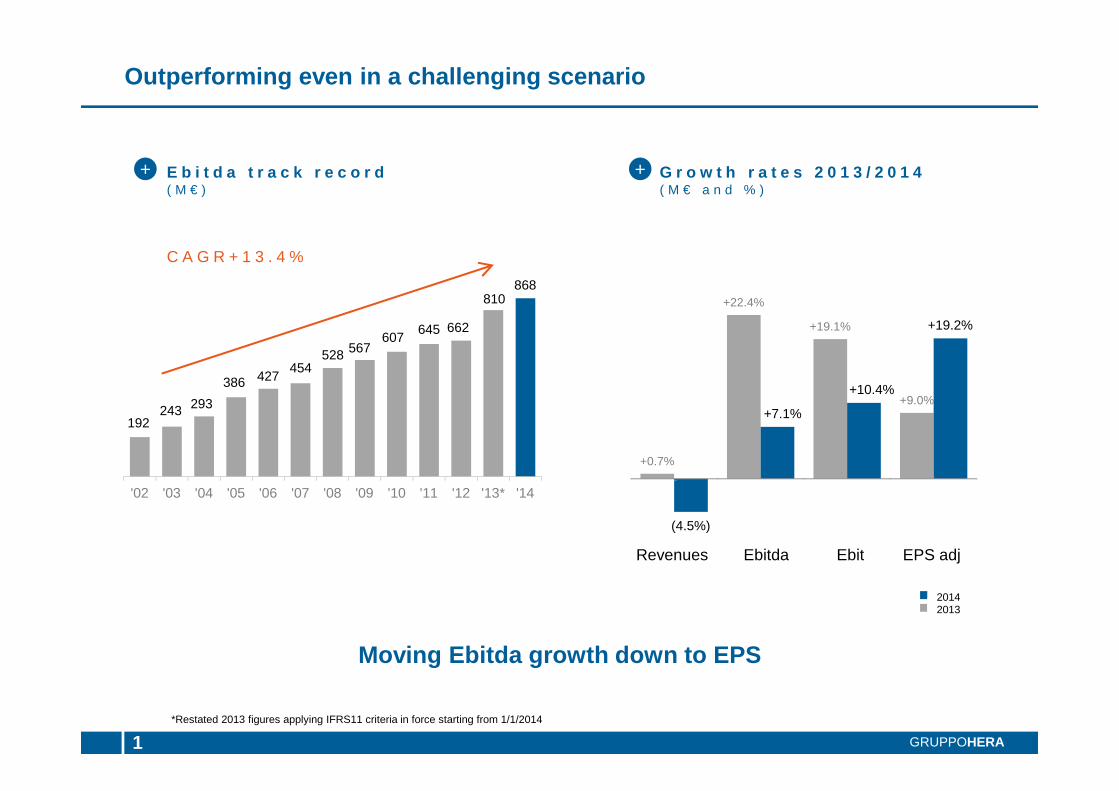
Outperforming even in a challenging scenario
1 GRUPPOHERA
G r o w t h r a t e s 2 0 1 3 / 2 0 1 4( M € a n d % )
Moving Ebitda growth down to EPS
*Restated 2013 figures applying IFRS11 criteria in force starting from 1/1/2014
+0.7%
+22.4%
+19.1%
+9.0%
(4.5%)
+7.1%
+10.4%
+19.2%
Revenues Ebitda Ebit EPS
C A G R + 1 3 . 4 %
E b i t d a t r a c k r e c o r d( M € )
192 243 293
386 427 454
528 567 607
645 662
810 868
'02 '03 '04 '05 '06 '07 '08 '09 '10 '11 '12 '13* '14
Revenues Ebitda Ebit EPS adj
+ +
20132014
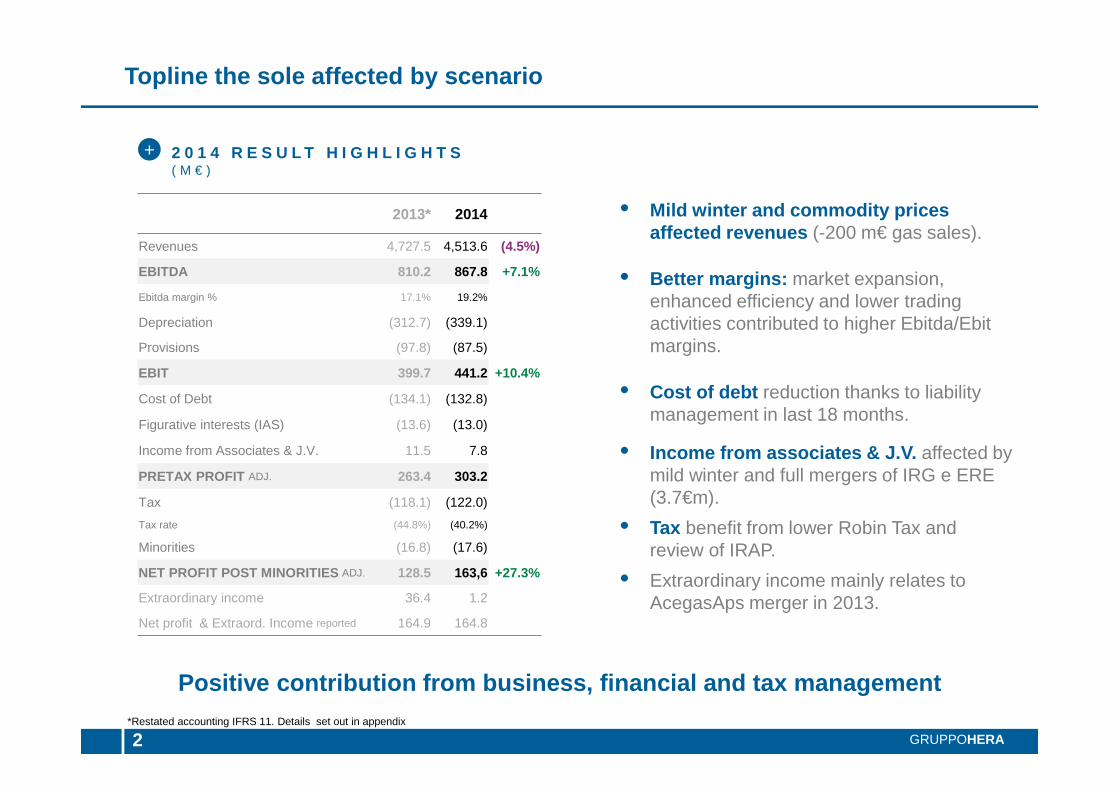
Topline the sole affected by scenario
2 0 1 4 R E S U L T H I G H L I G H T S( M € )
2 GRUPPOHERA
• Mild winter and commodity prices affected revenues (-200 m€ gas sales).
• Better margins: market expansion, enhanced efficiency and lower trading activities contributed to higher Ebitda/Ebitmargins.
• Cost of debt reduction thanks to liability management in last 18 months.
• Income from associates & J.V. affected by mild winter and full mergers of IRG e ERE (3.7€m).
• Tax benefit from lower Robin Tax and review of IRAP.
• Extraordinary income mainly relates to AcegasAps merger in 2013.
2013* 2014
Revenues 4,727.5 4,513.6 (4.5%)
EBITDA 810.2 867.8 +7.1%
Ebitda margin % 17.1% 19.2%
Depreciation (312.7) (339.1)
Provisions (97.8) (87.5)
EBIT 399.7 441.2 +10.4%
Cost of Debt (134.1) (132.8)
Figurative interests (IAS) (13.6) (13.0)
Income from Associates & J.V. 11.5 7.8
PRETAX PROFIT ADJ. 263.4 303.2
Tax (118.1) (122.0)
Tax rate (44.8%) (40.2%)
Minorities (16.8) (17.6)
NET PROFIT POST MINORITIES ADJ. 128.5 163,6 +27.3%
Extraordinary income 36.4 1.2
Net profit & Extraord. Income reported 164.9 164.8
*Restated accounting IFRS 11. Details set out in appendix
Positive contribution from business, financial and ta x management
+
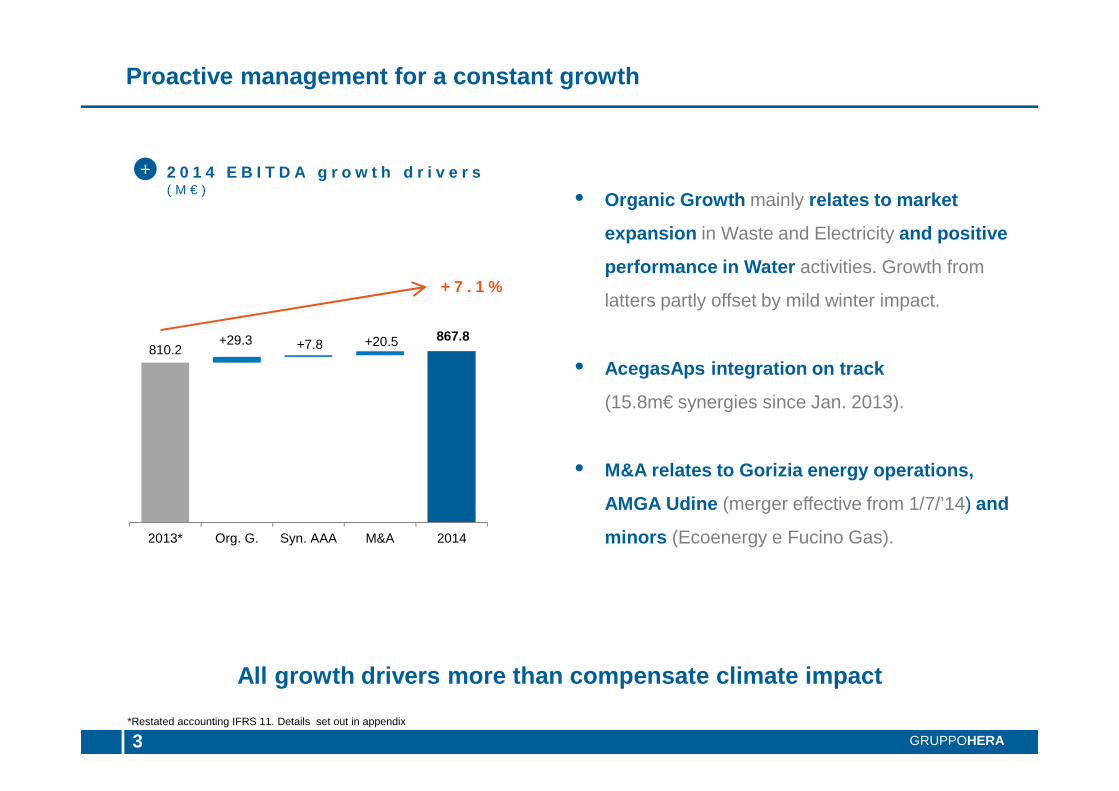
810.2867.8+29.3 +7.8 +20.5
2013* Org. G. Syn. AAA M&A 2014
All growth drivers more than compensate climate impa ct
3 GRUPPOHERA
• Organic Growth mainly relates to market
expansion in Waste and Electricity and positive
performance in Water activities. Growth from
latters partly offset by mild winter impact.
• AcegasAps integration on track
(15.8m€ synergies since Jan. 2013).
• M&A relates to Gorizia energy operations,
AMGA Udine (merger effective from 1/7/’14) and
minors (Ecoenergy e Fucino Gas).
Proactive management for a constant growth
+ 7 . 1 %
2 0 1 4 E B I T D A g r o w t h d r i v e r s( M € )
+
*Restated accounting IFRS 11. Details set out in appendix
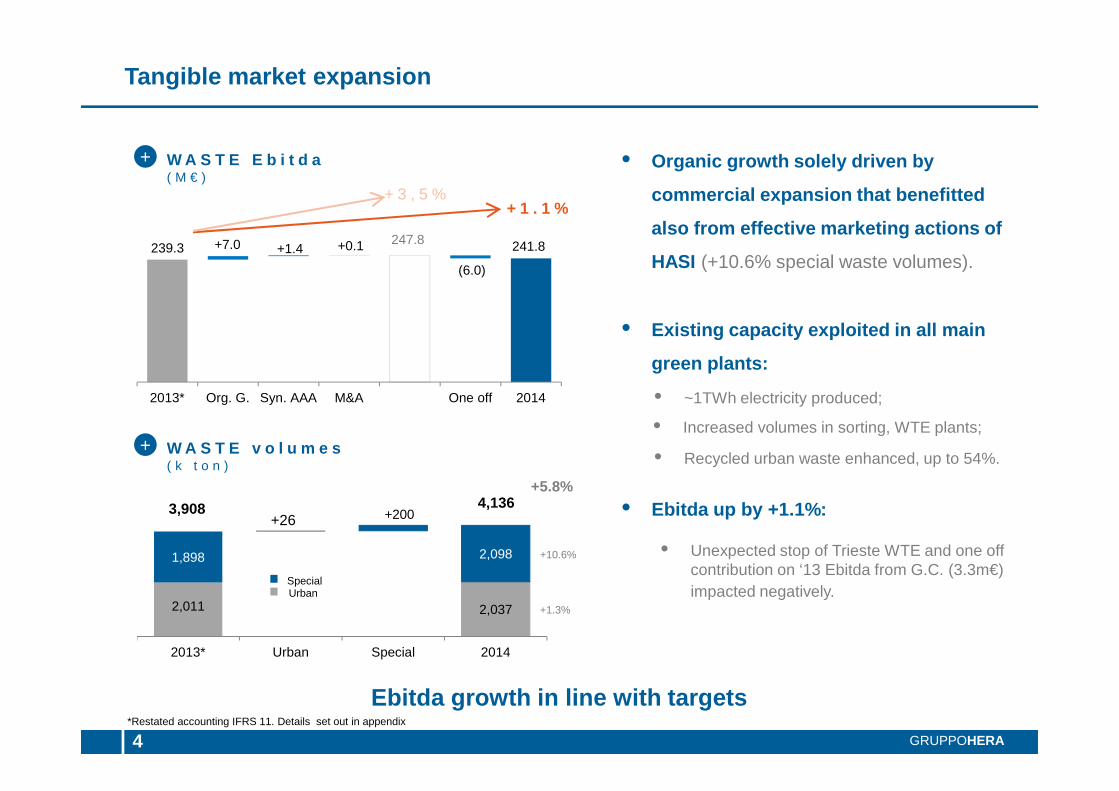
2,011 2,037
1,898
+200
2,098
+26
2013* Urban Special 2014
Tangible market expansion
4 GRUPPOHERA
• Organic growth solely driven by
commercial expansion that benefitted
also from effective marketing actions of
HASI (+10.6% special waste volumes).
• Existing capacity exploited in all main
green plants:
• Ebitda up by +1.1%:
Ebitda growth in line with targets
• Recycled urban waste enhanced, up to 54%.
• ~1TWh electricity produced;
+5.8%
+10.6%
3,908 4,136
UrbanSpecial
• Increased volumes in sorting, WTE plants;
• Unexpected stop of Trieste WTE and one off contribution on ‘13 Ebitda from G.C. (3.3m€) impacted negatively.
W A S T E E b i t d a( M € )
+
W A S T E v o l u m e s( k t o n )
+
239.3247.8 241.8+7.0 +1.4 +0.1
(6.0)
2013* Org. G. Syn. AAA M&A One off 2014
+ 1 . 1 %+ 3 , 5 %
+1.3%
*Restated accounting IFRS 11. Details set out in appendix
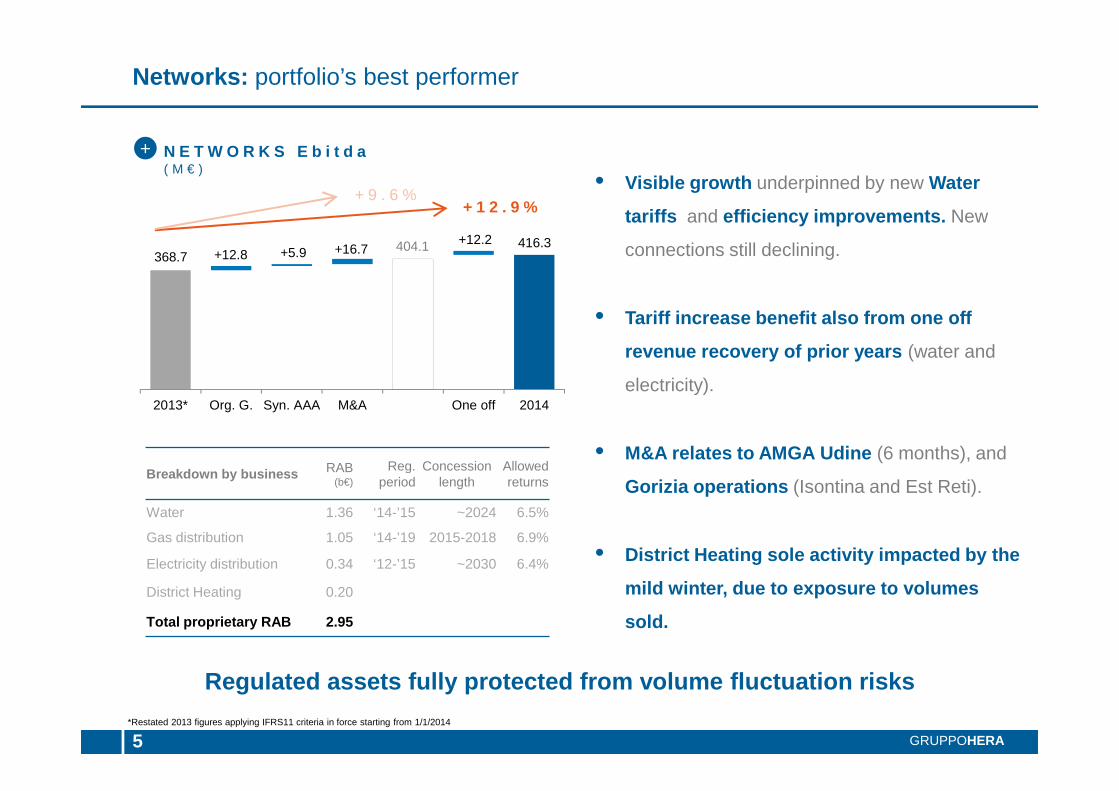
Regulated assets fully protected from volume fluctua tion risks
N E T W O R K S E b i t d a( M € )
5 GRUPPOHERA
• Visible growth underpinned by new Water
tariffs and efficiency improvements. New
connections still declining.
• Tariff increase benefit also from one off
revenue recovery of prior years (water and
electricity).
• M&A relates to AMGA Udine (6 months), and
Gorizia operations (Isontina and Est Reti).
• District Heating sole activity impacted by the
mild winter, due to exposure to volumes
sold.
Networks: portfolio’s best performer
Breakdown by business RAB(b€)
Reg. period
Concession length
Allowed returns
Water 1.36 ‘14-’15 ~2024 6.5%
Gas distribution 1.05 ‘14-’19 2015-2018 6.9%
Electricity distribution 0.34 ‘12-’15 ~2030 6.4%
District Heating 0.20
Total proprietary RAB 2.95
*Restated 2013 figures applying IFRS11 criteria in force starting from 1/1/2014
+
+ 1 2 . 9 %+ 9 . 6 %
368.7404.1 416.3
+12.8 +5.9 +16.7+12.2
2013* Org. G. Syn. AAA M&A One off 2014
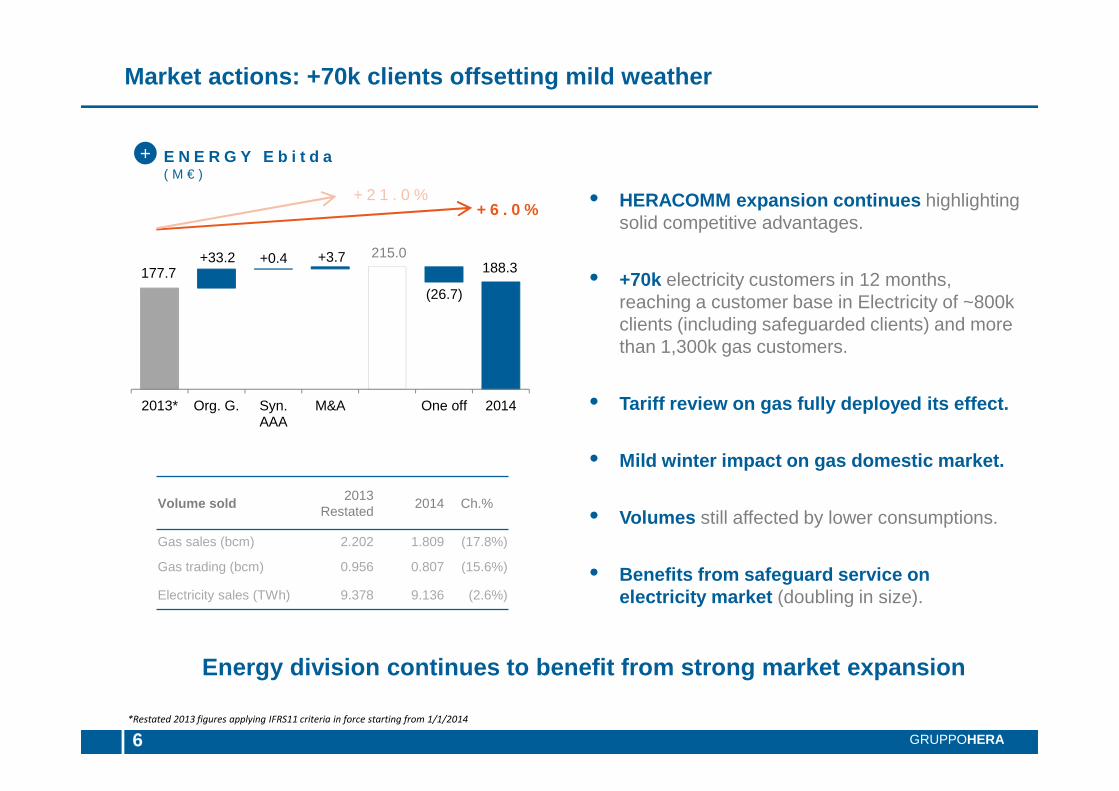
Market actions: +70k clients offsetting mild weathe r
E N E R G Y E b i t d a( M € )
6 GRUPPOHERA
• HERACOMM expansion continues highlighting solid competitive advantages.
• +70k electricity customers in 12 months, reaching a customer base in Electricity of ~800k clients (including safeguarded clients) and more than 1,300k gas customers.
• Tariff review on gas fully deployed its effect.
• Mild winter impact on gas domestic market.
• Volumes still affected by lower consumptions.
• Benefits from safeguard service on electricity market (doubling in size).
Energy division continues to benefit from strong ma rket expansion
+
*Restated 2013 figures applying IFRS11 criteria in force starting from 1/1/2014
177.7215.0
188.3+33.2 +0.4 +3.7
(26.7)
2013* Org. G. Syn.AAA
M&A One off 2014
+ 6 . 0 %+ 2 1 . 0 %
Volume sold2013
Restated2014 Ch.%
Gas sales (bcm) 2.202 1.809 (17.8%)
Gas trading (bcm) 0.956 0.807 (15.6%)
Electricity sales (TWh) 9.378 9.136 (2.6%)
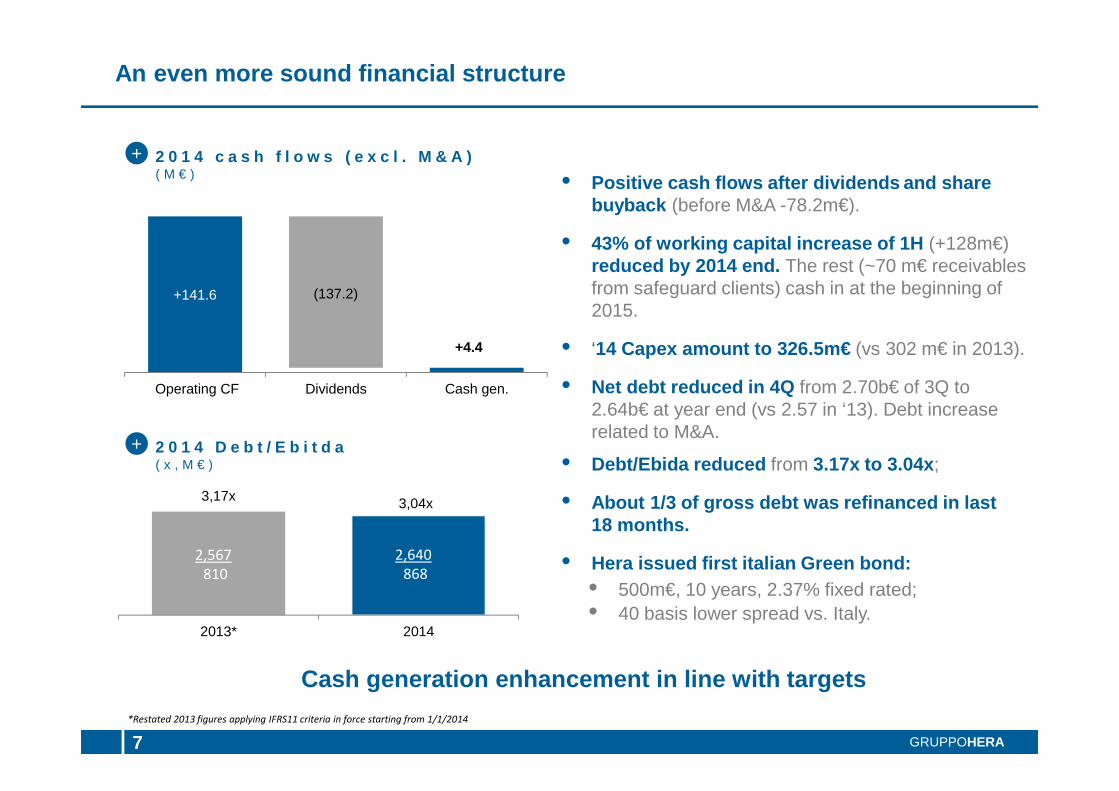
Cash generation enhancement in line with targets
7 GRUPPOHERA
2 0 1 4 c a s h f l o w s ( e x c l . M & A )( M € )
+141.6
+4.4
(137.2)
Operating CF Dividends Cash gen.
• Positive cash flows after dividends and share buyback (before M&A -78.2m€).
• 43% of working capital increase of 1H (+128m€) reduced by 2014 end. The rest (~70 m€ receivables from safeguard clients) cash in at the beginning of 2015.
• ‘14 Capex amount to 326.5m€ (vs 302 m€ in 2013).
• Net debt reduced in 4Q from 2.70b€ of 3Q to 2.64b€ at year end (vs 2.57 in ‘13). Debt increase related to M&A.
An even more sound financial structure
• 500m€, 10 years, 2.37% fixed rated;
• Debt/Ebida reduced from 3.17x to 3.04x ;
• About 1/3 of gross debt was refinanced in last 18 months.
• Hera issued first italian Green bond:
• 40 basis lower spread vs. Italy.
3,17x 3,04x
2013* 2014
2 0 1 4 D e b t / E b i t d a( x , M € )
+
+
*Restated 2013 figures applying IFRS11 criteria in force starting from 1/1/2014
2,567
810
2,640
868
“In the spotlight”: closing remarks
• Organic Growth and synergies achieved , quarter by quarter, confirm the resilience of Hera balanced portfolio mix.
• Sector consolidation progressed and is providing the synergies planned from integration. AMGA Udine integration started 1st July.
• Both financial and tax management provided contribution to bottom line growth .
• DPS proposal of 9c€.
• Laws recently introduced incentives for Municipalities divestments. Further laws should come to finalise the initiative of the Government to promote sector consolidation .
Well on track on business plan targets
GRUPPOHERA8
Q & A S E S S I O N
• IFRS 11 restatement
• IFRS 11 and overheads new allocation criteria by Division and by Business
• Ebitda by Business
A p p e n d i x
Catch up soon…
GRUPPOHERA
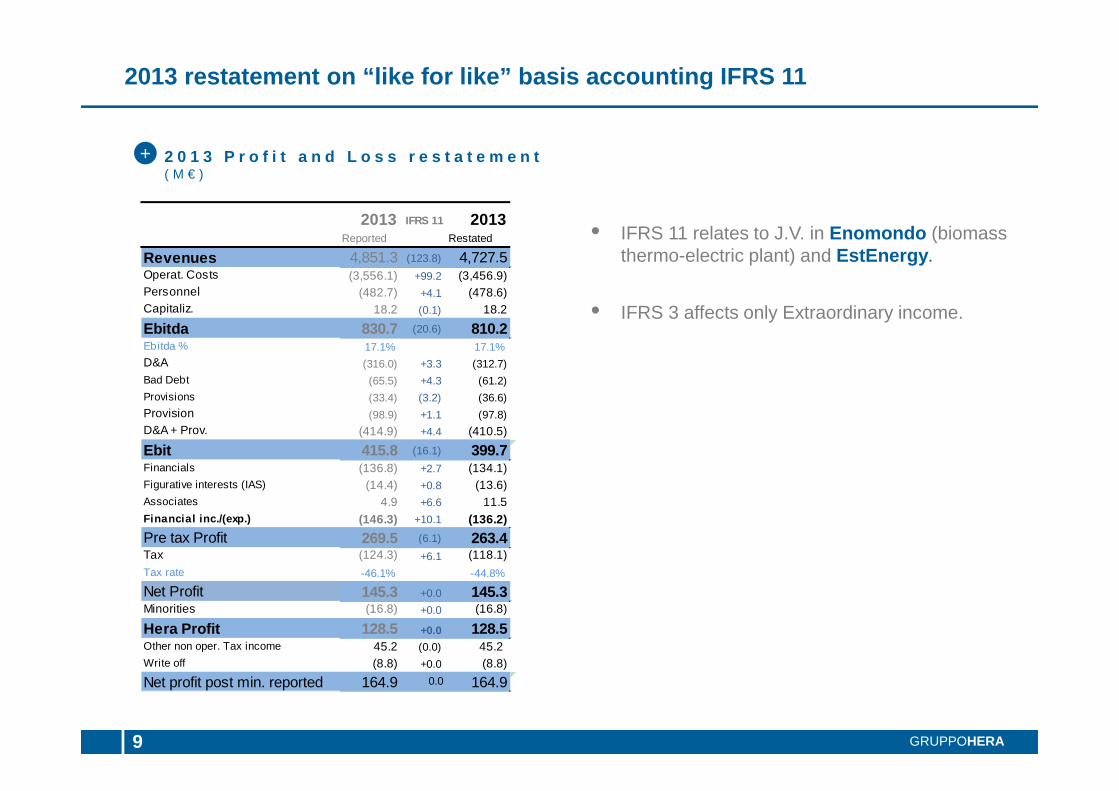
2013 restatement on “like for like” basis accounting IFRS 11
2 0 1 3 P r o f i t a n d L o s s r e s t a t e m e n t ( M € )
9 GRUPPOHERA
• IFRS 11 relates to J.V. in Enomondo (biomass thermo-electric plant) and EstEnergy .
• IFRS 3 affects only Extraordinary income.
+
2013 IFRS 11 2013Reported Restated
Revenues 4,851.3 (123.8) 4,727.5Operat. Costs (3,556.1) +99.2 (3,456.9)Personnel (482.7) +4.1 (478.6)Capitaliz. 18.2 (0.1) 18.2
Ebitda 830.7 (20.6) 810.2Ebitda % 17.1% 17.1%D&A (316.0) +3.3 (312.7)
Bad Debt (65.5) +4.3 (61.2)
Provisions (33.4) (3.2) (36.6)Provision (98.9) +1.1 (97.8)D&A + Prov. (414.9) +4.4 (410.5)
Ebit 415.8 (16.1) 399.7Financials (136.8) +2.7 (134.1)Figurative interests (IAS) (14.4) +0.8 (13.6)Associates 4.9 +6.6 11.5Financial inc./(exp.) (146.3) +10.1 (136.2)
Pre tax Profit 269.5 (6.1) 263.4Tax (124.3) +6.1 (118.1)Tax rate -46.1% -44.8%
Net Profit 145.3 +0.0 145.3Minorities (16.8) +0.0 (16.8)
Hera Profit 128.5 +0.0 128.5Other non oper. Tax income 45.2 (0.0) 45.2 Write off (8.8) +0.0 (8.8)
Net profit post min. reported 164.9 0.0 164.9
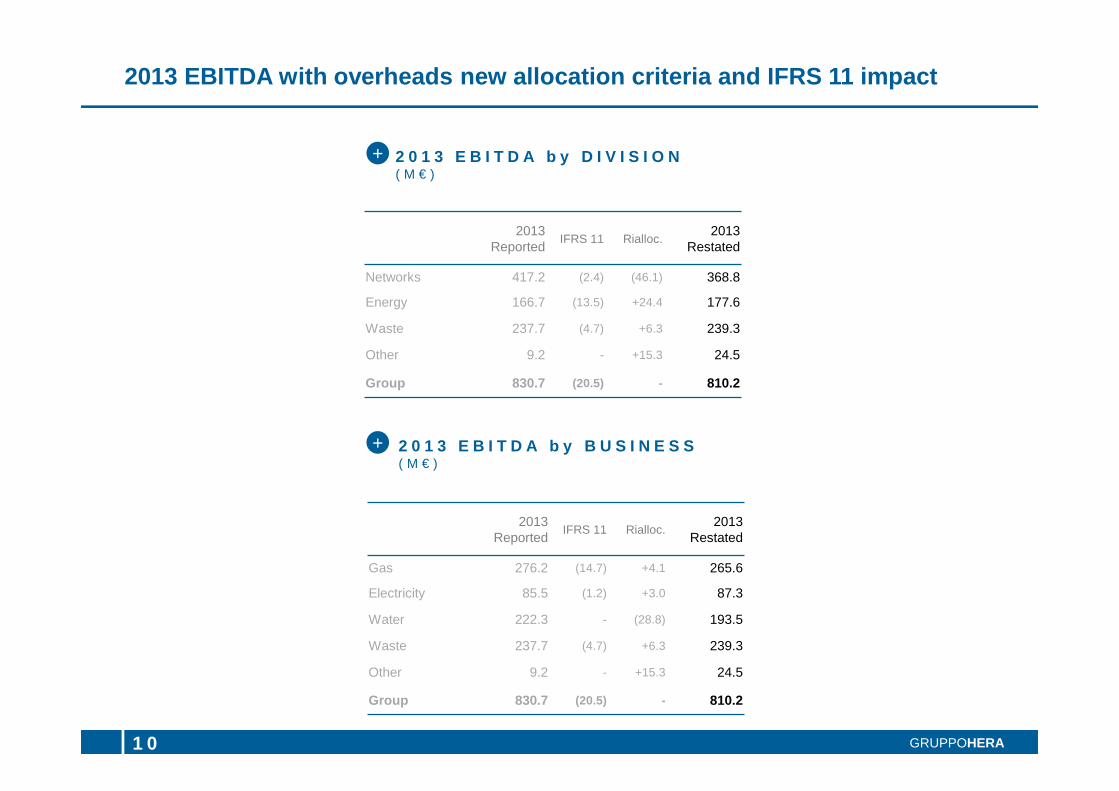
2013 EBITDA with overheads new allocation criteria and IFRS 11 impact
2 0 1 3 E B I T D A b y D I V I S I O N ( M € )
1 0 GRUPPOHERA
2 0 1 3 E B I T D A b y B U S I N E S S ( M € )
+
+
2013 Reported
IFRS 11 Rialloc.2013
Restated
Gas 276.2 (14.7) +4.1 265.6
Electricity 85.5 (1.2) +3.0 87.3
Water 222.3 - (28.8) 193.5
Waste 237.7 (4.7) +6.3 239.3
Other 9.2 - +15.3 24.5
Group 830.7 (20.5) - 810.2
2013 Reported
IFRS 11 Rialloc.2013
Restated
Networks 417.2 (2.4) (46.1) 368.8
Energy 166.7 (13.5) +24.4 177.6
Waste 237.7 (4.7) +6.3 239.3
Other 9.2 - +15.3 24.5
Group 830.7 (20.5) - 810.2
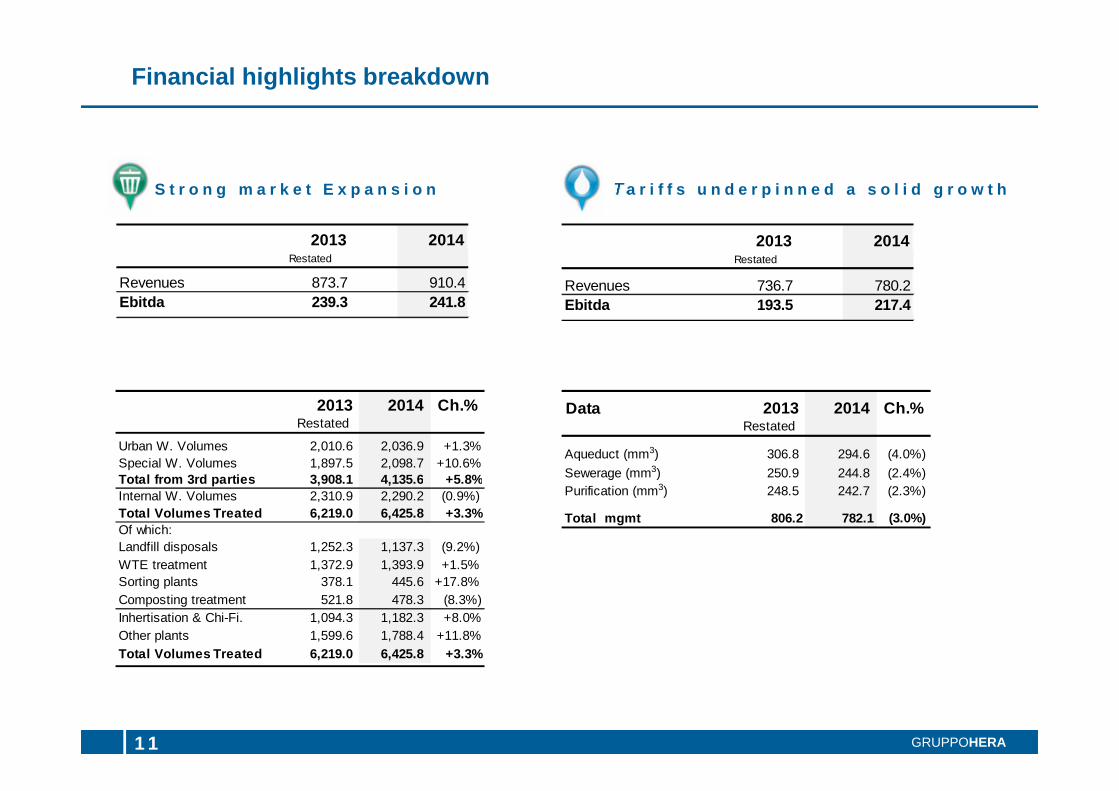
T a r i f f s u n d e r p i n n e d a s o l i d g r o w t h
Financial highlights breakdown
1 1 GRUPPOHERA
S t r o n g m a r k e t E x p a n s i o n
2013 2014Restated
Revenues 873.7 910.4Ebitda 239.3 241.8
2013 2014 Ch.%Restated
Urban W. Volumes 2,010.6 2,036.9 +1.3%Special W. Volumes 1,897.5 2,098.7 +10.6%Total from 3rd parties 3,908.1 4,135.6 +5.8%Internal W. Volumes 2,310.9 2,290.2 (0.9%)Total Volumes Treated 6,219.0 6,425.8 +3.3%Of which:Landfill disposals 1,252.3 1,137.3 (9.2%)WTE treatment 1,372.9 1,393.9 +1.5%Sorting plants 378.1 445.6 +17.8%Composting treatment 521.8 478.3 (8.3%)Inhertisation & Chi-Fi. 1,094.3 1,182.3 +8.0%Other plants 1,599.6 1,788.4 +11.8%Total Volumes Treated 6,219.0 6,425.8 +3.3%
Data 2013 2014 Ch.%Restated
Aqueduct (mm3) 306.8 294.6 (4.0%)
Sewerage (mm3) 250.9 244.8 (2.4%)Purification (mm3) 248.5 242.7 (2.3%)
Total mgmt 806.2 782.1 (3.0%)
2013 2014Restated
Revenues 736.7 780.2Ebitda 193.5 217.4
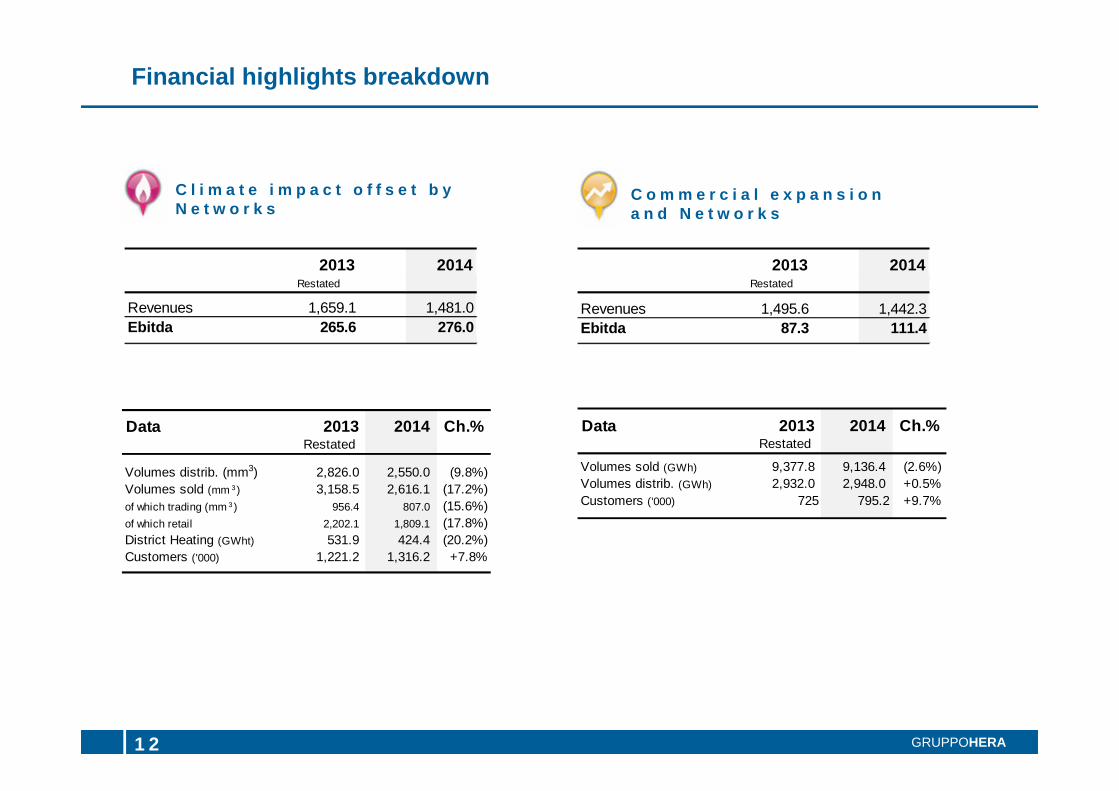
Financial highlights breakdown
1 2 GRUPPOHERA
C l i m a t e i m p a c t o f f s e t b y N e t w o r k s
C o m m e r c i a l e x p a n s i o na n d N e t w o r k s
2013 2014Restated
Revenues 1,659.1 1,481.0Ebitda 265.6 276.0
2013 2014Restated
Revenues 1,495.6 1,442.3Ebitda 87.3 111.4
Data 2013 2014 Ch.%Restated
Volumes distrib. (mm3) 2,826.0 2,550.0 (9.8%)Volumes sold (mm 3) 3,158.5 2,616.1 (17.2%)of which trading (mm 3 ) 956.4 807.0 (15.6%)of which retail 2,202.1 1,809.1 (17.8%)District Heating (GWht) 531.9 424.4 (20.2%)Customers ('000) 1,221.2 1,316.2 +7.8%
Data 2013 2014 Ch.%Restated
Volumes sold (GWh) 9,377.8 9,136.4 (2.6%)Volumes distrib. (GWh) 2,932.0 2,948.0 +0.5%Customers ('000) 725 795.2 +9.7%