unconnected analyst presentation
TRANSCRIPT
Unconnected Analyst Presentation April 2016
2
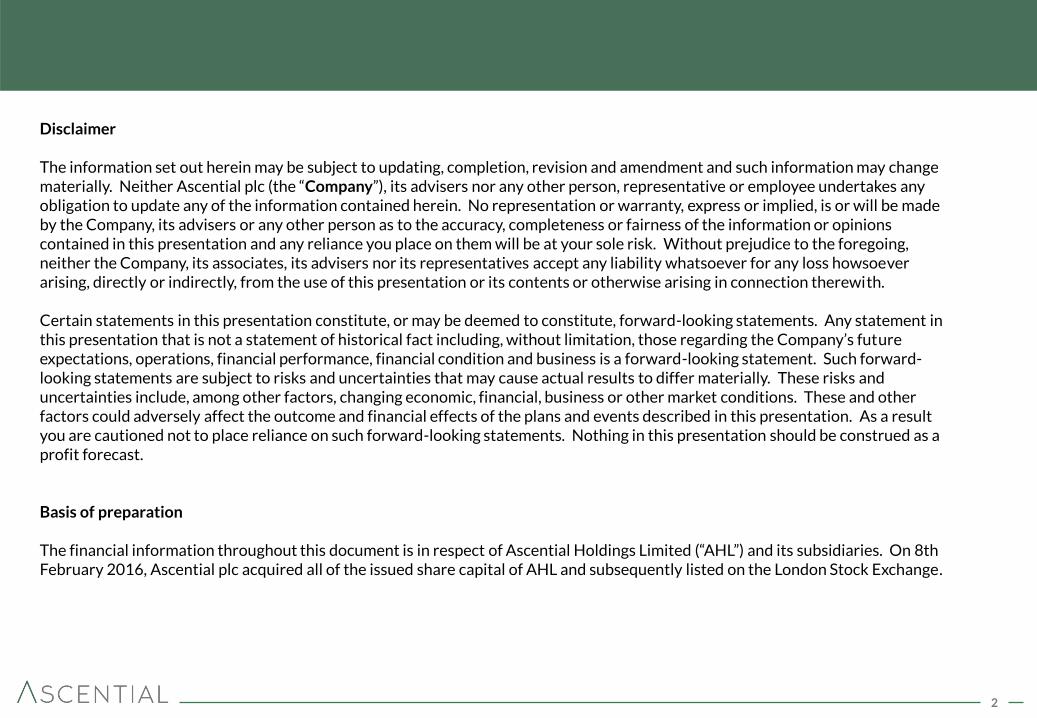
Disclaimer The information set out herein may be subject to updating, completion, revision and amendment and such information may change materially. Neither Ascential plc (the “Company”), its advisers nor any other person, representative or employee undertakes any obligation to update any of the information contained herein. No representation or warranty, express or implied, is or will be made by the Company, its advisers or any other person as to the accuracy, completeness or fairness of the information or opinions contained in this presentation and any reliance you place on them will be at your sole risk. Without prejudice to the foregoing, neither the Company, its associates, its advisers nor its representatives accept any liability whatsoever for any loss howsoever arising, directly or indirectly, from the use of this presentation or its contents or otherwise arising in connection therewith. Certain statements in this presentation constitute, or may be deemed to constitute, forward-looking statements. Any statement in this presentation that is not a statement of historical fact including, without limitation, those regarding the Company’s future expectations, operations, financial performance, financial condition and business is a forward-looking statement. Such forward-looking statements are subject to risks and uncertainties that may cause actual results to differ materially. These risks and uncertainties include, among other factors, changing economic, financial, business or other market conditions. These and other factors could adversely affect the outcome and financial effects of the plans and events described in this presentation. As a result you are cautioned not to place reliance on such forward-looking statements. Nothing in this presentation should be construed as a profit forecast. Basis of preparation The financial information throughout this document is in respect of Ascential Holdings Limited (“AHL”) and its subsidiaries. On 8th February 2016, Ascential plc acquired all of the issued share capital of AHL and subsequently listed on the London Stock Exchange.
3
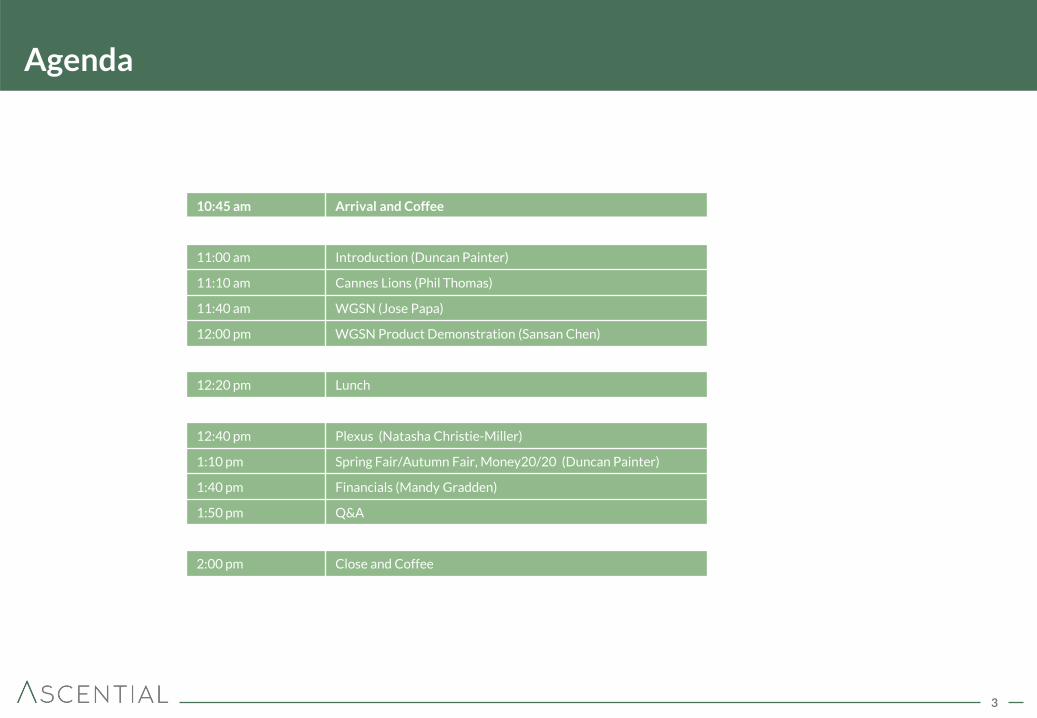
Agenda
10:45 am Arrival and Coffee
11:00 am Introduction (Duncan Painter)
11:10 am Cannes Lions (Phil Thomas)
11:40 am WGSN (Jose Papa)
12:00 pm WGSN Product Demonstration (Sansan Chen)
12:20 pm Lunch
12:40 pm Plexus (Natasha Christie-Miller)
1:10 pm Spring Fair/Autumn Fair, Money20/20 (Duncan Painter)
1:40 pm Financials (Mandy Gradden)
1:50 pm Q&A
2:00 pm Close and Coffee

4
Introduction to Ascential Duncan Painter
Insert Image
5
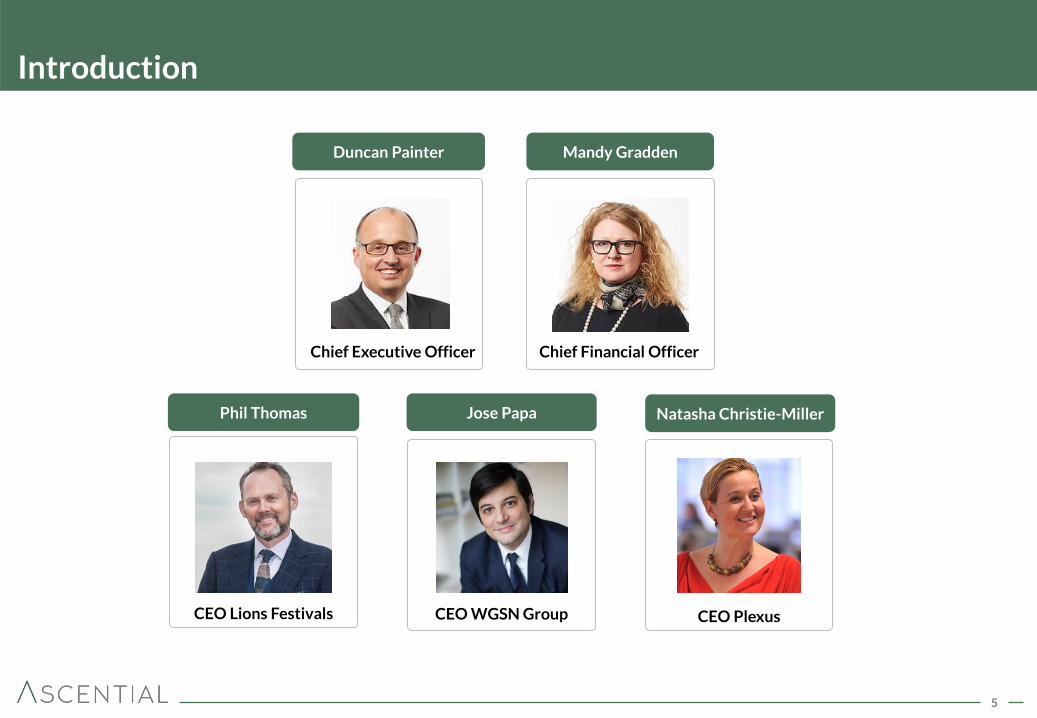
Introduction
Duncan Painter Mandy Gradden
Chief Executive Officer Chief Financial Officer
Phil Thomas Jose Papa Natasha Christie-Miller
CEO Lions Festivals CEO WGSN Group CEO Plexus
6
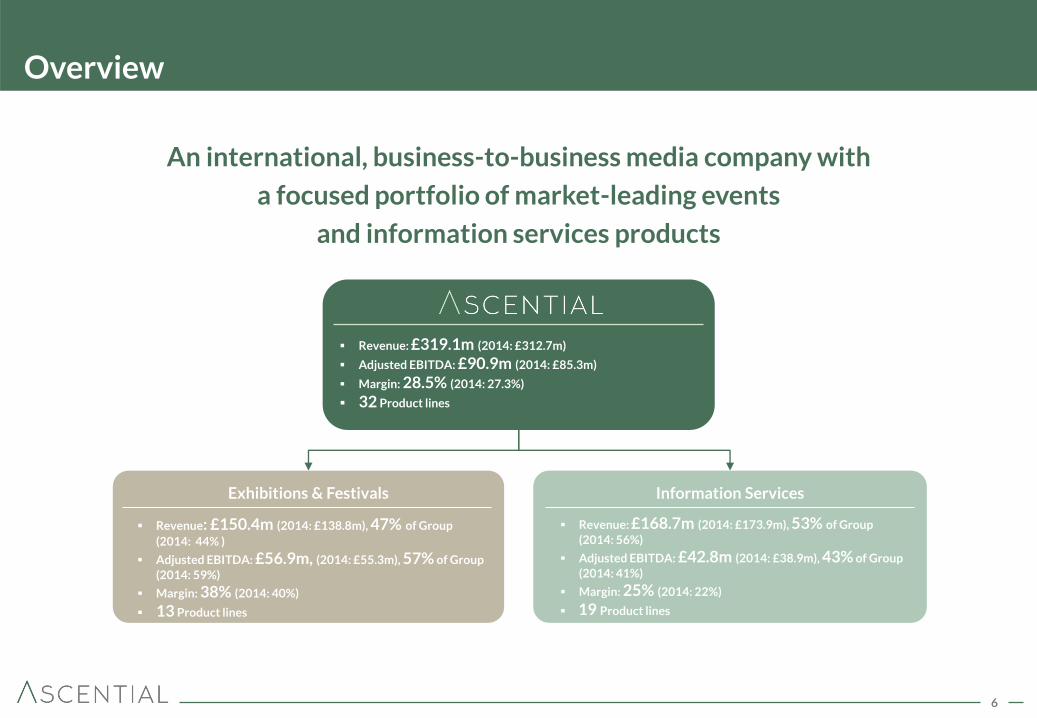
Overview
An international, business-to-business media company with
a focused portfolio of market-leading events
and information services products
Revenue: £319.1m (2014: £312.7m)
Adjusted EBITDA: £90.9m (2014: £85.3m)
Margin: 28.5% (2014: 27.3%)
32 Product lines
Exhibitions & Festivals
Revenue: £150.4m (2014: £138.8m), 47% of Group
(2014: 44% )
Adjusted EBITDA: £56.9m, (2014: £55.3m), 57% of Group
(2014: 59%)
Margin: 38% (2014: 40%)
13 Product lines
Information Services
Revenue: £168.7m (2014: £173.9m), 53% of Group
(2014: 56%)
Adjusted EBITDA: £42.8m (2014: £38.9m), 43% of Group
(2014: 41%)
Margin: 25% (2014: 22%)
19 Product lines
7
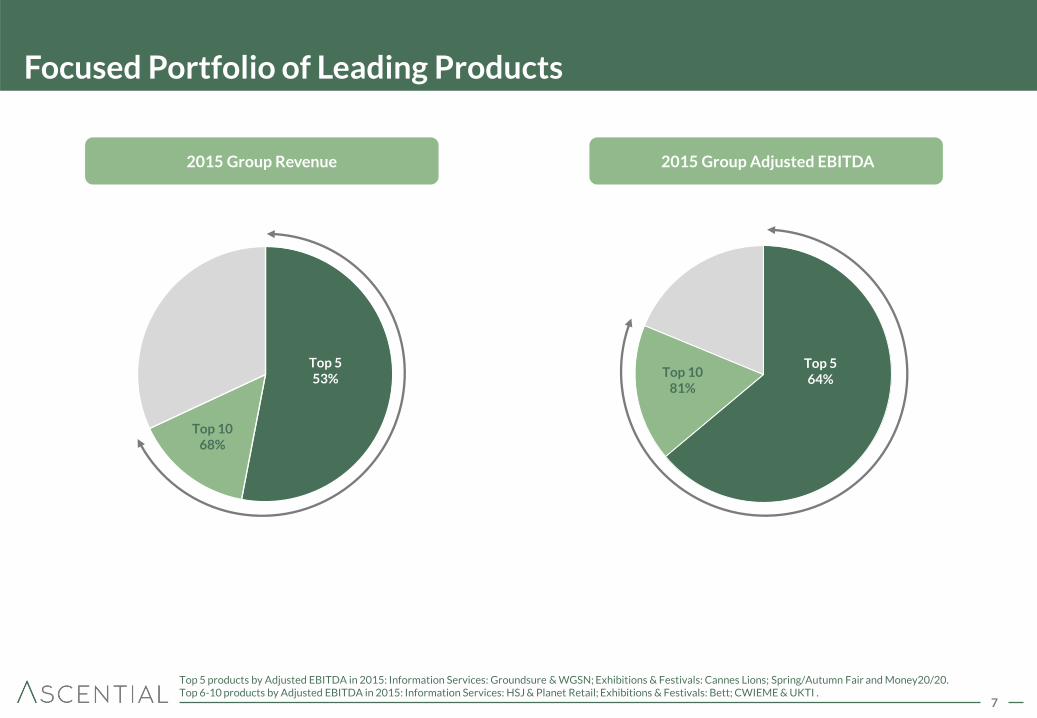
Focused Portfolio of Leading Products
Top 5 58%
Top 5 49%
Top 10 68%
Top 10 81%
2015 Group Revenue 2015 Group Adjusted EBITDA
Top 5 53%
Top 5 64%
Top 5 products by Adjusted EBITDA in 2015: Information Services: Groundsure & WGSN; Exhibitions & Festivals: Cannes Lions; Spring/Autumn Fair and Money20/20. Top 6-10 products by Adjusted EBITDA in 2015: Information Services: HSJ & Planet Retail; Exhibitions & Festivals: Bett; CWIEME & UKTI .
8
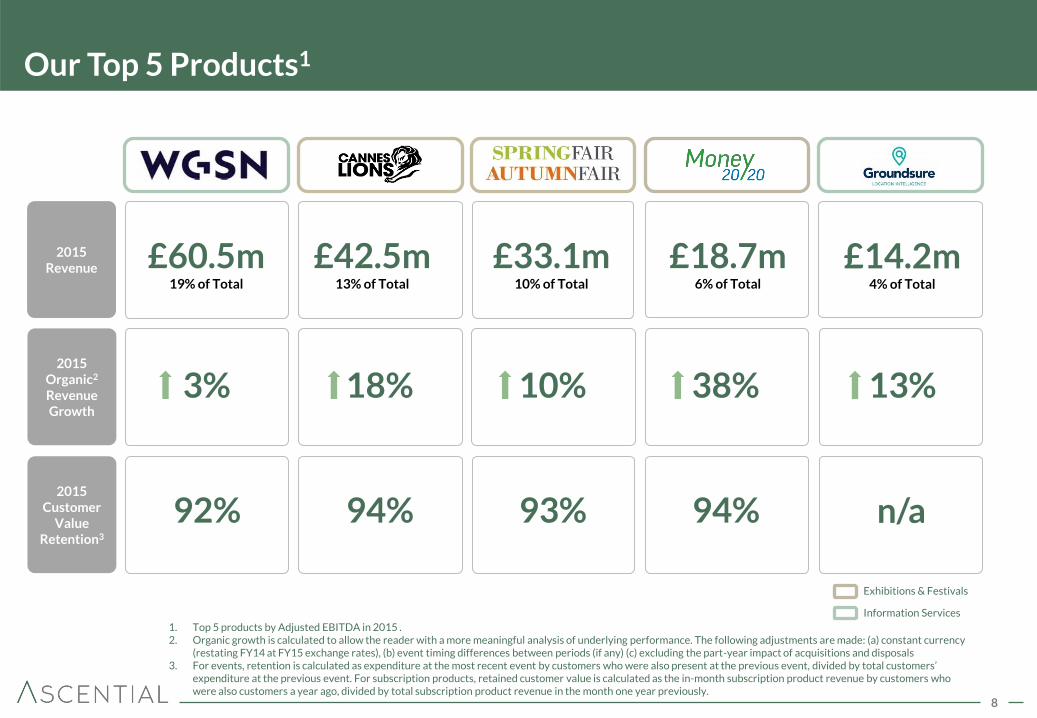
Our Top 5 Products1
3% 38%
2015 Revenue
18% 10%
Information Services
Exhibitions & Festivals
1. Top 5 products by Adjusted EBITDA in 2015 . 2. Organic growth is calculated to allow the reader with a more meaningful analysis of underlying performance. The following adjustments are made: (a) constant currency
(restating FY14 at FY15 exchange rates), (b) event timing differences between periods (if any) (c) excluding the part-year impact of acquisitions and disposals 3. For events, retention is calculated as expenditure at the most recent event by customers who were also present at the previous event, divided by total customers’
expenditure at the previous event. For subscription products, retained customer value is calculated as the in-month subscription product revenue by customers who were also customers a year ago, divided by total subscription product revenue in the month one year previously.
£60.5m 19% of Total
£18.7m 6% of Total
£42.5m 13% of Total
£33.1m 10% of Total
92% 94% 2015
Customer Value
Retention3
94% 93%
2015 Organic2 Revenue Growth
£14.2m 4% of Total
13%
n/a
9
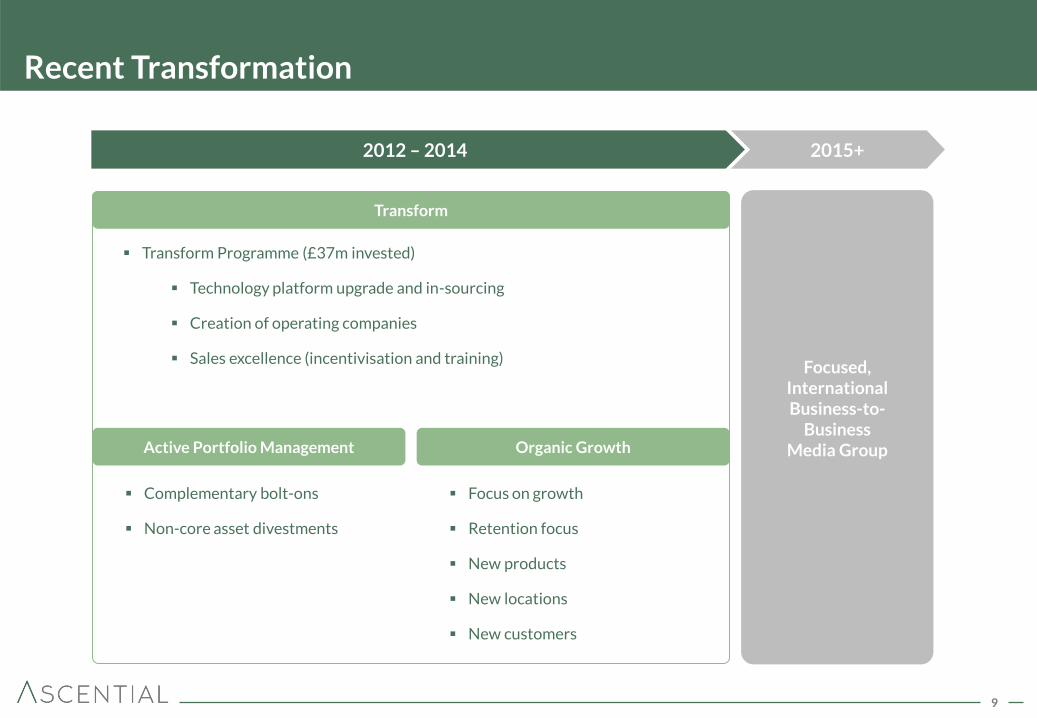
Recent Transformation
Transform Programme (£37m invested)
Technology platform upgrade and in-sourcing
Creation of operating companies
Sales excellence (incentivisation and training)
2012 – 2014
Focused, International Business-to-
Business Media Group
2015+
Transform
Active Portfolio Management Organic Growth
Complementary bolt-ons
Non-core asset divestments
Focus on growth
Retention focus
New products
New locations
New customers

10
Relentless and Disciplined Operational Approach
Disciplined Portfolio Management
6 acquisitions made during 2012-15 at average multiple of 7.8x EV/EBITDA
4 non-core disposals realised at 12.4x average EV/EBITDA
Rigorous Capital Allocation
Focus on market-leading products with potential for growth and scalability
Assets with lower growth potential run for cash with funds re-invested in high-growth products
Strong Selling Culture
Daily sales optimisation
Weekly/monthly performance reviews
Sales League Tables and “Elite” sales incentive programme
Retention-centred
Rebook/pre-book
Churn propensity model
Rigorous review of churned customers
2
4
1
3
11
Cannes Lions Phil Thomas
The No.1 global festival for
the branded communication
industry
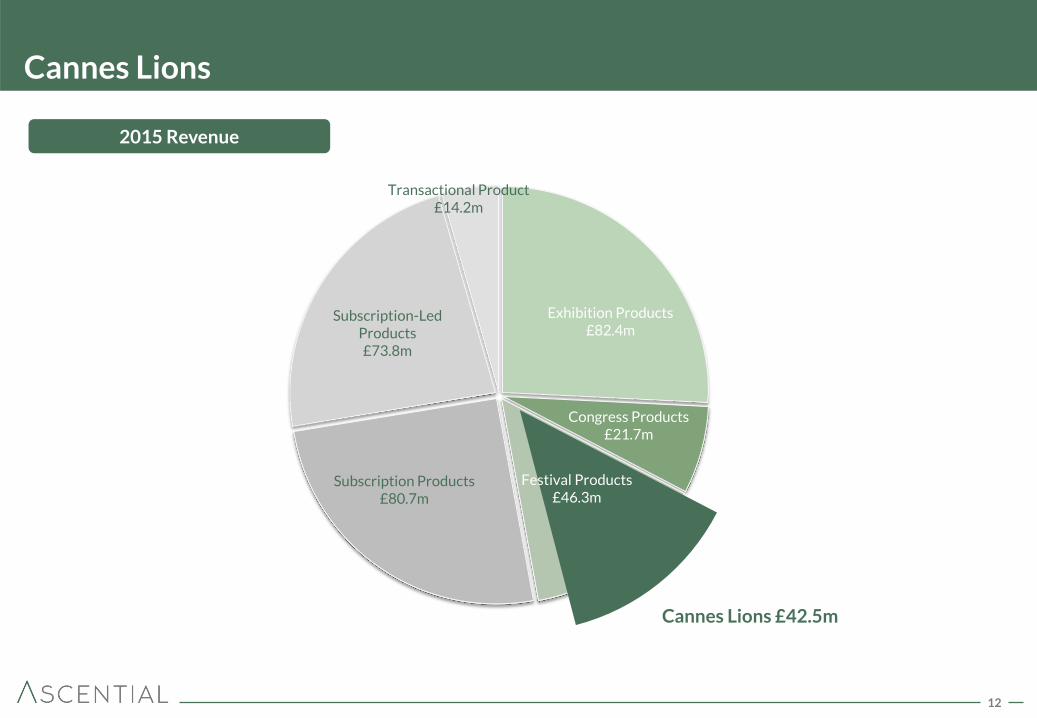
12
Exhibition Products £82.4m
Congress Products £21.7m
Subscription Products £80.7m
Subscription-Led Products £73.8m
Transactional Product £14.2m
Cannes Lions
Cannes Lions £42.5m
2015 Revenue
Festival Products £46.3m
13
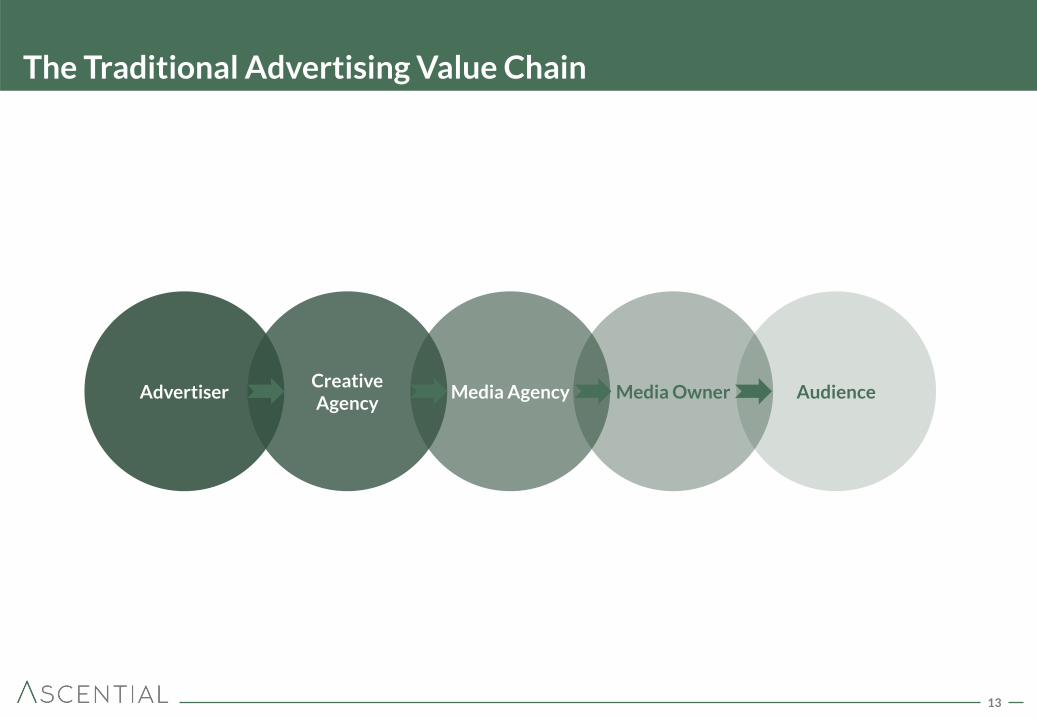
The Traditional Advertising Value Chain
Advertiser Creative Agency
Media Agency Media Owner Audience
14
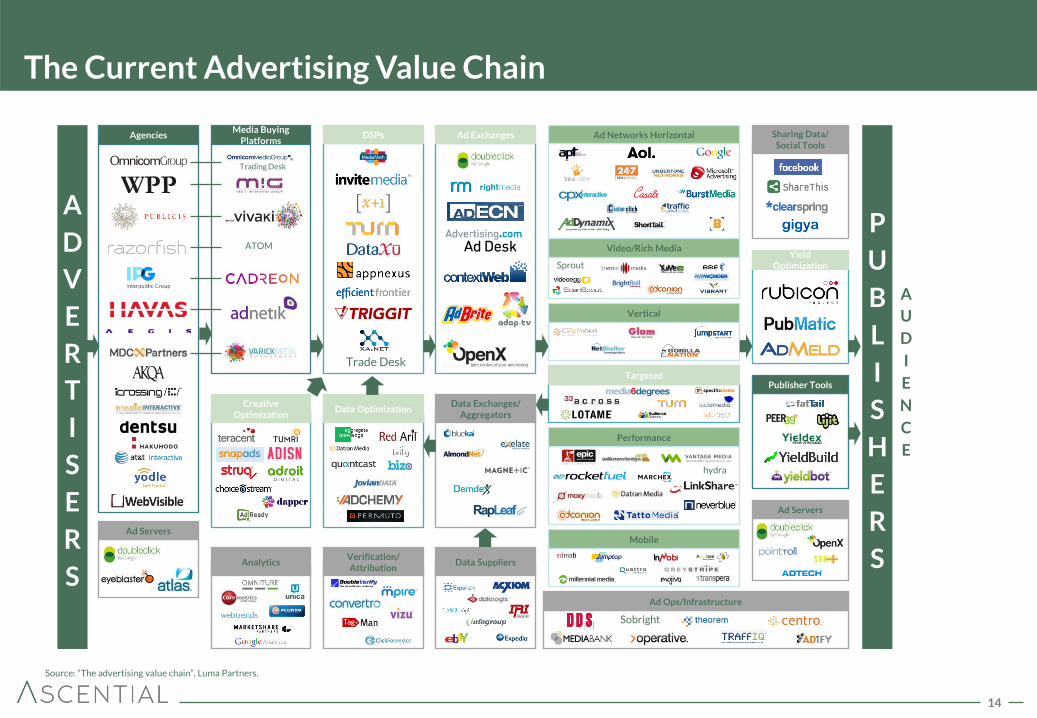
The Current Advertising Value Chain
A
D
V
E
R
T
I
S
E
R
S
P
U
B
L
I
S
H
E
R
S
A
U
D
I
E
N
C
E
Agencies
Ad Servers
Media Buying Platforms
Creative Optimization
Analytics
DSPs
Data Optimization
Verification/ Attribution
Ad Exchanges
Data Exchanges/ Aggregators
Data Suppliers
Ad Ops/Infrastructure
Ad Networks Horizontal
Vertical
Targeted
Performance
Mobile
Sharing Data/ Social Tools
Yield Optimization
Ad Servers
Publisher Tools
Trading Desk
ATOM
Trade Desk
Sobright
hydra
Sprout
Video/Rich Media
Source: “The advertising value chain”, Luma Partners.
15
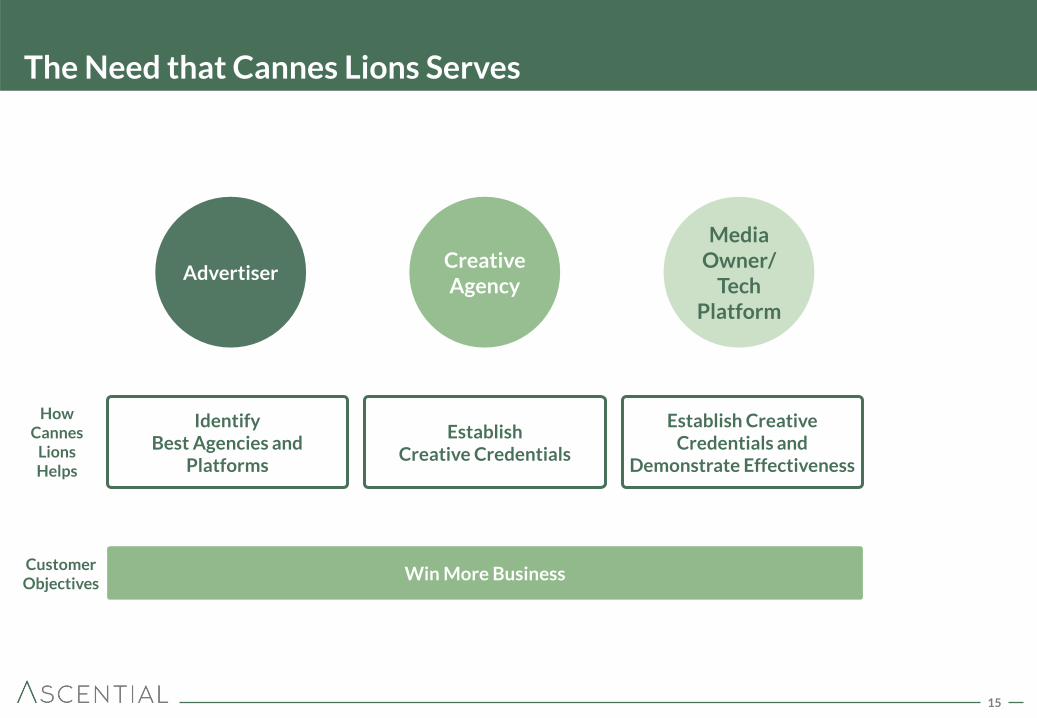
The Need that Cannes Lions Serves
Win More Business Customer Objectives
Media Owner/
Tech Platform
Creative Agency
Advertiser
Identify Best Agencies and
Platforms
How Cannes
Lions Helps
Win More Business
Establish Creative Credentials
Establish Creative Credentials and
Demonstrate Effectiveness
16
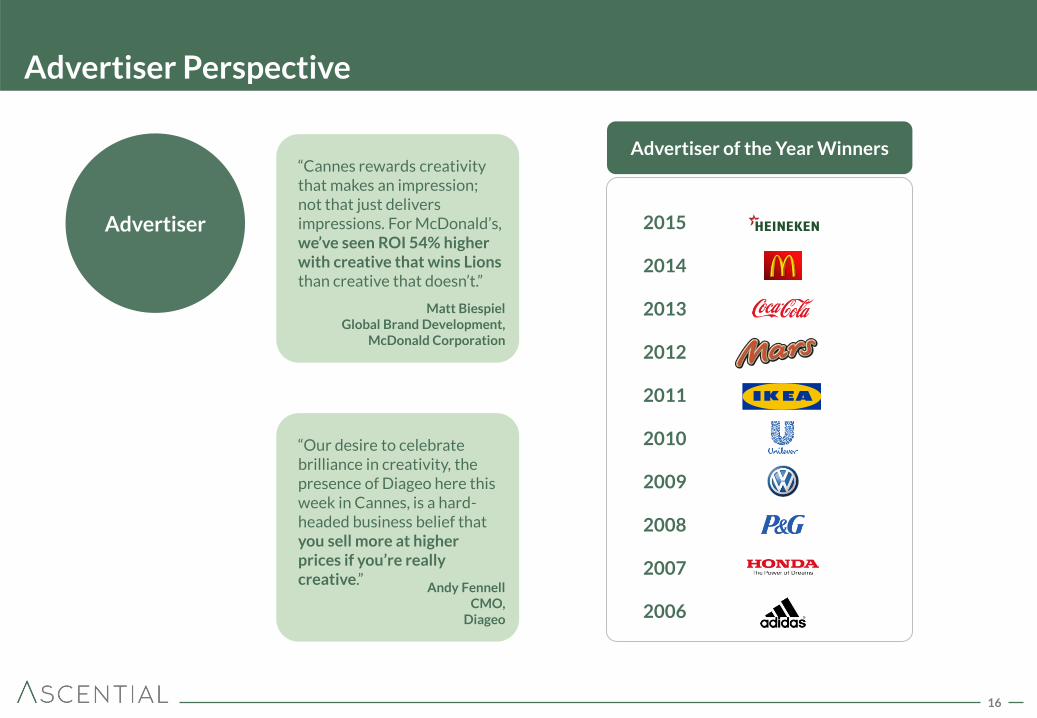
Advertiser Perspective
Advertiser
“Cannes rewards creativity that makes an impression; not that just delivers impressions. For McDonald’s, we’ve seen ROI 54% higher with creative that wins Lions than creative that doesn’t.”
Matt Biespiel Global Brand Development,
McDonald Corporation
“Our desire to celebrate brilliance in creativity, the presence of Diageo here this week in Cannes, is a hard-headed business belief that you sell more at higher prices if you’re really creative.”
Andy Fennell CMO,
Diageo
Advertiser of the Year Winners
2015
2014
2013
2012
2011
2010
2009
2008
2007
2006
17
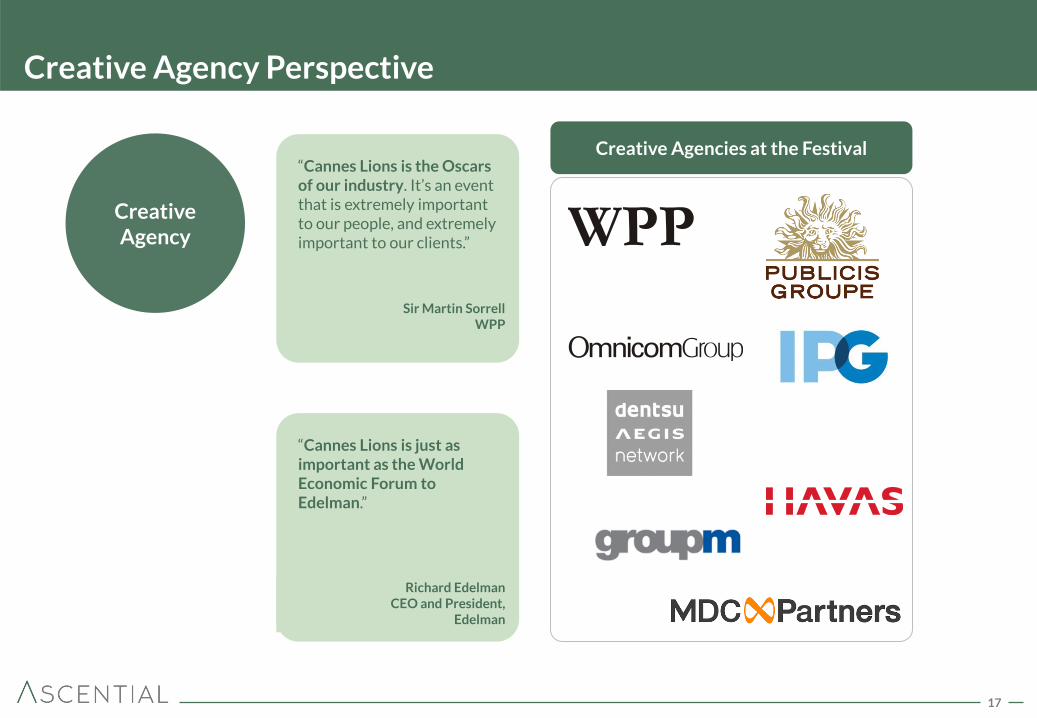
Creative Agency Perspective
Creative Agency
“Cannes Lions is the Oscars of our industry. It’s an event that is extremely important to our people, and extremely important to our clients.”
Sir Martin Sorrell WPP
“Cannes Lions is just as important as the World Economic Forum to Edelman.”
Richard Edelman CEO and President,
Edelman
Creative Agencies at the Festival
18
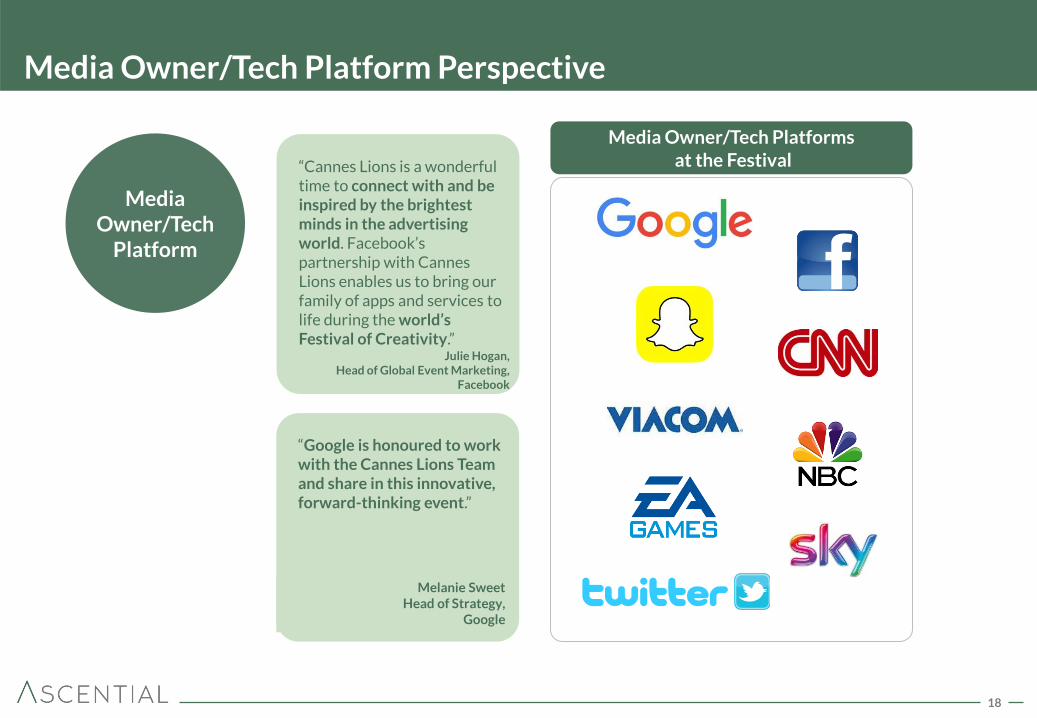
Media Owner/Tech Platform Perspective
“Cannes Lions is a wonderful time to connect with and be inspired by the brightest minds in the advertising world. Facebook’s partnership with Cannes Lions enables us to bring our family of apps and services to life during the world’s Festival of Creativity.” Julie Hogan,
Head of Global Event Marketing, Facebook
Media Owner/Tech
Platform
Media Owner/Tech Platforms at the Festival
“Google is honoured to work with the Cannes Lions Team and share in this innovative, forward-thinking event.”
Melanie Sweet Head of Strategy,

19
Lions Festivals Introduction Video
20
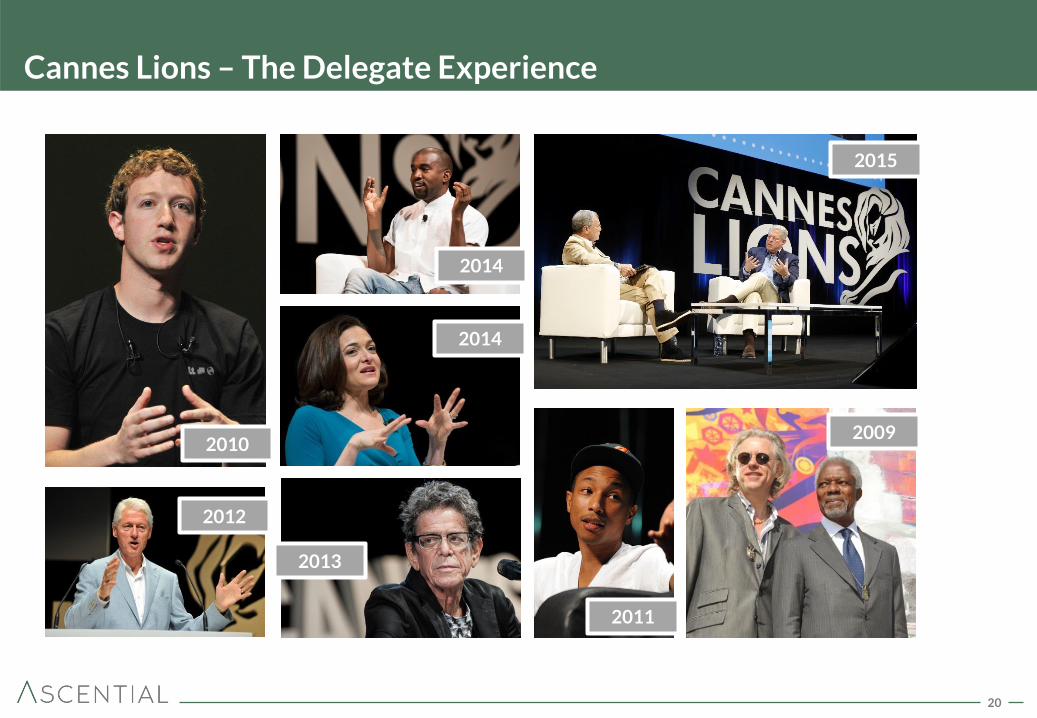
Cannes Lions – The Delegate Experience
2010
2014
2014
2013
2011
2009
2015
2012
21
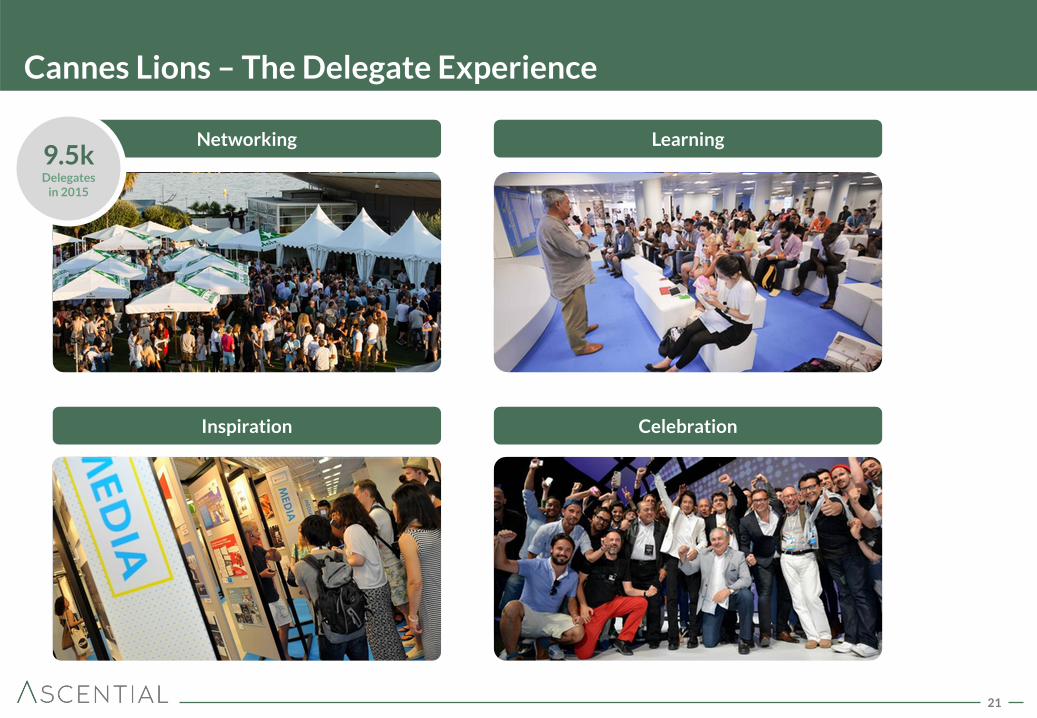
Cannes Lions – The Delegate Experience
Networking Learning
Inspiration Celebration
9.5k Delegates
in 2015
22
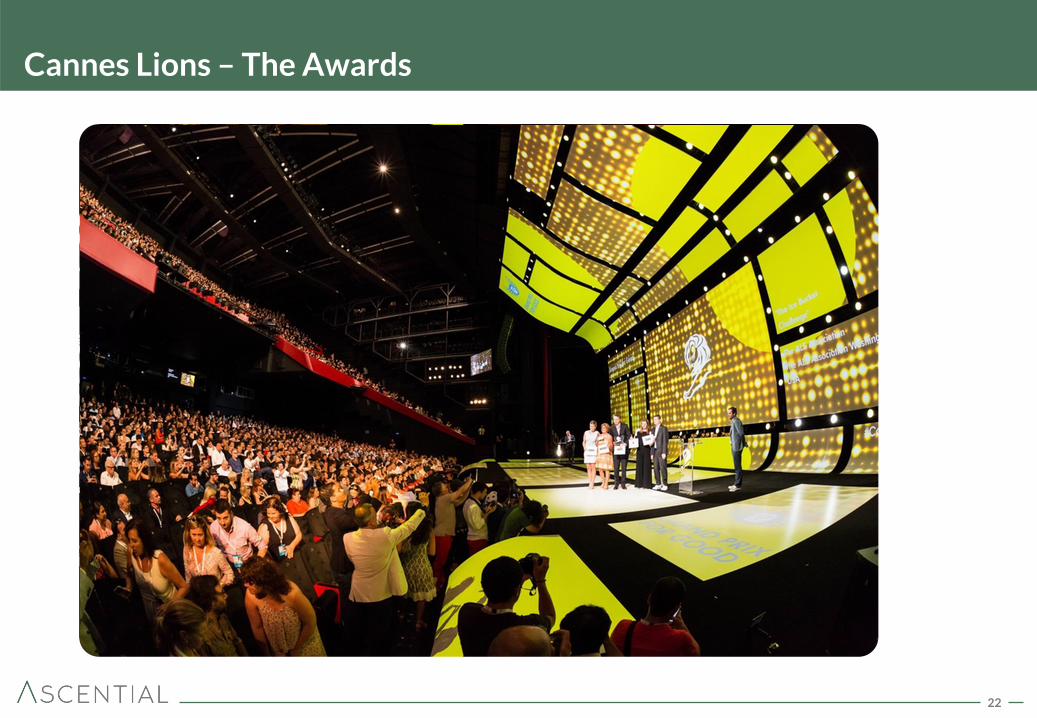
Cannes Lions – The Awards
23
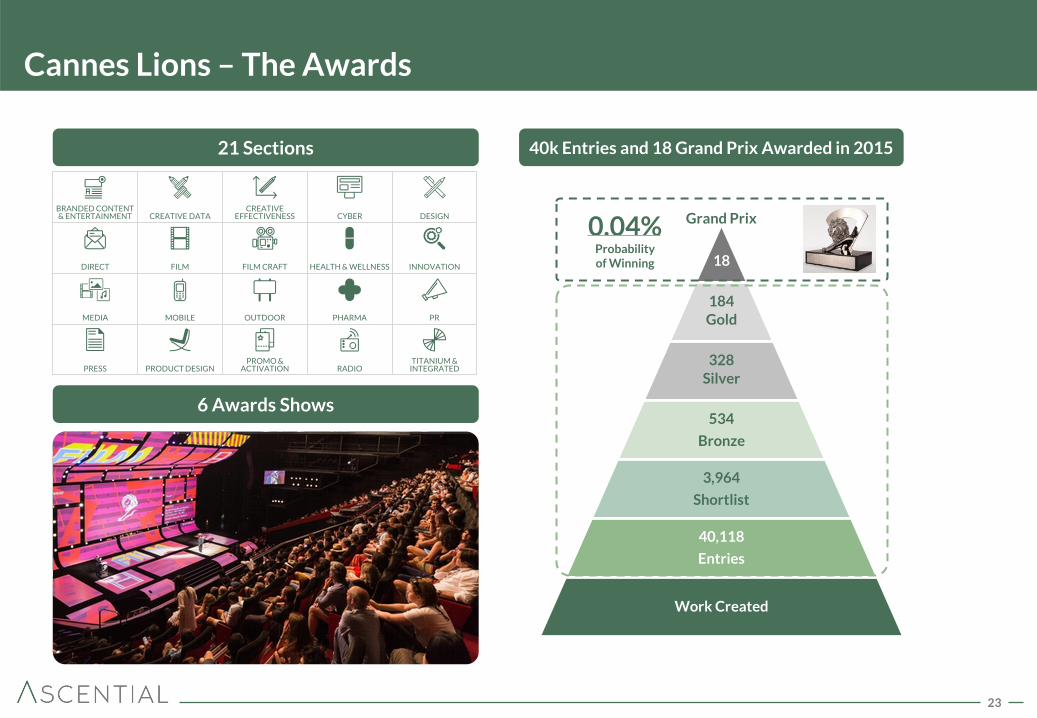
Cannes Lions – The Awards
6 Awards Shows
40k Entries and 18 Grand Prix Awarded in 2015
18
184 Gold
328
Silver
534
Bronze
3,964
Shortlist
40,118
Entries
Work Created
Grand Prix
21 Sections
BRANDED CONTENT & ENTERTAINMENT CREATIVE DATA
CREATIVE EFFECTIVENESS CYBER DESIGN
DIRECT FILM FILM CRAFT HEALTH & WELLNESS INNOVATION
MEDIA MOBILE OUTDOOR PHARMA PR
PRESS PRODUCT DESIGN PROMO &
ACTIVATION RADIO TITANIUM &
INTEGRATED
0.04% Probability of Winning
24
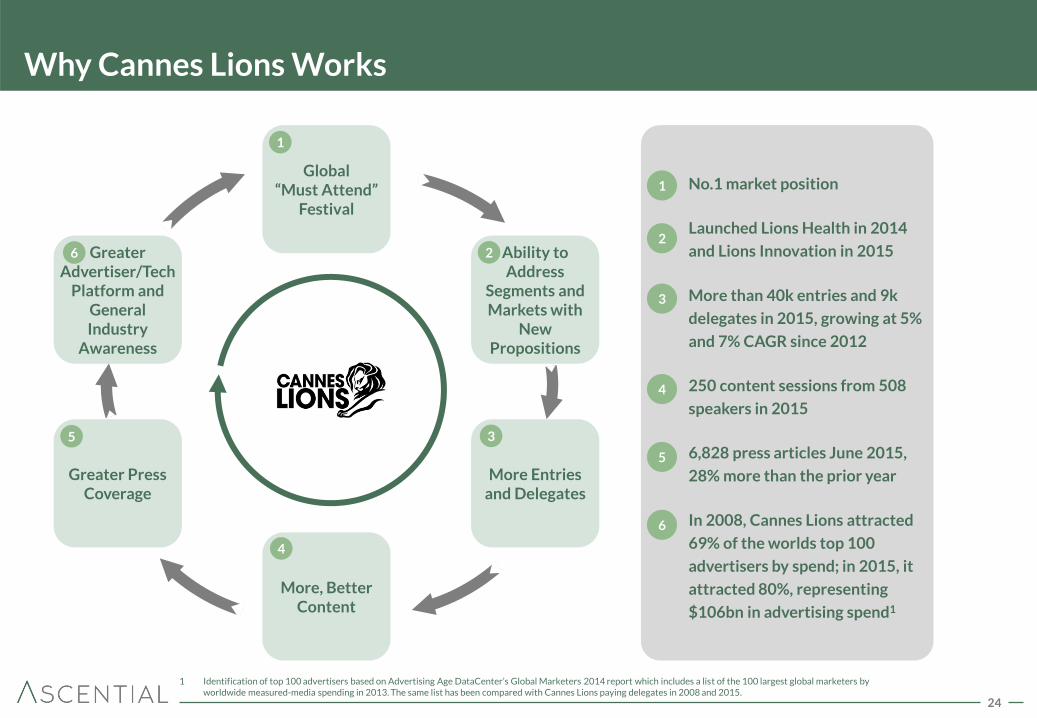
Why Cannes Lions Works
Global “Must Attend”
Festival
Greater Advertiser/Tech
Platform and General Industry
Awareness
Ability to Address
Segments and Markets with
New Propositions
More, Better Content
Greater Press Coverage
More Entries and Delegates
No.1 market position
Launched Lions Health in 2014
and Lions Innovation in 2015
More than 40k entries and 9k
delegates in 2015, growing at 5%
and 7% CAGR since 2012
250 content sessions from 508
speakers in 2015
6,828 press articles June 2015,
28% more than the prior year
In 2008, Cannes Lions attracted
69% of the worlds top 100
advertisers by spend; in 2015, it
attracted 80%, representing
$106bn in advertising spend1
1
2
3
4
5
6
1
2
3
4
5
6
1 Identification of top 100 advertisers based on Advertising Age DataCenter’s Global Marketers 2014 report which includes a list of the 100 largest global marketers by worldwide measured-media spending in 2013. The same list has been compared with Cannes Lions paying delegates in 2008 and 2015.
25
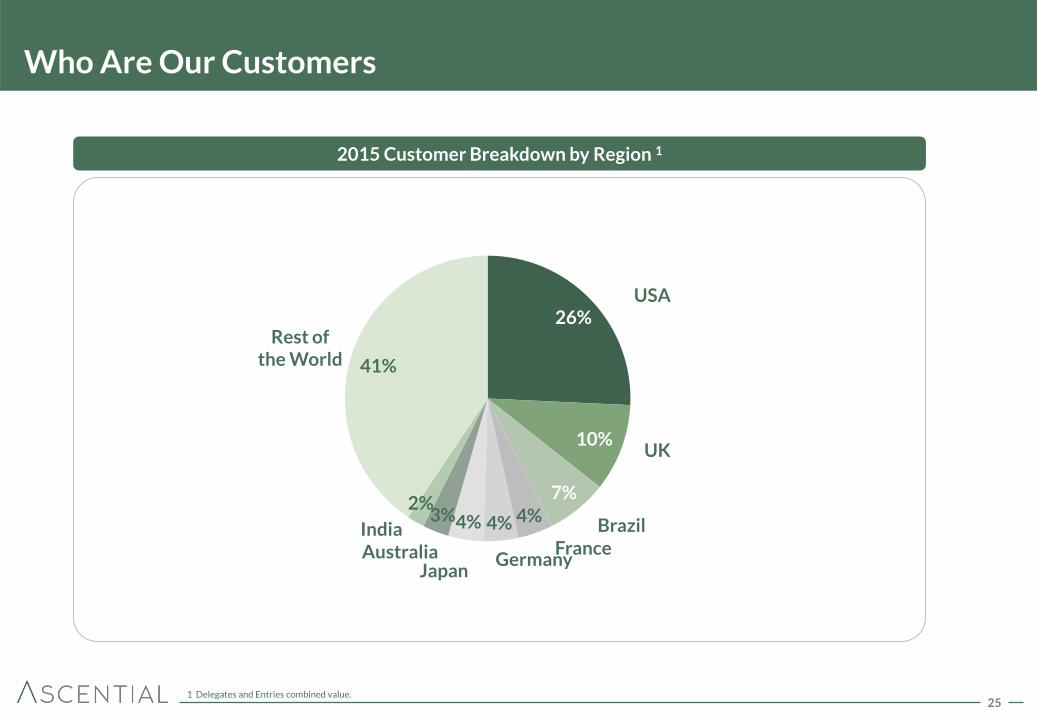
Who Are Our Customers
26%
10%
7% 4% 4% 4% 3%
2%
41%
2015 Customer Breakdown by Region 1
Rest of the World
USA
Brazil
UK
France Germany
Japan Australia India
1 Delegates and Entries combined value.
26
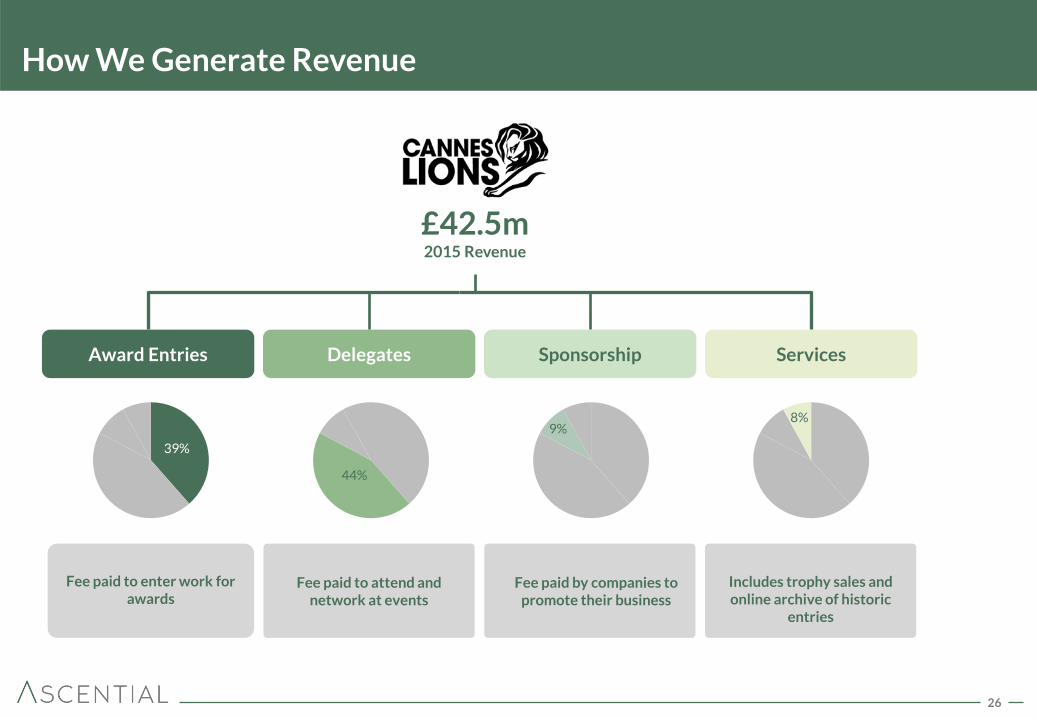
How We Generate Revenue
(1)
Fee paid to attend and network at events
Fee paid to enter work for
awards
Award Entries Delegates Sponsorship Services
Fee paid by companies to promote their business
Includes trophy sales and online archive of historic
entries
£42.5m 2015 Revenue
44%
9% 8%
39%
27
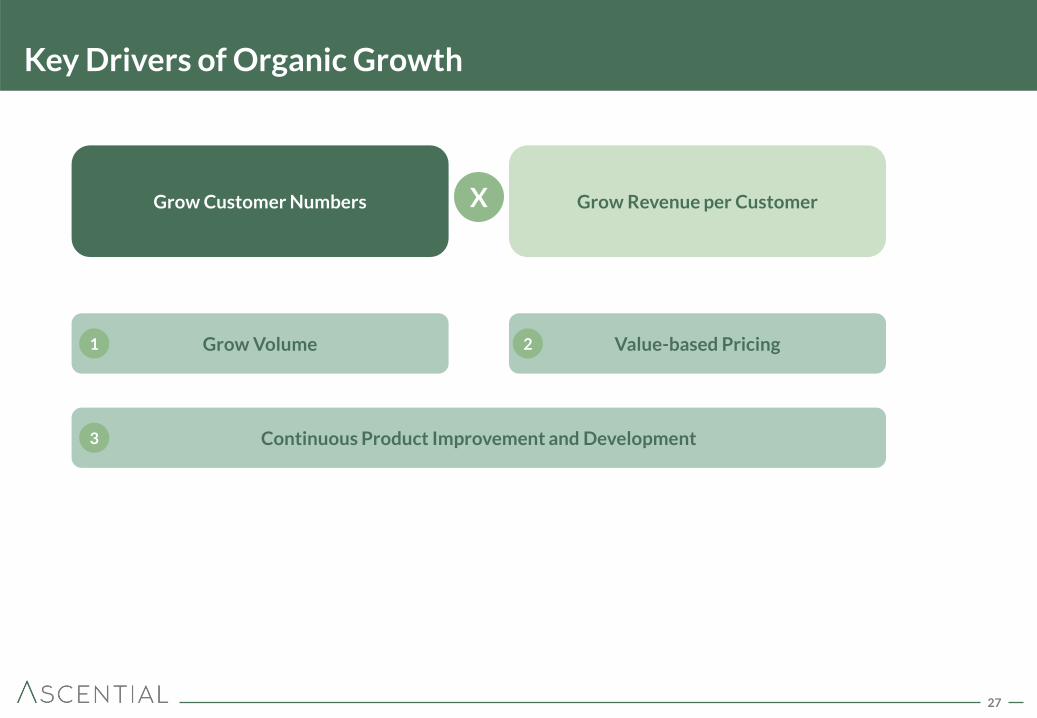
Key Drivers of Organic Growth
Grow Revenue per Customer Grow Customer Numbers X
Value-based Pricing 2
Continuous Product Improvement and Development 3
Grow Volume 1

28
Grow Volume 1
Number of Cannes Lions Delegates Number of Cannes Lions Entries
7%
CAGR
5%
CAGR
34,301
40,118
2012 2015
7,880
9,531
2012 2015
29
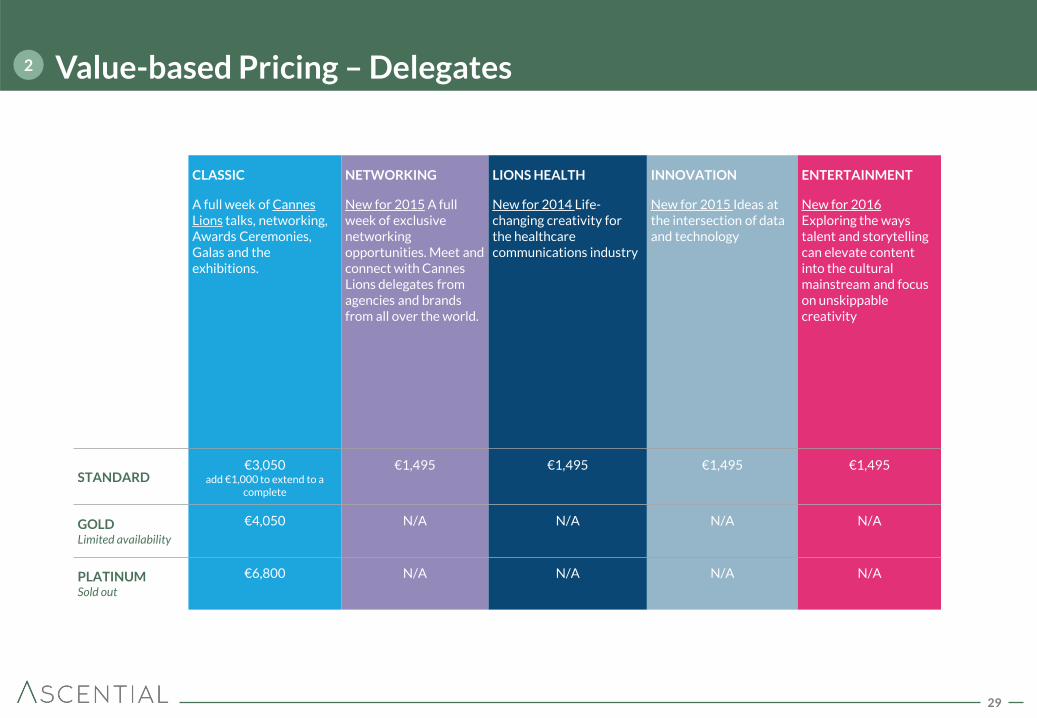
Value-based Pricing – Delegates 2
CLASSIC
A full week of Cannes Lions talks, networking, Awards Ceremonies, Galas and the exhibitions.
NETWORKING
New for 2015 A full week of exclusive networking opportunities. Meet and connect with Cannes Lions delegates from agencies and brands from all over the world.
LIONS HEALTH
New for 2014 Life-changing creativity for the healthcare communications industry
INNOVATION
New for 2015 Ideas at the intersection of data and technology
ENTERTAINMENT
New for 2016 Exploring the ways talent and storytelling can elevate content into the cultural mainstream and focus on unskippable creativity
STANDARD €3,050
add €1,000 to extend to a complete
€1,495
€1,495 €1,495 €1,495
GOLD Limited availability
€4,050 N/A N/A N/A N/A
PLATINUM Sold out
€6,800 N/A N/A N/A N/A
30
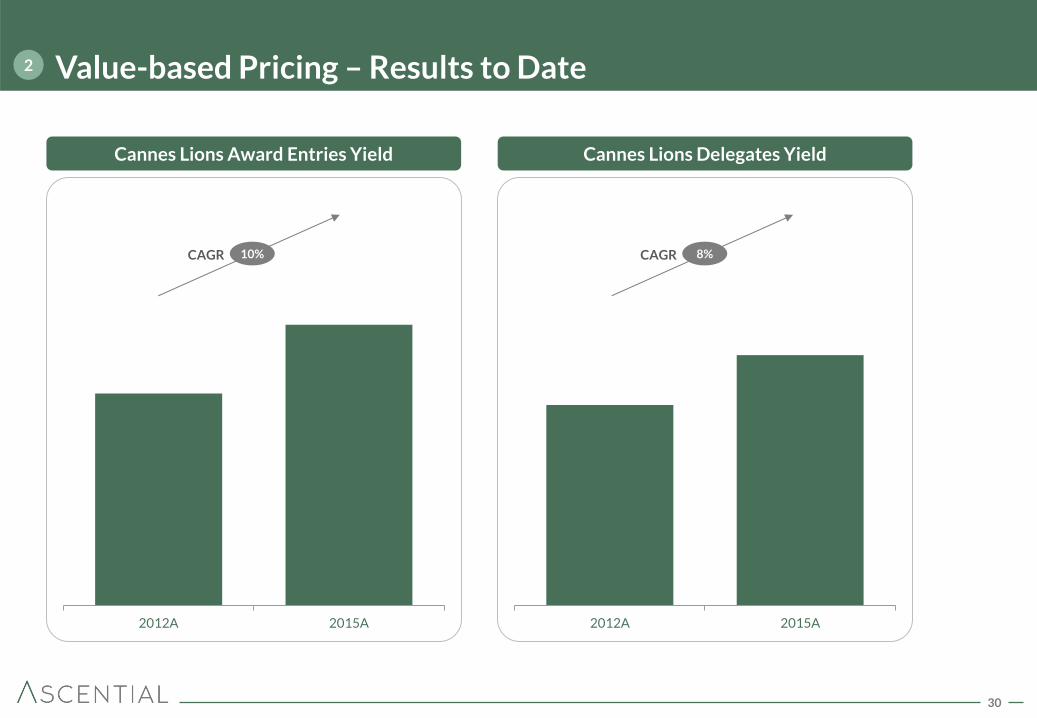
Value-based Pricing – Results to Date 2
Cannes Lions Delegates Yield
2012A 2015A
Cannes Lions Award Entries Yield
2012A 2015A
10% CAGR 8% CAGR
31
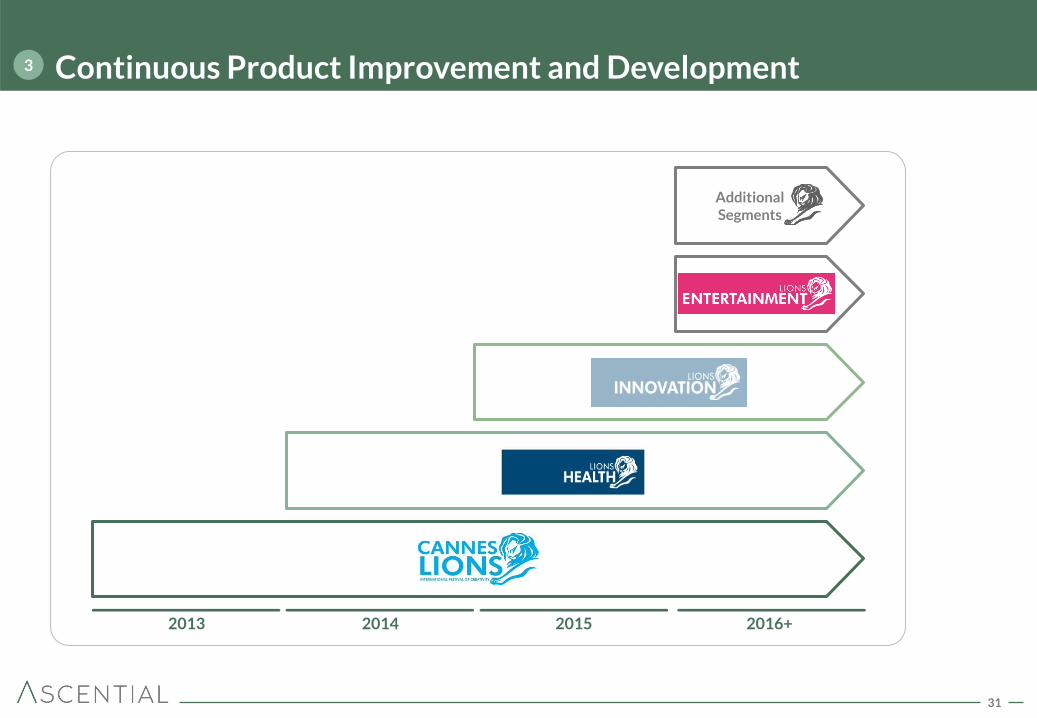
Continuous Product Improvement and Development 3
Additional Segments
2014 2015 2016+ 2013

32
Case Study: Lions Health 3
Year 2 KPIs (2015)
420 Delegates
1,862 Entries
€1.8m Revenue
33
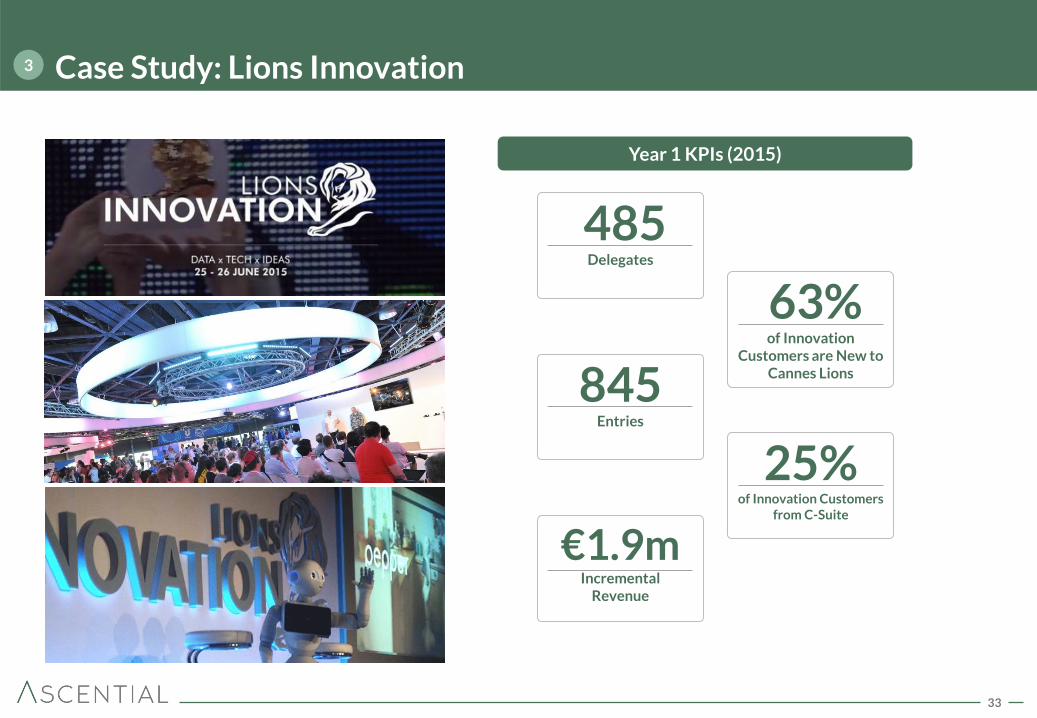
Case Study: Lions Innovation 3
Year 1 KPIs (2015)
485 Delegates
845 Entries
€1.9m Incremental
Revenue
63% of Innovation
Customers are New to Cannes Lions
25% of Innovation Customers
from C-Suite
34
Summary
No.1 Market Position
Advantaged Business Model
Strong Growth Prospects
1 2 3
35
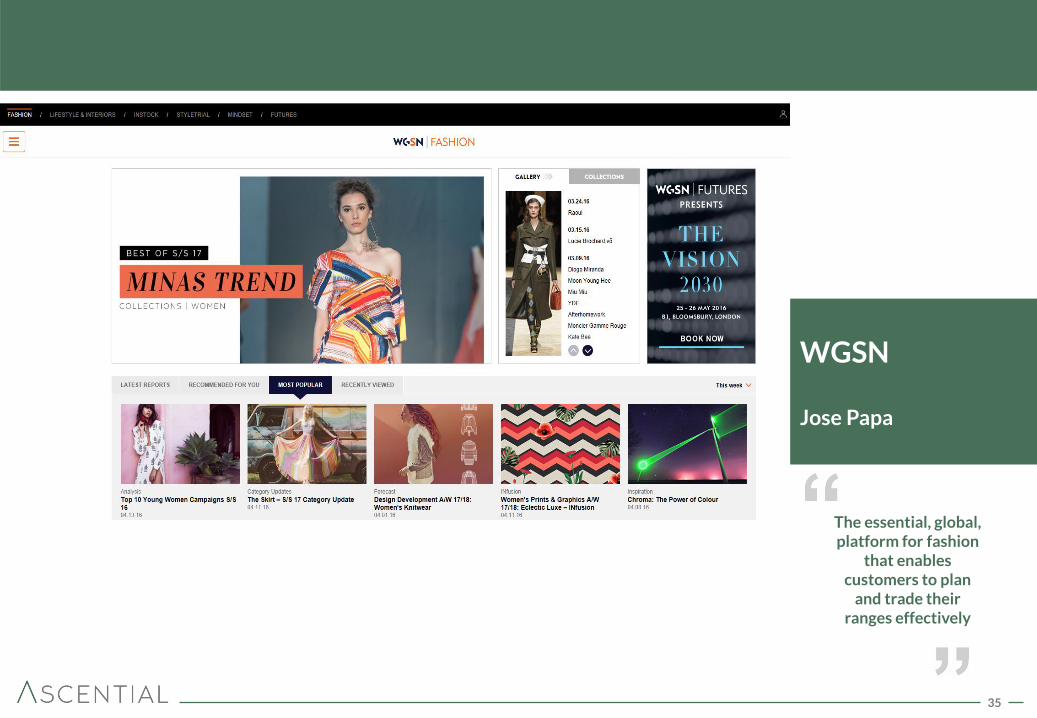
WGSN Jose Papa
The essential, global, platform for fashion
that enables customers to plan
and trade their ranges effectively
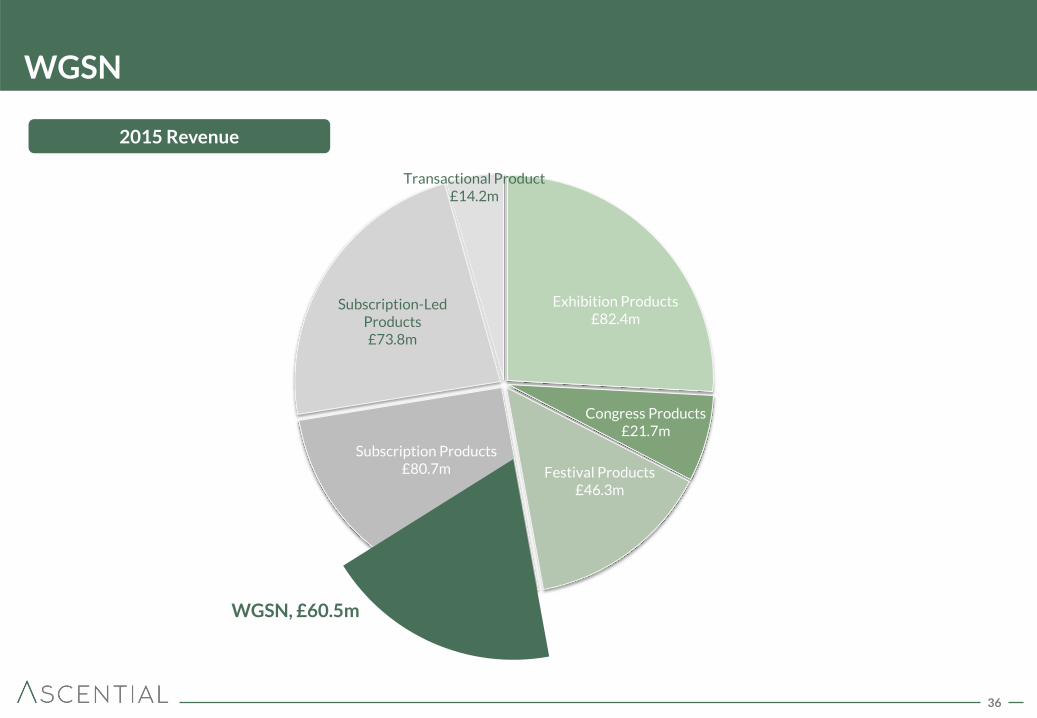
36
Exhibition Products £82.4m
Congress Products £21.7m
Festival Products £46.3m
Subscription-Led Products £73.8m
Transactional Product £14.2m
2015 Revenue
WGSN
WGSN, £60.5m
Subscription Products £80.7m
37
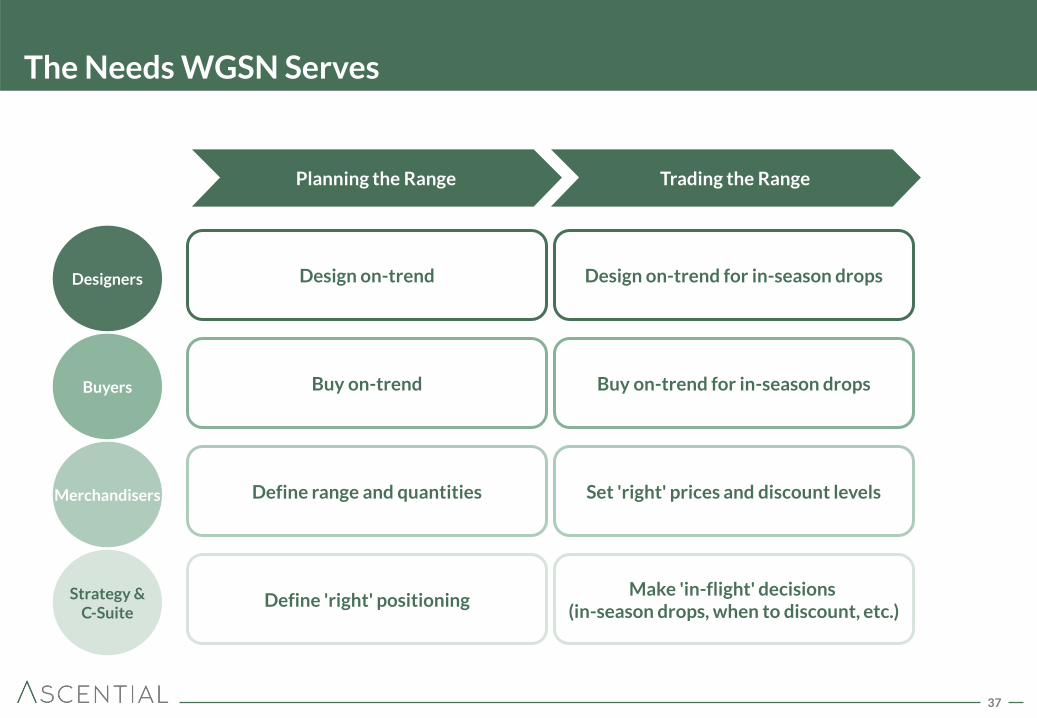
The Needs WGSN Serves
Merchandisers
Buyers
Designers
Strategy & C-Suite
Planning the Range Trading the Range
Define range and quantities
Buy on-trend
Design on-trend
Define 'right' positioning
Set 'right' prices and discount levels
Buy on-trend for in-season drops
Design on-trend for in-season drops
Make 'in-flight' decisions (in-season drops, when to discount, etc.)
38
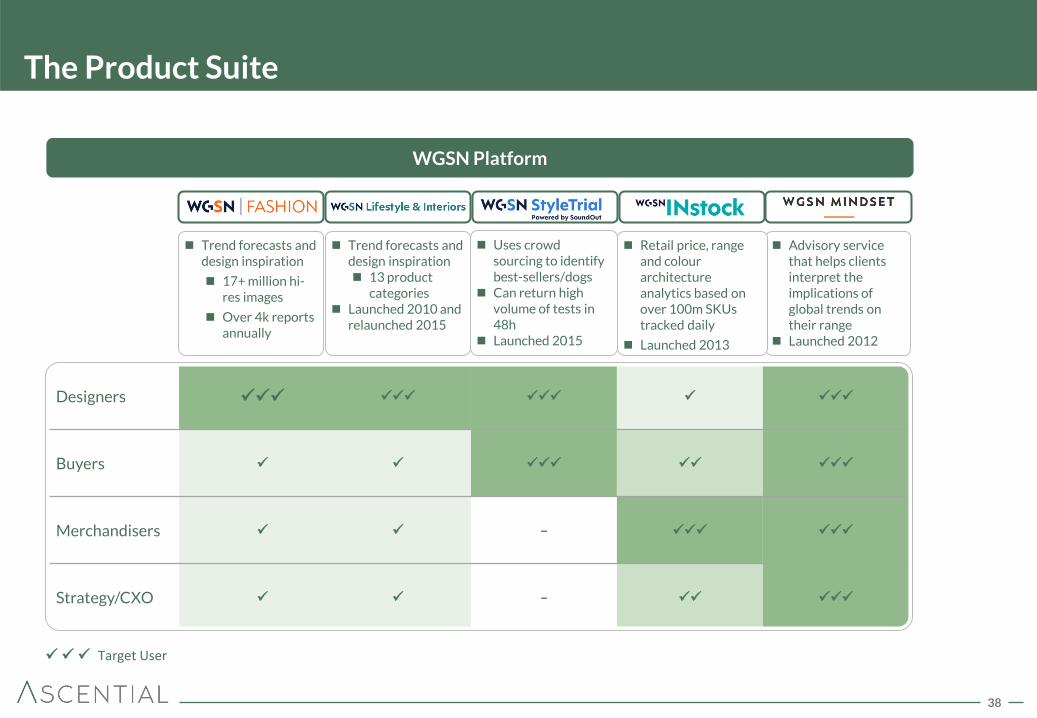
The Product Suite
Designers
Buyers
Merchandisers –
Strategy/CXO –
Target User
WGSN Platform
Trend forecasts and design inspiration
17+ million hi-res images
Over 4k reports annually
Advisory service that helps clients interpret the implications of global trends on their range
Launched 2012
Uses crowd sourcing to identify best-sellers/dogs
Can return high volume of tests in 48h
Launched 2015
Trend forecasts and design inspiration 13 product
categories Launched 2010 and
relaunched 2015
Retail price, range and colour architecture analytics based on over 100m SKUs tracked daily
Launched 2013
Mindset

39
WGSN in Action – The Kimono
WGSN Street Shots Identified at Festivals and Women’s Youth Top 5 Tops
Feb 2013 Aug 2014
Retail News
New Look sells 40k Kimonos a Week to Boost Sales 9%
WGSN Key Item Catwalks S/S 14 Identified as a Key Inspiration on the Catwalk
WGSN Retail Analysis S/S 14 ‘Kimono Blouse’ Identified as one of S/S 14 Most Popular Store Deliveries
WGSN Key Items S/S 14 Highlighted as a Key Item for S/S 14
Oct 2013
Date: 11 March 2014
Report: Retail Analysis- S/S 14 spring deliveries What we said: The Kimono blouse proves to be one of the season’s most commercial
topweight.
Date: 14 Oct 2013
Report: Key items catwalks S/S 14 What we said: Kimono styles make a statement as Eastern influences continue to
appear on the runway
Mar 2014 Apr 2013
Trend Identified Trend Confirmed Aggressive Stocking Strong Sales Buyers Briefed
40
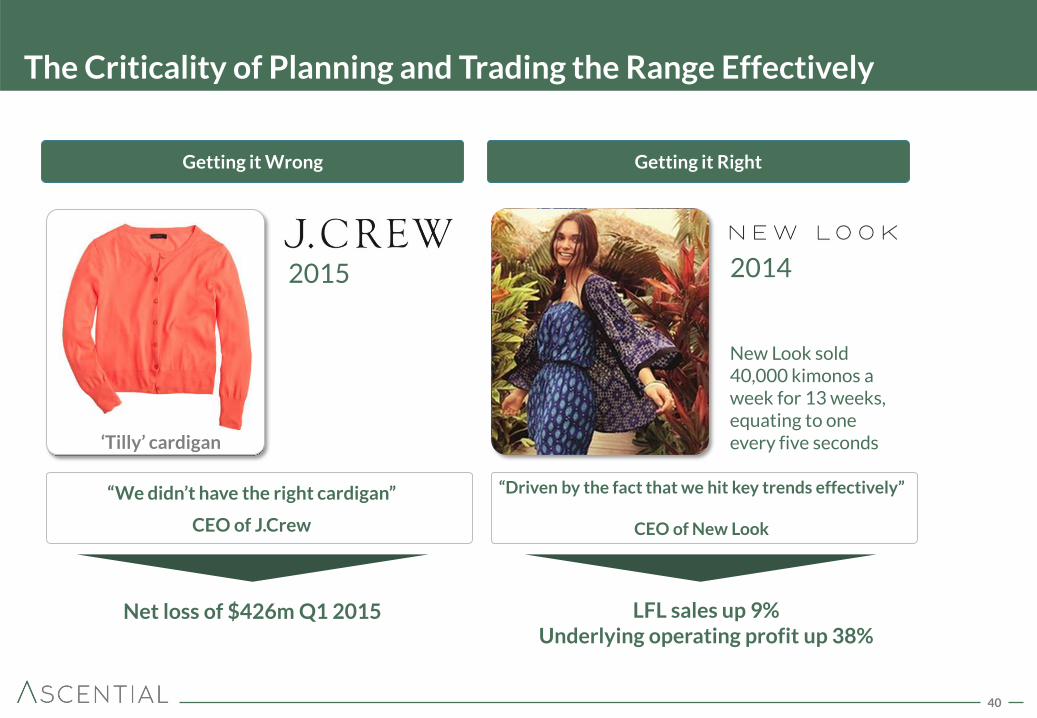
The Criticality of Planning and Trading the Range Effectively
New Look sold 40,000 kimonos a week for 13 weeks, equating to one every five seconds
2014
Net loss of $426m Q1 2015 LFL sales up 9% Underlying operating profit up 38%
“Driven by the fact that we hit key trends effectively”
CEO of New Look
‘Tilly’ cardigan
Getting it Right Getting it Wrong
2015
“We didn’t have the right cardigan”
CEO of J.Crew
41
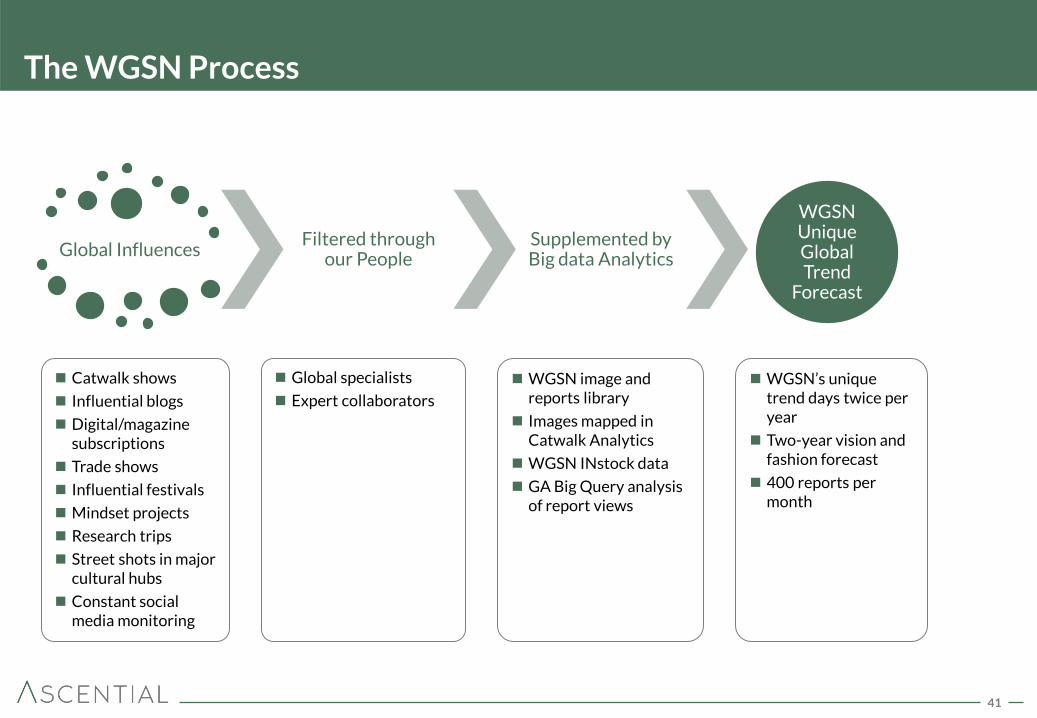
The WGSN Process
Global Influences Filtered through
our People Supplemented by Big data Analytics
WGSN Unique Global Trend
Forecast
Catwalk shows
Influential blogs
Digital/magazine subscriptions
Trade shows
Influential festivals
Mindset projects
Research trips
Street shots in major cultural hubs
Constant social media monitoring
Global specialists
Expert collaborators
WGSN image and reports library
Images mapped in Catwalk Analytics
WGSN INstock data
GA Big Query analysis of report views
WGSN’s unique trend days twice per year
Two-year vision and fashion forecast
400 reports per month
42
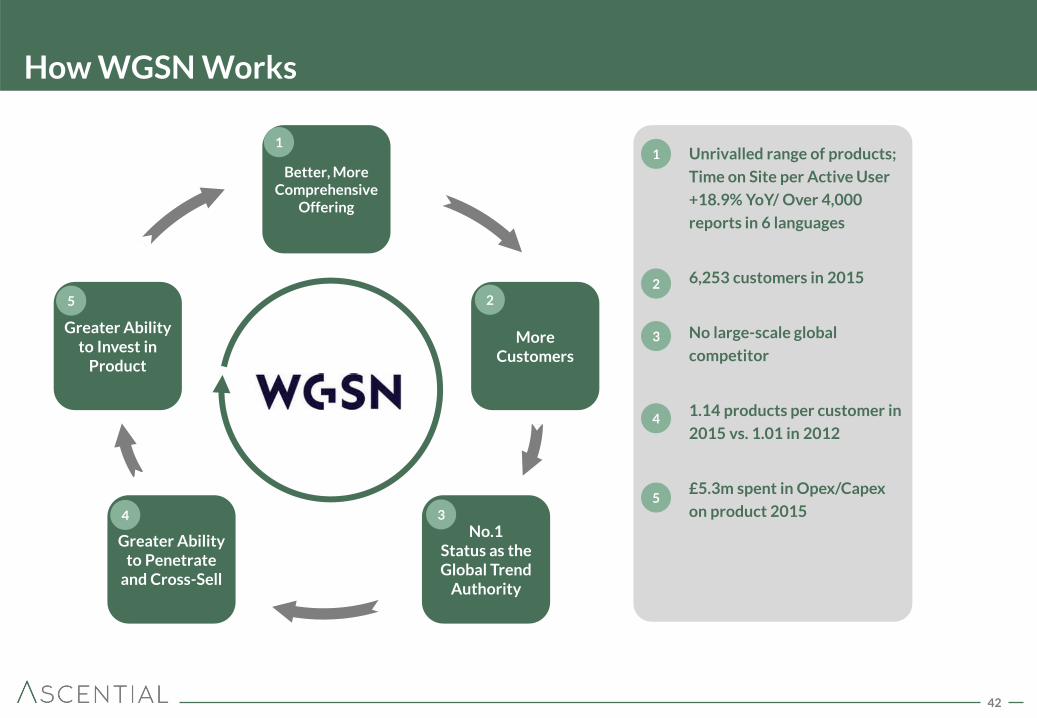
How WGSN Works
Better, More Comprehensive
Offering
More Customers
Greater Ability to Penetrate
and Cross-Sell
Greater Ability to Invest in
Product
No.1 Status as the Global Trend
Authority
Unrivalled range of products;
Time on Site per Active User
+18.9% YoY/ Over 4,000
reports in 6 languages
6,253 customers in 2015
No large-scale global
competitor
1.14 products per customer in
2015 vs. 1.01 in 2012
£5.3m spent in Opex/Capex
on product 2015
1
2
3
4
5
1
2
3 4
5
43
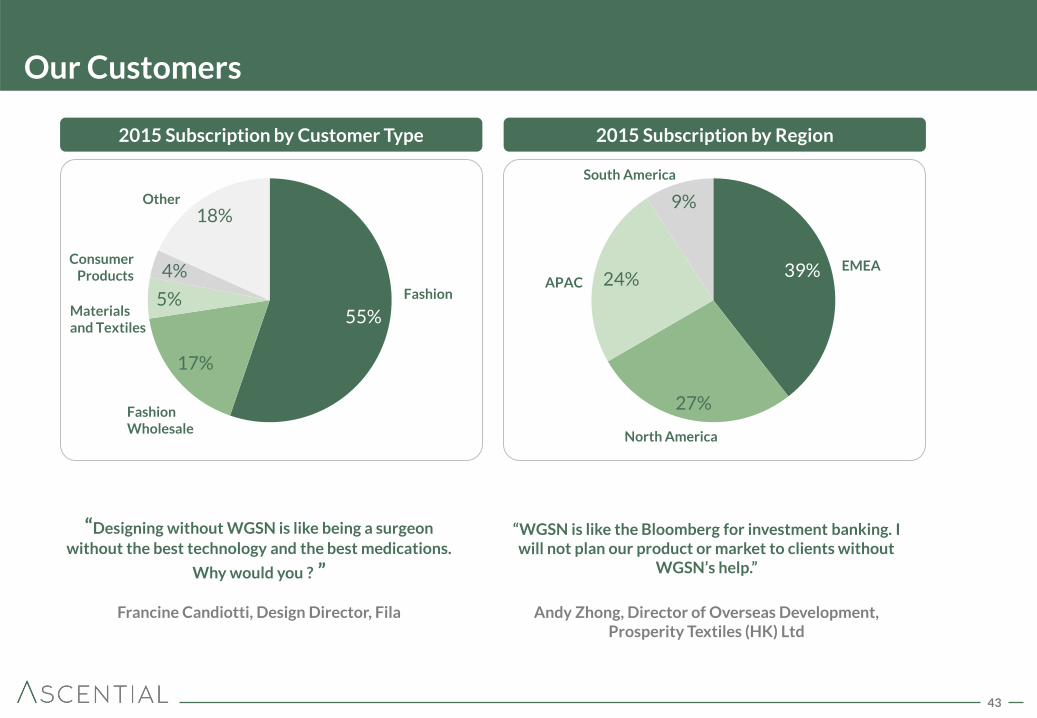
Our Customers
55%
17%
5%
4%
18%
2015 Subscription by Customer Type 2015 Subscription by Region
Fashion
Fashion Wholesale
Materials and Textiles
Other
Consumer Products 39%
27%
24%
9%
APAC
North America
South America
EMEA
“Designing without WGSN is like being a surgeon
without the best technology and the best medications.
Why would you ? ”
Francine Candiotti, Design Director, Fila
“WGSN is like the Bloomberg for investment banking. I will not plan our product or market to clients without
WGSN’s help.”
Andy Zhong, Director of Overseas Development,
Prosperity Textiles (HK) Ltd
44
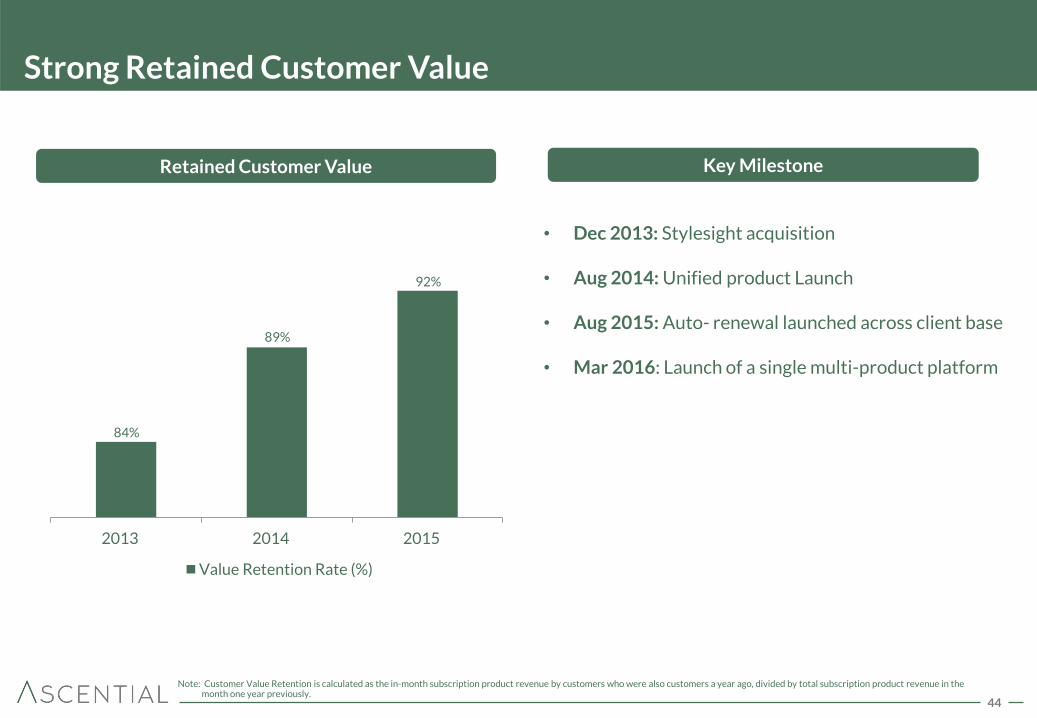
• Dec 2013: Stylesight acquisition
• Aug 2014: Unified product Launch
• Aug 2015: Auto- renewal launched across client base
• Mar 2016: Launch of a single multi-product platform
Strong Retained Customer Value
Note: Customer Value Retention is calculated as the in-month subscription product revenue by customers who were also customers a year ago, divided by total subscription product revenue in the month one year previously.
2013 2014 2015
Value Retention Rate (%)
92%
89%
84%
Retained Customer Value Key Milestone
45
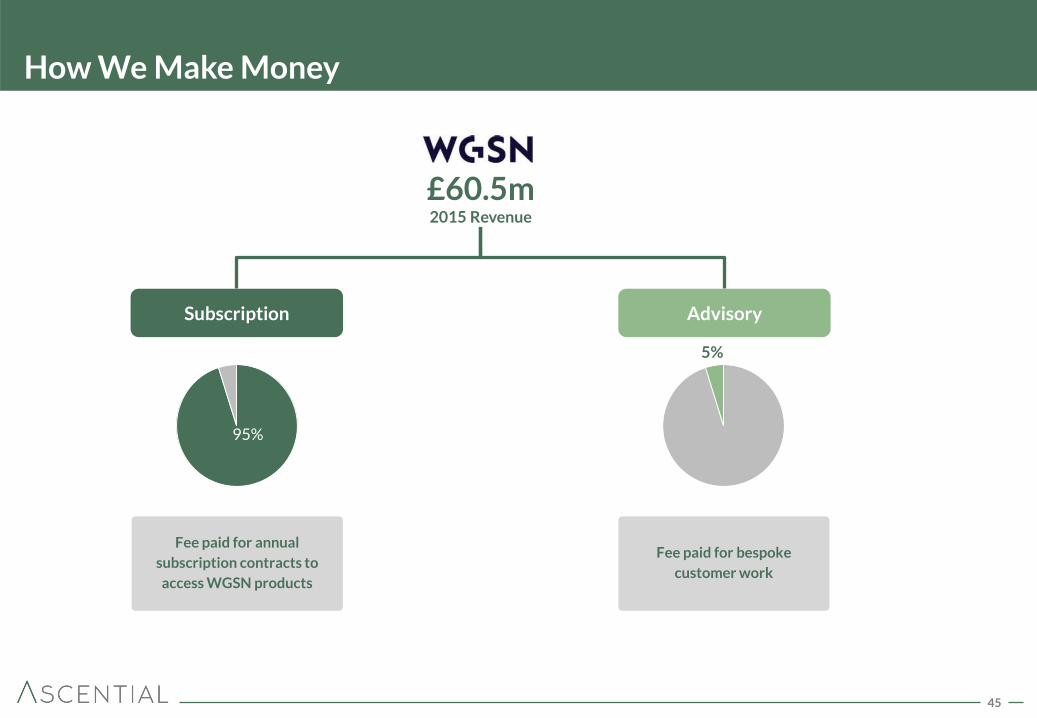
How We Make Money
£60.5m 2015 Revenue
Fee paid for annual
subscription contracts to
access WGSN products
Subscription Advisory
Fee paid for bespoke
customer work
95%
5%
46
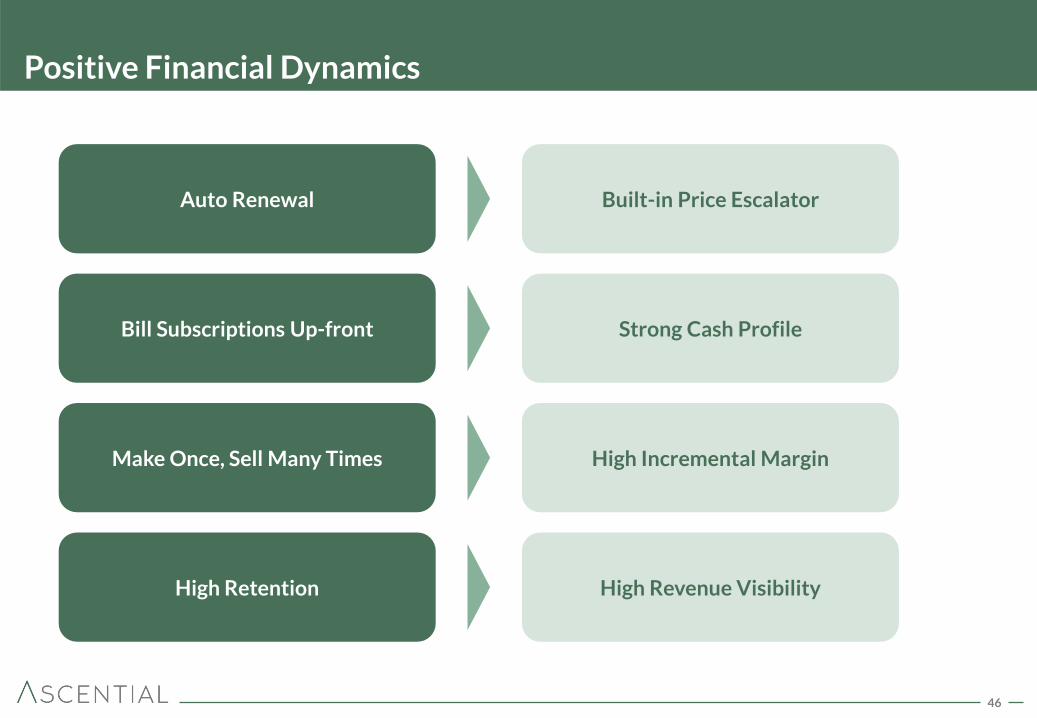
Positive Financial Dynamics
Bill Subscriptions Up-front Strong Cash Profile
Make Once, Sell Many Times High Incremental Margin
High Retention High Revenue Visibility
Auto Renewal Built-in Price Escalator
47
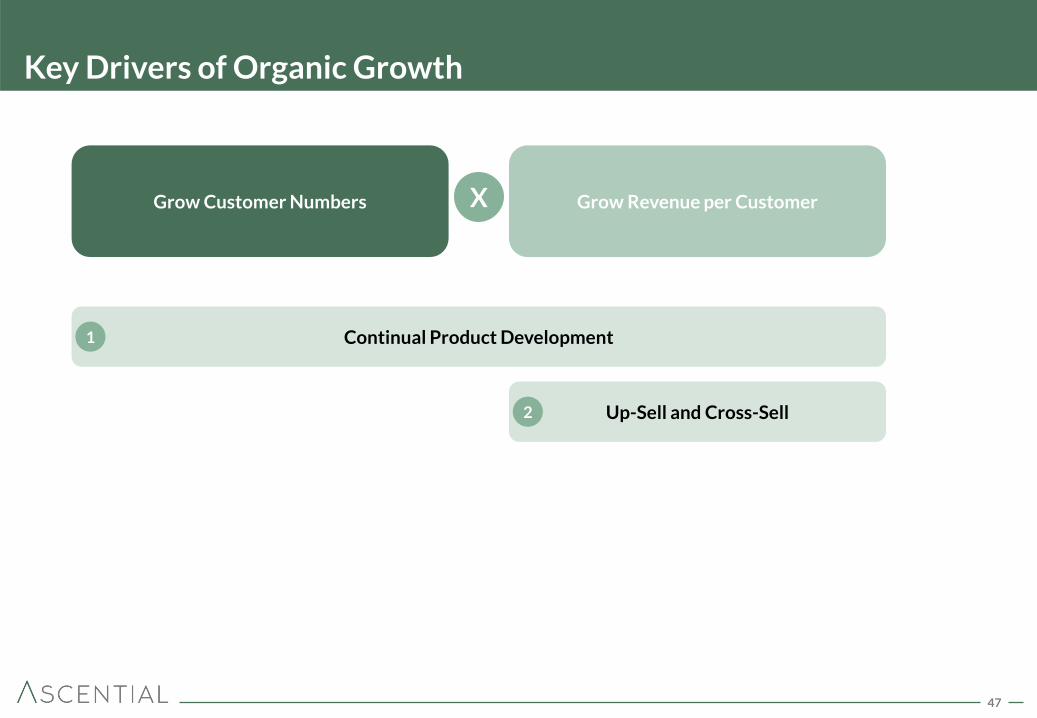
Key Drivers of Organic Growth
Grow Revenue per Customer Grow Customer Numbers X
Continual Product Development 1
Up-Sell and Cross-Sell 2
48
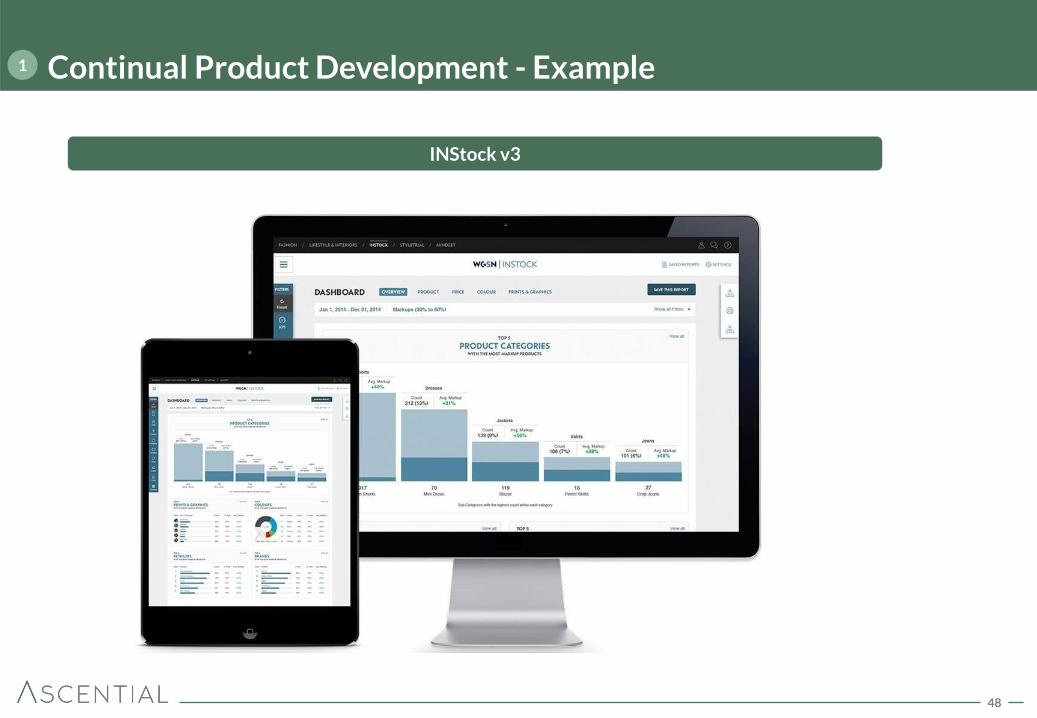
Continual Product Development - Example
INStock v3
1

49
Grow Revenues per Customer – Up-Sell and Cross-sell 2
180
907
2012 2015
0.3
2.9
2012 2015
Lifestyle & Interiors Customers Example
Mindset Revenues Example
125% CAGR
£m
>9x
Drive Up-sell
Cross-sell to WGSN Fashion
then Up-Sell
Number of customers
50
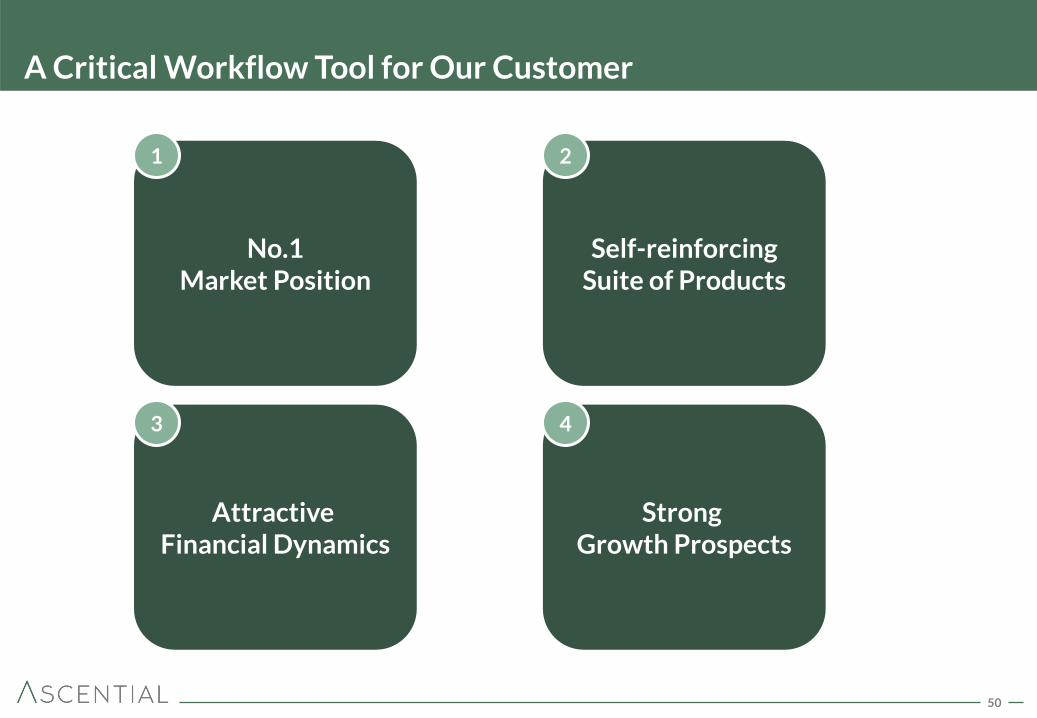
A Critical Workflow Tool for Our Customer
No.1 Market Position
Self-reinforcing Suite of Products
Attractive Financial Dynamics
Strong Growth Prospects
1 2
3 4
51
Natasha Christie-Miller
Provides critical information and
access to the right people
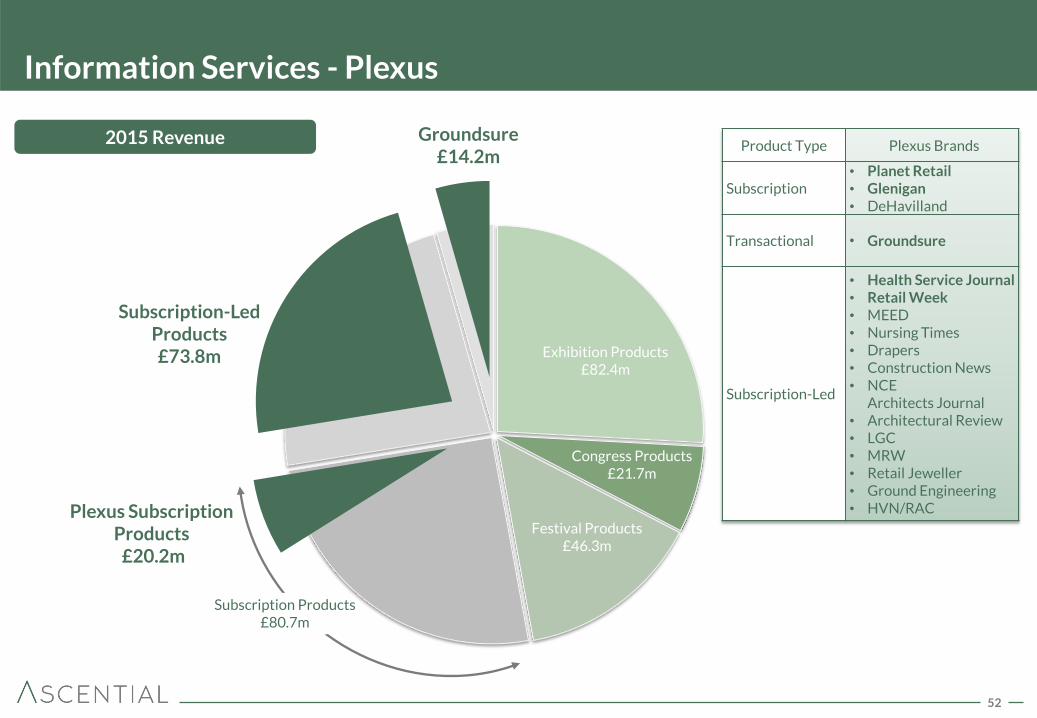
52
Exhibition Products £82.4m
Festival Products £46.3m
Subscription-Led Products £73.8m
Information Services - Plexus
Plexus Subscription Products £20.2m
Subscription-Led Products £73.8m
2015 Revenue Groundsure £14.2m
Product Type Plexus Brands
Subscription • Planet Retail • Glenigan • DeHavilland
Transactional • Groundsure
Subscription-Led
• Health Service Journal • Retail Week • MEED • Nursing Times • Drapers • Construction News • NCE
Architects Journal • Architectural Review • LGC • MRW • Retail Jeweller • Ground Engineering • HVN/RAC
Subscription Products £80.7m
Congress Products £21.7m
53
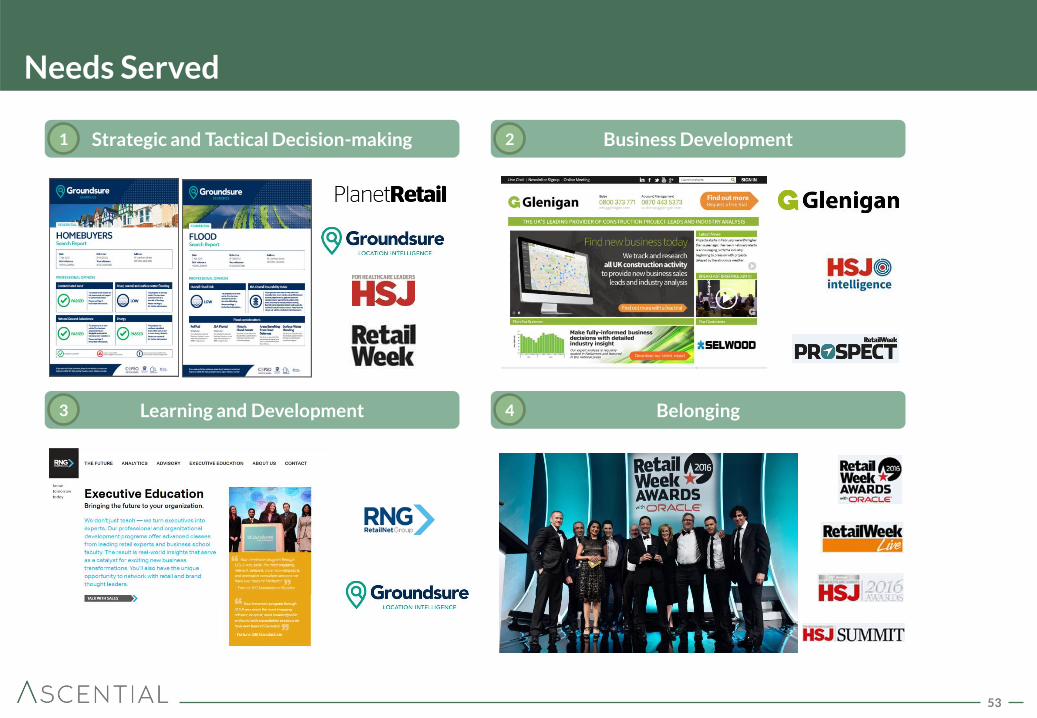
Needs Served
Learning and Development Belonging
Business Development 2
3 4
Strategic and Tactical Decision-making 1
54
Key Plexus Product Introduction Video
55
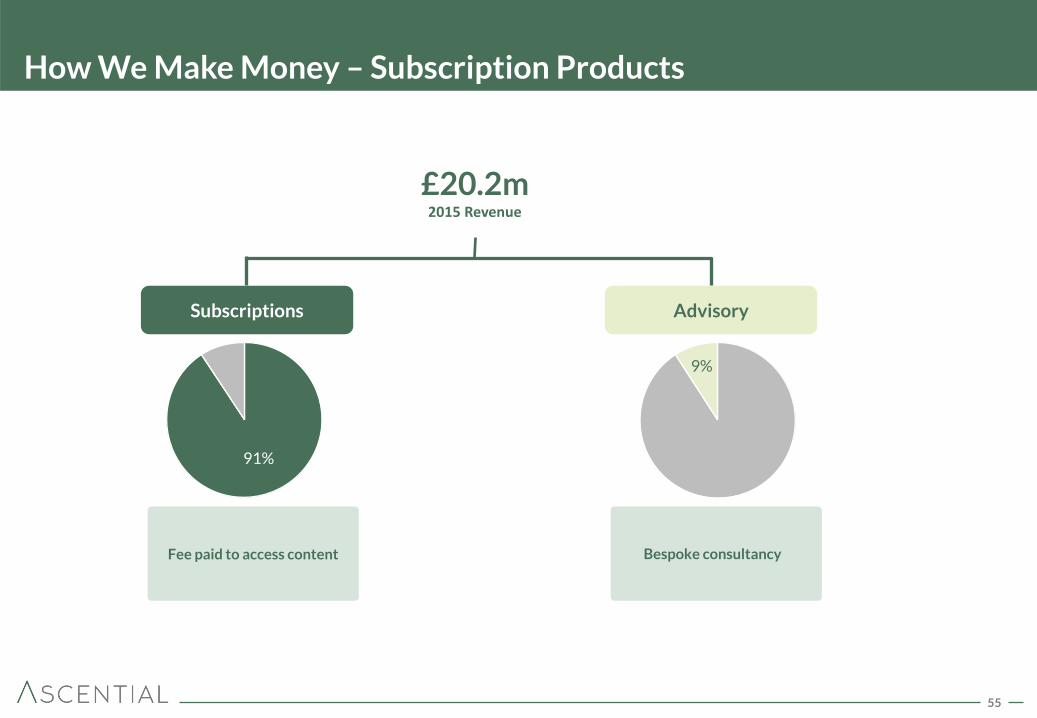
How We Make Money – Subscription Products
(1)
Fee paid to access content
Subscriptions Advisory
Bespoke consultancy
£20.2m 2015 Revenue
54%
9%
91%
56
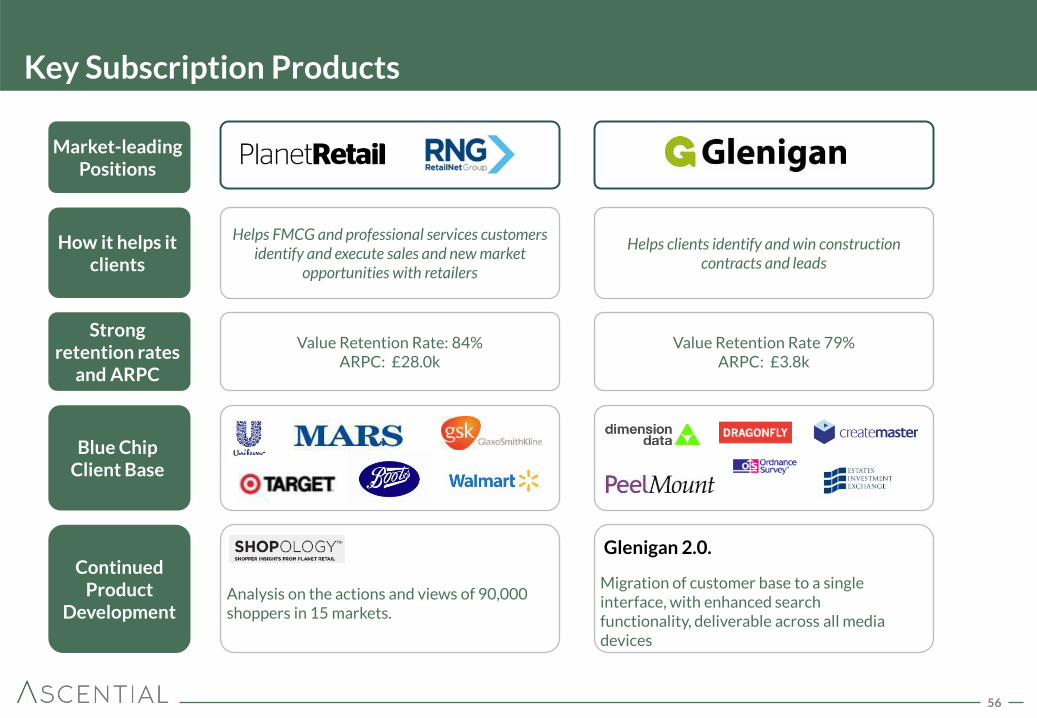
Key Subscription Products
Market-leading Positions
Blue Chip Client Base
Continued Product
Development
Value Retention Rate: 84% ARPC: £28.0k
Strong retention rates
and ARPC
Value Retention Rate 79% ARPC: £3.8k
Helps FMCG and professional services customers identify and execute sales and new market
opportunities with retailers
How it helps it clients
Helps clients identify and win construction contracts and leads
Migration of customer base to a single interface, with enhanced search functionality, deliverable across all media devices
Analysis on the actions and views of 90,000 shoppers in 15 markets.
Glenigan 2.0.
57
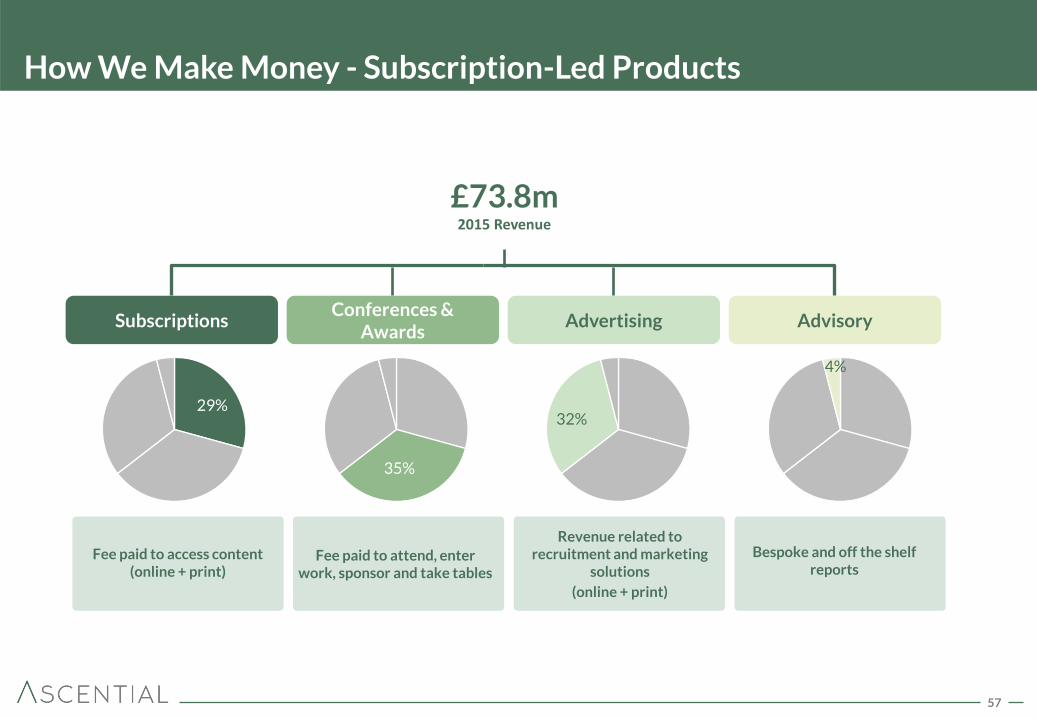
How We Make Money - Subscription-Led Products
(1)
Fee paid to attend, enter work, sponsor and take tables
Fee paid to access content
(online + print)
Subscriptions Conferences &
Awards Advertising Advisory
Revenue related to recruitment and marketing
solutions
(online + print)
Bespoke and off the shelf reports
£73.8m 2015 Revenue
36% 22%
29%
35%
32%
4%

58
30% 35%
19% 28%
29%
43% 29% 16%
7% 9%
16%
1% 4% 4%
2008 2010 2015
Events Subscriptions Print Advertising Digital and Other Advertising Advisory
29%
Revenue Streams Increasingly Robust
Subscription-Led Revenue Breakdown
4% of Group
59
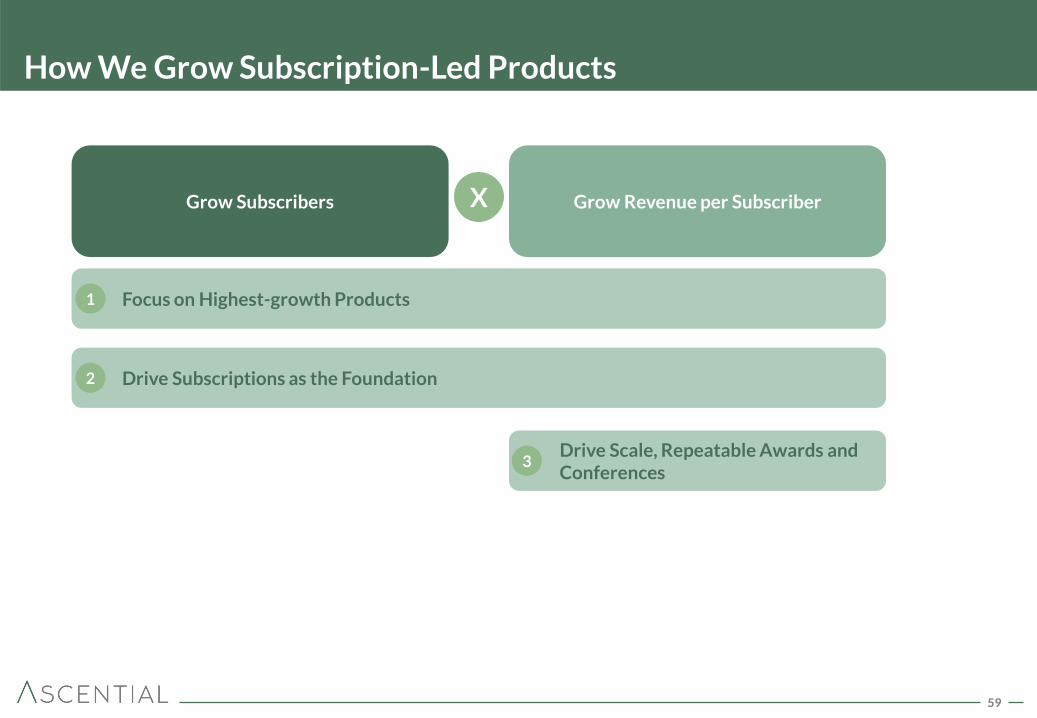
How We Grow Subscription-Led Products
Grow Revenue per Subscriber Grow Subscribers X
Focus on Highest-growth Products 1
Drive Subscriptions as the Foundation 2
Drive Scale, Repeatable Awards and Conferences
3
60
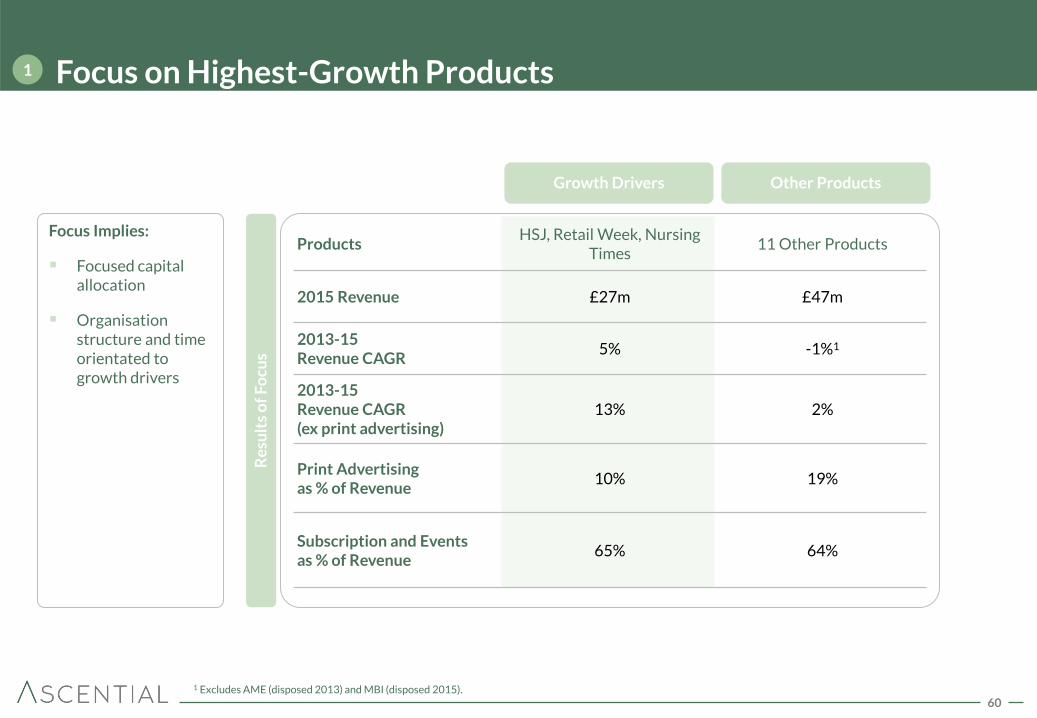
Focus on Highest-Growth Products 1
Products HSJ, Retail Week, Nursing
Times 11 Other Products
2015 Revenue £27m £47m
2013-15 Revenue CAGR
5% -1%1
2013-15 Revenue CAGR (ex print advertising)
13% 2%
Print Advertising as % of Revenue
10% 19%
Subscription and Events as % of Revenue
65% 64%
Growth Drivers Other Products
Re
sult
s o
f F
ocu
s
Focus Implies:
Focused capital allocation
Organisation structure and time orientated to growth drivers
1 Excludes AME (disposed 2013) and MBI (disposed 2015).
61
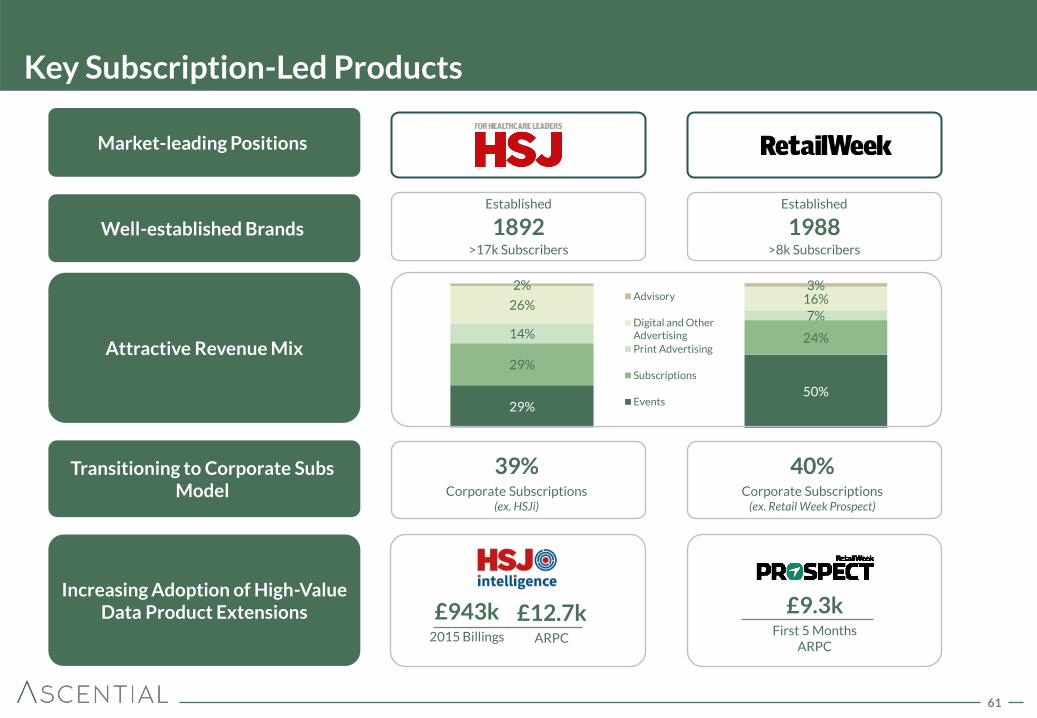
29%
29%
14%
26%
2% Advisory
Digital and OtherAdvertising
Print Advertising
Subscriptions
Events50%
24%
7%
16% 3%
Key Subscription-Led Products
Market-leading Positions
Transitioning to Corporate Subs Model
Increasing Adoption of High-Value Data Product Extensions
39% Corporate Subscriptions
(ex. HSJi)
Established
1892 >17k Subscribers
Well-established Brands
40% Corporate Subscriptions
(ex. Retail Week Prospect)
£943k 2015 Billings
£12.7k ARPC
£9.3k First 5 Months
ARPC
Established
1988 >8k Subscribers
Attractive Revenue Mix
62
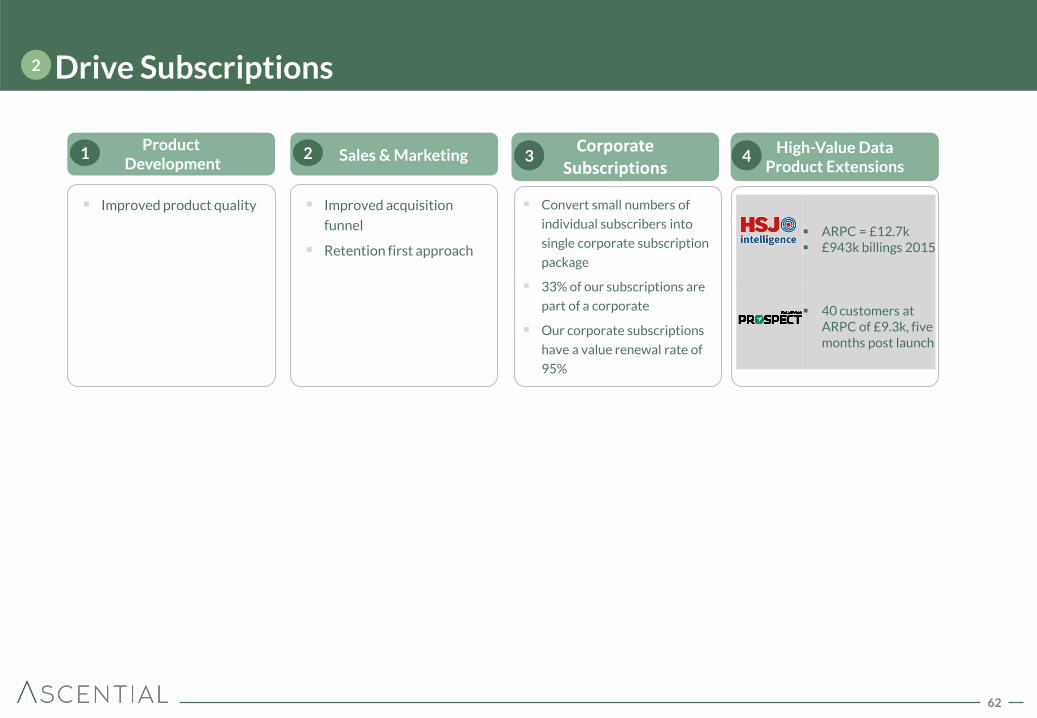
Drive Subscriptions 2
ARPC = £12.7k £943k billings 2015
40 customers at ARPC of £9.3k, five months post launch
High-Value Data Product Extensions
Product Development
Improved product quality
1 Corporate Subscriptions
3 4 Sales & Marketing 2
Improved acquisition
funnel
Retention first approach
Convert small numbers of
individual subscribers into
single corporate subscription
package
33% of our subscriptions are
part of a corporate
Our corporate subscriptions
have a value renewal rate of
95%
63
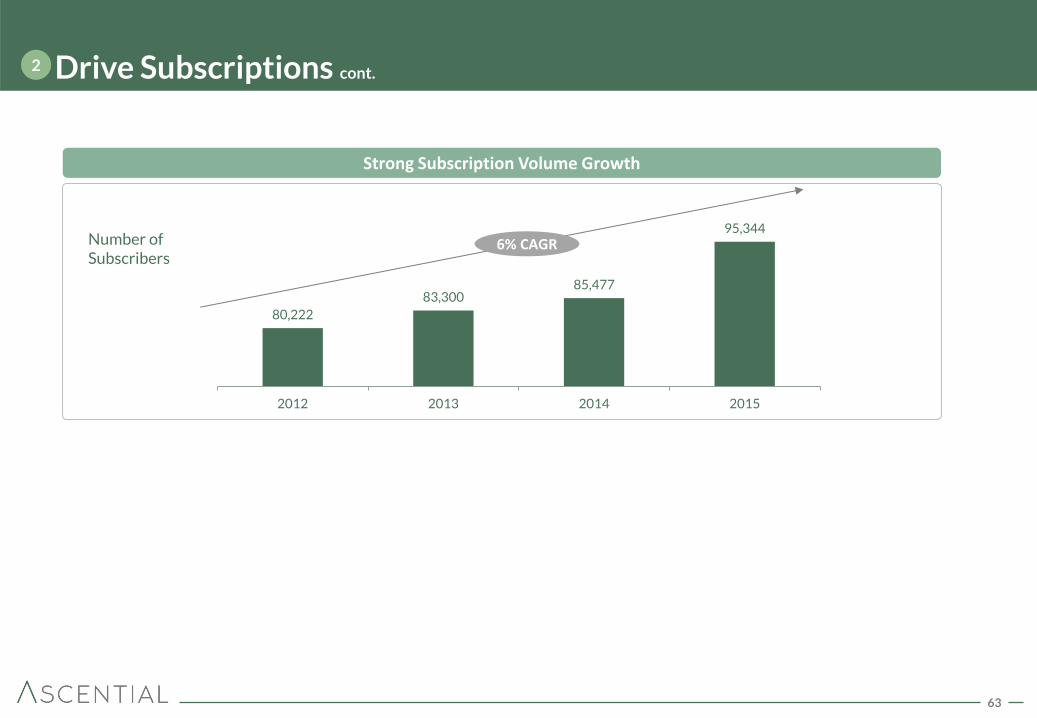
Drive Subscriptions cont. 2
Strong Subscription Volume Growth
Number of Subscribers
80,222
83,300 85,477
95,344
2012 2013 2014 2015
6% CAGR
64
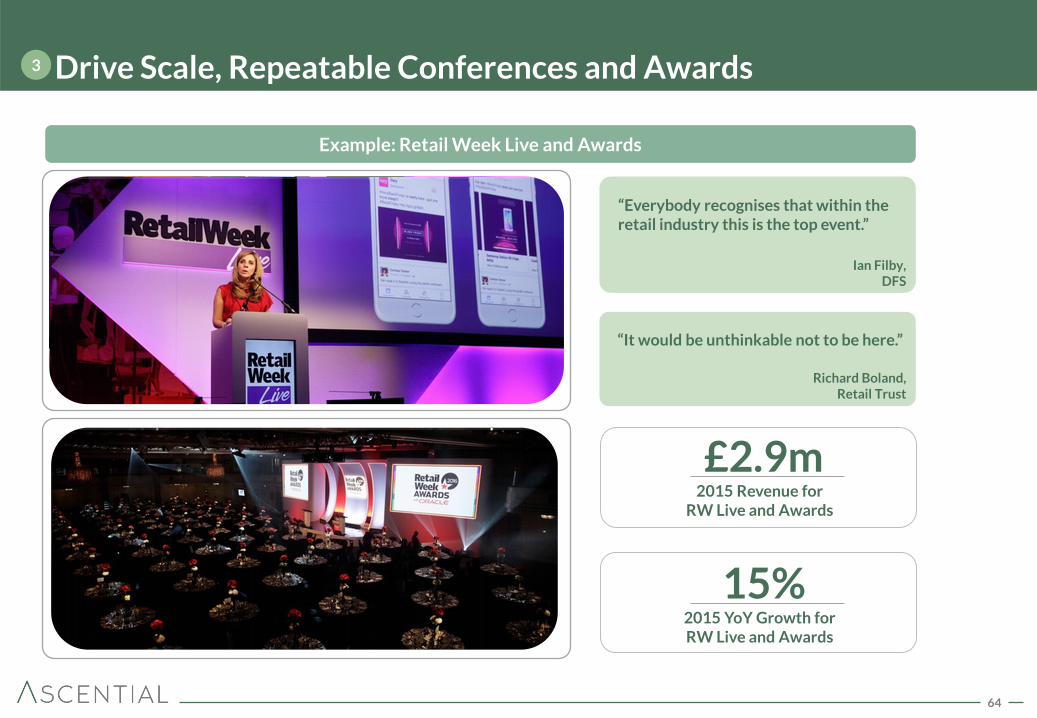
Drive Scale, Repeatable Conferences and Awards 3
“Everybody recognises that within the retail industry this is the top event.”
Ian Filby, DFS
“It would be unthinkable not to be here.”
Richard Boland, Retail Trust
£2.9m 2015 Revenue for
RW Live and Awards
15% 2015 YoY Growth for RW Live and Awards
Example: Retail Week Live and Awards
65
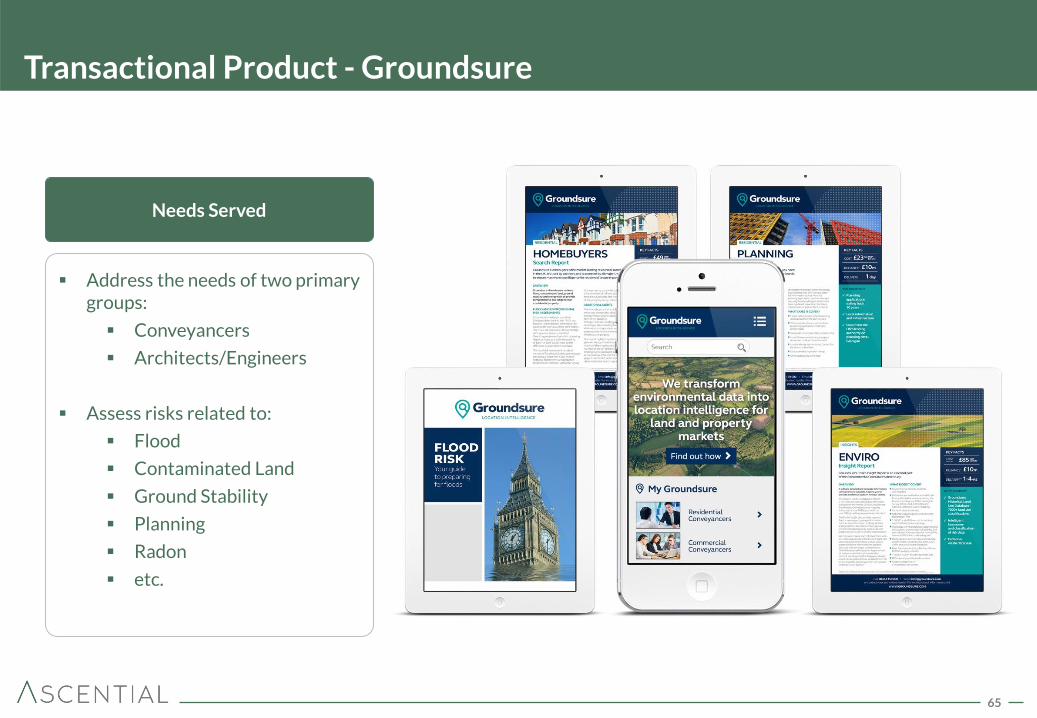
Transactional Product - Groundsure
Address the needs of two primary groups:
Conveyancers
Architects/Engineers
Assess risks related to:
Flood
Contaminated Land
Ground Stability
Planning
Radon
etc.
Needs Served
66
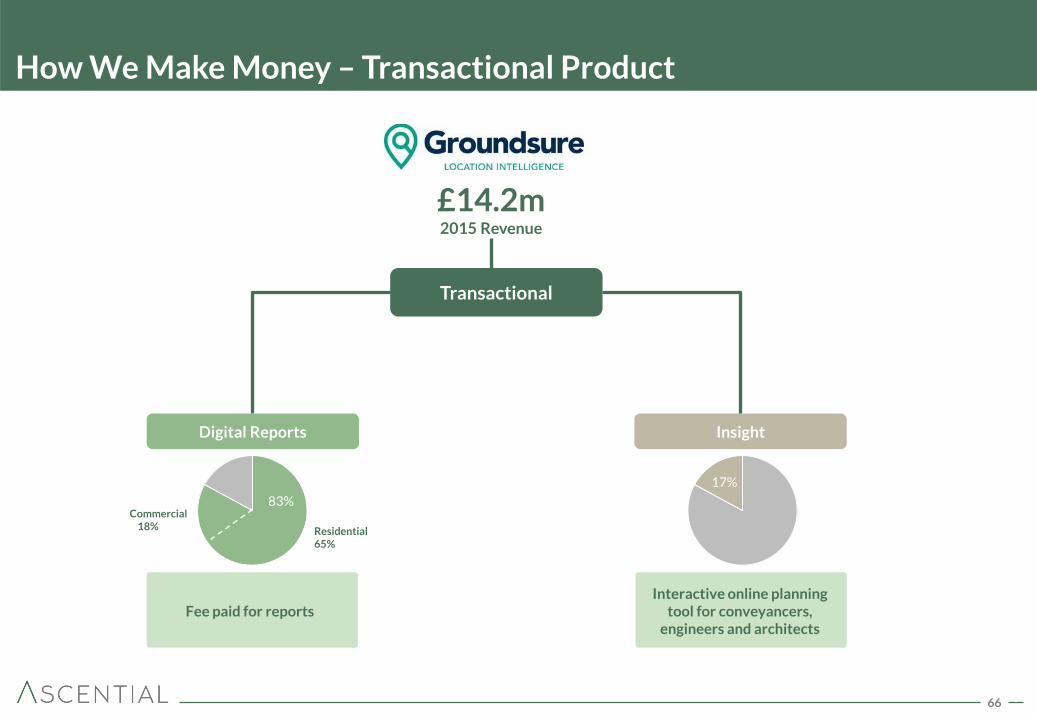
How We Make Money – Transactional Product
Interactive online planning tool for conveyancers,
engineers and architects
Fee paid for reports
£14.2m 2015 Revenue
Digital Reports Insight
(1) Transactional
83%
Residential 65%
Commercial 18%
17%
67
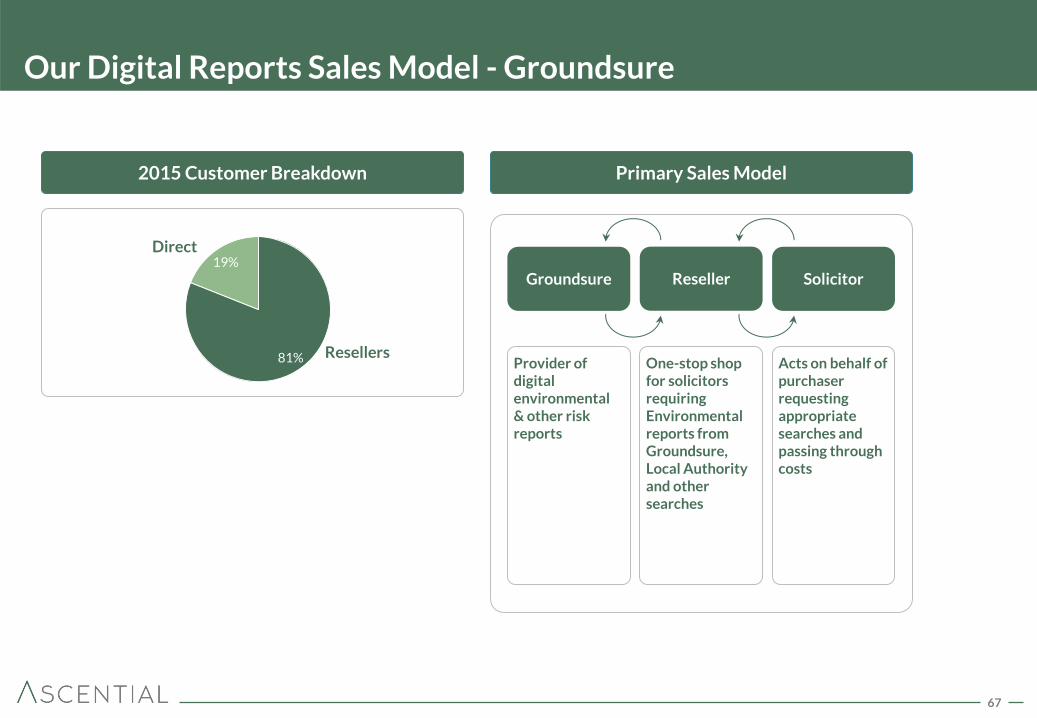
Our Digital Reports Sales Model - Groundsure
Primary Sales Model 2015 Customer Breakdown
One-stop shop for solicitors requiring Environmental reports from Groundsure, Local Authority and other searches
Acts on behalf of purchaser requesting appropriate searches and passing through costs
Provider of digital environmental & other risk reports
Groundsure Reseller Solicitor
81%
19%
Resellers
Direct
68
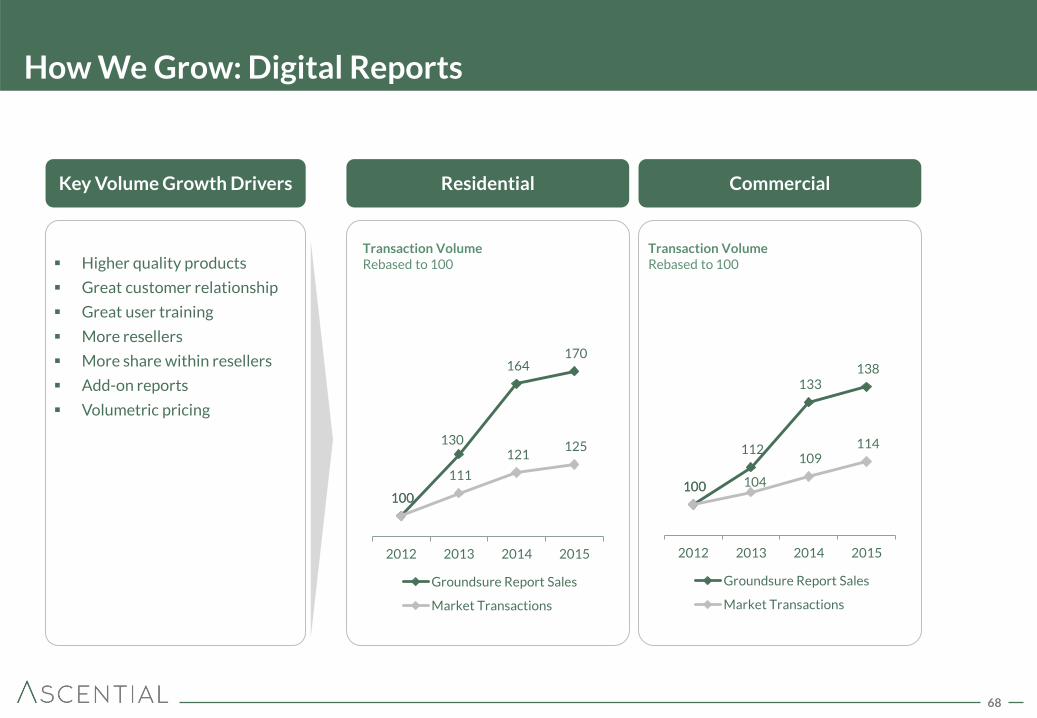
How We Grow: Digital Reports
Residential Key Volume Growth Drivers
Higher quality products
Great customer relationship
Great user training
More resellers
More share within resellers
Add-on reports
Volumetric pricing
Commercial
Transaction Volume Rebased to 100
Transaction Volume Rebased to 100
100
130
164 170
100
111
121 125
2012 2013 2014 2015
Groundsure Report Sales
Market Transactions
100
112
133 138
100 104
109 114
2012 2013 2014 2015
Groundsure Report Sales
Market Transactions
69
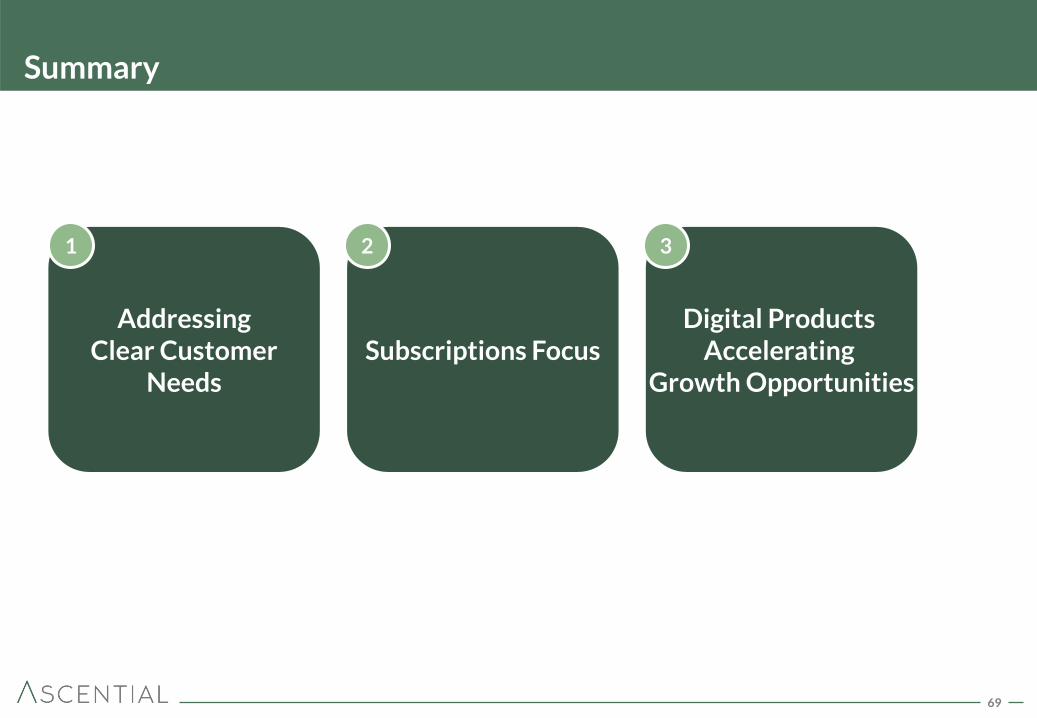
Summary
Addressing Clear Customer
Needs Subscriptions Focus
Digital Products
Accelerating Growth Opportunities
1 2 3
70
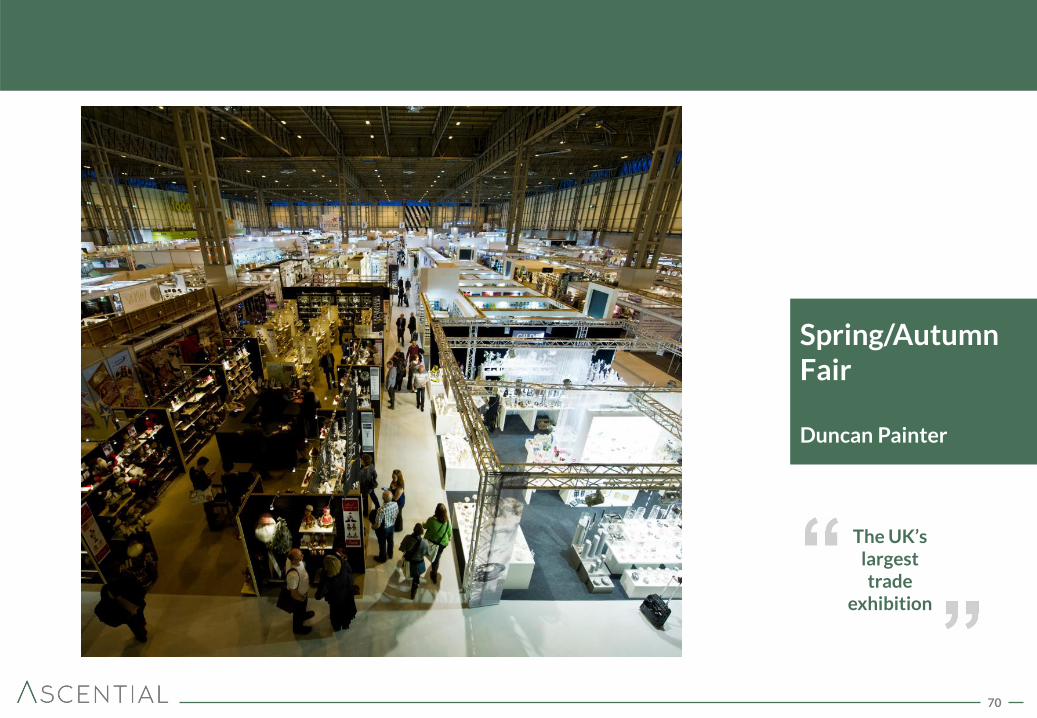
Spring/Autumn Fair Duncan Painter
The UK’s largest trade
exhibition
71
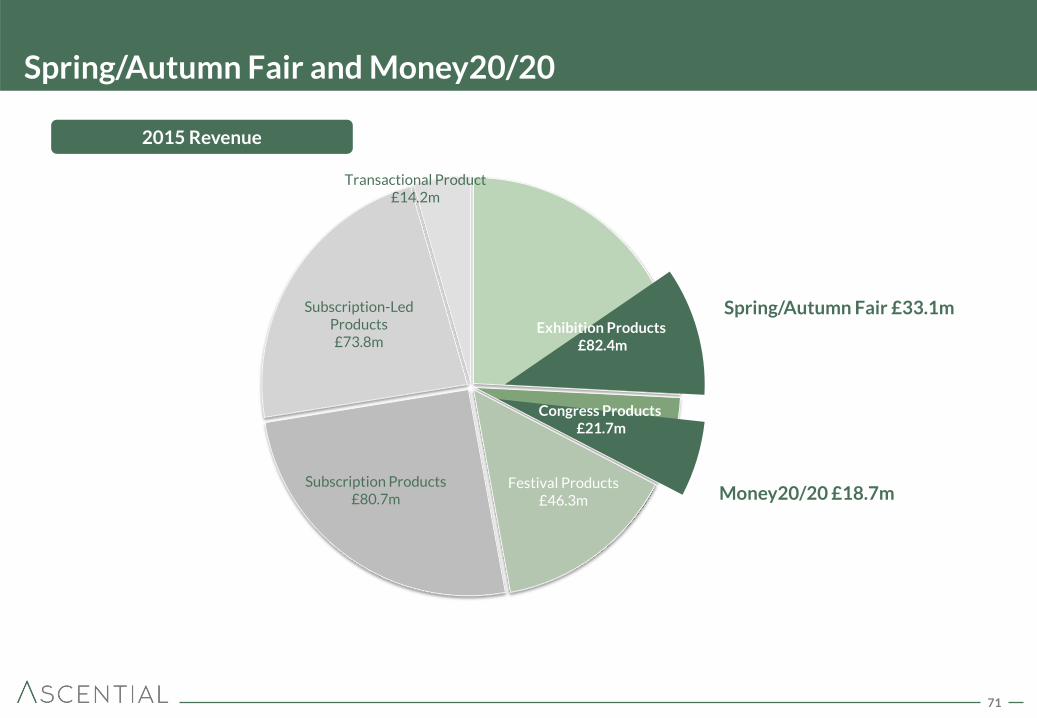
Festival Products £46.3m
Subscription Products £80.7m
Subscription-Led Products £73.8m
Transactional Product £14.2m
Spring/Autumn Fair £33.1m
Spring/Autumn Fair and Money20/20
Money20/20 £18.7m
2015 Revenue
Congress Products £21.7m
Exhibition Products £82.4m
72
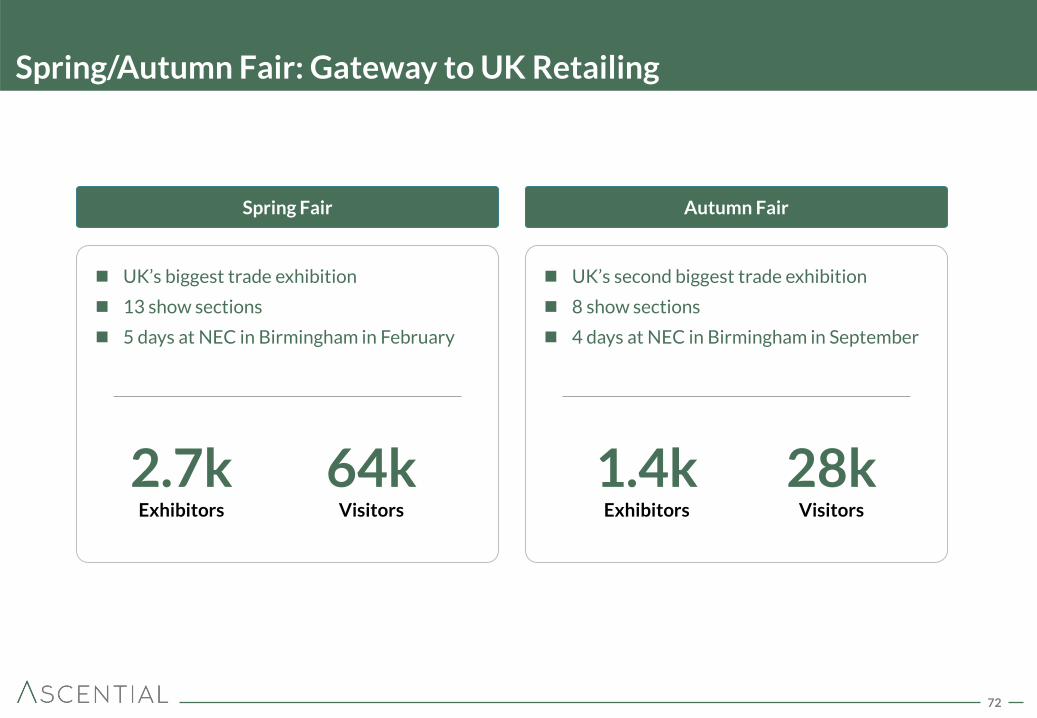
Spring/Autumn Fair: Gateway to UK Retailing
Spring Fair Autumn Fair
UK’s biggest trade exhibition
13 show sections
5 days at NEC in Birmingham in February
UK’s second biggest trade exhibition
8 show sections
4 days at NEC in Birmingham in September
2.7k Exhibitors
64k Visitors
1.4k Exhibitors
28k Visitors
73
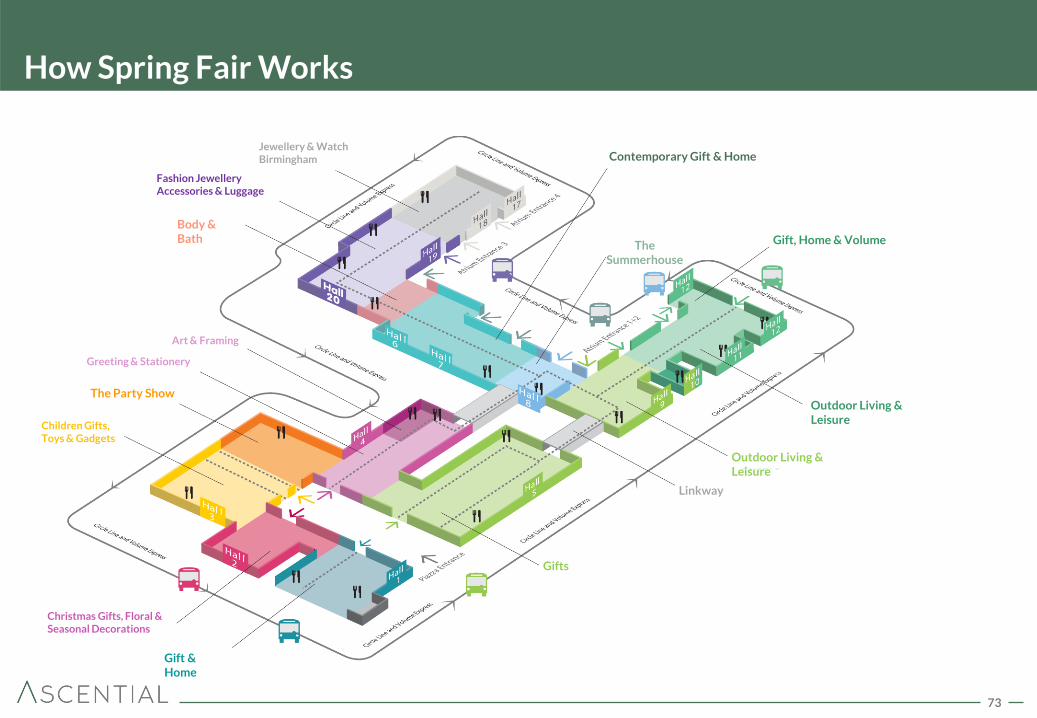
How Spring Fair Works
Contemporary Gift & Home
Gift, Home & Volume
Outdoor Living & Leisure
Outdoor Living & Leisure
Outdoor Living & Leisure
Gifts
Linkway
The Summerhouse
Jewellery & Watch Birmingham
Fashion Jewellery Accessories & Luggage
Body & Bath
Art & Framing
Greeting & Stationery
The Party Show
Children Gifts, Toys & Gadgets
Gift & Home
Christmas Gifts, Floral & Seasonal Decorations
74
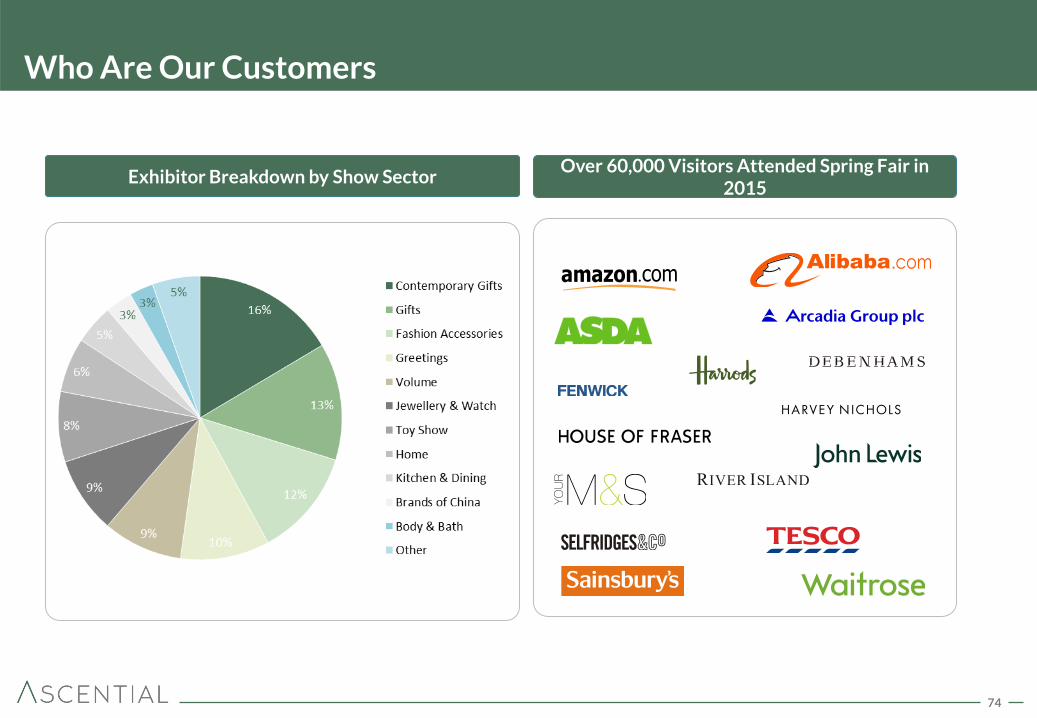
Who Are Our Customers
Exhibitor Breakdown by Show Sector Over 60,000 Visitors Attended Spring Fair in 2015
75
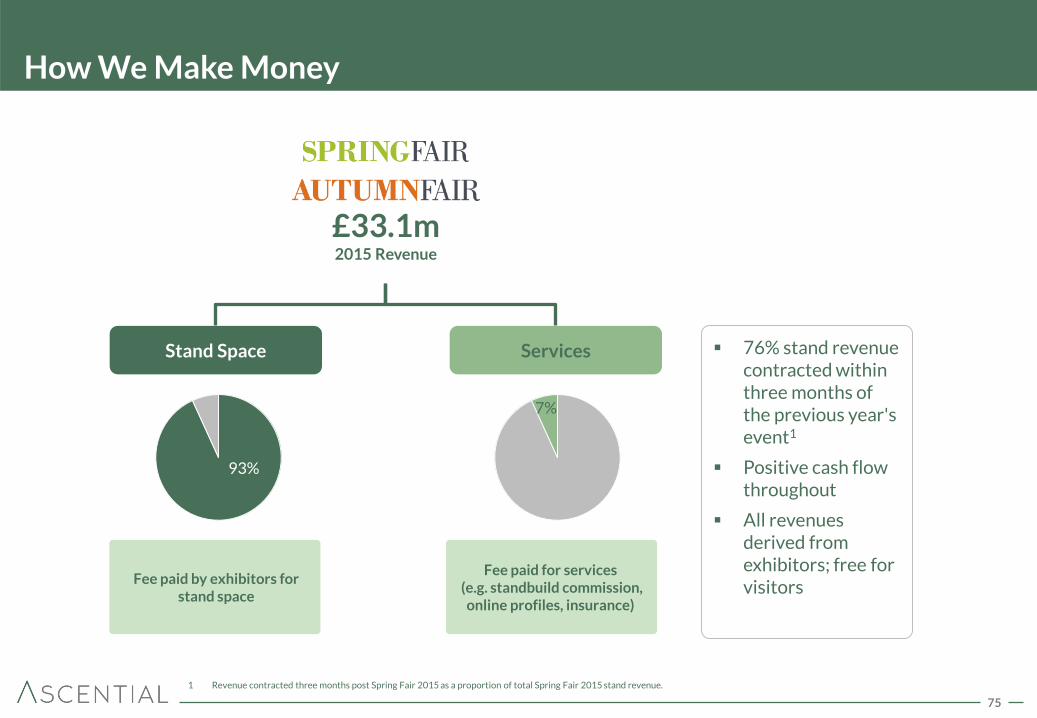
How We Make Money
(1)
Fee paid by exhibitors for stand space
Stand Space Services
Fee paid for services (e.g. standbuild commission,
online profiles, insurance)
£33.1m 2015 Revenue
76% stand revenue contracted within three months of the previous year's event1
Positive cash flow throughout
All revenues derived from exhibitors; free for visitors
1 Revenue contracted three months post Spring Fair 2015 as a proportion of total Spring Fair 2015 stand revenue.
93%
7%
76
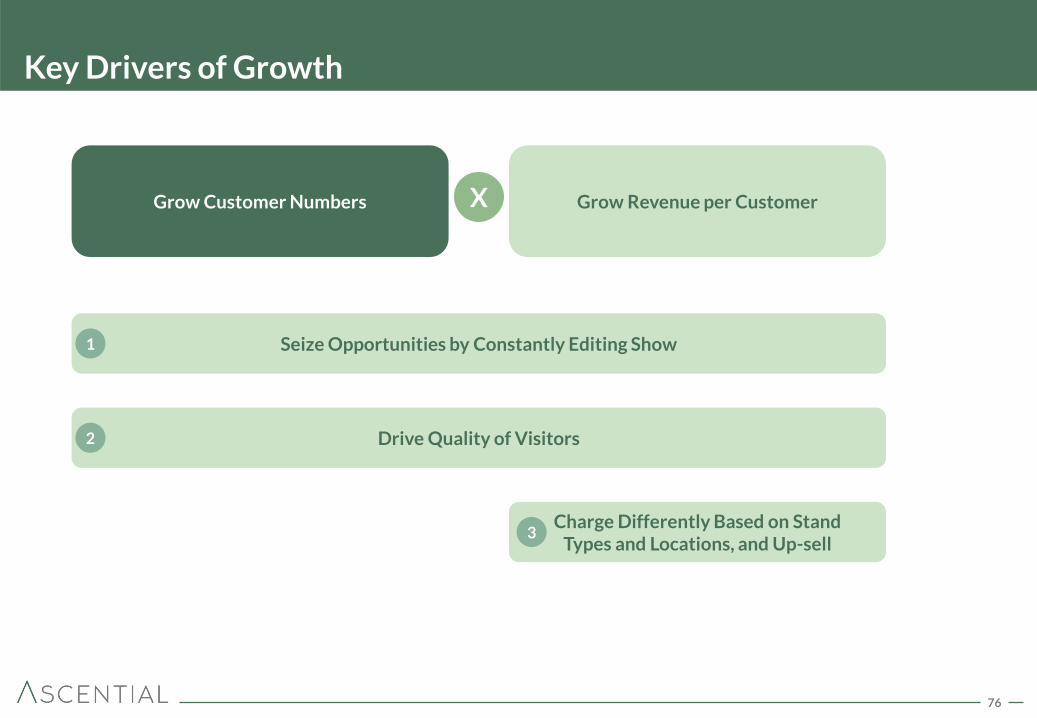
Key Drivers of Growth
Grow Revenue per Customer Grow Customer Numbers X
Seize Opportunities by Constantly Editing Show 1
Charge Differently Based on Stand Types and Locations, and Up-sell
3
Drive Quality of Visitors 2
77
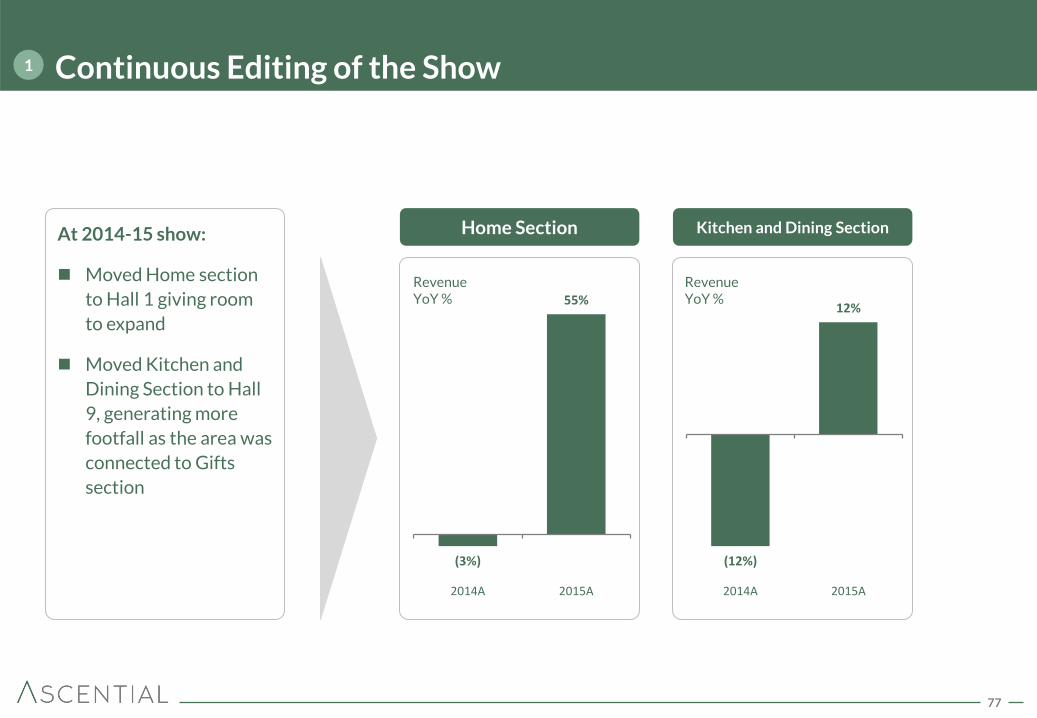
Continuous Editing of the Show 1
At 2014-15 show:
Moved Home section
to Hall 1 giving room
to expand
Moved Kitchen and
Dining Section to Hall
9, generating more
footfall as the area was
connected to Gifts
section
(3%)
55%
2014A 2015A
(12%)
12%
2014A 2015A
Home Section Kitchen and Dining Section
Revenue YoY %
Revenue YoY %
78
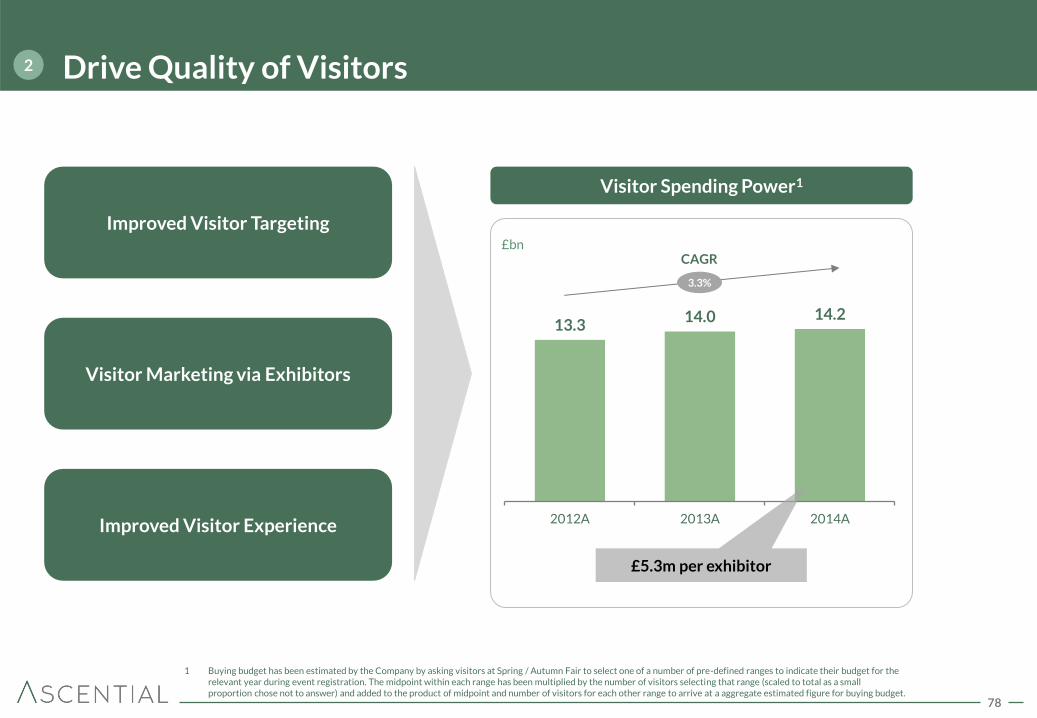
Drive Quality of Visitors 2
13.3 14.0 14.2
2012A 2013A 2014A
Visitor Spending Power1
£bn
3.3%
CAGR
£5.3m per exhibitor
Improved Visitor Targeting
Visitor Marketing via Exhibitors
Improved Visitor Experience
1 Buying budget has been estimated by the Company by asking visitors at Spring / Autumn Fair to select one of a number of pre-defined ranges to indicate their budget for the relevant year during event registration. The midpoint within each range has been multiplied by the number of visitors selecting that range (scaled to total as a small proportion chose not to answer) and added to the product of midpoint and number of visitors for each other range to arrive at a aggregate estimated figure for buying budget.
79
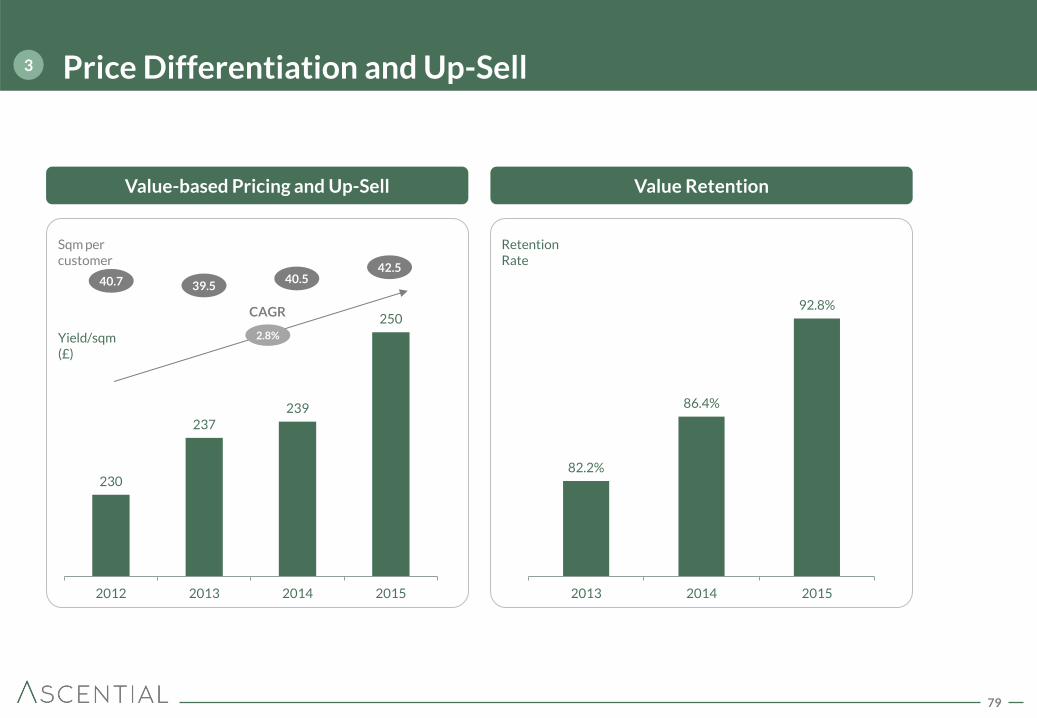
230
237 239
250
2012 2013 2014 2015
Price Differentiation and Up-Sell 3
2.8%
CAGR
Value-based Pricing and Up-Sell Value Retention
Yield/sqm
(£)
40.7 39.5 40.5
Sqm per customer
Retention Rate
42.5
82.2%
86.4%
92.8%
2013 2014 2015
80
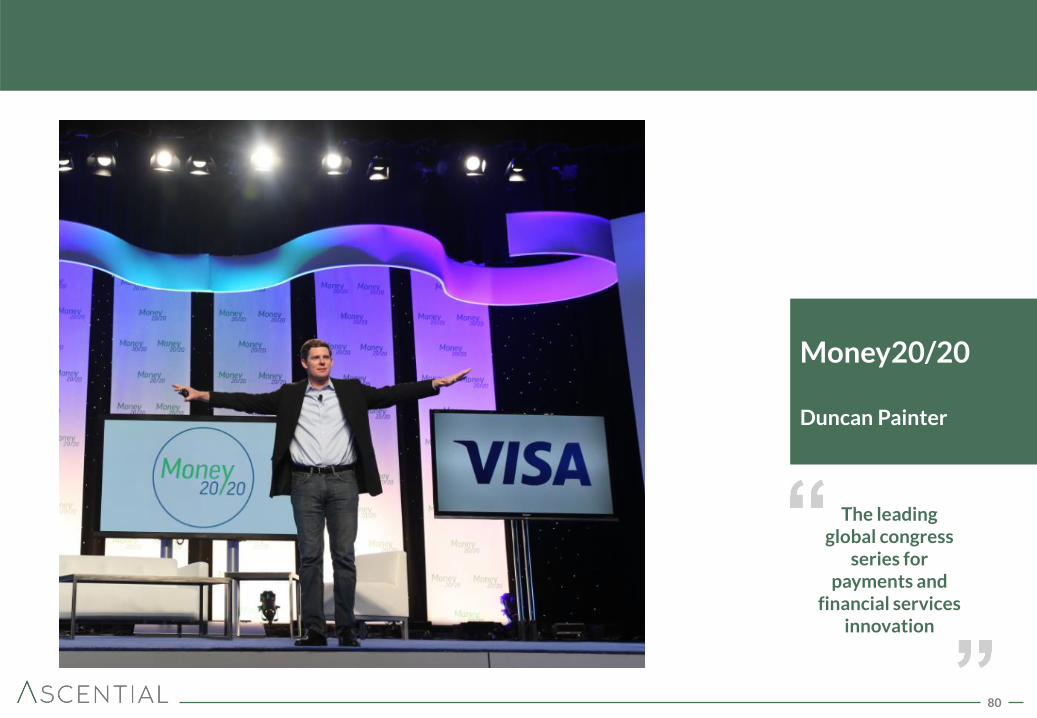
Money20/20 Duncan Painter
The leading global congress
series for payments and
financial services innovation
81
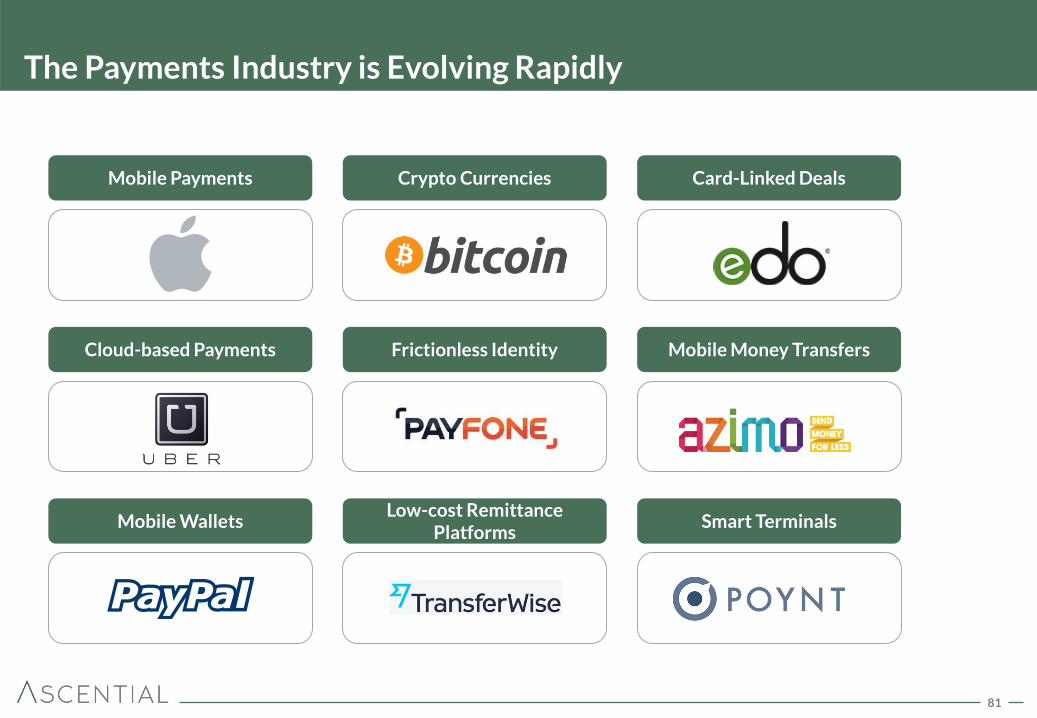
The Payments Industry is Evolving Rapidly
Mobile Payments Crypto Currencies Card-Linked Deals
Cloud-based Payments Frictionless Identity Mobile Money Transfers
Mobile Wallets Low-cost Remittance
Platforms Smart Terminals
82
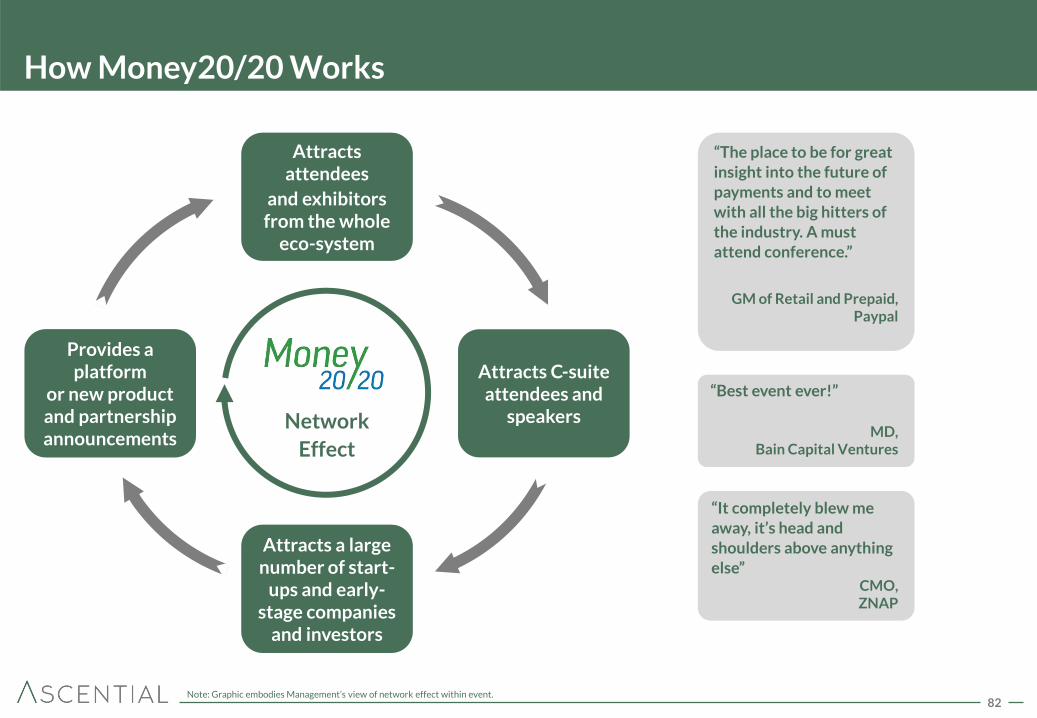
How Money20/20 Works
Attracts attendees
and exhibitors from the whole
eco-system
Attracts C-suite attendees and
speakers
Provides a platform
or new product and partnership announcements
Attracts a large number of start-
ups and early-stage companies
and investors
“The place to be for great insight into the future of
payments and to meet with all the big hitters of the industry. A must attend conference.”
GM of Retail and Prepaid, Paypal
Network
Effect
“Best event ever!”
MD, Bain Capital Ventures
“It completely blew me away, it’s head and shoulders above anything else”
CMO, ZNAP
Note: Graphic embodies Management’s view of network effect within event.
83
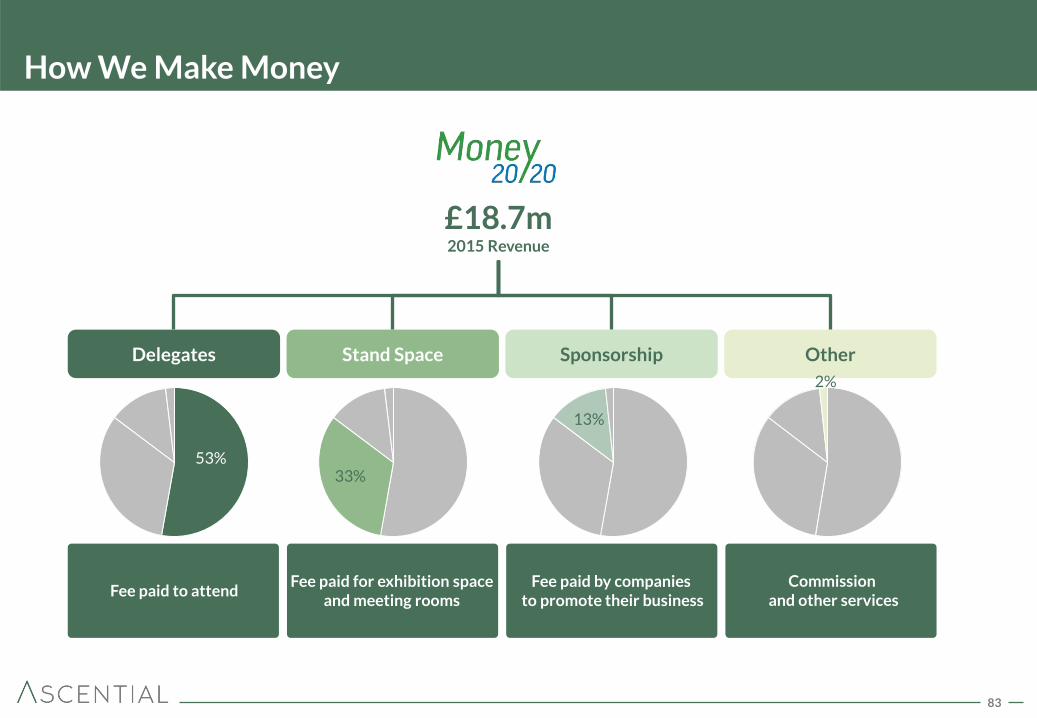
How We Make Money
Fee paid for exhibition space and meeting rooms
Fee paid to attend
Delegates Sponsorship Stand Space Other
Fee paid by companies to promote their business
Commission and other services
£18.7m 2015 Revenue
53% 33%
13%
2%
84
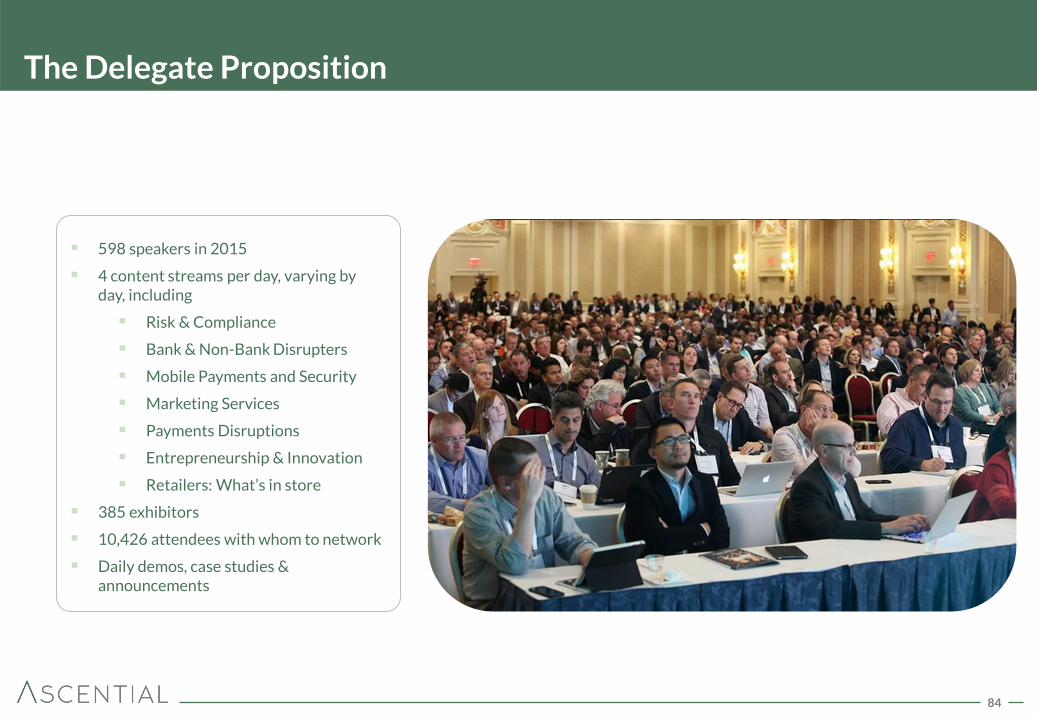
The Delegate Proposition
598 speakers in 2015
4 content streams per day, varying by day, including
Risk & Compliance
Bank & Non-Bank Disrupters
Mobile Payments and Security
Marketing Services
Payments Disruptions
Entrepreneurship & Innovation
Retailers: What’s in store
385 exhibitors
10,426 attendees with whom to network
Daily demos, case studies & announcements
85
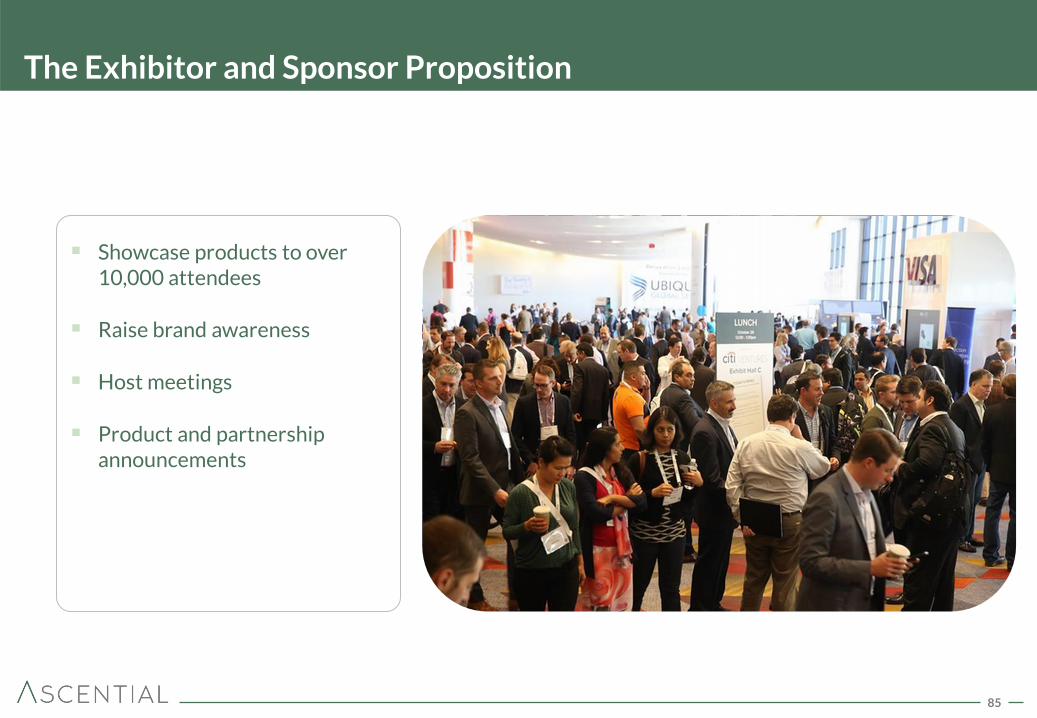
The Exhibitor and Sponsor Proposition
Showcase products to over 10,000 attendees
Raise brand awareness
Host meetings
Product and partnership announcements
86
Money20/20 Introduction Video
87
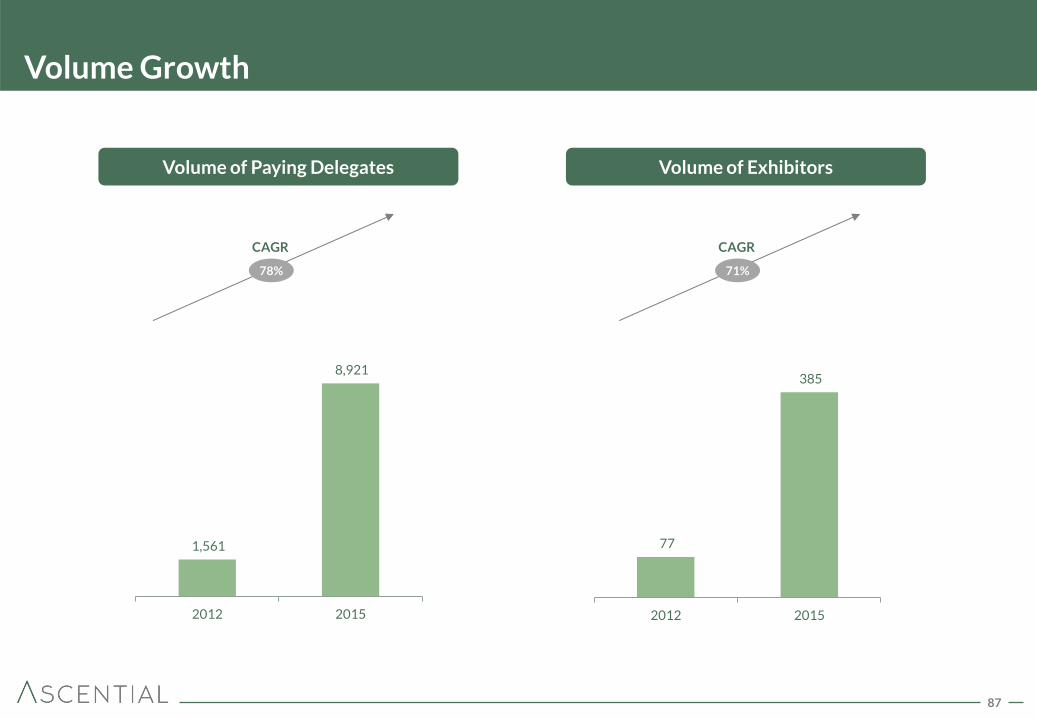
Volume Growth
Volume of Paying Delegates Volume of Exhibitors
78%
CAGR
71%
CAGR
1,561
8,921
2012 2015
77
385
2012 2015
88
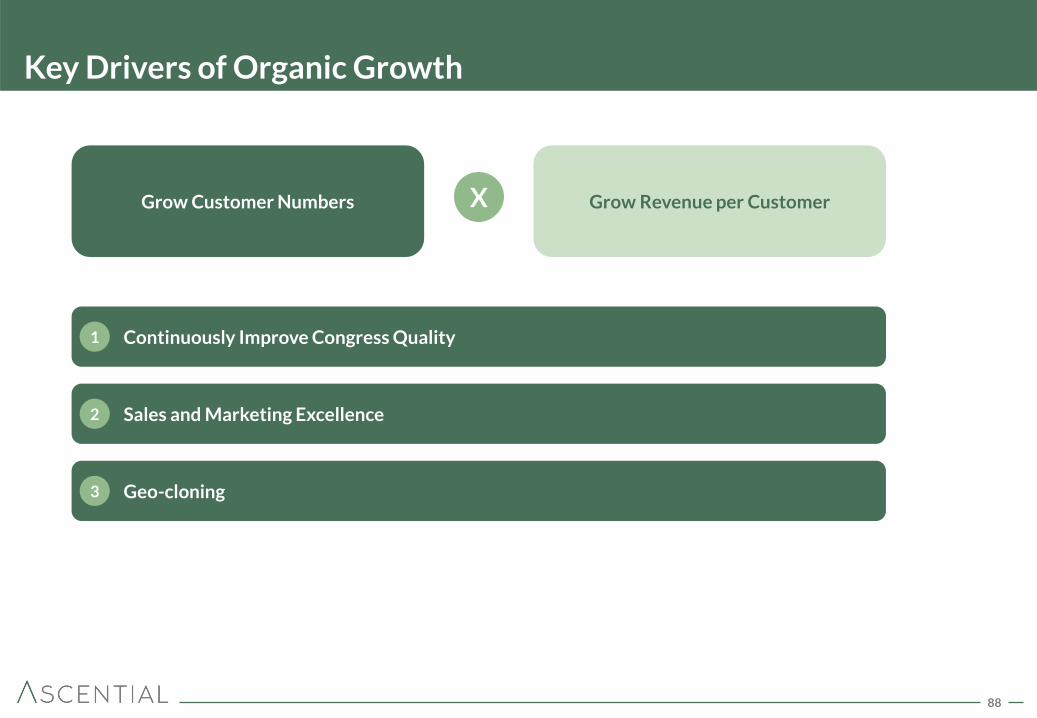
Key Drivers of Organic Growth
Grow Revenue per Customer Grow Customer Numbers X
Continuously Improve Congress Quality 1
Sales and Marketing Excellence 2
Geo-cloning 3
89
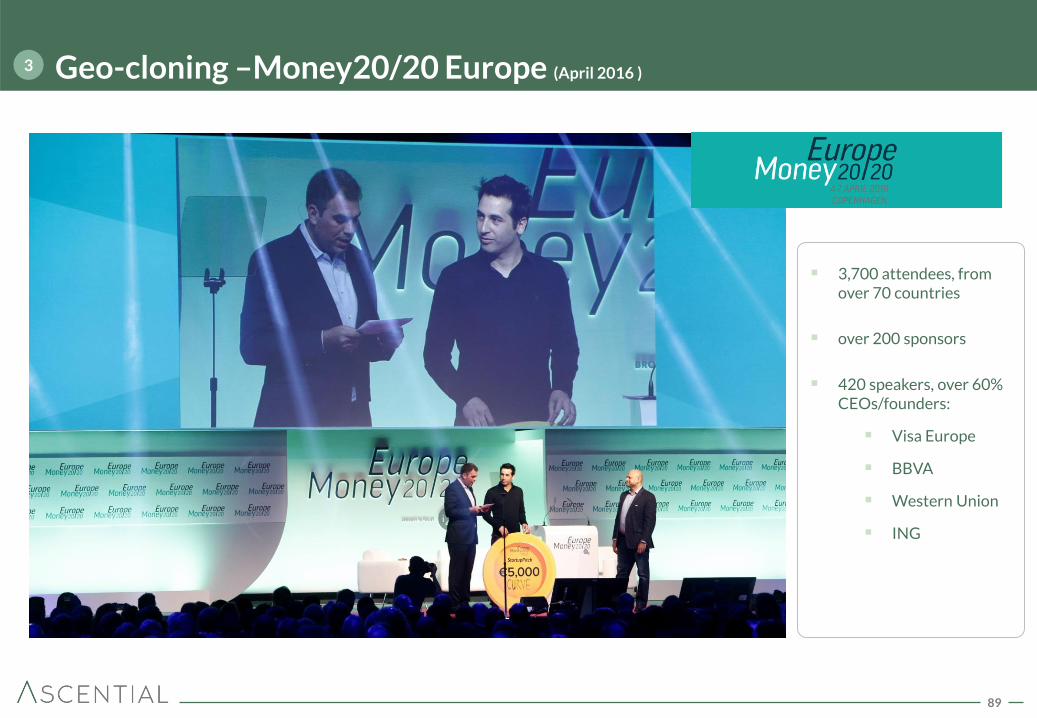
Geo-cloning –Money20/20 Europe (April 2016 ) 3
3,700 attendees, from over 70 countries
over 200 sponsors
420 speakers, over 60% CEOs/founders:
Visa Europe
BBVA
Western Union
ING

90
Summary
Largest Trade Exhibitions in UK
Market Leading Payments Congress
76% of Revenue Contracted
within Three Months1
Strong Growth Characteristics
Over 90% Exhibitor Value
Retention
Geo-clone Opportunities
Spring/ Autumn
Fair
Money 20/20
1 Refers to three months post Spring Fair 2015 show.
91
Group Financials Mandy Gradden
Insert Image
92
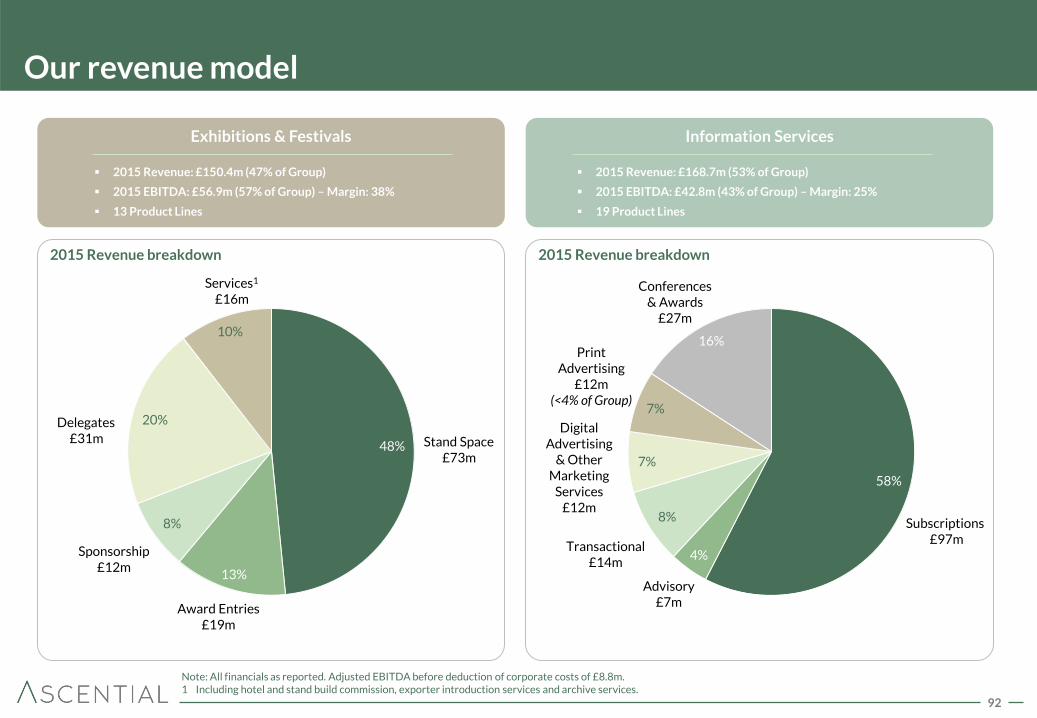
Our revenue model
Note: All financials as reported. Adjusted EBITDA before deduction of corporate costs of £8.8m. 1 Including hotel and stand build commission, exporter introduction services and archive services.
Award Entries £19m
Services1
£16m
Stand Space £73m
Delegates £31m
Subscriptions £97m
Advisory £7m
Conferences & Awards
£27m
Digital Advertising
& Other Marketing
Services £12m
Exhibitions & Festivals
Sponsorship £12m
2015 Revenue: £150.4m (47% of Group)
2015 EBITDA: £56.9m (57% of Group) – Margin: 38%
13 Product Lines
2015 Revenue breakdown 2015 Revenue breakdown
Information Services
2015 Revenue: £168.7m (53% of Group)
2015 EBITDA: £42.8m (43% of Group) – Margin: 25%
19 Product Lines
Transactional £14m
Print Advertising
£12m (<4% of Group)
48%
13%
8%
20%
10%
58%
4%
8%
7%
7%
16%
93
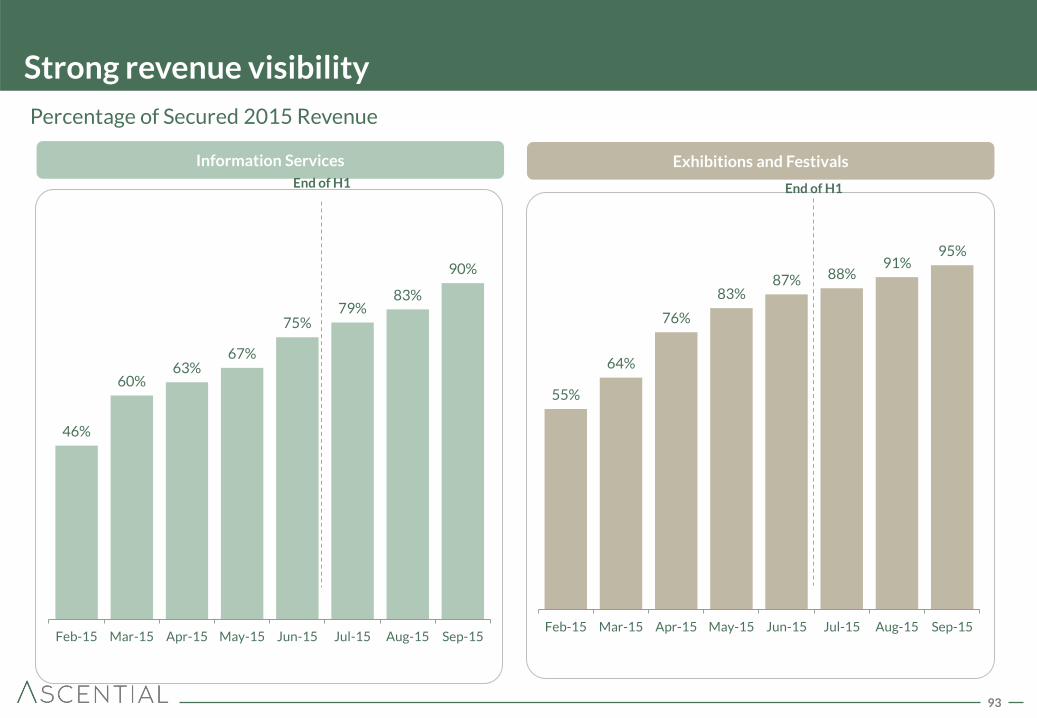
Strong revenue visibility
Percentage of Secured 2015 Revenue
95% 91%
88% 87% 83%
76%
64%
55%
Sep-15Aug-15Jul-15Jun-15May-15Apr-15Mar-15Feb-15
Exhibitions and Festivals
End of H1
90%
83% 79%
75%
67% 63%
60%
46%
Sep-15Aug-15Jul-15Jun-15May-15Apr-15Mar-15Feb-15
Information Services
End of H1
94
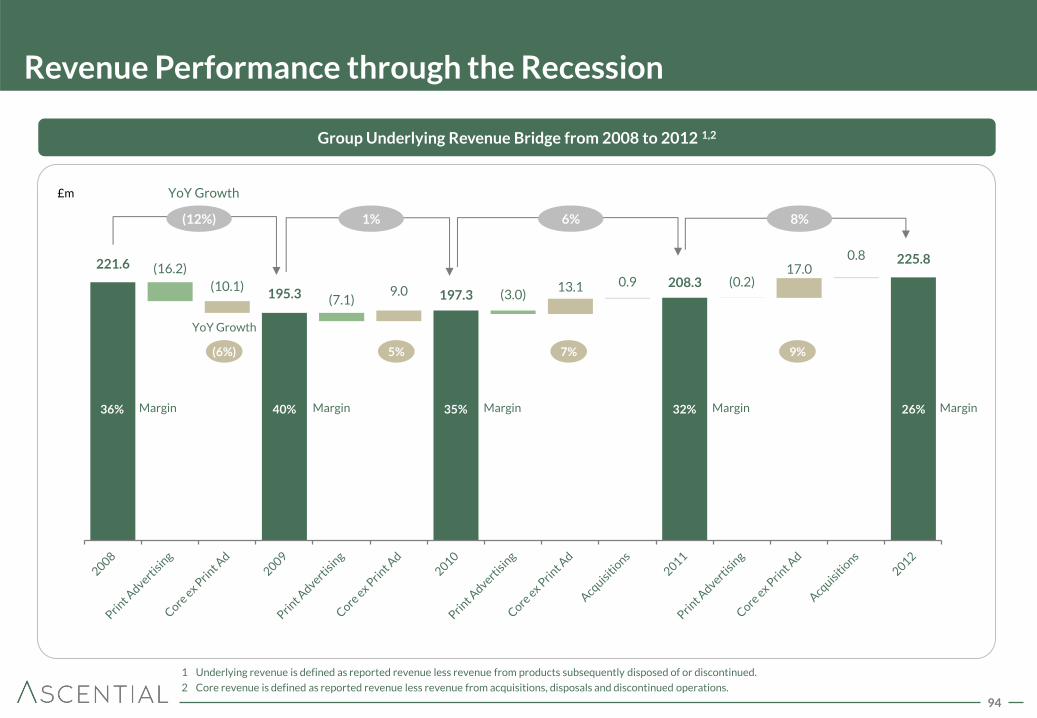
Revenue Performance through the Recession
221.6 (16.2)
(10.1) 195.3 (7.1)
9.0 197.3 (3.0) 13.1 0.9 208.3 (0.2)
17.0 0.8 225.8
9% 5% (6%) 7%
26% 35% 36% 32%
£m
Group Underlying Revenue Bridge from 2008 to 2012 1,2
Margin
YoY Growth
(12%) 1% 6% 8%
YoY Growth
Margin Margin Margin Margin 40%
1 Underlying revenue is defined as reported revenue less revenue from products subsequently disposed of or discontinued.
2 Core revenue is defined as reported revenue less revenue from acquisitions, disposals and discontinued operations.
95
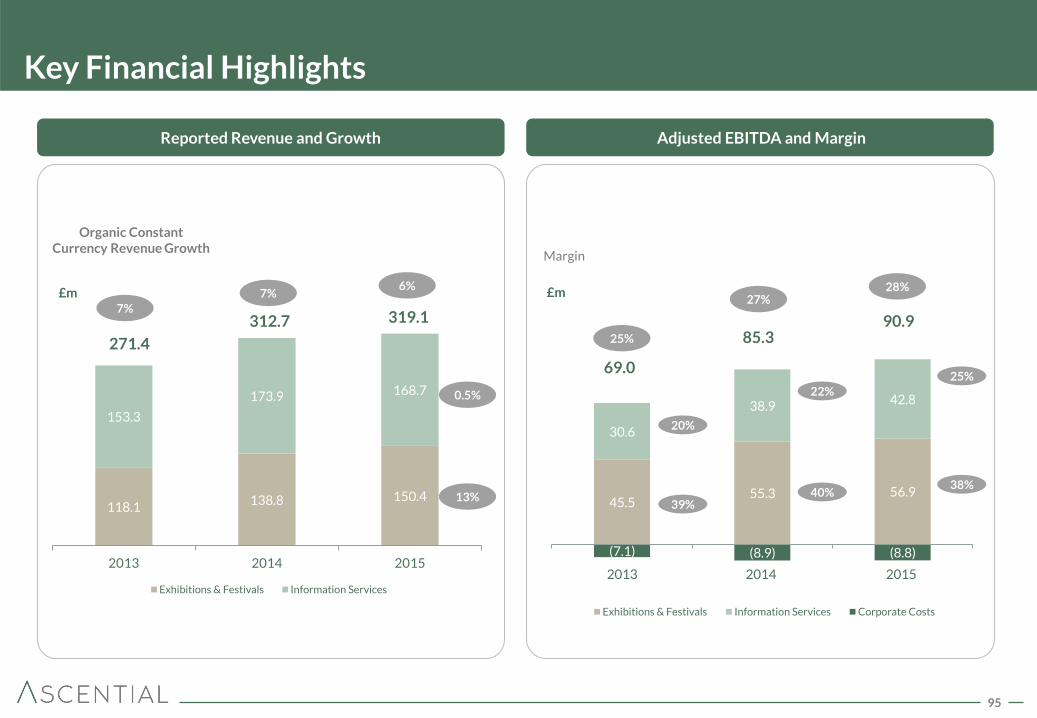
Key Financial Highlights
Reported Revenue and Growth Adjusted EBITDA and Margin
£m £m
Organic Constant Currency Revenue Growth
271.4
312.7 319.1
69.0
85.3 90.9
2013 2014 2015
Margin
7%
7% 6%
0.5%
13%
39% 40%
38%
20%
22%
25%
25%
27% 28%
118.1 138.8 150.4
153.3
173.9 168.7
2013 2014 2015
Exhibitions & Festivals Information Services
45.5 55.3 56.9
30.6
38.9 42.8
(7.1) (8.9) (8.8)
Exhibitions & Festivals Information Services Corporate Costs
96
72,112,89
145,186,139
124,124,124
205,228,200
145,166,159
199,191,162
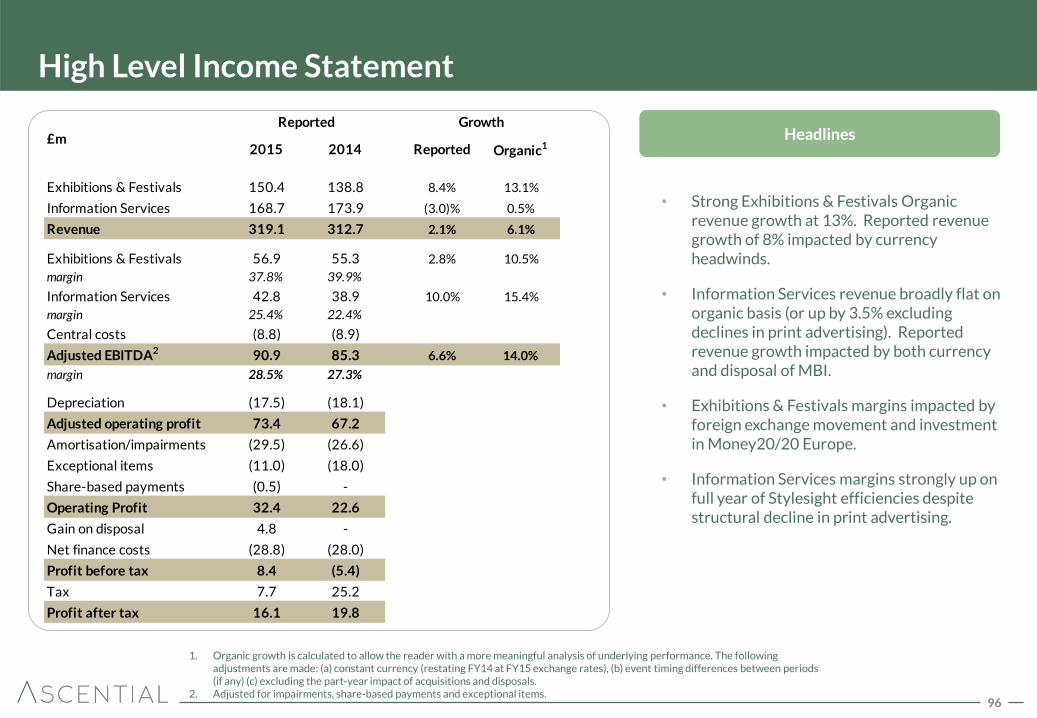
High Level Income Statement
• Strong Exhibitions & Festivals Organic revenue growth at 13%. Reported revenue growth of 8% impacted by currency headwinds.
• Information Services revenue broadly flat on organic basis (or up by 3.5% excluding declines in print advertising). Reported revenue growth impacted by both currency and disposal of MBI.
• Exhibitions & Festivals margins impacted by foreign exchange movement and investment in Money20/20 Europe.
• Information Services margins strongly up on full year of Stylesight efficiencies despite structural decline in print advertising.
Headlines
1. Organic growth is calculated to allow the reader with a more meaningful analysis of underlying performance. The following adjustments are made: (a) constant currency (restating FY14 at FY15 exchange rates), (b) event timing differences between periods (if any) (c) excluding the part-year impact of acquisitions and disposals.
2. Adjusted for impairments, share-based payments and exceptional items.
2015 2014 Reported Organic1
Exhibitions & Festivals 150.4 138.8 8.4% 13.1%
Information Services 168.7 173.9 (3.0)% 0.5%
Revenue 319.1 312.7 2.1% 6.1%
Exhibitions & Festivals 56.9 55.3 2.8% 10.5%
margin 37.8% 39.9%
Information Services 42.8 38.9 10.0% 15.4%
margin 25.4% 22.4%
Central costs (8.8) (8.9)
Adjusted EBITDA2 90.9 85.3 6.6% 14.0%
margin 28.5% 27.3%
Depreciation (17.5) (18.1)
Adjusted operating profit 73.4 67.2
Amortisation/impairments (29.5) (26.6)
Exceptional items (11.0) (18.0)
Share-based payments (0.5) -
Operating Profit 32.4 22.6
Gain on disposal 4.8 -
Net finance costs (28.8) (28.0)
Profit before tax 8.4 (5.4)
Tax 7.7 25.2
Profit after tax 16.1 19.8
Reported Growth£m
97
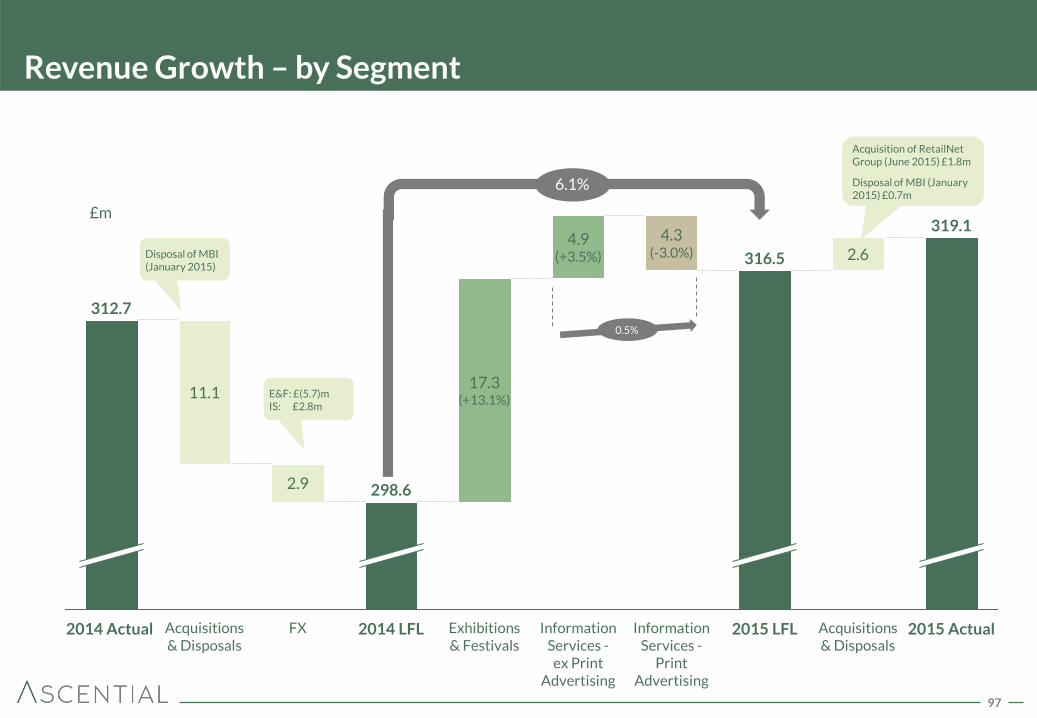
Revenue Growth – by Segment
298.6
FX
2.9
Acquisitions & Disposals
2014 LFL
11.1
2014 Actual Acquisitions & Disposals
2.6
2015 LFL
316.5
Information Services -
Print Advertising
4.3 (-3.0%)
2015 Actual
319.1
Information Services -
ex Print Advertising
4.9 (+3.5%)
Exhibitions & Festivals
17.3 (+13.1%)
312.7
£m
6.1%
Disposal of MBI (January 2015)
Acquisition of RetailNet Group (June 2015) £1.8m
Disposal of MBI (January 2015) £0.7m
0.5%
E&F: £(5.7)m IS: £2.8m
98
72,112,89
145,186,139
124,124,124
205,228,200
145,166,159
199,191,162
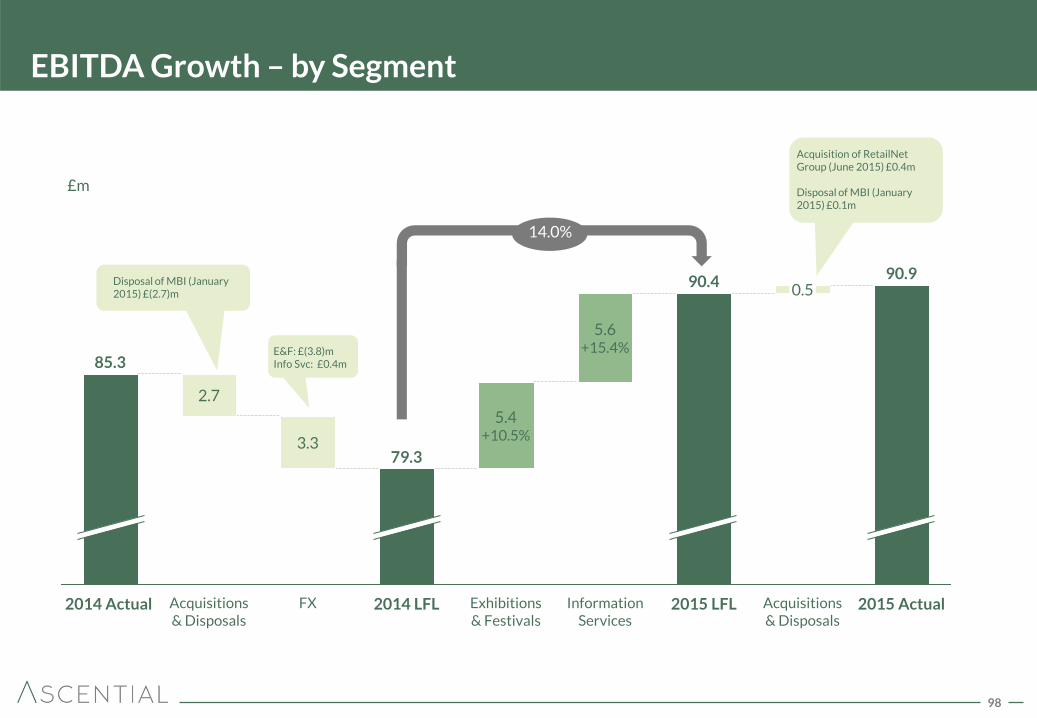
EBITDA Growth – by Segment
FX
3.3
Exhibitions & Festivals
90.4
Information Services
5.4 +10.5%
Acquisitions & Disposals
2.7
Acquisitions & Disposals
2015 LFL 2014 Actual
85.3
2014 LFL 2015 Actual
90.9
5.6 +15.4%
0.5
79.3
£m
14.0%
Disposal of MBI (January 2015) £(2.7)m
Acquisition of RetailNet Group (June 2015) £0.4m Disposal of MBI (January 2015) £0.1m
E&F: £(3.8)m Info Svc: £0.4m
99
72,112,89
145,186,139
124,124,124
205,228,200
145,166,159
199,191,162
Margin Development
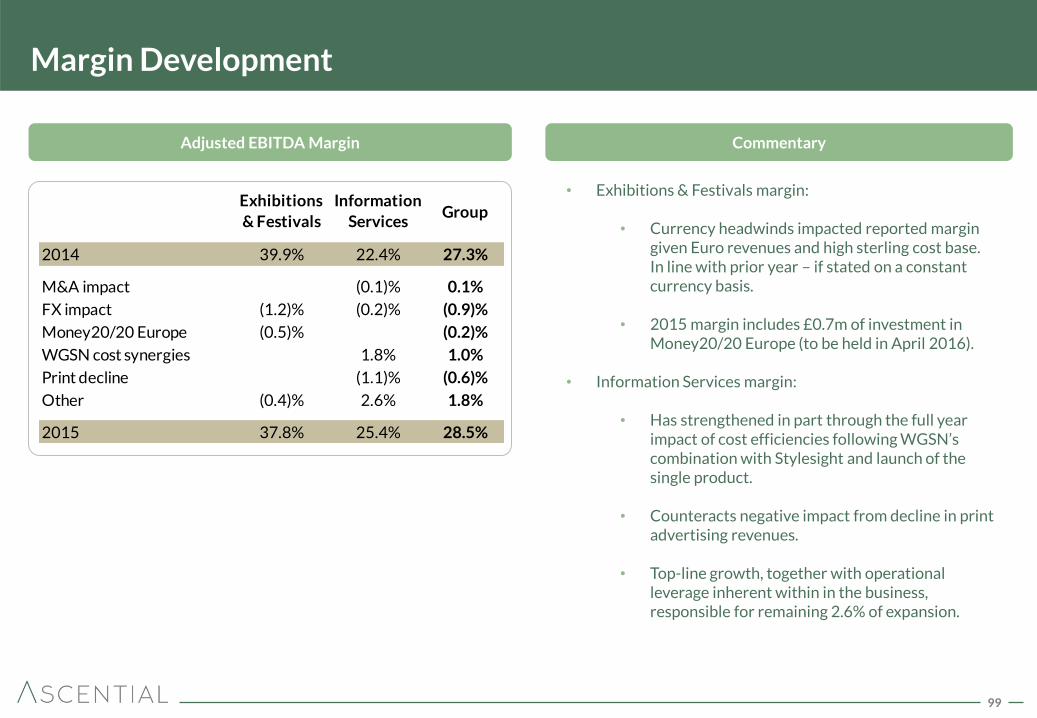
Adjusted EBITDA Margin Commentary
• Exhibitions & Festivals margin:
• Currency headwinds impacted reported margin given Euro revenues and high sterling cost base. In line with prior year – if stated on a constant currency basis.
• 2015 margin includes £0.7m of investment in
Money20/20 Europe (to be held in April 2016).
• Information Services margin:
• Has strengthened in part through the full year impact of cost efficiencies following WGSN’s combination with Stylesight and launch of the single product.
• Counteracts negative impact from decline in print
advertising revenues.
• Top-line growth, together with operational leverage inherent within in the business, responsible for remaining 2.6% of expansion.
Exhibitions
& Festivals
Information
ServicesGroup
2014 39.9% 22.4% 27.3%
M&A impact (0.1)% 0.1%
FX impact (1.2)% (0.2)% (0.9)%
Money20/20 Europe (0.5)% (0.2)%
WGSN cost synergies 1.8% 1.0%
Print decline (1.1)% (0.6)%
Other (0.4)% 2.6% 1.8%
2015 37.8% 25.4% 28.5%
100
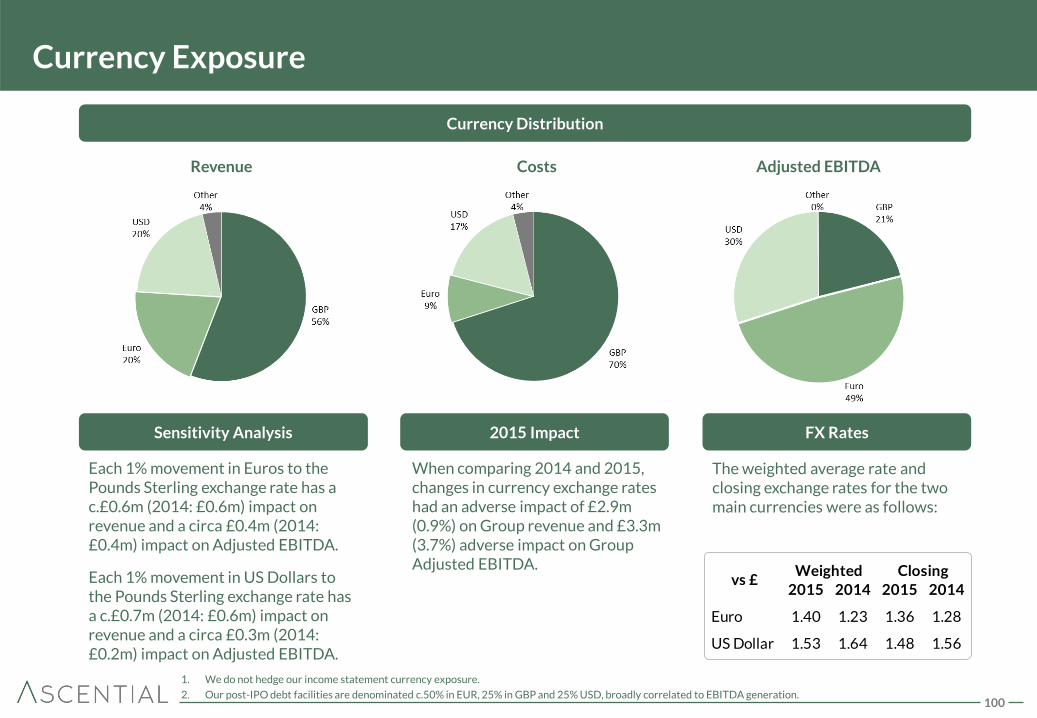
Currency Exposure
Currency Distribution
1. We do not hedge our income statement currency exposure.
2. Our post-IPO debt facilities are denominated c.50% in EUR, 25% in GBP and 25% USD, broadly correlated to EBITDA generation.
Each 1% movement in Euros to the Pounds Sterling exchange rate has a c.£0.6m (2014: £0.6m) impact on revenue and a circa £0.4m (2014: £0.4m) impact on Adjusted EBITDA.
Each 1% movement in US Dollars to the Pounds Sterling exchange rate has a c.£0.7m (2014: £0.6m) impact on revenue and a circa £0.3m (2014: £0.2m) impact on Adjusted EBITDA.
Revenue Costs Adjusted EBITDA
The weighted average rate and closing exchange rates for the two main currencies were as follows:
Sensitivity Analysis 2015 Impact FX Rates
When comparing 2014 and 2015, changes in currency exchange rates had an adverse impact of £2.9m (0.9%) on Group revenue and £3.3m (3.7%) adverse impact on Group Adjusted EBITDA.
2015 2014 2015 2014
Euro 1.40 1.23 1.36 1.28
US Dollar 1.53 1.64 1.48 1.56
Weighted Closingvs £

101
72,112,89
145,186,139
124,124,124
205,228,200
145,166,159
199,191,162
Strong Cash Conversion
Commentary
• Group operating cash flow driven by strong operational performance and return to a small working capital inflow.
• Free cash flow conversion up +8% ppts to 88%.
• Capex broadly flat reflecting the well-invested nature of the
business.
• Cash tax was modest as a result of the utilisation of historic tax losses in the UK and US.
• M&A includes:
- Acquisition of RetailNet Group for consideration net of cash acquired of £5.1m (of which a net £2.5m was paid in the year and £2.6m is deferred until 2018).
- Deferred consideration relating to Money20/20 and
Educar of £17.1m.
- Sale of MBI for £11.0m (£10.6m net of costs and cash disposed).
• Interest paid includes £13.2m relating to arrangement fees for the April 2015 refinancing.
Cash Flow
1. Negative working capital impact of deferred revenue release as a result of the acquisition of Money20/20 prior to 2014 event.
1
£m 2015 2014
Adjusted EBITDA 90.9 85.3
Working capital movements 1.1 (4.5)
Operating cash flow 92.0 80.8
Capex (10.9) (11.3)
Tax (1.2) (1.2)
Free cashflow 79.9 68.3
% Free cashflow conversion 88% 80%
Exceptional cash (11.9) (14.8)
M&A consideration/ proceeds (9.1) (25.3)
Cashflow before financing activities 58.9 28.2
Interest (37.9) (26.6)
Debt repayments/(drawdown) 1.4 (11.2)
Net cash flow 22.4 (9.6)
102
72,112,89
145,186,139
124,124,124
205,228,200
145,166,159
199,191,162
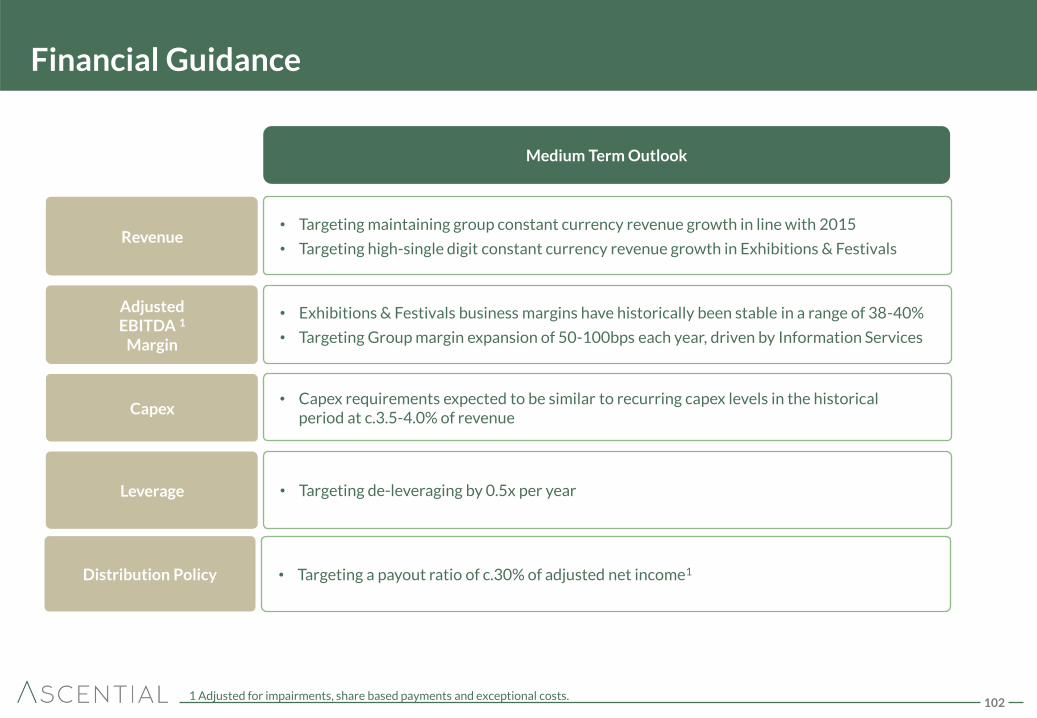
Financial Guidance
Revenue • Targeting maintaining group constant currency revenue growth in line with 2015
• Targeting high-single digit constant currency revenue growth in Exhibitions & Festivals
Adjusted EBITDA 1
Margin
• Exhibitions & Festivals business margins have historically been stable in a range of 38-40%
• Targeting Group margin expansion of 50-100bps each year, driven by Information Services
Capex • Capex requirements expected to be similar to recurring capex levels in the historical
period at c.3.5-4.0% of revenue
Distribution Policy • Targeting a payout ratio of c.30% of adjusted net income1
Leverage
Medium Term Outlook
• Targeting de-leveraging by 0.5x per year
1 Adjusted for impairments, share based payments and exceptional costs.
Revenue
Adjusted EBITDA 1
Margin
Capex
Leverage
103
72,112,89
145,186,139
124,124,124
205,228,200
145,166,159
199,191,162
Current Trading and Outlook
• A positive start to 2016 in line with our expectations.
• Our major product developments are on track. Key H1 milestones:-
• Rollout starts of WGSN single platform and INstock v3 during April
• Money 20/20 Europe in April
• No change to guidance from IPO
“While still early in 2016, we are encouraged by the current level of forward bookings and are confident of another good year of growth for the Group.”
104
Appendix
105
72,112,89
145,186,139
124,124,124
205,228,200
145,166,159
199,191,162
Adjusted
ResultsAdjustments
Statutory
Results
Adjusted
resultsAdjustments
Statutory
results
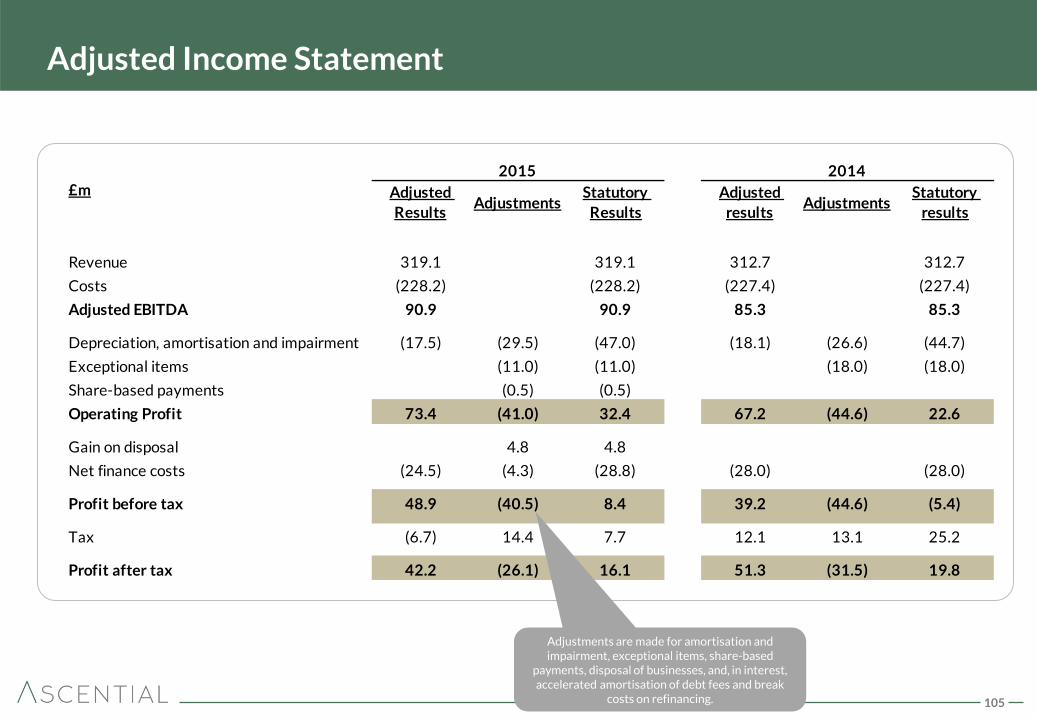
Revenue 319.1 319.1 312.7 312.7
Costs (228.2) (228.2) (227.4) (227.4)
Adjusted EBITDA 90.9 90.9 85.3 85.3
Depreciation, amortisation and impairment (17.5) (29.5) (47.0) (18.1) (26.6) (44.7)
Exceptional items (11.0) (11.0) (18.0) (18.0)
Share-based payments (0.5) (0.5)
Operating Profit 73.4 (41.0) 32.4 67.2 (44.6) 22.6
Gain on disposal 4.8 4.8
Net finance costs (24.5) (4.3) (28.8) (28.0) (28.0)
Profit before tax 48.9 (40.5) 8.4 39.2 (44.6) (5.4)
Tax (6.7) 14.4 7.7 12.1 13.1 25.2
Profit after tax 42.2 (26.1) 16.1 51.3 (31.5) 19.8
2015 2014£m
Adjusted Income Statement
Adjustments are made for amortisation and impairment, exceptional items, share-based
payments, disposal of businesses, and, in interest, accelerated amortisation of debt fees and break
costs on refinancing.
106
72,112,89
145,186,139
124,124,124
205,228,200
145,166,159
199,191,162
Exceptional Items
Exceptional Items
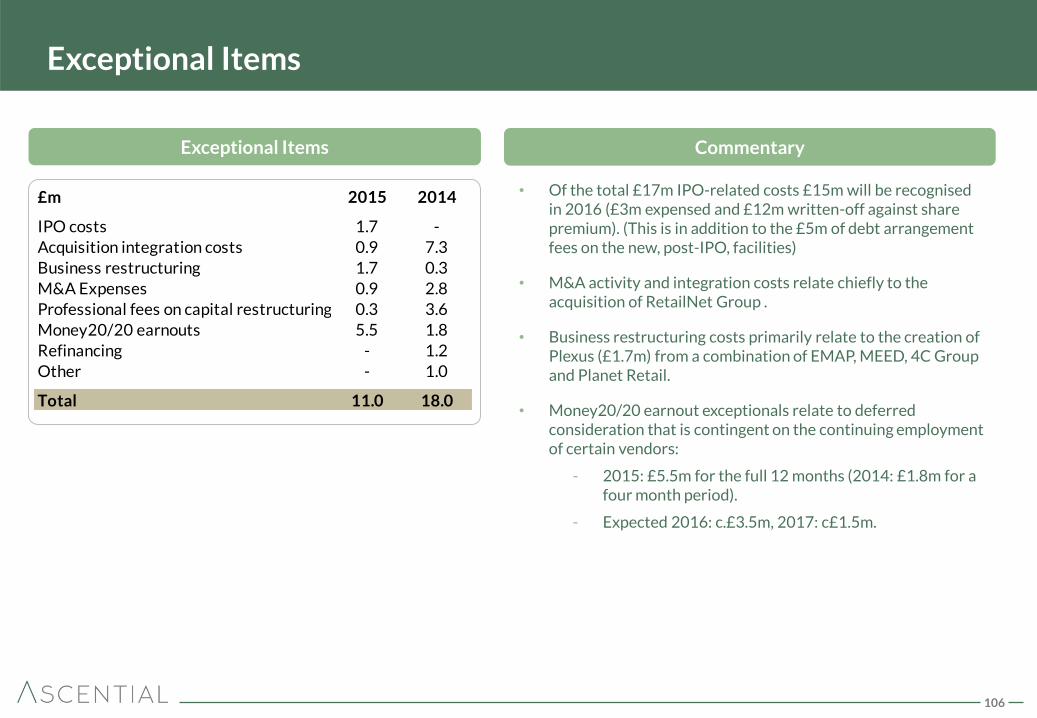
• Of the total £17m IPO-related costs £15m will be recognised in 2016 (£3m expensed and £12m written-off against share premium). (This is in addition to the £5m of debt arrangement fees on the new, post-IPO, facilities)
• M&A activity and integration costs relate chiefly to the acquisition of RetailNet Group .
• Business restructuring costs primarily relate to the creation of Plexus (£1.7m) from a combination of EMAP, MEED, 4C Group and Planet Retail.
• Money20/20 earnout exceptionals relate to deferred consideration that is contingent on the continuing employment of certain vendors:
- 2015: £5.5m for the full 12 months (2014: £1.8m for a four month period).
- Expected 2016: c.£3.5m, 2017: c£1.5m.
Commentary
£m 2015 2014
IPO costs 1.7 -
Acquisition integration costs 0.9 7.3
Business restructuring 1.7 0.3
M&A Expenses 0.9 2.8
Professional fees on capital restructuring 0.3 3.6
Money20/20 earnouts 5.5 1.8
Refinancing - 1.2
Other - 1.0
Total 11.0 18.0
107
72,112,89
145,186,139
124,124,124
205,228,200
145,166,159
199,191,162
Taxation
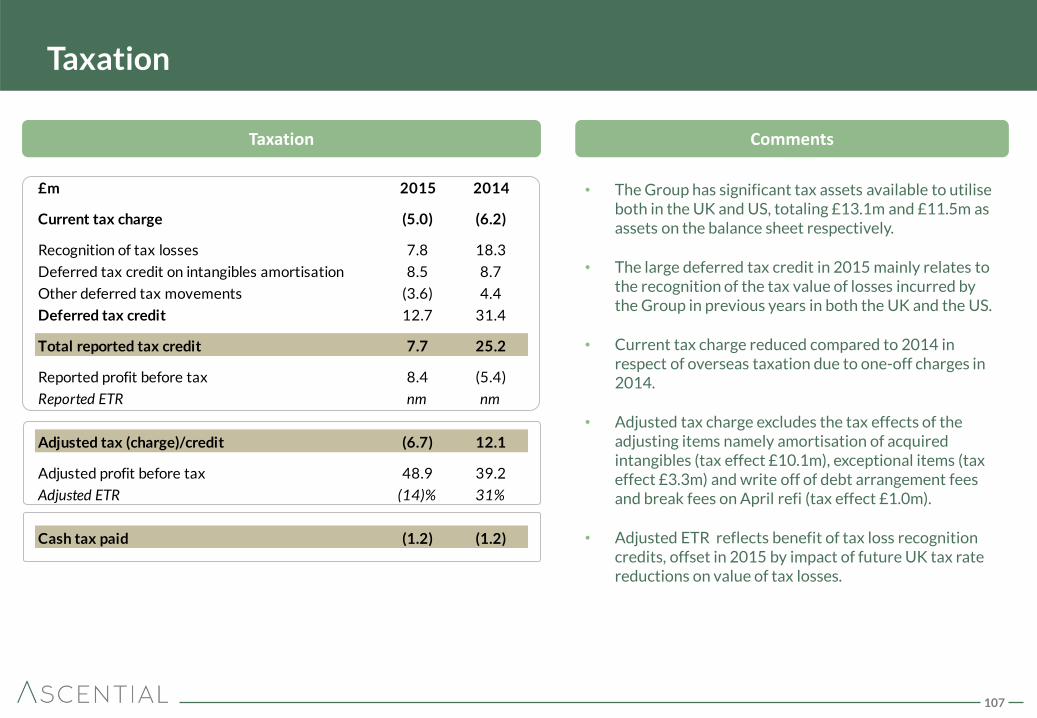
• The Group has significant tax assets available to utilise both in the UK and US, totaling £13.1m and £11.5m as assets on the balance sheet respectively.
• The large deferred tax credit in 2015 mainly relates to the recognition of the tax value of losses incurred by the Group in previous years in both the UK and the US.
• Current tax charge reduced compared to 2014 in respect of overseas taxation due to one-off charges in 2014.
• Adjusted tax charge excludes the tax effects of the adjusting items namely amortisation of acquired intangibles (tax effect £10.1m), exceptional items (tax effect £3.3m) and write off of debt arrangement fees and break fees on April refi (tax effect £1.0m).
• Adjusted ETR reflects benefit of tax loss recognition credits, offset in 2015 by impact of future UK tax rate reductions on value of tax losses.
Taxation Comments
£m 2015 2014
Current tax charge (5.0) (6.2)
Recognition of tax losses 7.8 18.3
Deferred tax credit on intangibles amortisation 8.5 8.7
Other deferred tax movements (3.6) 4.4
Deferred tax credit 12.7 31.4
Total reported tax credit 7.7 25.2
Reported profit before tax 8.4 (5.4)
Reported ETR nm nm
Adjusted tax (charge)/credit (6.7) 12.1
Adjusted profit before tax 48.9 39.2
Adjusted ETR (14)% 31%
Cash tax paid (1.2) (1.2)
108
72,112,89
145,186,139
124,124,124
205,228,200
145,166,159
199,191,162
Net Finance Costs
Net Finance Costs
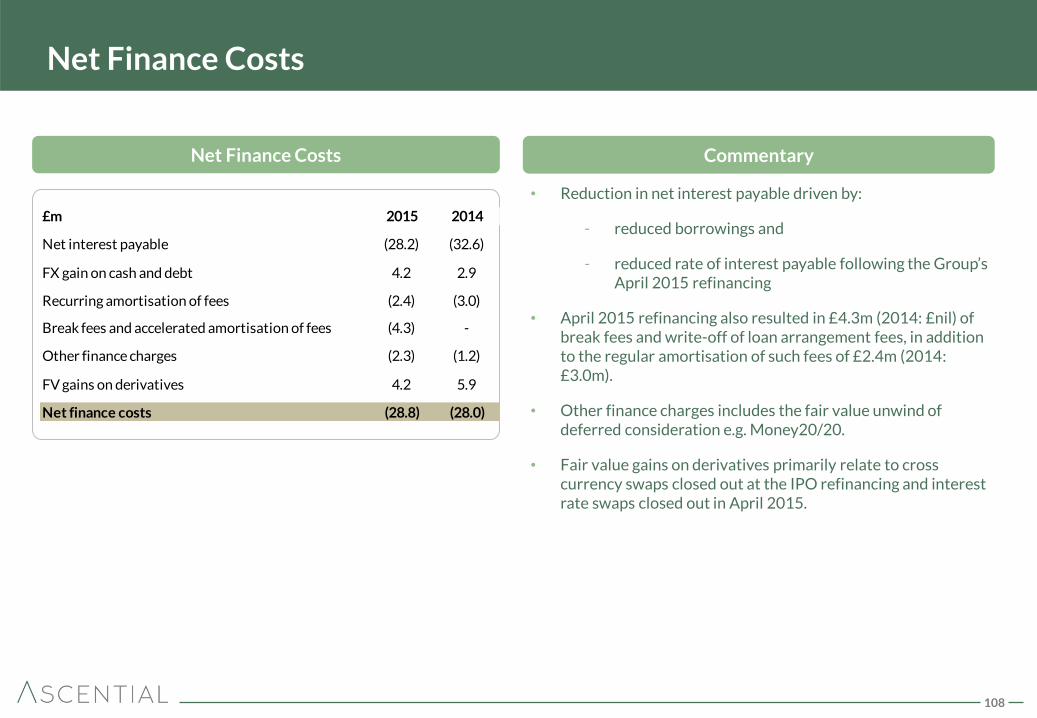
• Reduction in net interest payable driven by:
- reduced borrowings and
- reduced rate of interest payable following the Group’s April 2015 refinancing
• April 2015 refinancing also resulted in £4.3m (2014: £nil) of break fees and write-off of loan arrangement fees, in addition to the regular amortisation of such fees of £2.4m (2014: £3.0m).
• Other finance charges includes the fair value unwind of deferred consideration e.g. Money20/20.
• Fair value gains on derivatives primarily relate to cross currency swaps closed out at the IPO refinancing and interest rate swaps closed out in April 2015.
Commentary
£m 2015 2014
Net interest payable (28.2) (32.6)
FX gain on cash and debt 4.2 2.9
Recurring amortisation of fees (2.4) (3.0)
Break fees and accelerated amortisation of fees (4.3) -
Other finance charges (2.3) (1.2)
FV gains on derivatives 4.2 5.9
Net finance costs (28.8) (28.0)
109
72,112,89
145,186,139
124,124,124
205,228,200
145,166,159
199,191,162
Cash Flow
£m 2015 2014
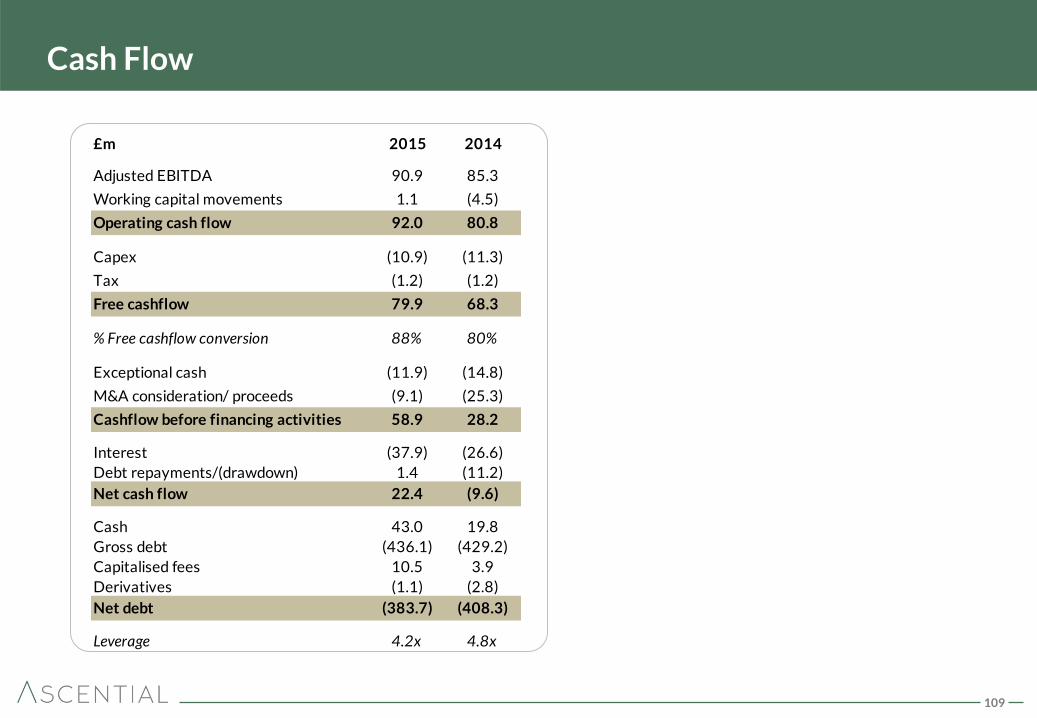
Adjusted EBITDA 90.9 85.3
Working capital movements 1.1 (4.5)
Operating cash flow 92.0 80.8
Capex (10.9) (11.3)
Tax (1.2) (1.2)
Free cashflow 79.9 68.3
% Free cashflow conversion 88% 80%
Exceptional cash (11.9) (14.8)
M&A consideration/ proceeds (9.1) (25.3)
Cashflow before financing activities 58.9 28.2
Interest (37.9) (26.6)
Debt repayments/(drawdown) 1.4 (11.2)
Net cash flow 22.4 (9.6)
Cash 43.0 19.8
Gross debt (436.1) (429.2)
Capitalised fees 10.5 3.9
Derivatives (1.1) (2.8)
Net debt (383.7) (408.3)
Leverage 4.2x 4.8x
110
72,112,89
145,186,139
124,124,124
205,228,200
145,166,159
199,191,162
Net Debt Bridge – 2015 (Covenant Basis including derivatives)
£m
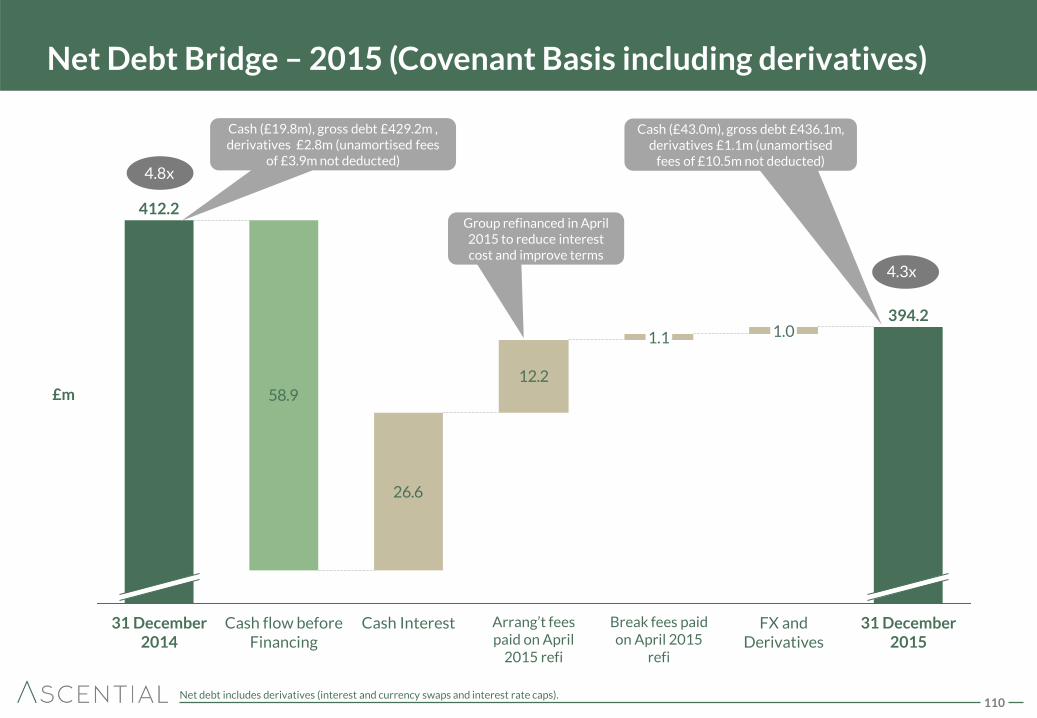
4.8x
4.3x
12.2
26.6
58.9
1.1
FX and Derivatives
31 December 2015
1.0
Break fees paid on April 2015
refi
Arrang’t fees paid on April
2015 refi
31 December 2014
412.2
Cash Interest Cash flow before Financing
394.2
Group refinanced in April 2015 to reduce interest cost and improve terms
Net debt includes derivatives (interest and currency swaps and interest rate caps).
Cash (£19.8m), gross debt £429.2m , derivatives £2.8m (unamortised fees
of £3.9m not deducted)
Cash (£43.0m), gross debt £436.1m, derivatives £1.1m (unamortised
fees of £10.5m not deducted)
111
72,112,89
145,186,139
124,124,124
205,228,200
145,166,159
199,191,162
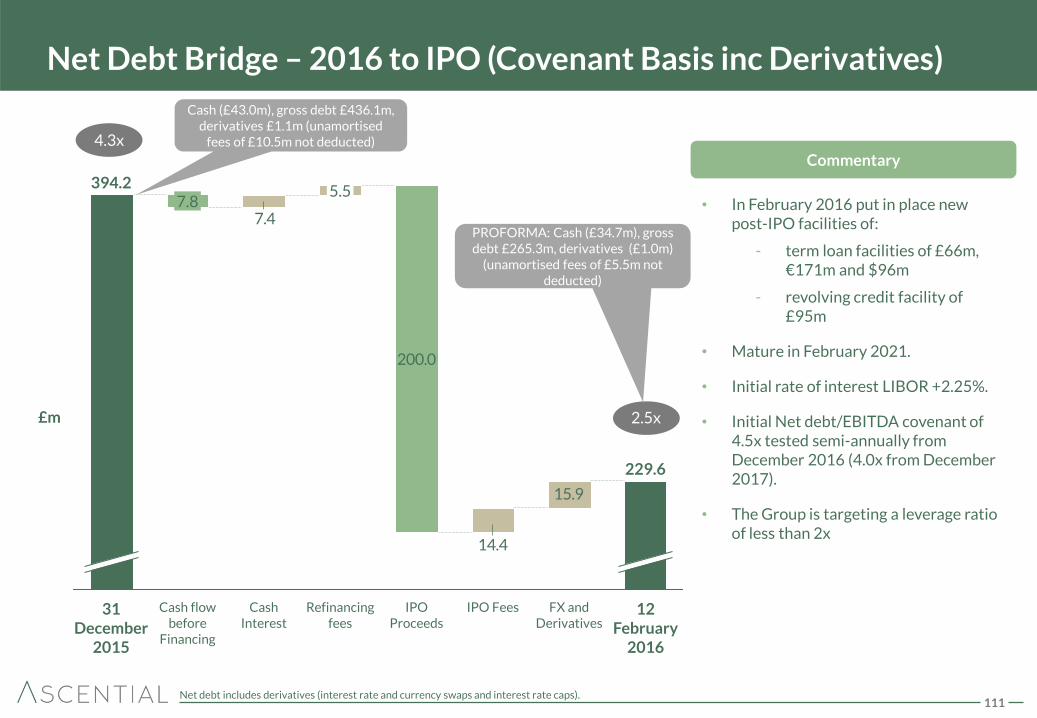
Net Debt Bridge – 2016 to IPO (Covenant Basis inc Derivatives)
200.0
14.4
7.4
15.9
229.6
12 February
2016
FX and Derivatives
IPO Proceeds
Cash Interest
7.8
Cash flow before
Financing
Refinancing fees
IPO Fees 31 December
2015
5.5 394.2
£m 2.5x
4.3x Commentary
• In February 2016 put in place new post-IPO facilities of:
- term loan facilities of £66m, €171m and $96m
- revolving credit facility of £95m
• Mature in February 2021.
• Initial rate of interest LIBOR +2.25%.
• Initial Net debt/EBITDA covenant of 4.5x tested semi-annually from December 2016 (4.0x from December 2017).
• The Group is targeting a leverage ratio of less than 2x
Net debt includes derivatives (interest rate and currency swaps and interest rate caps).
PROFORMA: Cash (£34.7m), gross debt £265.3m, derivatives (£1.0m)
(unamortised fees of £5.5m not deducted)
Cash (£43.0m), gross debt £436.1m, derivatives £1.1m (unamortised
fees of £10.5m not deducted)

112
72,112,89
145,186,139
124,124,124
205,228,200
145,166,159
199,191,162
Capital Expenditure
Capital Expenditure
• Product Development in 2015 includes digital products such as Retail Week Prospect and WGSN’s INstock V3.
• Property includes the fit out of WGSN’s new New York office.
• Business Applications includes elements of the Cannes Lions’ IT systems upgrade.
• On-going recurring capex is expected to remain at c.3.5% of sales for the foreseeable future.
• Depreciation will trend towards capex from 2016 onwards as the depreciation impact of the £25m invested in Transform in 2012/13 unwinds.
Commentary
£m 2015 2014
Product development 3.3 3.8
Property 1.3 0.5
Information technology 1.1 2.1
Business applications 4.5 4.5
Capex 10.2 10.9% age of Revenue 3.2% 3.5%
Timing of cash payments 0.7 0.4
Cash Capex 10.9 11.3
Depreciation 17.5 18.1
113
72,112,89
145,186,139
124,124,124
205,228,200
145,166,159
199,191,162
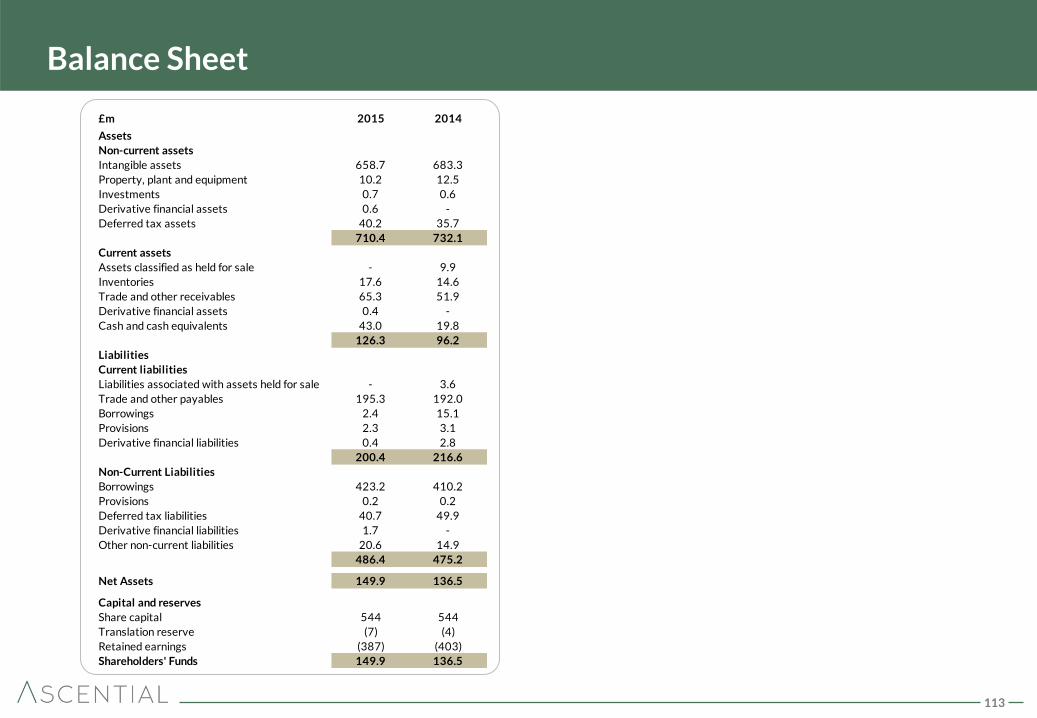
Balance Sheet
£m 2015 2014
Assets
Non-current assets
Intangible assets 658.7 683.3
Property, plant and equipment 10.2 12.5
Investments 0.7 0.6
Derivative financial assets 0.6 -
Deferred tax assets 40.2 35.7
710.4 732.1
Current assets
Assets classified as held for sale - 9.9
Inventories 17.6 14.6
Trade and other receivables 65.3 51.9
Derivative financial assets 0.4 -
Cash and cash equivalents 43.0 19.8
126.3 96.2
Liabilities
Current liabilities
Liabilities associated with assets held for sale - 3.6
Trade and other payables 195.3 192.0
Borrowings 2.4 15.1
Provisions 2.3 3.1
Derivative financial liabilities 0.4 2.8
200.4 216.6
Non-Current Liabilities
Borrowings 423.2 410.2
Provisions 0.2 0.2
Deferred tax liabilities 40.7 49.9
Derivative financial liabilities 1.7 -
Other non-current liabilities 20.6 14.9
486.4 475.2
Net Assets 149.9 136.5
Capital and reserves
Share capital 544 544
Translation reserve (7) (4)
Retained earnings (387) (403)
Shareholders' Funds 149.9 136.5
114
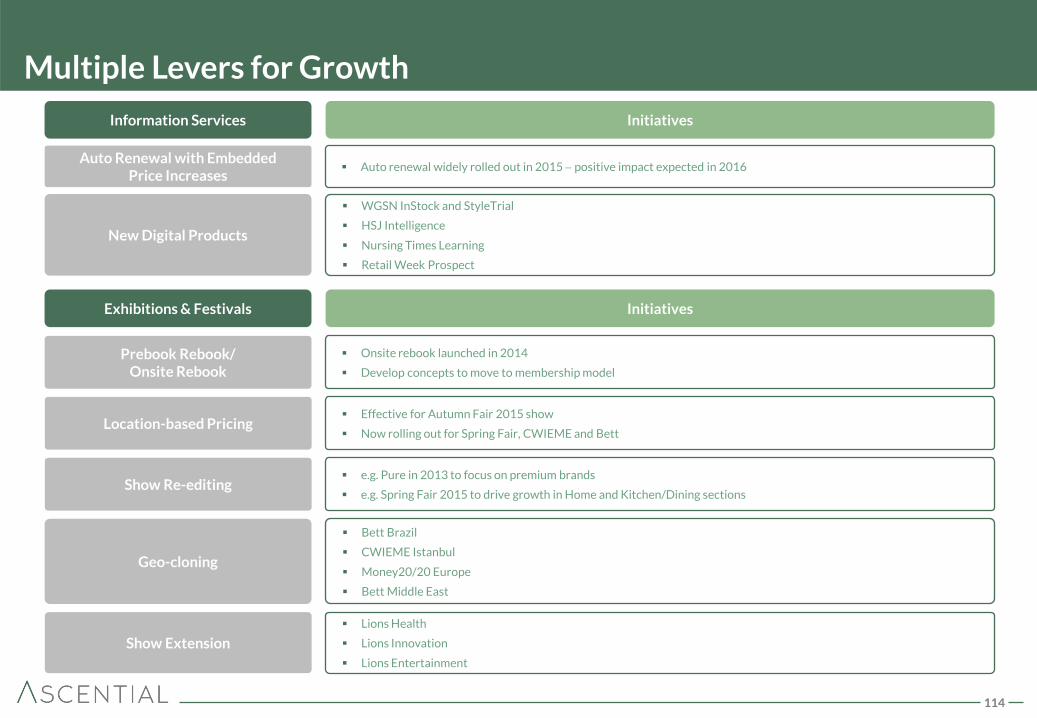
Multiple Levers for Growth
New Digital Products
Prebook Rebook/ Onsite Rebook
Onsite rebook launched in 2014
Develop concepts to move to membership model
Location-based Pricing Effective for Autumn Fair 2015 show
Now rolling out for Spring Fair, CWIEME and Bett
Show Re-editing e.g. Pure in 2013 to focus on premium brands
e.g. Spring Fair 2015 to drive growth in Home and Kitchen/Dining sections
Geo-cloning
Bett Brazil
CWIEME Istanbul
Money20/20 Europe
Bett Middle East
Show Extension
Lions Health
Lions Innovation
Lions Entertainment
Exhibitions & Festivals Initiatives
Initiatives Information Services
Auto Renewal with Embedded Price Increases
Auto renewal widely rolled out in 2015 positive impact expected in 2016
WGSN InStock and StyleTrial
HSJ Intelligence
Nursing Times Learning
Retail Week Prospect
115
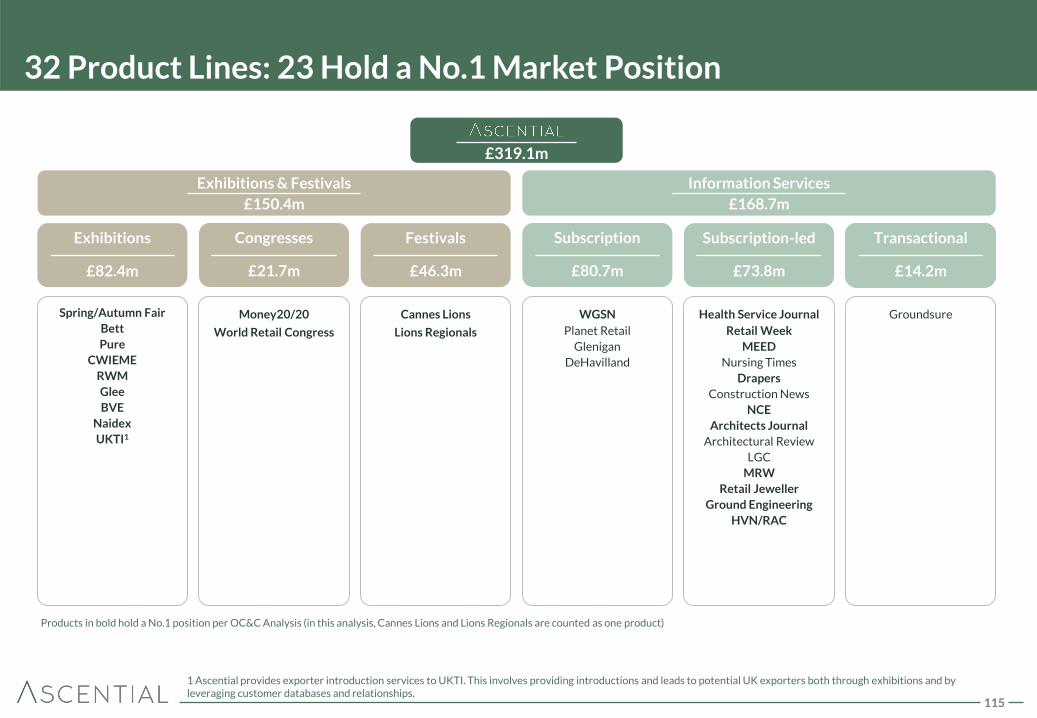
Transactional
£13m
Subscription
£80.7m
Transactional
£14.2m
Subscription-led
£73.8m
Exhibitions
£82.4m
Congresses
£21.7m
Festivals
£46.3m
32 Product Lines: 23 Hold a No.1 Market Position
1 Ascential provides exporter introduction services to UKTI. This involves providing introductions and leads to potential UK exporters both through exhibitions and by leveraging customer databases and relationships.
£319.1m
Information Services
£168.7m
Exhibitions & Festivals
£150.4m
Health Service Journal
Retail Week
MEED
Nursing Times
Drapers
Construction News
NCE
Architects Journal
Architectural Review
LGC
MRW
Retail Jeweller
Ground Engineering
HVN/RAC
Groundsure WGSN
Planet Retail
Glenigan
DeHavilland
Cannes Lions
Lions Regionals
Money20/20
World Retail Congress
Spring/Autumn Fair
Bett
Pure
CWIEME
RWM
Glee
BVE
Naidex
UKTI1
Products in bold hold a No.1 position per OC&C Analysis (in this analysis, Cannes Lions and Lions Regionals are counted as one product)