analyst visit to vitafoods - informa - connection. … relations/general meeting... · analyst...
TRANSCRIPT

1
Analyst visit to Vitafoods
Peter Rigby
Chief Executive [email protected]
Adam Walker
Finance Director [email protected]
May 16th 2013
Richard Menzies-Gow
Investor Relations [email protected]

2
• 10.30-11.30: Informa Events presentation – Adam Walker
• 11.30-12.00: Vitafoods presentation – Peter Hall
• 12.00-13.00: Vitafoods tour – Chris Lee
• 13.00-14.00: Wrap up and lunch
• 14.00: Finish
Timetable for the visit

3
Informa Events Adam Walker
Finance Director
Informa plc
4
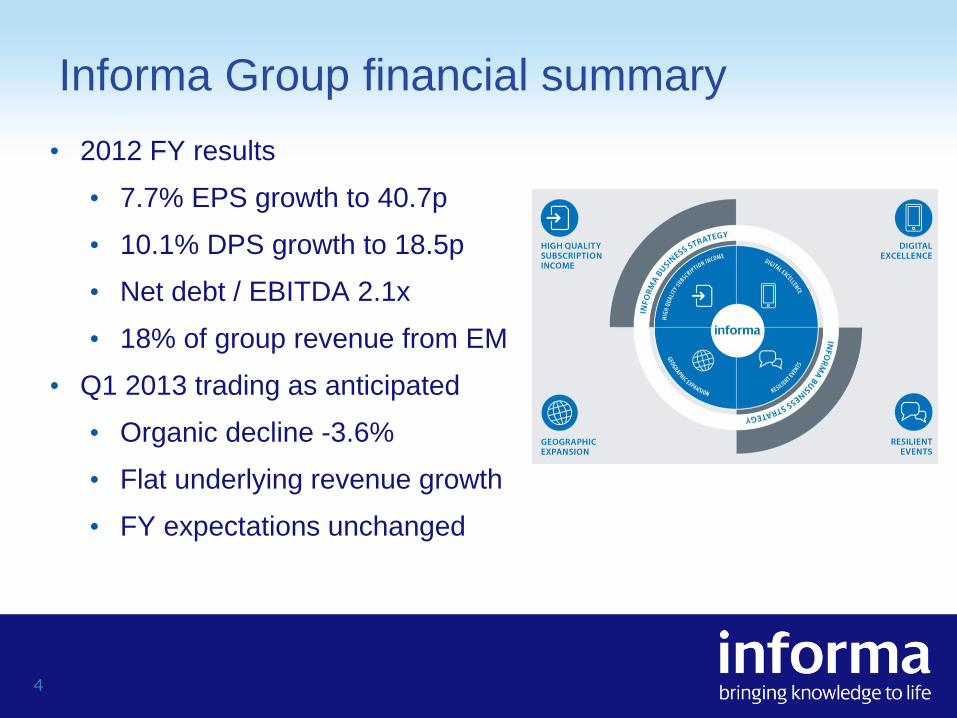
• 2012 FY results
• 7.7% EPS growth to 40.7p
• 10.1% DPS growth to 18.5p
• Net debt / EBITDA 2.1x
• 18% of group revenue from EM
• Q1 2013 trading as anticipated
• Organic decline -3.6%
• Flat underlying revenue growth
• FY expectations unchanged
Informa Group financial summary

5
• 2012 organic decline of 3%
• Large events grew high single-digit
• Small conference volume reduction
• Corporate training weak
• 27% of revenue emerging markets
• Margin mix
• Large events: high 20’s percent
• Small conferences: single-digit to high-teens
• Corporate training: low double-digit percent
Informa Events & Training Revenue by product 2012

6
• Annual global exhibition market
(Source: CEIR, AMR)
• >30k exhibitions
• 2.8m direct exhibiting companies
• 260m visitors
• Organiser revenue >£26bn
• Highly fragmented organiser market
• Conferences and other events add
significant further value
Global event market
Global exhibition organisers market share
Global exhibition market split by region
Source: CEIR
Source: CEIR
4% 2%
1%
82%
Reed
GL Events
Messe Frankfurt
UBM
Fiera Milano
Messe Dusseldorf
Messe Cologne
Messe Hannover
Messe Munich
DMG
Informa
Others

7
• Digitisation has impacted frequency
and quality of customer engagement
• Value of face-to-face (F2F)
interaction has risen
• Marketing investment must now be
measured & justified…ROI is everything
• Easy to measure exhibition impact
• Strong lead generation = high ROI
• Barriers to entry are high in exhibitions
• Significant emerging market opportunity
Global event market: long-term attractions
0
5
10
15
20
25
30
35
2005 2006 2007 2008 2009 2010 2011 2012 2013F 2014F 2015F
Events Magazines Online
US B2B marketing spend
Source: VSS Communications Industry Forecast

8
• Expansion of global exhibition space
• Fragmentation = consolidation potential
• Economic value-add of events
• Direct and indirect value
• Cities increasingly recognising the
impact on local economy
• Structural growth in F2F media
• 5% industry CAGR to 2015
Global event market: long-term attractions
5% 5%4%
9%8%
0%
2%
4%
6%
8%
10%
World US Germany China Brazil
Exhibition industry CAGR 2011-2015E
Source: AMR International
Increase in global exhibition space
Number
of venues
Total indoor
exhibition space
2011 1197 32.6m SQM
Increase since 2006 +57 +3.4m SQM (+12%)
Source: UFI

9
• Origins in small conferences
• Challenge of managing the cycle
• Acquisition of IIR in 2005 added
significant expertise in large events
• Downturn accelerated a managed
reduction in volume
• Today we run 6,500 events in over 30
countries
• Focus on repeatable events, with
international appeal & growth potential
Informa Events: evolution of mix
Informa total event volume
0
5000
10000
15000
2007 2008 2009 2010 2011 2012
Informa Events revenue by type 2008-12
61.2 54.0
13.2 27.07.9
12.011.85.0
0%
20%
40%
60%
80%
100%
2008 2009 2010 2011 2012
Delegate Exhibition Sponsorship
Consulting Advertising Other

10
• Exhibitions are transaction-led
• Difficult to establish
• High barriers once established
• Strong revenue visibility
• High margin potential
• Positive cash flow through the event
cycle
• High ROI and easy to measure
• Venue relationships key
• Quality & experience of visitors critical
Dynamics of large events
Cumulative cash cycle of an exhibition
Source: Bank of America Merrill Lynch
Deposits paid
First stage
payment
2nd stage payment &
venue payment
On-site stand
construction
Visitor
promotion
-12 -11 -10 -9 -8 -7 -6 -5 -4 -3 -2 -1
£000's
Months to event

11
• >250 large events in 2012
• 55 events >£1m revenue in 2012
• 44% E&T revenue from large events
• >2/3rds E&T profit from large events
Informa Events: large events
Split between large and other event revenue
0%
20%
40%
60%
80%
100%
2007 2008 2009 2010 2011 2012
Large event revenue Other events
Top 15 events in 2012 (alphabetical order)
Event Sector Location
ABF Franchising Finance Sao Paulo
Africa com TMT Cape Town
Anti-Aging Medicine W. Congress Healthcare Monaco
Arab Health Healthcare Dubai
Broadband World Forum TMT Amsterdam
Cityscape Abu Dhabi Property Abu Dhabi
Cityscape Global Property Dubai
Fispal Technology Food Sao Paulo
Formobile Furniture Sao Paulo
Middle East Electricity Energy Dubai
Monaco Yacht Show Leisure Monaco
Serigrafia Printing Sao Paulo
SuperReturn International Finance Berlin
TV Connect TMT London
Vitafoods Europe Food Geneva

12
• Conferences are content-led
• Easy to launch
• Lower barriers to entry
• Often one-off events
• Lower margin potential
• Attractive cash dynamics
• ROI more difficult to measure
• Content focus and quality of speakers is key
• Essential for developing the large events of tomorrow
Dynamics of small conferences
13
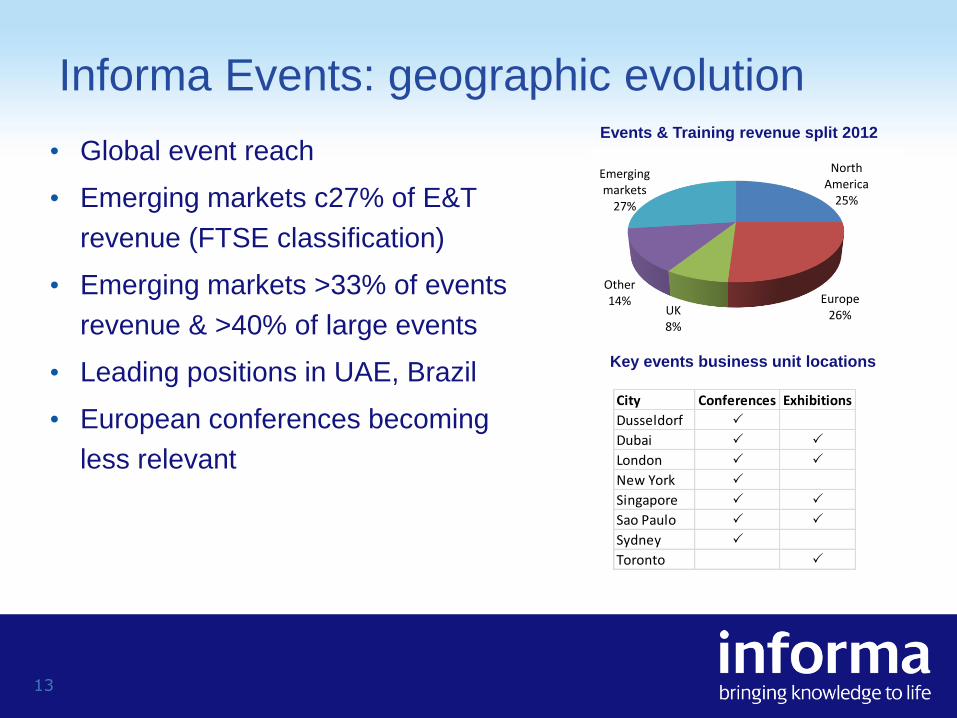
• Global event reach
• Emerging markets c27% of E&T
revenue (FTSE classification)
• Emerging markets >33% of events
revenue & >40% of large events
• Leading positions in UAE, Brazil
• European conferences becoming
less relevant
Informa Events: geographic evolution
North America
25%
Europe26%UK
8%
Other14%
Emerging markets
27%
Events & Training revenue split 2012
Key events business unit locations
City Conferences Exhibitions
Dusseldorf P
Dubai P P
London P P
New York P
Singapore P P
Sao Paulo P P
Sydney P
Toronto P

14
• Aggressive schedule of new
launches & geo-clones each year
• 19 in 2011 and 17 in 2012
• Vitafoods South America
• Cross Media
• SuperInvestor US
• Geo-cloning expertise
• Demand led
• Relatively low risk
• Brand enhancing
Informa Events: Launches and geo-cloning
UK8% Europe
8% North America
6%
UAE20%
Asia26%
Latam6%
Other emerging markets
20%
ROW6%
Geography of new launches & geo-clones: 2011/2

15
• Global exhibition market highly
fragmented
• Competition for assets not as fierce as
one might think
• Long-term relationships and vertical
expertise are key
• Average multiple paid for events assets
last 3 years of 6.6x EBITDA
• High ROI on event acquisitions
Informa Events: M&A trends
Number of
deals
Average EBITDA
multiple paid (x)
1st year tax
adjusted ROI (%)
2010 9 6.2 12.4
2011 6 7.0 10.9
2012 4 6.1 12.6
Total 19 6.6 11.6
Recent track record of events acquisitions

16
• Small conference business since 1990’s
• Buy and build strategy on large events
• Acquisition of BTS and Ibratexpo in 2011
• Portfolio of leading exhibitions
• Food, furniture, franchising, printing etc
• Close to £100m investment into the region
• Now one of the two big exhibition players
• Successful bid for Agrishow in 2013
• Leading market position
• Informa’s expertise in the food sector
Informa Events: Brazil case study

17
• Food sector booming in Brazil
• Largest agricultural show in Latam
• >400k sqm gross / 240k sqm net
• >120,000 visitors from 67 countries
• BRL 3bn of credit letters issued pre-show
Brazil: Agrishow 2013

18
• Industry health a key growth driver for an exhibition
• Focus on multi-platform strength across industry verticals
• Global reach through geo-cloning and digital publishing
• Leverage knowledge, contacts, brands across the group
• Vertical strengths:
• Healthcare & Life Sciences
• Agri-Food & Commodities
• Anti-Aging & Beauty
• Telecoms & Media
• Finance
Informa Events: vertical strength
Health & Beauty
27%
TMT20%
Property9%
Food11%
Finance9%
Energy12%
Leisure12%
Top 20 events revenue split by vertical

19
Agri-Food & Commodities


21
Telecoms & Media

22
• Leverage vertical strengths
• Leverage scale opportunities
• Leverage economic value of events
• Leverage data, technology and customer relationships
• Conference format innovation – improve attendee experience
• Event websites, booking, registration, social media, apps
• Fully integrated, year round marketing platform - maximise ROI
• Large events more than two thirds of E&T revenue
• Emerging markets more than half of E&T revenue
• E&T margin in the mid-20’s percent
Future ambitions for Informa Events

23
• Events is a core business for Informa
• Deep expertise across large events and conferences
• Rebalancing of the portfolio is ongoing
• Attractive M&A opportunities
• Exciting emerging markets opportunity
• Multi-platform vertical strength is a competitive advantage
• Quality of earnings improving
• Strong growth prospects
Summary


25
What is Vitafoods?
• Nutraceutical not Pharmaceutical
• Key issues:
• Obesity, ageing, heart health
• Key drivers:
• Affluent consumer, education / awareness, rising healthcare costs
• Market predictions:
• Growth at 7% until 2015 to $48.8bn (Source: Datamonitor)
Food ingredients
Nutraceuticals
26
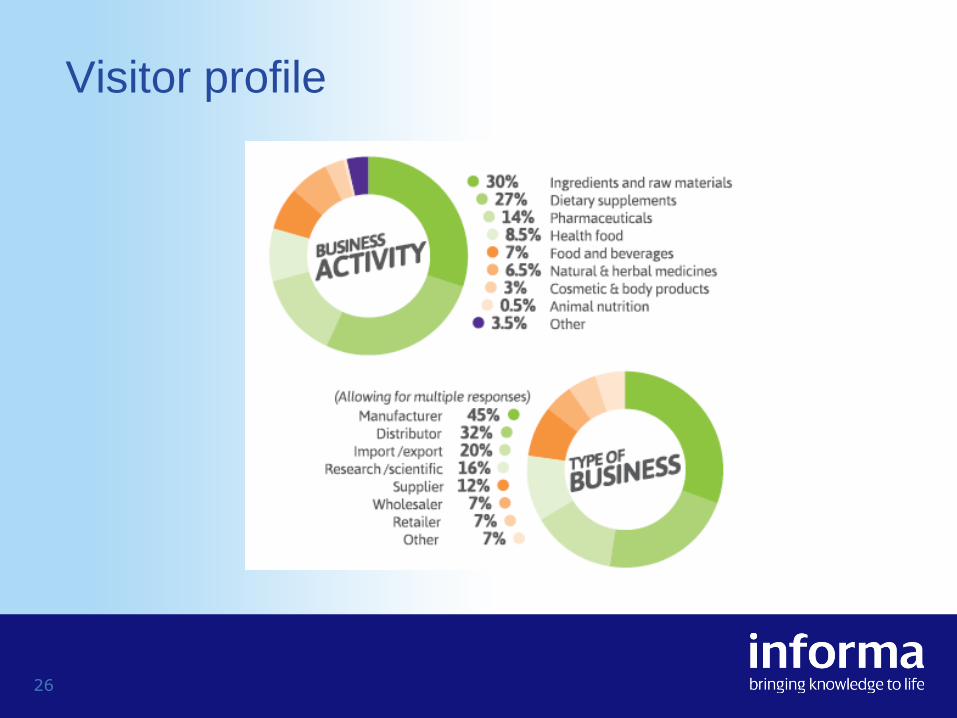
Visitor profile

27
Visitor profile

28
The Vitafoods Team
• Portfolio Director
• Sales team
• 6 UK, 1 Singapore
• Marketing team
• 5 UK, 1 Singapore, 2 Brazil
• Operations Manager
• FTE = 17
• Group Revenue >£5m
• Profit Margin >50%

29
• 1997 – Vitafoods launched
• 1999 – Vitafoods moved to Palexpo, Geneva
• 2003 – Vitafoods acquired by IIR / Informa – Revenue (<£1m)
• 2003 – Vitafoods Conference launched
• 2005 – FPE launched as a feature area within Vitafoods
• 2006 – FPE launched as a separate show co-located with Vitafoods
• 2011 – Vitafoods Asia, Hong Kong launched
• 2012 – Vitafoods South America, Brazil launched
• 2013 – FPE breaks the £1m revenue mark
• 2013 – Combined revenue from Vitafoods Group over £5m
Key milestones

30
Floor plan
evolution since
Vitafoods
moved to
Palexpo
2013:
600 exhibitors
12,000 visitors
from
91 countries
31
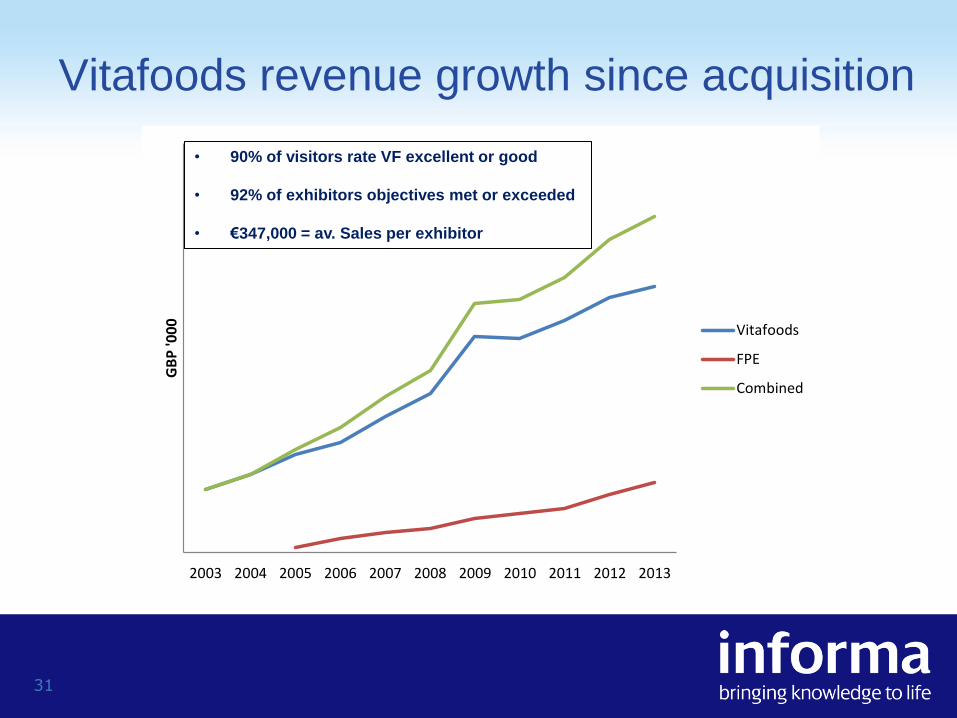
Vitafoods revenue growth since acquisition
2003 2004 2005 2006 2007 2008 2009 2010 2011 2012 2013
GB
P '0
00
Vitafoods
FPE
Combined
• 90% of visitors rate VF excellent or good
• 92% of exhibitors objectives met or exceeded
• €347,000 = av. Sales per exhibitor

32
The Future
• Strong Vitafoods rebookings for 2014
• Vitafoods South Africa
• Russia
• Confexes
• Publishing / Editorial
• Pet
• Beauty

33
Vitafoods – Guided tour Chris Lee
Portfolio Director
Informa IIR Exhibitions

34
Thank you.