analysts’ forecast accuracy in germany: the effect of ... · we investigate the impact of...
TRANSCRIPT
BuR - Business Research Official Open Access Journal of VHB Verband der Hochschullehrer für Betriebswirtschaft e.V. Volume 1 | Issue 1 | May 2008 | 26-53
26
1. Introduction We investigate the impact of different accounting principles and of a change of accounting principles on financial analysts’ earnings forecast accuracy. Our results provide evidence that forecast accuracy is higher for estimates based on data prepared un-der internationally accepted accounting principles (IAAP), i.e. International Accounting Standards (IAS)/International Financial Reporting Standards (IFRS)1 or United States Generally Accepted Ac-counting Principles (US GAAP), than for estimates based on German GAAP (also called “Handelsge-setzbuch (HGB)”) data. Moreover, in years of the adoption of new accounting principles the forecast accuracy is lower than in other years for companies switching from HGB to US GAAP. Germany pro-vides a unique framework for these analyses for two
1 The International Financial Reporting Standards (IFRS) were initially called International Accounting Standards (IAS). In 2001, they changed name to International Financial Re-porting Standards (IFRS). We use the term “IAS” when we refer to periods before 2001, a combination of both terms (“IAS/IFRS”), when we refer to a time period including years before 2001 and the term “IFRS” when we refer to more recent periods.
reasons: First, many publicly traded German com-panies have successively switched to internationally accepted accounting principles (IAAP), i.e. IAS/ IFRS or US GAAP, before 2005. Therefore, the impact of the adoption of new accounting principles could be examined while controlling for macroeco-nomic and other variables which are subject to change over time. Second, the national German GAAP is significantly different to IAS/IFRS and US GAAP which makes the impact of the accounting principles on the analysts’ accuracy more obvious. The motivation for this study is the adoption proc-ess of IFRS in Europe. Since 2005 almost all pub-licly traded European companies have been re-quired by the IAS regulation (1606/2002/EC) to prepare consolidated accounts under IFRS.2 For this transition process we try to make some inferences from the adoption process in Germany where many
2 Companies, which are publicly traded both in the European Union and on a regulated third-country market and which are therefore applying other IAAP (especially US GAAP) in their consolidated accounts, are allowed to defer the application of IFRS until 2007. This also holds for companies which only have publicly traded debt securities.
Analysts’ Forecast Accuracy in Germany: The Effect of Different Accounting Principles and Changes of Accounting Principles Jürgen Ernstberger, Faculty of Business, Economics and Information Systems, University of Regensburg,
E-mail: [email protected]
Simon Krotter, Corporate Finance Department, Siemens AG, München, E-mail: [email protected]
Christian Stadler, School of Management, Royal Holloway, University of London, E-mail: [email protected]
Abstract This paper assesses the influence of an adoption of IAS/IFRS or US GAAP on the financial analysts’ fore-cast accuracy in a homogenous institutional framework. Our findings suggest that the forecast accuracy is higher for estimates based on IFRS or US GAAP data than for forecasts based on German GAAP data. Moreover, in the year of switching from German GAAP to US GAAP the forecast accuracy is lower than in other years. The paper contributes to prior research by providing evidence about the usefulness of interna-tional accounting data and about the adoption effects of a change to such accounting principles. Keywords: accounting, adoption effect, analysts, analysts’ forecast accuracy, financial analysts, German GAAP, Germany, HGB, IAS, IFRS, IFRS adoption, learning effect, US GAAP

BuR - Business Research Official Open Access Journal of VHB Verband der Hochschullehrer für Betriebswirtschaft e.V. Volume 1 | Issue 1 | May 2008 | 26-53
27
Analyst-specific
Drivers of analyst forecast accuracy
Firm-specific
Firm characteristicsFirm actionSkill
Behavior
xx Analyst-specific
Drivers of analyst forecast accuracy
Firm-specific
Firm characteristicsFirm actionSkill
Behavior
xx
companies switched to IAS/IFRS or US GAAP be-fore 2005. Many studies have analyzed the accuracy of ana-lysts’ forecasts and its determinants. Most of the prior research has been conducted for the US (e.g. Lys and Soo 1995; Mikhail, Walther, and Willis 1997; Alford and Berger 1999; Clement 1999; Jacob, Lys, and Neale 1999; Duru and Reeb 2002; Irvine 2004; Gu and Wang 2005; Lin and Yang 2006) or the UK (e.g. Acker, Horton, and Tonks 2002). We analyze the German market similar to Capstaff, Paudyal, and Rees (1998), Wallmeier (2005), Daske (2005), and Bessler and Stanzel (2007). However, only the study by Daske (2005) examining the pe-riod 1993–2002 explicitly controls for the type of accounting principles applied. Similarly, our study considers the impact of differences in the account-ing regimes applied, but also delivers evidence on analysts’ forecast accuracy for a more recent time period, i.e. the years 1998–2004. Our study contributes to prior research as it consid-ers accounting principles and accounting principle changes as control variables. Thus, we are able to document in contrast to Daske (2005) that the im-plication of an international accounting regime (IAS/IFRS and US GAAP) is associated with a higher forecast accuracy of financial analysts. Since 1998 German companies have been allowed by law to choose to prepare their consolidated accounts in accordance with national GAAP, IAS/IFRS, or US GAAP. Therefore, Germany provides a unique framework for a comparative analysis within a ho-mogeneous institutional background. This allows us to effectively control for institutional factors (e.g. regulatory requirements and the enforcement sys-tem) which prove to be important determinants of analysts’ forecast quality (Hope 2003a; Hope 2003b; Hope 2004; Barniv, Myring, and Thomas 2005). Our paper is arranged as follows: Section 2 gives an overview of related previous studies. Section 3 states the research hypotheses. Section 4 explains the variables and models used in the analyses. Section 5 gives an overview of the sample selection process and of the data sources. Sections 6 and 7 present and discuss the descriptive and regression results. Section 8 provides the results of sensitivity analyses and Section 9 concludes.
2. Literature review
2.1 Drivers of analyst forecast accuracy In the last few years, there has been an explosion of research examining analyst forecasts. One can iden-tify interacting analyst-specific and firm-specific factors that drive analyst accuracy (see Figure 1). Concerning the individual analyst, it is known amongst other things that he or she tends to be rather optimistic in the way that his or her forecasts are systematically upward biased (e.g. Easterwood and Nutt 1999) and are revised rather gradually (e.g. Bartov, Givoly, and Hayn 2002). In addition, ana-lysts certainly may exhibit different skills which may emanate from their experience, workload, or risk tolerance. On the other side, a firm’s characteristics also drive analyst forecast accuracy, e.g. company size, industry or country the company operates in, or its regulatory environment (e.g. Das and Sauda-garan 1998; Higgins 1998). Furthermore, manage-ment actions may influence forecast accuracy di-rectly or indirectly. On the one hand, several studies indicate the management of earnings and the guid-ance of forecasts towards the consensus (Bannister and Newman 1996; Degeorge, Patel, and Zeck-hauser 1999; Matsumoto 2002; Bartov, Givoly, and Hayn 2002; Abarbanell and Lehavy 2003; Hutton 2005; Burgstahler and Eames 2006; for Germany see Bessler and Stanzel 2007). On the other hand, through issuing its own forecasts, management tries to influence analysts’ expectations (e.g. Williams 1996; Bamber and Cheon 1998; Lennox and Park 2006). Thus, both the management of earnings and expectations jointly drive the analysts’ consensus gradually down to beatable analyst forecasts, which may favor equity issuances or insider trading (e.g. Richardson, Teoh, and Wysocki 2004).
Figure 1: Drivers of analyst forecast accuracy

BuR - Business Research Official Open Access Journal of VHB Verband der Hochschullehrer für Betriebswirtschaft e.V. Volume 1 | Issue 1 | May 2008 | 26-53
28
2.2 Analyst forecast accuracy and accounting data This study deals with the actions of management that relate to the firm’s accounting practices and disclosure policy. Our work combines two strands of research: studies on the impact of accounting data and studies on the impact of the adoption of IAAP. Financial analysts are frequently regarded as so-phisticated processors of financial information and often taken as representatives of the market (Revsine, Collins, and Johnson 2001). Furthermore, evidence suggests that financial statements are an important source of information for analysts when determining their forecasts (Acker, Horton, and Tonks 2002; Peek 2005). The influences of (changes in) accounting standards and disclosures on the forecast accuracy have been widely examined. For example, Lang and Lundholm (1996) show that a disclosure score for US compa-nies in the period 1985–1989 is positively associated with the number of analysts following (i.e. coverage) as well as forecast accuracy, and is negatively asso-ciated with forecast dispersion as well as variability of forecast revisions. However, the category of in-vestor relations, in particular, shows significant relationships, whereas annual financial statements as well as other annual published information are mostly not significant. The findings of Lang and Lundholm (1996) are confirmed in an international study by Hope (2003a). Analyzing 1,309 firm-year observations from 22 countries he observes that companies’ disclosure levels (as well as the level of enforcement) are positively associated with the forecast accuracy of analysts. Several other studies examine the association between both the level of and an increase in the quality of disclosures with forecast errors (Higgins 1998; Chang, Khanna, and Palepu 2000; Ang and Ciccone 2001; Acker, Hor-ton, and Tonks 2002; Hope 2003b; Vanstraelen, Zarzeski, and Robb 2003; Hope 2004) and find similar results for various countries. In particular the predictive value of disclosures seems to have a positive impact on properties of analysts’ earnings forecasts. For example, the in-formation provided in segment reports which aims at helping users of financial statements to evaluate the present and future performance of a company is found to enhance analysts’ earnings forecasts (Baldwin 1984; Swaminathan 1991; Hussain 1998; Lobo, Kwon, and Ndubizu 1998; Behn, Nichols, and Street 2002). Similarly, Barron, Kile, and O’Keefe
(1999) document a positive association between forecast accuracy and the quality of disclosures in the Management Discussion and Analysis (MD&A) and especially certain forward-looking information in the MD&A. Besides disclosures, specific properties of account-ing standards and their impact on forecast accuracy have been examined. In a cross-country study Basu, Hwang, and Jan (1998) find that forecast accuracy is lower in countries with accounting regimes hav-ing the following properties: higher relative use of current value accounting (with revaluations passing through the income statement), less relative use of accruals, and less choice between accounting meth-ods. However, for a sample of 18 countries Hope (2004) finds contrary results. Controlling for varia-tions in the enforcement system between different countries and for variations in disclosure levels between different firms, he shows that the relative extent of choice is negatively associated and the relative extent of accrual accounting is positively associated with forecast accuracy. The impact of conservatism on the forecast accuracy of financial analysts is investigated by Mensah, Song, and Ho (2004). They analyzed three measures of conserva-tism and find that a higher level of conservatism leads to higher forecast errors of financial analysts. Ashbaugh and Pincus (2001) compare different accounting principles with reference to the forecast accuracy of financial analysts and set IAS as a benchmark. For a cross-country sample of 80 com-panies having adopted IAS between 1990 and 1993, they show that analysts’ forecast errors are posi-tively related to the differences between various domestic GAAP and IAS. Moreover, they find that forecast accuracy improves after the adoption of IAS. Cuijpers and Buijink (2005) investigated the determinants and consequences of applying IAAP for 114 companies from 12 European countries (in-cluding Germany) in 1999. They show that IAAP application has a positive impact on analysts follow-ing. However, they also document an increased analyst forecast dispersion effect for companies applying IAAP. A similar study was conducted by Daske (2005) for the period between 1993 and 2002 in Germany. He finds a lower accuracy and higher dispersion, but no significant difference in the vola-tility of analysts’ earnings forecasts based on IAS/IFRS or US GAAP in comparison to those based on German GAAP. However, in contrast to our study, he does not control for the complexity of
BuR - Business Research Official Open Access Journal of VHB Verband der Hochschullehrer für Betriebswirtschaft e.V. Volume 1 | Issue 1 | May 2008 | 26-53
29
the forecasting task measured by the beta of a com-pany as we do. He also provides evidence that the level of differences between earnings under IAS/IFRS or US GAAP and under German GAAP as well as the level of guidance provided by companies concerning the transition process has impacts on the forecast accuracy and forecast dispersion in the period of switching to another accounting regime. Reasons for these results being different to ours might be the different time period investigated and the different methodology. Other studies examine the effect of changes of ac-counting methods on forecast accuracy. For the US, Brown, Richardson, and Schwager (1987) find only a slight impact on forecast accuracy for accounting changes in 1976. The impact is smaller when addi-tional disclosures, like pro-forma adjustments, are provided. Elliott and Philbrick (1990) investigated accounting changes between 1976 and 1984. Their results suggest that the forecast accuracy turns out to be lower in years when accounting changes occur without prior disclosures. The findings are con-firmed for the Netherlands by Peek (2005). The forecast accuracy is lower after changes in account-ing procedures affecting earnings before extraordi-nary items. These change effects depend on the disclosures prior to the change and the type of change. The impact of the adoption of IAS/IFRS has been analyzed by several studies using different perspec-tives and different methods. In a cross-country study including Germany, Barth, Landsman, and Lang (2007) document a slight decrease in the cost of capital after the adoption of IAS/IFRS and a higher accounting quality of IAS/IFRS in compari-son to domestic GAAP, concerning several measures such as timely loss recognition or value relevance. Other studies use reconciliations of net income and/or shareholders’ equity to evaluate differences between the IAS/IFRS and other accounting princi-ples and the impacts of these differences (e.g. Harris and Muller 1999; Beckman, Brandes, and Eierle 2007). Most studies assess the impact of the adop-tion of IAS/IFRS in a single country. Studies have been conducted, e.g. for Switzerland (Auer 1999), Finland (Kinnunen, Niskanen, and Kasanen 2000), and Kuwait (El Shamy and Al-Qenae 2005).
2.3 Impacts of the adoption of IAAP Most studies on the impact of an adoption of IAS/IFRS focus on Germany. One part of the stud-
ies about Germany examines the capital market impacts of the IAS/IFRS adoption, the other part the accounting or disclosure quality of the IAS/IFRS in comparison to German GAAP. Concerning the capital market impacts, Leuz and Verrecchia (2000) as well as Gassen and Sellhorn (2006) document lower information asymmetry, but no decrease in volatility after the adoption of IAS/IFRS. Compar-ing IAS and US GAAP adopters in Germany, Leuz (2003) shows that there seems to be no significant difference in terms of information asymmetry measured by bid-ask spreads and share turnover. Finally, Daske (2006) was not able to document that the expected cost of equity capital has de-creased after the adoption of IAS/IFRS and US GAAP. Concerning the accounting or disclosure quality, Hung and Subramanyam (2007) find only little evidence for a higher value relevance of IAS in com-parison to German GAAP for a sample of 80 com-panies that adopted IAS between 1998 and 2002. Moreover, they provide evidence that German GAAP is more conservative and less fair-value ori-entated than IAS. Bartov, Goldberg, and Kim (2005) document a higher value relevance for positive earn-ings based on IAS and US GAAP than for those based on German GAAP. However, no difference is found either between the three accounting regimes for negative earnings or between IAS and US GAAP based earnings. In addition, Gassen and Sellhorn (2006) show that companies applying IAS/IFRS have more persistent, less predictable and more conditional conservative earnings than companies applying German GAAP. Focusing especially on disclosures, Daske and Gebhardt (2006) provide evidence that disclosure quality has increased after the adoption of IAS/IFRS or US GAAP by German companies. As the review of the existing literature reveals, there is still no recent large-scale study on the comparison between IAS/IFRS and domestic GAAP which ex-amines their impact on the analysts’ forecast accu-racy within the same institutional setting. The goal of this study is to fill this research gap and to pro-vide insights into the impacts of the different prop-erties of IAS/IFRS, US GAAP, and German GAAP on forecast accuracy in Germany. As Gebhardt, Lee, and Swaminathan (2001) argue, higher forecast accuracy could be associated with higher accounting quality and with lower implied cost of capital. Therefore, the research method used is related to

BuR - Business Research Official Open Access Journal of VHB Verband der Hochschullehrer für Betriebswirtschaft e.V. Volume 1 | Issue 1 | May 2008 | 26-53
30
both the accounting quality of IAS/IFRS and US GAAP and the capital market impact of the adoption of these accounting regimes. However, it has to be noted that high analyst forecast accuracy does not necessarily imply high accounting quality, because analysts’ forecast accuracy is a complex attribute which is – as indicated above – shaped by a set of potentially competing incentives and by the institu-tional environment.
3. Hypotheses In this study, we focus on the question of how ana-lysts cope with the adoption of IAS/IFRS or US GAAP. Thereby, we are interested in the short-term effects a change of the accounting principles and in the long-term implications of the adoption of more investor-oriented accounting principles in a country with traditionally rather stakeholder-oriented ac-counting principles. The first hypothesis of our study concerns the fore-cast accuracy of financial analysts for earnings per share based on the different accounting regimes. The increase in the quantity and quality of disclo-sures after the adoption of IAS/IFRS or US GAAP (Daske and Gebhardt 2006) should c.p. lead to a higher forecast accuracy as studies on the influence of disclosures on forecast accuracy suggest (Lang and Lundholm 1996; Higgins 1998; Chang, Khanna, and Palepu 2000; Ang and Ciccone 2001; Acker, Horton, and Tonks 2002; Hope 2003a; Hope 2003b; Hope 2004). On the other hand, based on the results by Mensah, Song, and Ho (2004) the more conditional conservative earnings of IAS/IFRS vis-à-vis German GAAP found by Gassen and Sell-horn (2006) should c.p. decrease forecast accuracy for companies switching from German GAAP to IAS/IFRS. Moreover, German GAAP is less fair value-oriented than US GAAP and IAS/IFRS. For example, Ger-man GAAP does not allow upward revaluations of certain types of financial assets at fair value in con-trast to US GAAP and IAS/IFRS. According to IAS/IFRS even property, plant, and equipment and investment property can be measured at fair value (IAS16.31).3 The higher fair value-orientation of IAS/IFRS in comparison to German GAAP is em-pirically validated by Hung and Subramanyam
3 For a complete list of the use of fair value in IFRS see Cairns (2006).
(2007). Peek (2005) argues and shows empirically that a higher fair value-orientation decreases fore-cast accuracy, because earnings under historical cost accounting are more reliable and verifiable (e.g. Ijiri and Noel 1984; Knutson 1992) and less volatile than under current cost accounting. However, it has to be considered that according to IAS/IFRS and US GAAP only a part of the fair value changes, e.g. from trading financial assets, has an impact on net in-come. The other part of changes can (e.g. revalua-tions of property, plant, and equipment according to IAS/IFRS as well as revaluations of available-for-sale financial assets according to IAS/IFRS until 2003), or must (e.g. revaluations of available-for-sale financial assets according to US GAAP and according to IFRS since 2004) be recognized di-rectly in equity. Therefore, the fair value-orientation could provide forward-looking information to finan-cial analysts without influencing reported and fore-casted earnings measures. Furthermore, the lower level of accrual accounting in German GAAP compared to US GAAP (Nobes and Parker 1998; Basu, Hwang, and Jan 1998; Hope 2004) or IAS/IFRS supposedly influences forecast accuracy. Capitalization and amortization provides useful information about future profitability and, therefore, should improve forecast accuracy (Peek 2005). This would c.p. imply a higher forecast accu-racy for financial statements based on IAAP. How-ever, a higher level of accrual accounting provides possibilities of earnings management which might have a detrimental effect on the forecast accuracy. The volatility of earnings is another important factor in explaining the forecast accuracy of financial ana-lysts (Ashbaugh and Pincus 2001; Peek 2005). Estimating earnings with a higher volatility might not allow incorporating simple models to extrapo-late previous earnings trends. Thus, a higher volatil-ity of earnings is likely to result in lower predictabil-ity of earnings which leads to a lower forecast accu-racy and a higher forecast bias of financial analysts (e.g., Lys and Soo 1995; Das, Levine, and Sivarama-krishnan 1998). As the higher fair value-orientation of IAS/IFRS and US GAAP in comparison to Ger-man GAAP might lead to a higher volatility of earn-ings, c.p. a lower forecast accuracy could be ex-pected for companies applying IAAP. Finally, the lower extent of choices in US GAAP than in IAS/IFRS or German GAAP (Nobes and Parker 1998) could influence forecast accuracy. First, more choices and less discretion could be aligned with

BuR - Business Research Official Open Access Journal of VHB Verband der Hochschullehrer für Betriebswirtschaft e.V. Volume 1 | Issue 1 | May 2008 | 26-53
31
higher forecast accuracy, because it may improve the ability of companies to manage earnings to-wards the analysts’ earnings forecasts. Several stud-ies indicate such earnings management behavior (Bannister and Newman 1996; Degeorge, Patel, and Zeckhauser 1999; Matsumoto 2002; Abarbanell and Lehavy 2003). In contrast, choices increase complexity and uncer-tainty of analysts (Ashbaugh and Pincus 2001) and therefore impair forecast accuracy (Hope 2004). Furthermore, earnings management may have ob-jectives other than meeting analysts’ earnings fore-casts, e.g. to report a non-negative result (Hayn 1995), to increase share price before a stock transac-tion (Dechow, Sloan, and Hutton 1996; Teoh, Welch, and Wong 1998), or to meet contractual provisions, such as in short-term bonus contracts that are tied to accounting measures (Holthausen, Larcker, and Sloan 1995). These objectives might worsen the predictability of earnings for analysts as they are usually not known by company outsiders. Empirically, the degree of earnings management seems to be largely the same across accounting principles in Germany (Van Tendeloo and Van-straelen 2005; Goncharov 2005). Thus, the extent of choices of different accounting principles should not have a significant impact on the forecast accu-racy across accounting principles in Germany. In summary, the effect of applying different ac-counting regimes on the forecast accuracy of finan-cial analysts is not obvious. After the adoption of IAS/IFRS or US GAAP the analysts should receive more (externally verified) information about the company’s financial position which enables them to build their prediction on a larger information set. Similarly, more informative accounting methods are likely to enhance analysts’ forecast accuracy without seriously biasing the net income to be forecasted. Therefore, we state the following hypothesis: Hypothesis 1: Forecast accuracy is higher for companies applying IAS/IFRS and US GAAP than for those applying German GAAP. If a company has to or can change its measurement method when new accounting principles are adopted, this may hamper forecast accuracy. Brown (1983) as well as Elliott and Philbrick (1990) pro-vide evidence for this hypothesis for US companies. Furthermore, a change from prudent accounting principles to accounting principles that purport to provide a true and fair view of the financial position of company could change the importance analysts
attach to the incorporation of public and of private information into the development of their forecasts. As Barron, Kim, Lim, and Stevens (1998) argue the forecast error of financial analysts can be divided into a common component resulting from errors in public information and an idiosyncratic component resulting from errors in private information. If the adoption of IAS/IFRS or US GAAP increases the errors in public information (Ashbaugh and Pincus 2001) or makes analysts focus more on public rather than on private information even though the error in public information is high, forecast accuracy might deteriorate. Moreover, a change in the accounting principles applied may impair the possibility to extrapolate earnings trends as a restatement is only mandatory for one year prior to the adoption. This could nega-tively influence the ability of analysts to forecast future earnings (Peek 2005). However, companies might have adjusted several choices in their finan-cial statements under the previous accounting prin-ciples (Daske 2005) or in the financial statements under the newly adopted accounting principles to smooth the adoption process. Whereas the first smoothing strategy should be possible for all com-panies adopting IAAP, companies switching to US GAAP could not follow the second smoothing strat-egy because of the relatively low extent of choices in US GAAP already mentioned above. Another argument for lower forecast accuracy after the adoption of other accounting principles can be derived from the functional fixation theory (Hand 1990). According to this theory individuals tend to retain their decision-making process after a change in the accounting principles providing the informa-tion for their decisions. When the adoption of a new accounting regime requires modifications, the deci-sion-making process used beforehand might no longer be suitable and consequently forecast accu-racy could deteriorate. Again, the smoothing strate-gies mentioned above could mitigate this effect. Nevertheless, there is a potential reason for an in-crease in forecast accuracy in the years of the adop-tion of IAS/IFRS and US GAAP. Prior research shows that the motivation for accounting changes is to improve the informativeness of financial report-ing (e.g., Bartov and Bodnar 1996). Therefore, fore-cast accuracy should c.p. increase in the year of adoption, especially when additional disclosures, like reconciliations, are provided.
BuR - Business Research Official Open Access Journal of VHB Verband der Hochschullehrer für Betriebswirtschaft e.V. Volume 1 | Issue 1 | May 2008 | 26-53
32
Despite the plausibility of the opposing view, we believe that the most likely effect of an adoption of new accounting principles is that forecast accuracy is lower for the year of change, because financial analysts might not be able to cope with such a great change in an important data source. As smoothing strategies are more likely for companies switching from German GAAP to IFRS we state the following research hypothesis: Hypothesis 2: In the year of adoption of new accounting principles, forecast accuracy is lower than in other periods, especially for companies switching from German GAAP to US GAAP. According to Markov and Tamayo (2006), financial analysts learn about the parameters of companies’ earnings processes and thereby improve their fore-casts. Such a relationship is suggested by studies at the individual analyst level showing that the firm-specific experience of an analyst is positively associ-ated with her forecast accuracy (Mikhail, Walther, and Willis 1997; Clement 1999; Clement, Rees, and Swanson 2003). Moreover, Markov and Tamayo (2006) argue that unanticipated shocks to the earn-ings process may bias the learning process by rein-troducing uncertainty. Subsequently, financial ana-lysts need to learn again about the determinants of the earnings process. A change in the accounting principles as an important information basis for the earnings forecasts could be seen as such a shock. In the second year of applying IAAP the financial fig-ures of the first year of adopting IAS/IFRS or US GAAP and of at least one year of comparison pre-ceding the year of adopting a new accounting re-gime are available to financial analysts. Assuming that this information is already sufficient for ana-lysts in order to evaluate the impact of adopting international accounting regimes on the financial statements of a company we state the following hypothesis: Hypothesis 3: In the year after the adoption of new accounting principles forecast accuracy is not different to that of other periods (except for the periods of adoption).
4. Variables and models
4.1 Dependent variable The study investigates the influence of different accounting regimes on the forecast accuracy of fi-nancial analysts. Therefore, we regress a measure of
forecast accuracy as dependent variable on the vari-ables that are examined and on several control vari-ables as independent variables. Similar to other studies on the determinants of fore-cast accuracy (e.g., Lang, Lins, and Miller 2003; Hope 2004), we define forecast accuracy of a com-pany’s earnings per share (EPS) as follows:
monthforecast the of middle at the priceStock
EPS forecastedMedian EPS ActualFA_MEDIAN
���
We have made two modifications in comparison to previous definitions. First, we use the median of the estimates during a specified period as a consensus forecast and not the mean, because the median is less sensitive to outliers. In order to control for the influence of this modification on the result, we con-ducted a sensitivity analysis using the mean of the estimates alternatively and found no material differ-ences in the results (see Section 8 for details). Sec-ond, we do not use the median of an entire fiscal year, but rather of each month before the report date, i.e. the date when the actual EPS is reported by the company. This enables us to control for the ef-fect that forecasts closer to the report date are usu-ally better than earlier forecasts by using a control variable. Due to this modification we use the stock price at the middle of the forecast month as deflator to facilitate comparisons across observations.
4.2 Independent variables The first hypothesis is tested by including dummy variables for the type of accounting regime applied into the regression. Taking German GAAP as a ref-erence group, we use IFRS that takes the value 1 if the actual EPS is based on IAS/IFRS and 0 other-wise as well as US that takes the value 1 if the actual EPS is based on US GAAP and 0 otherwise. Assum-ing that hypothesis 1 is true, these dummy variables should be significant and positive in a regression on the forecast accuracy. To test the second hypothesis, we define the dummy variable ADOPT which takes the value 1 when the forecast is made in a month of the year a company adopted IFRS or US GAAP and 0 otherwise. Using this variable as well as lagged accounting regime dummies indicating the type of accounting princi-ples applied in the previous year (HGB-1, IFRS-1, US-1), we construct interaction terms to indicate what type of switch of the accounting principles

BuR - Business Research Official Open Access Journal of VHB Verband der Hochschullehrer für Betriebswirtschaft e.V. Volume 1 | Issue 1 | May 2008 | 26-53
33
occurred in the respective fiscal period, i.e. from German GAAP to IAS/IFRS (ADOPT * IFRS * HGB-1), from US GAAP to IAS/IFRS (ADOPT * IFRS * US-1), from German GAAP to US GAAP (ADOPT * US * HGB-1) or from IFRS to US GAAP (ADOPT * US * IFRS-1). Under the assumption that hypothesis 2 applies, at least the interaction term indicating a switch from German GAAP to US GAAP should be significant and have a negative sign in a regression on forecast accuracy. Moreover, we use the interaction terms ADOPT-1 * IFRS as well as ADOPT-1 * US for testing hypothesis 3. A value of 1 for these interaction terms means that IFRS or US GAAP, respectively, was adopted in the previous year, i.e. the observation refers to the second fiscal year of applying IAS/IFRS or US GAAP. Hypothesis 3 implies that the forecast accu-racy for such years is not significantly different in comparison to other periods (except for the periods of adoption) and thus these interactions terms should not be significant in a regression on forecast accuracy.
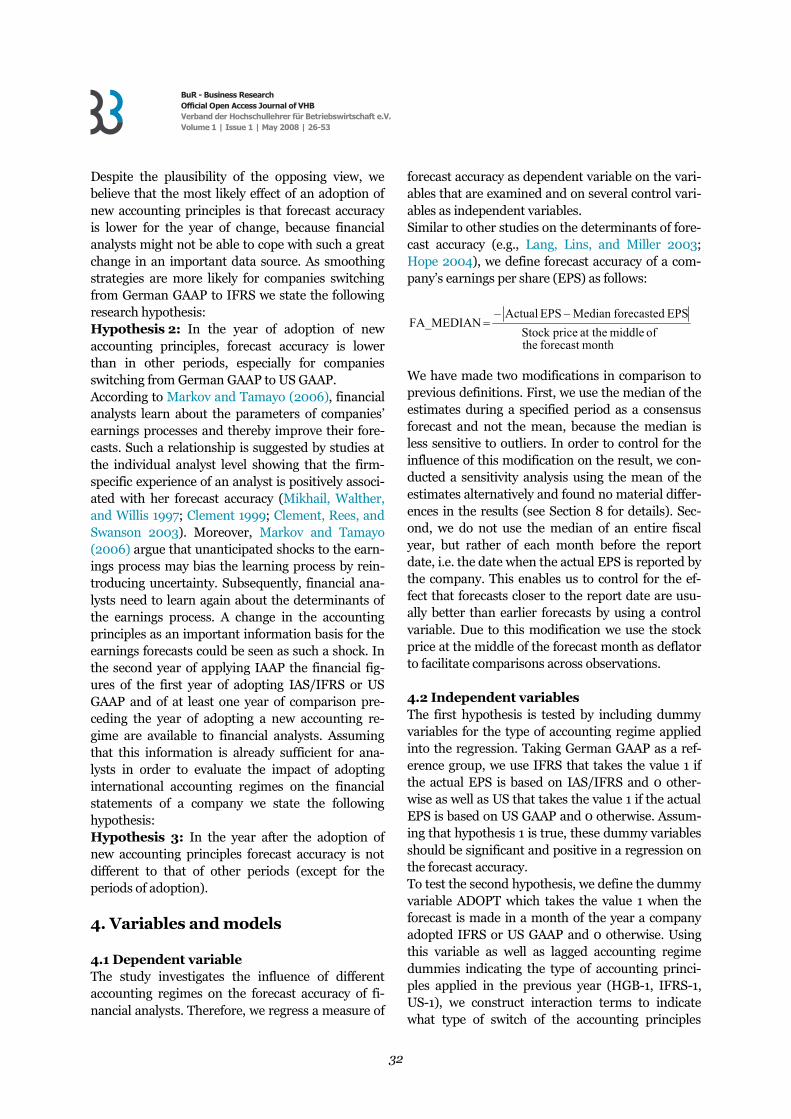
4.3 Control variables Following previous studies, we include several con-trol variables into the regression. TIME refers to the number of days between the report date and the date of the consensus forecast. Figure 2 illustrates the calculation of the variable TIME. In a certain year (2003 and 2004 in the example) we focus on consensus estimates during the time period between two report dates (15/03/2003 – 15/03/2004 and 15/03/2004 – 15/02/2005 in the example) regard-less of the length of this period (12 months and 11 months in the example). The single forecasts of analysts during this period are valid for a maximum of 105 days (as defined by IBES) or until the earlier of the report date or the withdrawing of the forecast by the respective analyst. The consensus forecast of all valid single forecasts is calculated at the middle of all months within the period between two report dates (e.g. at 15/06/2003 and 15/09/2004 in the example). The period between the date of the con-sensus forecast and the report date is defined as TIME for this consensus forecast (15/03/2004 –
Figure 2: Illustration of calculating the variable TIME
31/12/2002 31/12/200431/12/2003Fiscal period end date
15/03/2003 15/02/200515/03/2004Earnings report date
12 months 11 months
12 months 12 months
t
31/12/2002 31/12/200431/12/2003Fiscal period end date
15/03/2003 15/02/200515/03/2004Earnings report date
t
IBES monthly consensus forecast(includes all single forecasts madein the last 105 days)
15/06/2003 15/09/2004
274 days 153 daysTIME independent variable
31/12/2002 31/12/200431/12/2003Fiscal period end date
15/03/2003 15/02/200515/03/2004Earnings report date
12 months 11 months
12 months 12 months
t
31/12/2002 31/12/200431/12/2003Fiscal period end date
15/03/2003 15/02/200515/03/2004Earnings report date
12 months 11 months
12 months 12 months
t
31/12/2002 31/12/200431/12/2003Fiscal period end date
15/03/2003 15/02/200515/03/2004Earnings report date
t
IBES monthly consensus forecast(includes all single forecasts madein the last 105 days)
15/06/2003 15/09/2004
274 days 153 daysTIME independent variable
31/12/2002 31/12/200431/12/2003Fiscal period end date
15/03/2003 15/02/200515/03/2004Earnings report date
t
IBES monthly consensus forecast(includes all single forecasts madein the last 105 days)
15/06/2003 15/09/2004
274 days 153 daysTIME independent variable
BuR - Business Research Official Open Access Journal of VHB Verband der Hochschullehrer für Betriebswirtschaft e.V. Volume 1 | Issue 1 | May 2008 | 26-53
34
15/06/2003 = 274 days and 15/02/2005 – 15/09/2004 = 153 days). As already mentioned, forecasts issued earlier are likely to be less accurate than forecasts issued closer to the time earnings are announced. The reason for this is that the analysts have less information avail-able and thus higher uncertainty about a company’s results in a fiscal year. Accordingly, this relationship is documented by several studies (e.g., Brown, Richardson, and Schwager 1987; Lys and Soo 1995; Das and Saudaragan 1998; Jacob, Lys, and Neale 1999; Duru and Reeb 2002). We expect a negative sign for this variable in the regression on forecast accuracy. Similar to several previous studies (e.g. Lang and Lundholm 1996; Hope 2003a; Hope 2003b), we use firm size as a control variable. The variable MCAP represents the market capitalization at the middle of the month for which the consensus forecast is made. We use the natural logarithm of this variable as MCAP itself is heavily skewed. Log(MCAP) is con-sidered to be a proxy for the information environ-ment of a company, as large companies are more likely to provide additional information to the public or more private information (Jaggi and Jain 1998) to the analysts than smaller companies. This would imply a positive coefficient on log(MCAP). Firm size is also seen as a proxy for other company-specific factors, like management incentives for which pre-dictions are unclear (Hope 2003a). COVERAGE stands for the number of analysts fol-lowing a company in a month. This variable is a proxy for the intensity of competition (Lys and Soo 1995) and thus for the incentives to forecast accu-rately (Hope 2003a). As the forecast accuracy of the consensus forecast should be higher when more analysts estimate, we expect a positive estimated coefficient on COVERAGE. Moreover, we define dummy variables for the mem-bership in one of the market segments of the Ger-man Stock Exchange. Taking companies not in-cluded in a stock index as a reference group, we differentiate between the following indices: DAX, MDAX, TECDAX, NEW_MARKET, and SDAX. DAX stands for the German blue-chip segment comprising the 30 largest and most actively traded German companies. MDAX is the mid-cap segment, and TECDAX (founded in 2003) is the technology sector segment. NEW_MARKET stands for the “Neuer Markt”, which was the German market seg-ment for technology stocks and was replaced by the
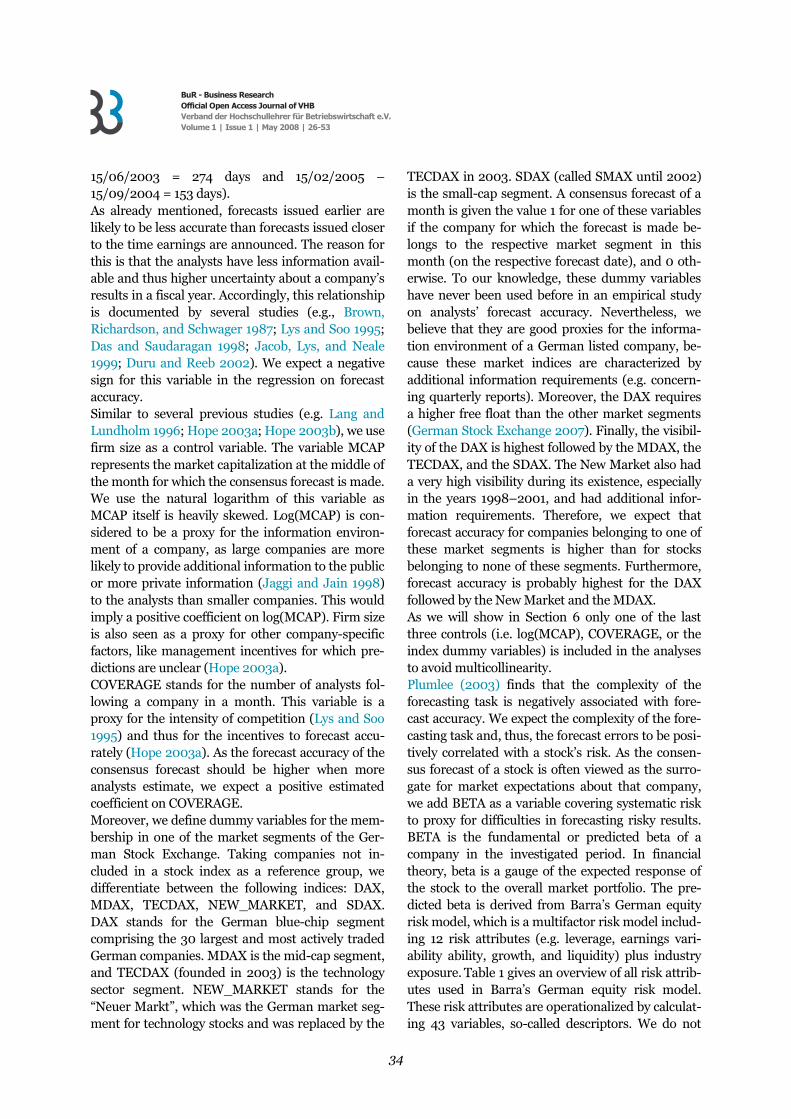
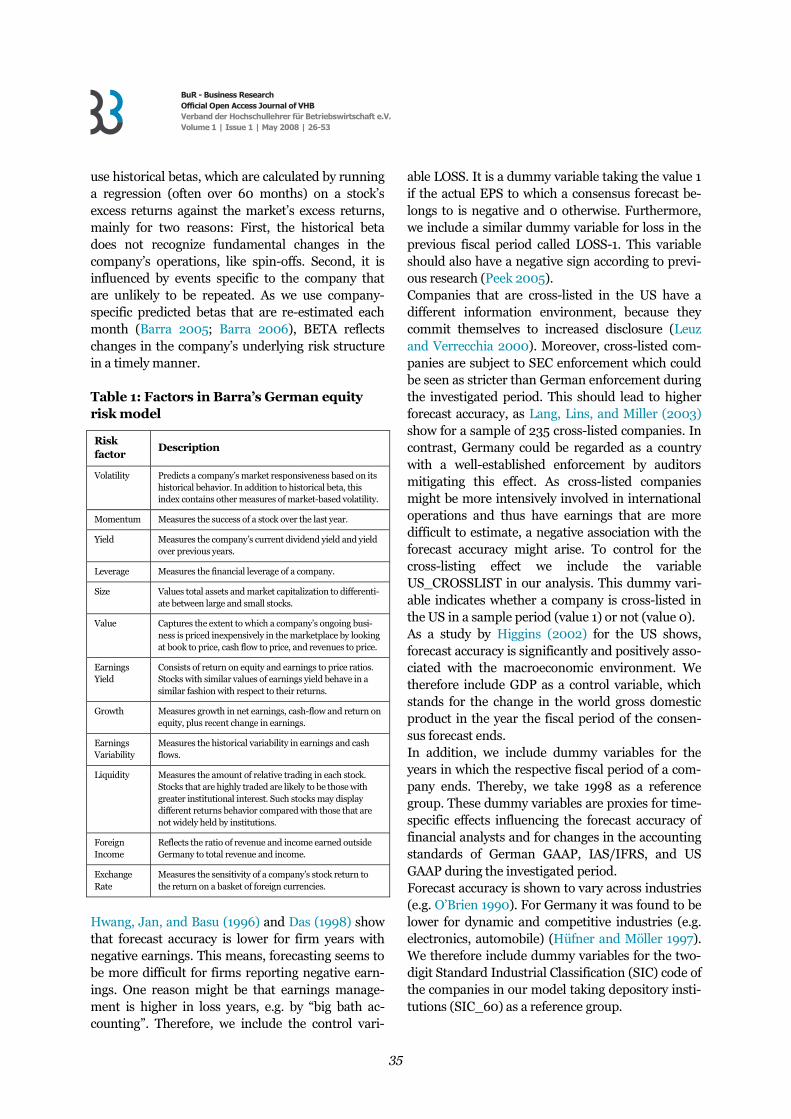
TECDAX in 2003. SDAX (called SMAX until 2002) is the small-cap segment. A consensus forecast of a month is given the value 1 for one of these variables if the company for which the forecast is made be-longs to the respective market segment in this month (on the respective forecast date), and 0 oth-erwise. To our knowledge, these dummy variables have never been used before in an empirical study on analysts’ forecast accuracy. Nevertheless, we believe that they are good proxies for the informa-tion environment of a German listed company, be-cause these market indices are characterized by additional information requirements (e.g. concern-ing quarterly reports). Moreover, the DAX requires a higher free float than the other market segments (German Stock Exchange 2007). Finally, the visibil-ity of the DAX is highest followed by the MDAX, the TECDAX, and the SDAX. The New Market also had a very high visibility during its existence, especially in the years 1998–2001, and had additional infor-mation requirements. Therefore, we expect that forecast accuracy for companies belonging to one of these market segments is higher than for stocks belonging to none of these segments. Furthermore, forecast accuracy is probably highest for the DAX followed by the New Market and the MDAX. As we will show in Section 6 only one of the last three controls (i.e. log(MCAP), COVERAGE, or the index dummy variables) is included in the analyses to avoid multicollinearity. Plumlee (2003) finds that the complexity of the forecasting task is negatively associated with fore-cast accuracy. We expect the complexity of the fore-casting task and, thus, the forecast errors to be posi-tively correlated with a stock’s risk. As the consen-sus forecast of a stock is often viewed as the surro-gate for market expectations about that company, we add BETA as a variable covering systematic risk to proxy for difficulties in forecasting risky results. BETA is the fundamental or predicted beta of a company in the investigated period. In financial theory, beta is a gauge of the expected response of the stock to the overall market portfolio. The pre-dicted beta is derived from Barra’s German equity risk model, which is a multifactor risk model includ-ing 12 risk attributes (e.g. leverage, earnings vari-ability ability, growth, and liquidity) plus industry exposure. Table 1 gives an overview of all risk attrib-utes used in Barra’s German equity risk model. These risk attributes are operationalized by calculat-ing 43 variables, so-called descriptors. We do not
BuR - Business Research Official Open Access Journal of VHB Verband der Hochschullehrer für Betriebswirtschaft e.V. Volume 1 | Issue 1 | May 2008 | 26-53
35
use historical betas, which are calculated by running a regression (often over 60 months) on a stock’s excess returns against the market’s excess returns, mainly for two reasons: First, the historical beta does not recognize fundamental changes in the company’s operations, like spin-offs. Second, it is influenced by events specific to the company that are unlikely to be repeated. As we use company-specific predicted betas that are re-estimated each month (Barra 2005; Barra 2006), BETA reflects changes in the company’s underlying risk structure in a timely manner. Table 1: Factors in Barra’s German equity risk model
Hwang, Jan, and Basu (1996) and Das (1998) show that forecast accuracy is lower for firm years with negative earnings. This means, forecasting seems to be more difficult for firms reporting negative earn-ings. One reason might be that earnings manage-ment is higher in loss years, e.g. by “big bath ac-counting”. Therefore, we include the control vari-
able LOSS. It is a dummy variable taking the value 1 if the actual EPS to which a consensus forecast be-longs to is negative and 0 otherwise. Furthermore, we include a similar dummy variable for loss in the previous fiscal period called LOSS-1. This variable should also have a negative sign according to previ-ous research (Peek 2005). Companies that are cross-listed in the US have a different information environment, because they commit themselves to increased disclosure (Leuz and Verrecchia 2000). Moreover, cross-listed com-panies are subject to SEC enforcement which could be seen as stricter than German enforcement during the investigated period. This should lead to higher forecast accuracy, as Lang, Lins, and Miller (2003) show for a sample of 235 cross-listed companies. In contrast, Germany could be regarded as a country with a well-established enforcement by auditors mitigating this effect. As cross-listed companies might be more intensively involved in international operations and thus have earnings that are more difficult to estimate, a negative association with the forecast accuracy might arise. To control for the cross-listing effect we include the variable US_CROSSLIST in our analysis. This dummy vari-able indicates whether a company is cross-listed in the US in a sample period (value 1) or not (value 0). As a study by Higgins (2002) for the US shows, forecast accuracy is significantly and positively asso-ciated with the macroeconomic environment. We therefore include GDP as a control variable, which stands for the change in the world gross domestic product in the year the fiscal period of the consen-sus forecast ends. In addition, we include dummy variables for the years in which the respective fiscal period of a com-pany ends. Thereby, we take 1998 as a reference group. These dummy variables are proxies for time-specific effects influencing the forecast accuracy of financial analysts and for changes in the accounting standards of German GAAP, IAS/IFRS, and US GAAP during the investigated period. Forecast accuracy is shown to vary across industries (e.g. O’Brien 1990). For Germany it was found to be lower for dynamic and competitive industries (e.g. electronics, automobile) (Hüfner and Möller 1997). We therefore include dummy variables for the two-digit Standard Industrial Classification (SIC) code of the companies in our model taking depository insti-tutions (SIC_60) as a reference group.
Risk factor
Description
Volatility Predicts a company’s market responsiveness based on its historical behavior. In addition to historical beta, this index contains other measures of market-based volatility.
Momentum Measures the success of a stock over the last year.
Yield Measures the company’s current dividend yield and yield over previous years.
Leverage Measures the financial leverage of a company.
Size Values total assets and market capitalization to differenti-ate between large and small stocks.
Value Captures the extent to which a company’s ongoing busi-ness is priced inexpensively in the marketplace by looking at book to price, cash flow to price, and revenues to price.
Earnings Yield
Consists of return on equity and earnings to price ratios. Stocks with similar values of earnings yield behave in a similar fashion with respect to their returns.
Growth Measures growth in net earnings, cash-flow and return on equity, plus recent change in earnings.
Earnings Variability
Measures the historical variability in earnings and cash flows.
Liquidity Measures the amount of relative trading in each stock. Stocks that are highly traded are likely to be those with greater institutional interest. Such stocks may display different returns behavior compared with those that are not widely held by institutions.
Foreign Income
Reflects the ratio of revenue and income earned outside Germany to total revenue and income.
Exchange Rate
Measures the sensitivity of a company’s stock return to the return on a basket of foreign currencies.
BuR - Business Research Official Open Access Journal of VHB Verband der Hochschullehrer für Betriebswirtschaft e.V. Volume 1 | Issue 1 | May 2008 | 26-53
36
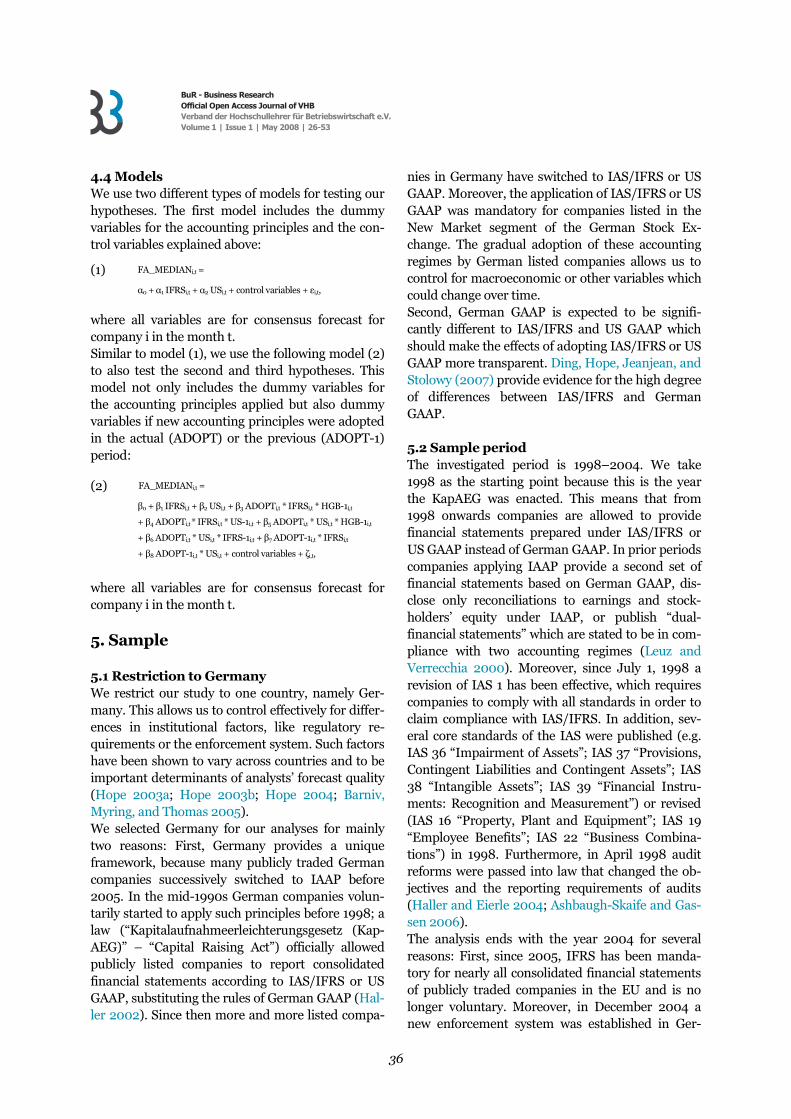
4.4 Models We use two different types of models for testing our hypotheses. The first model includes the dummy variables for the accounting principles and the con-trol variables explained above:
(1) FA_MEDIANi,t =
α0 + α1 IFRSi,t + α2 USi,t + control variables + εi,t,
where all variables are for consensus forecast for company i in the month t. Similar to model (1), we use the following model (2) to also test the second and third hypotheses. This model not only includes the dummy variables for the accounting principles applied but also dummy variables if new accounting principles were adopted in the actual (ADOPT) or the previous (ADOPT-1) period:
(2) FA_MEDIANi,t =
β0 + β1 IFRSi,t + β2 USi,t + β3 ADOPTi,t * IFRSi,t * HGB-1i,t
+ β4 ADOPTi,t * IFRSi,t * US-1i,t + β5 ADOPTi,t * USi,t * HGB-1i,t
+ β6 ADOPTi,t * USi,t * IFRS-1i,t + β7 ADOPT-1i,t * IFRSi,t
+ β8 ADOPT-1i,t * USi,t + control variables + ζi,t,
where all variables are for consensus forecast for company i in the month t.
5. Sample
5.1 Restriction to Germany We restrict our study to one country, namely Ger-many. This allows us to control effectively for differ-ences in institutional factors, like regulatory re-quirements or the enforcement system. Such factors have been shown to vary across countries and to be important determinants of analysts’ forecast quality (Hope 2003a; Hope 2003b; Hope 2004; Barniv, Myring, and Thomas 2005). We selected Germany for our analyses for mainly two reasons: First, Germany provides a unique framework, because many publicly traded German companies successively switched to IAAP before 2005. In the mid-1990s German companies volun-tarily started to apply such principles before 1998; a law (“Kapitalaufnahmeerleichterungsgesetz (Kap-AEG)” – “Capital Raising Act”) officially allowed publicly listed companies to report consolidated financial statements according to IAS/IFRS or US GAAP, substituting the rules of German GAAP (Hal-ler 2002). Since then more and more listed compa-
nies in Germany have switched to IAS/IFRS or US GAAP. Moreover, the application of IAS/IFRS or US GAAP was mandatory for companies listed in the New Market segment of the German Stock Ex-change. The gradual adoption of these accounting regimes by German listed companies allows us to control for macroeconomic or other variables which could change over time. Second, German GAAP is expected to be signifi-cantly different to IAS/IFRS and US GAAP which should make the effects of adopting IAS/IFRS or US GAAP more transparent. Ding, Hope, Jeanjean, and Stolowy (2007) provide evidence for the high degree of differences between IAS/IFRS and German GAAP.
5.2 Sample period The investigated period is 1998–2004. We take 1998 as the starting point because this is the year the KapAEG was enacted. This means that from 1998 onwards companies are allowed to provide financial statements prepared under IAS/IFRS or US GAAP instead of German GAAP. In prior periods companies applying IAAP provide a second set of financial statements based on German GAAP, dis-close only reconciliations to earnings and stock-holders’ equity under IAAP, or publish “dual-financial statements” which are stated to be in com-pliance with two accounting regimes (Leuz and Verrecchia 2000). Moreover, since July 1, 1998 a revision of IAS 1 has been effective, which requires companies to comply with all standards in order to claim compliance with IAS/IFRS. In addition, sev-eral core standards of the IAS were published (e.g. IAS 36 “Impairment of Assets”; IAS 37 “Provisions, Contingent Liabilities and Contingent Assets”; IAS 38 “Intangible Assets”; IAS 39 “Financial Instru-ments: Recognition and Measurement”) or revised (IAS 16 “Property, Plant and Equipment”; IAS 19 “Employee Benefits”; IAS 22 “Business Combina-tions”) in 1998. Furthermore, in April 1998 audit reforms were passed into law that changed the ob-jectives and the reporting requirements of audits (Haller and Eierle 2004; Ashbaugh-Skaife and Gas-sen 2006). The analysis ends with the year 2004 for several reasons: First, since 2005, IFRS has been manda-tory for nearly all consolidated financial statements of publicly traded companies in the EU and is no longer voluntary. Moreover, in December 2004 a new enforcement system was established in Ger-
BuR - Business Research Official Open Access Journal of VHB Verband der Hochschullehrer für Betriebswirtschaft e.V. Volume 1 | Issue 1 | May 2008 | 26-53
37
many which could have an impact on the forecast accuracy of financial analysts. In addition, for fiscal years beginning on or after April 2004 revisions of IFRS 3 “Business Combinations” and of IAS 36 “Impairment of Assets” requiring the impairment-only approach for goodwill is effective. This could have an impact on the forecast accuracy as well. During the period of investigation several rule changes have also taken place: For example, under US GAAP SFAS 141 “Business Combinations” and SFAS 142 “Goodwill and Other Intangible Assets” were issued in 2001 and under IAS/IFRS a revised version of IAS 39 was issued in 2000. On the one hand, these new standards aim at improving the decision usefulness of financial statements and, therefore, should lead to a higher forecast accuracy. On the other hand, the higher complexity of the new standards (especially of the new goodwill impair-ment test under US GAAP) as well as the adoption effects might lead to an opposite effect. Under Ger-man GAAP the Transparency Act (Transparenz- und Publizitätsgesetz, TransPuG), which was issued in July 2002, abolished the option to include tax-induced accounting practices in the consolidated accounts (§ 308 III HGB was deleted) which could also have a positive impact on the transparency of financial statements and thus on forecast accuracy. To control for the impacts of rule changes we in-
clude dummies for the respective years in our analy-ses. Our study is based on IBES monthly EPS analyst consensus forecasts from 1998 to 2004. We investi-gate companies, which are classified as German-based companies by IBES and listed at a German stock exchange. To ensure that the financial analysts had the last financial statements available for the forecast of the EPS of the current fiscal period we only take consensus forecasts that were published not more than one year before the report date. 5.3 Variables and data sources Table 2 provides details of the variables used in the analysis and their sources. Data for calculating the dependent variable are from IBES (analysts’ con-sensus forecasts, actual earnings, share price as a deflator). Actual earnings under German GAAP are DVFA adjusted, i.e. they are before certain special items defined by the DVFA, and for IAS/IFRS and US GAAP they are before extraordinary items. The type of accounting principles applied is hand col-lected from the annual reports of the companies as we found several missing or even mistakable entries in Datastream. The time when the forecast is made and also the fiscal year end are provided by IBES as well as the market value of companies and the number of analysts following.
Table 2: Overview of variables and of data sources
Variable(s) Explanation Data source
Variable(s) Explanation Data source
FA_MEDIAN
Negative value of the absolute difference between the actual EPS and the monthly consensus analyst forecast scaled by the stock price at the middle of the forecast month in % (winsorized at the 99th percentile).
IBES BETA Predicted beta of a company at the beginning of the month calculated from a multifactor model.
BARRA
HGB, IFRS, US
(HGB-1, IFRS-1, US-1)
Dummy variables indicating that the month belongs to a fiscal period (a fiscal period following a fiscal period) in which the respective accounting principles were applied. German GAAP (variable HGB) serves as a reference group for the variables IFRS and US. HGB-1, IFRS-1, and US-1 are only used for the interaction terms in model (2).
Hand-collected from annual reports
LOSS (LOSS-1)
Dummy variable indicating that the month belongs to a fiscal period (a fiscal period following the fiscal period) in which a loss occurred.
Based on data from IBES
ADOPT (ADOPT-1)
Dummy variable indicating that the month belongs to a fiscal period (a fiscal period following the fiscal period) in which new accounting principles were adopted.
Based on hand-collected data from annual reports
US_CROSSLIST Dummy variable indicating a cross-listing in the US.
EDGAR database of the SEC
TIME Time period (in days) between announcement of the consensus forecast and announcement of the actual EPS.
IBES GDP Change in the world gross domestic product (in percent) in the year to which the respective month belongs to.
Interna-tional Monetary Fund
Log(MCAP) Natural logarithm of the market capitalization (in million EUROs) at the middle of the forecast month.
IBES YEAR_1999, ..., YEAR_2004
Year to which the respective month belongs to (with 1998 as a reference group).
IBES
COVERAGE Number of analysts following. IBES
DAX, MDAX, TECDAX, NEW_MARKET, SDAX
Dummy variables for the market segments of the German Stock Exchange (with companies belonging to no index as a reference group).
Based on data from the Ger-man Stock Exchange
SIC_14, ..., SIC_96
51 dummy variables for the two-digit SIC code of the industry a company belongs to (with SIC_60 as a reference group).
Datastream

BuR - Business Research Official Open Access Journal of VHB Verband der Hochschullehrer für Betriebswirtschaft e.V. Volume 1 | Issue 1 | May 2008 | 26-53
38
Data for membership of one of the capital market segments (DAX, MDAX, TECDAX, NEW_MAR-KET, SDAX) is assigned by hand to the observations based on a list on the composition of these indices provided by the German Stock Exchange. The pre-dicted BETA is from Barra and the LOSS dummy variables are calculated from the actual earnings provided by IBES. The data for the cross-listing of companies (US_CROSSLIST) are taken from the EDGAR database of the SEC. GDP data are from the International Monetary Fund and the SIC codes from Datastream.
5.4 Sample selection The whole sample of consensus forecasts for Ger-man listed companies from 1998–2004 for a maxi-mum time period of one year ahead and for which the actual EPS (in EURO or Deutsche Mark4) and the report date are available from IBES consists of 28,552 observations. We exclude observations that are not based on consolidated accounts or where the type of accounting principles applied could not be determined (2,136). We also deleted observations where the fiscal year is not equal to 365 or 366 days (1,437). Moreover, we eliminated observations where one or more independent variables are not available (2,520). To avoid selection bias, we do not follow previous studies by eliminating observations with fiscal years that do not end on December 31. We end up with a final sample of 22,459 monthly consensus forecasts for 591 companies. This is a considerably larger sample than the one used by Daske (2005) who examined the forecast accuracy for a sample of at most 13,929 observations depend-ing on the model used.
4 The observations which were denoted in Deutsche Mark were translated into EURO with the official exchange rate of 1,95583 Deutsche Mark per EURO.
6. Descriptive statistics Table 3 presents some descriptive statistics for the analysts’ forecast accuracy data and the numeric control variables. The mean of the forecast error (i.e. the negative of the forecast accuracy as defined above) for the overall sample is –14.80% of the stock price with a standard deviation of 41.83%. The average time period between the date of the an-nouncement of the consensus forecast and the an-nouncement of the actual EPS is 172 days. The mar-ket capitalization of the companies investigated is between 1 million and 271,452 million EURO, with a mean of 2,721 million EURO. The coverage of ana-lysts ranges between 1 and 49 with a mean of 9.64 and a median of 5. The mean of the predicted betas is 0.8624, the median 0.8110.5 Finally, the world gross domestic product change had a mean of 3.73% and median of 3.70% during the period 1998–2004. Moreover, we examine the difference of the vari-ables for observations based on different accounting regimes. Referring to hypothesis 1, we focus on the differences between HGB and the international accounting regimes IAS/IFRS and US GAAP. Table 4 provides the results of this comparison. As can be seen from the table, tests for equality of means and Wilcoxon rank sum tests indicate that all variables of the HGB sample are significantly different from the sample of companies applying international accounting regimes. While TIME, MCAP, COVER-AGE, BETA, and the number of LOSS observations are higher for the sample of IAS/IFRS and US GAAP observations than for the sample of HGB observations, for the forecast accuracy FA_ME-DIAN the relationship is the other way round.
5 The mean beta weighted with the market capitalization of the company is 0.9539. This indicates that our sample is a good proxy for the market portfolio which, reconciled with the Capital Asset Pricing Model, is expected to have a weighted beta of 1.
Table 3: Descriptive statistics
Mean Median Minimum Maximum Std. Dev.
FA_MEDIAN -14.80 -1.89 -290.10 0 41.83 TIME 172 168 1 365 101.76 MCAP 2,721 162 1 271,452 10,214 COVERAGE 9.64 5 1 49 10.34 BETA 0.8624 0.8110 -0.1480 1.9730 0.3722 GDP 3.73 3.70 2.60 5.30 0.97
For a description of the variables see Table 2.

BuR - Business Research Official Open Access Journal of VHB Verband der Hochschullehrer für Betriebswirtschaft e.V. Volume 1 | Issue 1 | May 2008 | 26-53
39
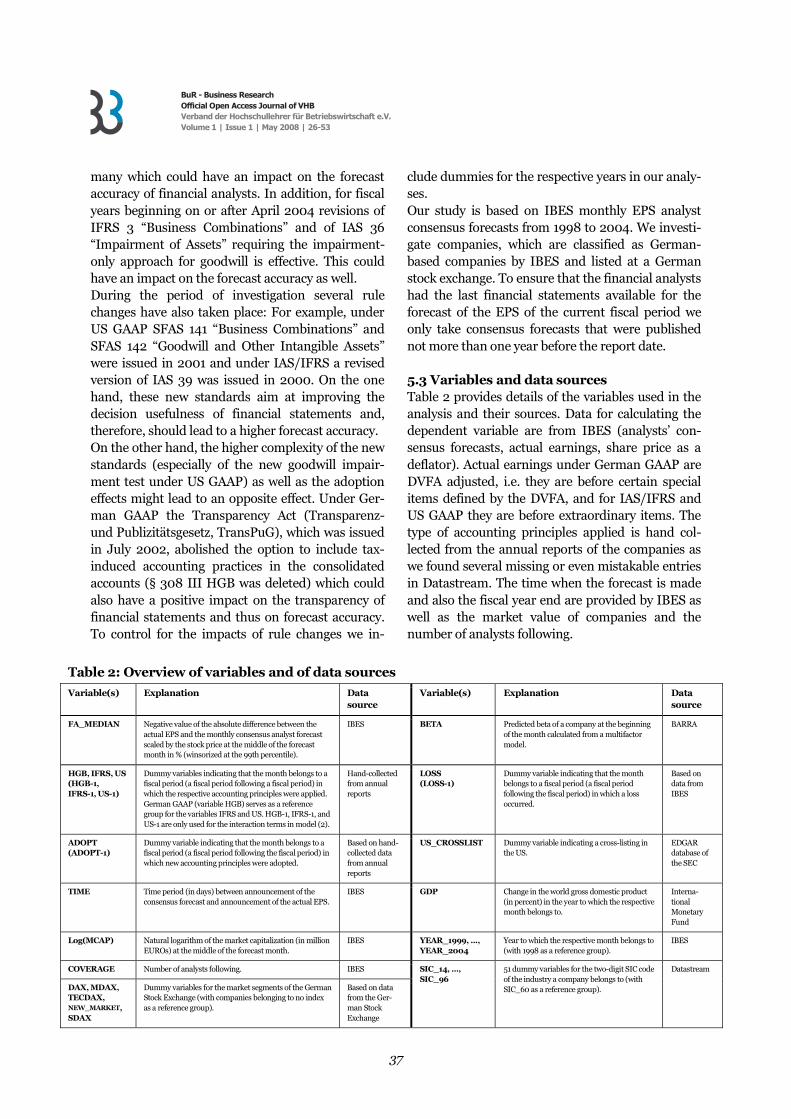
To analyze the difference in more detail, Table 5 presents the means of the most important variables for the years and accounting regimes. The number of observations based on German GAAP decreases, while the number of observations based on IAS/IFRS increases until 2001 and is nearly con-stant afterwards. For US GAAP, the number of ob-servations increases from 143 in 1998 to 1,442 in 2001 and decreases afterwards. The means of TIME, MCAP, and COVERAGE are similar across all years and accounting principles. Exceptions are the US GAAP and in particular the IAS observations in 1998 and 1999. In these years, large companies with high analyst coverage, in par-ticular, applied IAS and US GAAP. The means for the forecast accuracy and the predicted betas are significantly different between the three accounting regimes. German GAAP companies reveal lower betas than IAS/IFRS or US GAAP companies for the entire sample period. This confirms the results in Table 4. The forecast accuracy is, particularly for the years 2001–2003, higher for estimates based on GAAP than for those based on IAAP, whereas for the years 1998 and 1999 the relationship is the other way around. The higher overall forecast accuracy for German GAAP observations could suggest that the forecast accuracy is higher for German GAAP than for IAS/IFRS or US GAAP, but more of the observa-tions based on IAS/IFRS (34.26%) and US GAAP (44.82%) refer to LOSS years than observations based on German GAAP (16.07%) and – as stated
above – losses are shown to be more difficult to estimate. In addition, companies applying IAS /IFRS and US GAAP on average are more risky than companies applying German GAAP as measured by their BETA, which is shown to make the forecast more difficult. This relationship holds for each year investigated and the difference is shown to be sig-nificant in Table 4. Moreover, the industry distribu-tion is different between companies applying Ger-man GAAP and those applying IAS/IFRS or US GAAP. Finally, the observations based on IAS/IFRS or US GAAP could be biased by adoption effects, which are controlled for in model (2) of the multi-variate analyses. Table 6 depicts the correlations between the vari-ables. As expected, forecast accuracy is positively correlated with the market capitalization of a com-pany (MCAP), number of analysts following the stock (COVERAGE), and with the economic situa-tion expressed by the change in the gross domestic product in a year (GDP). Consistently, the type of market segment of the German Stock Exchange (INDEX) is also positively correlated with forecast accuracy which means that forecast accuracy is higher for companies in “higher” stock segments, i.e. in the DAX than for companies in the MDAX, TECDAX, or other indices. The Spearman correla-tion indicates that forecast accuracy decreases as the forecast horizon measured by the time period be-tween the announcement of the consensus forecast and the announcement of the actual EPS increases.
Table 4: Differences between variables for HGB observations and IAS/IFRS as well as US GAAP observations
Total HGB IAS/IFRS and US GAAP
Total
t-statistics Z-statistics
FA_MEDIAN -9.1166 (16.08) *** (-15.45) *** -17.6137 -14.8049 TIME 170 (-2.22) ** (-2.16) ** 173 172 MCAP 2,408 (-2.96) *** (-16.66) *** 2,876 2,721 COVERAGE 9.10 (-5.69) *** (-5.88) *** 9.90 9.64 BETA 0.6253 (-81.97) *** (-69.38) *** 0.9795 0.8624 LOSS obs. 1,193 (16.07%) (-38.10) *** (-33.83) *** 5,750 (38.24%) 6,943 (30.91%) N 7,424 15,035 22,459
The table shows the means of different variables. For a description of the variables see Table 2. The figures in brackets are t-statistics (test for equality of means without assuming equal variances) and tie-adjusted Z-statistics (Wilcoxon rank sum test). *, **, and *** indicate significance at the 10%, 5%, and 1% levels, respectively. N is the number of observations.
BuR - Business Research Official Open Access Journal of VHB Verband der Hochschullehrer für Betriebswirtschaft e.V. Volume 1 | Issue 1 | May 2008 | 26-53
40
Moreover, there is a negative relationship of the forecast accuracy with the complexity of the fore-casting task measured by the predicted beta (BETA). These correlations are consistent with the predictions for these variables. Among the control
variables, MCAP and COVERAGE, MCAP and IN-DEX, as well as INDEX and COVERAGE reveal the highest correlations. To avoid multicollinearity, we use three specifications for each model in which only one of these three control variables is included.
Table 5: Descriptive statistics for the years and accounting principles applied
Year AP FA_MEDIAN TIME MCAP COVERAGE BET LOSS obs. N
HGB -3.9015 (14.52) 172 (101) 1,695 (7,317) 9.41 (10.31) 0.6048 (0.2370) 231 (11.01%) 2,098 1998 IAS -0.9212 (1.24) 168 (102) 10,745 (16,498) 22.56 (12.43) 0.8368 (0.1989) 0 (0.00%) 272 US -1.6104 (2.65) 161 (99) 5,237 (15,075) 13.70 (11.96) 0.7422 (0.1779) 23 (16.08%) 143 HGB -10.1114 (39.14) 171 (101) 2,686 (16,519) 9.96 (9.22) 0.6204 (0.2409) 182 (11.18%) 1,628 1999 IAS -2.5049 (6.63) 170 (101) 5,958 (12,329) 15.64 (12.05) 0.8103 (0.2207) 39 (6.16%) 633 US -2.9292 (6.22) 164 (100) 4,756 (14,777) 13.43 (10.50) 0.8598 (0.2209) 98 (28.16%) 348 HGB -9.8308 (32.98) 172 (103) 3,092 (15,018) 8.19 (9.20) 0.6413 (0.2930) 221 (16.67%) 1,326 2000 IAS -9.9474 (34.38) 170 (102) 3,894 (12,666) 8.55 (9.54) 0.9084 (0.2951) 476 (37.01%) 1,286 US -12.0189 (39.74) 175 (103) 2,969 (9,323) 7.91 (7.93) 0.9572 (0.2982) 395 (43.99%) 898 HGB -11.7312 (32.24) 161 (99) 2,118 (9,290) 8.98 (9.15) 0.6692 (0.2630) 209 (22.02%) 949 2001 IFRS -23.4805 (50.17) 174 (103) 2,362 (8,417) 8.65 (10.07) 1.0852 (0.3457) 992 (50.38%) 1,969 US -20.5169 (41.70) 176 (103) 2,662 (10,264) 8.78 (9.45) 1.1982 (0.3521) 860 (59.64%) 1,442 HGB -21.6588 (55.97) 168 (99) 2,159 (7,798) 9.75 (10.31) 0.6890 (0.3912) 220 (36.07%) 610 2002 IFRS -43.9995 (74.66) 164 (96) 1,694 (5,460) 9.74 (11.11) 0.9893 (0.3701) 889 (50.03%) 1,777 US -27.7034 (57.94) 164 (95) 2,292 (8,931) 9.94 (10.73) 1.1338 (0.3589) 578 (48.09%) 1,202 HGB -8.5188 (27.43) 170 (102) 2,843 (9,749) 8.68 (9.45) 0.5545 (0.2957) 72 (16.67%) 432 2003 IFRS -14.8287 (40.29) 179 (104) 1,864 (4,541) 9.55 (10.90) 0.8193 (0.3550) 472 (29.30%) 1,611 US -10.4549 (28.48) 180 (105) 2,550 (8,336) 9.87 (10.74) 0.9938 (0.3471) 392 (41.00%) 956 HGB -5.1814 (11.38) 173 (105) 3,394 (11,431) 6.56 (9.46) 0.5717 (0.2680) 58 (15.22%) 381 2004 IFRS -7.1164 (23.19) 181 (104) 2,103 (4,841) 9.51 (10.07) 0.8729 (0.3587) 339 (18.70%) 1,813 US -5.9259 (15.21) 183 (105) 4,326 (11,899) 10.47 (11.10) 1.0439 (0.3493) 197 (28.76%) 685 HGB -9.1166 (32.44) 170 (101) 2,408 (11,989) 9.10 (9.68) 0.6253 (0.2743) 1,193 (16.07%) 7,424
Total IAS/IFRS -18.7843 (48.25) 173 (102) 2,797 (8,485) 10.04 (10.91) 0.9300 (0.3519) 3,207 (34.26%) 9,361
US -15.6823 (40.48) 174 (102) 3,007 (10,291) 9.69 (10.18) 1.0611 (0.3536) 2,543 (44.82%) 5,674
TOTAL -14.8049 (41.83) 172 (102) 2,721 (10,214) 9.64 (10.34) 0.8624 (0.3722) 6,943 (30.91%) 22,459
The table shows the means of different variables. For a description of the variables see Table 2. AP means type of accounting principles applied and N number of observations. The figures in brackets represent the standard deviation, except for LOSS obs. (for which we report the percentage of observations with a negative net income).

BuR - Business Research Official Open Access Journal of VHB Verband der Hochschullehrer für Betriebswirtschaft e.V. Volume 1 | Issue 1 | May 2008 | 26-53
41
7. Regression results Table 7 presents the regression results for model (1). As we include either Log(MCAP), COVERAGE, or the index dummies as control variables in the model, we report the results of three different speci-fication of this model, i.e. (1a)-(1c). To control effec-tively for the panel data structure of our sample, we report standard errors clustered by firm in the table (Petersen 2007). Consistent with hypothesis 1, in all three models the accounting principles dummies (IFRS and US) are positively and significantly (at least at the 1% level for US GAAP and at least at the 5% level for IAS/IFRS) related to forecast accuracy. These findings suggest that the forecast accuracy of financial analysts varies across accounting princi-ples. Assuming that financial analysts have incen-tives to provide accurate forecasts the accuracy seems to be higher for IFRS and US GAAP based observations than for German GAAP-based obser-vations which served as a reference group in the analysis. Our results are similar to those from Ashbaugh and Pincus (2001). However, contrary to the findings of Daske (2005) we provide evidence of higher forecast accuracy for IAAP in Germany. These differences might be due to the use of differ-ent samples and/or methodologies. We additionally test the hypothesis that forecast accuracy is equal for IFRS and US GAAP by using a
Wald coefficient test of the equality of the two coef-ficients of IFRS and US. For all three models, the test shows that the hypothesis is rejected (with F-statistics of 9.31, 10.96, and 6.39 for models (1a), (1b), and (1c), respectively). This indicates that ap-plying US GAAP results in a higher forecast accu-racy than IFRS. The coefficients of the control variables TIME, BETA, LOSS, and LOSS-1 have the expected sign implying that forecast accuracy is higher for obser-vations with a shorter time period before EPS an-nouncement, with a lower predicted beta and with no loss in the actual or previous year. In contrast to the results of Lang, Lins, and Miller (2003), US_CROSSLIST has a negative sign, but is only significant in models (1a) and (1b). GDP is signifi-cant (at least at the 10% level) in all three models. This result is consistent with the prediction and with the result of Higgins (2002). The alternative control variables Log(MCAP), COV-ERAGE, and the index dummies have positive coef-ficients and are highly significant in the respective models. The only exception is the dummy for the SDAX for which the forecast accuracy is not signifi-cantly different to the reference group, i.e. observa-tions from companies not included in any stock-market index.
Table 6: Correlations
FA
_M
ED
IAN
HG
B
IFR
S
US
AD
OP
T
AD
OP
T-1
TIM
E
MC
AP
CO
VE
RA
GE
IND
EX
BE
TA
GD
P
FA_MEDIAN 0.096 -0.080 -0.012 0.002 0.036 0.005 0.082 0.178 0.193 -0.293 0.111 HGB 0.103 -0.594 -0.409 -0.187 -0.200 -0.015 -0.022 -0.037 0.022 -0.448 -0.127 IFRS -0.028 -0.594 -0.492 0.189 0.162 0.007 0.006 0.033 0.015 0.154 0.119 US -0.080 -0.409 -0.492 -0.012 0.033 0.008 0.016 0.003 -0.040 0.310 0.002 ADOPT 0.066 -0.187 0.189 -0.012 -0.090 -0.012 0.046 0.088 0.100 -0.035 -0.026 ADOPT-1 0.064 -0.200 0.162 0.033 -0.090 -0.012 0.066 0.062 0.065 -0.018 0.026 TIME -0.114 -0.014 0.007 0.008 -0.012 -0.012 0.016 0.054 0.019 -0.007 0.035 MCAP 0.492 0.111 -0.042 -0.073 0.092 0.090 0.050 0.537 0.415 0.065 0.024 COVERAGE 0.303 -0.039 0.007 0.034 0.085 0.072 0.058 0.697 0.822 0.055 -0.037 INDEX 0.315 0.057 -0.011 -0.049 0.088 0.065 0.014 0.718 0.741 -0.071 0.059 BETA -0.255 -0.463 0.174 0.304 -0.029 -0.012 -0.002 -0.215 0.075 -0.096 -0.064 GDP 0.113 -0.115 0.115 -0.006 -0.017 0.036 0.033 0.130 -0.040 0.085 -0.074
This table shows Pearson correlation coefficients above and Spearman correlation coefficients below the diagonal. For a description of the variables see Table 2. Bold numbers indicate a significant difference from zero at the 5% level (based on a two-tailed test). To concisely provide a general direction of the correlation of INDEX with other variables, we numbered the INDEX dummy variables (1: no index, 2: SDAX, 3: NEW_MARKET, 4: TecDAX, 5: MDAX, 6: DAX) to obtain a single INDEX variable.

BuR - Business Research Official Open Access Journal of VHB Verband der Hochschullehrer für Betriebswirtschaft e.V. Volume 1 | Issue 1 | May 2008 | 26-53
42
The dummies for the years (which are not tabu-lated) indicate that the forecast accuracy is worst for the year 2002 after the stock-market bubble had burst and many companies reported (unexpected) reductions in earnings. The year with the highest level of forecast accuracy is 1998, which serves as a reference year in the analysis. For the industry dummies, which are also not reported in Table 7, forecast accuracy is significantly higher than the reference group for the food (SIC_20), wood (SIC_24), and furniture (SIC_25) industries as well
as for merchandize stores (SIC_53) and significantly lower for the motion-picture industry (SIC_78). This is in line with the results from Hüfner and Möller (1997). The adjusted R2 is relatively high in comparison to other studies investigating the determinants of fi-nancial analysts’ forecast accuracy (e.g. Daske 2005 with adjusted R2 between 5.16% and 8.32% depend-ing on the model). A reason might be the use of novel variables, like the predicted beta which – to
Table 7: Regression results for models (1a)-(1c)
Variable Exp. sign Model (1a) Model (1b) Model (1c)
Intercept +/- -34.5303 0.9659 4.8782 (-5.22) *** (0.18) (0.94) IFRSt + 4.0223 4.8116 4.2926 (H1) (2.05) ** (2.35) *** (2.12) ** USt + 10.9675 12.5291 10.1942 (H1) (4.37) *** (4.69) *** (3.83) *** TIMEt - -0.0073 -0.0046 -0.0031 (-2.89) *** (-1.86) ** (-1.26) Log(MCAPt) + 5.7082 (9.90) *** COVERAGEt + 0.4667 (5.73) *** DAXt + 10.1541 (3.99) *** MDAXt + 2.8500 (1.90) ** TECDAXt + 10.0750 (3.12) *** NEW_MARKETt + 17.9628 (5.79) *** SDAXt + -2.4246 (-1.14) BETAt - -21.6880 -22.1947 -22.1784 (-6.78) *** (-6.48) *** (-6.52) *** LOSSt - -22.3708 -26.7435 -27.6939 (-9.99) *** (-11.20) *** (-11.61) *** LOSS-1t - -1.4515 -4.7360 -5.1576 (-0.53) (-1.67) ** (-1.83) ** US_CROSSLISTt +/- -12.4066 -4.7748 -2.2202 (-4.77) *** (-1.91) * (-0.79) GDPt + 1.9405 2.5819 2.5832 (1.30) * (1.72) ** (1.72) ** Year dummies +/- Yes Yes Yes Industry dummies +/- Yes Yes Yes Observations 22,459 22,459 22,459 Firms 591 591 591 Adjusted R² 29.75% 26.50% 26.95%
The table shows the regression results for model (1) as described in the text, i.e. the coefficients of the variables and the t-statistics (standard errors clustered by firm) in brackets below. For a description of the variables see Table 2. The dependent variable is the analysts’ forecast accuracy based on the median consensus forecasts (FA_MEDIAN). Industry dummy variables and year dummy variables are included in all models but not reported. *, **, and *** indicate significance at the 10%, 5%, and 1% levels, respectively. Test statistics are one-tailed if the expected sign is one-sided and two-tailed otherwise.
BuR - Business Research Official Open Access Journal of VHB Verband der Hochschullehrer für Betriebswirtschaft e.V. Volume 1 | Issue 1 | May 2008 | 26-53
43
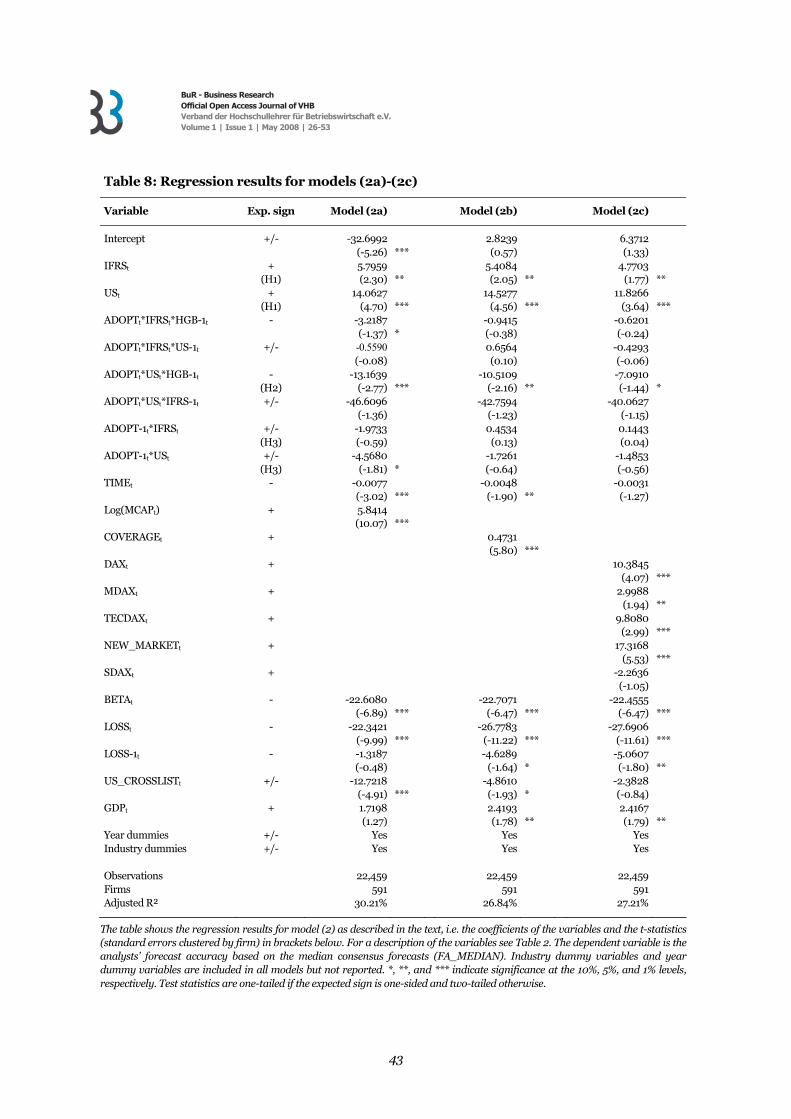
Table 8: Regression results for models (2a)-(2c)
Variable Exp. sign Model (2a) Model (2b) Model (2c)
Intercept +/- -32.6992 2.8239 6.3712 (-5.26) *** (0.57) (1.33) IFRSt + 5.7959 5.4084 4.7703 (H1) (2.30) ** (2.05) ** (1.77) ** USt + 14.0627 14.5277 11.8266 (H1) (4.70) *** (4.56) *** (3.64) *** ADOPTt*IFRSt*HGB-1t - -3.2187 -0.9415 -0.6201 (-1.37) * (-0.38) (-0.24) ADOPTt*IFRSt*US-1t +/- -0.5590 0.6564 -0.4293 (-0.08) (0.10) (-0.06) ADOPTt*USt*HGB-1t - -13.1639 -10.5109 -7.0910 (H2) (-2.77) *** (-2.16) ** (-1.44) * ADOPTt*USt*IFRS-1t +/- -46.6096 -42.7594 -40.0627 (-1.36) (-1.23) (-1.15) ADOPT-1t*IFRSt +/- -1.9733 0.4534 0.1443 (H3) (-0.59) (0.13) (0.04) ADOPT-1t*USt +/- -4.5680 -1.7261 -1.4853 (H3) (-1.81) * (-0.64) (-0.56) TIMEt - -0.0077 -0.0048 -0.0031 (-3.02) *** (-1.90) ** (-1.27) Log(MCAPt) + 5.8414 (10.07) *** COVERAGEt + 0.4731 (5.80) *** DAXt + 10.3845 (4.07) *** MDAXt + 2.9988 (1.94) ** TECDAXt + 9.8080 (2.99) *** NEW_MARKETt + 17.3168 (5.53) *** SDAXt + -2.2636 (-1.05) BETAt - -22.6080 -22.7071 -22.4555 (-6.89) *** (-6.47) *** (-6.47) *** LOSSt - -22.3421 -26.7783 -27.6906 (-9.99) *** (-11.22) *** (-11.61) *** LOSS-1t - -1.3187 -4.6289 -5.0607 (-0.48) (-1.64) * (-1.80) ** US_CROSSLISTt +/- -12.7218 -4.8610 -2.3828 (-4.91) *** (-1.93) * (-0.84) GDPt + 1.7198 2.4193 2.4167 (1.27) (1.78) ** (1.79) ** Year dummies +/- Yes Yes Yes Industry dummies +/- Yes Yes Yes Observations 22,459 22,459 22,459 Firms 591 591 591 Adjusted R² 30.21% 26.84% 27.21%
The table shows the regression results for model (2) as described in the text, i.e. the coefficients of the variables and the t-statistics (standard errors clustered by firm) in brackets below. For a description of the variables see Table 2. The dependent variable is the analysts’ forecast accuracy based on the median consensus forecasts (FA_MEDIAN). Industry dummy variables and year dummy variables are included in all models but not reported. *, **, and *** indicate significance at the 10%, 5%, and 1% levels, respectively. Test statistics are one-tailed if the expected sign is one-sided and two-tailed otherwise.

BuR - Business Research Official Open Access Journal of VHB Verband der Hochschullehrer für Betriebswirtschaft e.V. Volume 1 | Issue 1 | May 2008 | 26-53
44
Table 9: Regression results for models (2a)-(2c) using aggregated data
Variable Exp. sign Model (2a) Model (2b) Model (2c) aggregated aggregated aggregated
Intercept +/- -23.1610 11.1178 14.1724 (-3.11) *** (1.59) (2.06) ** IFRSt + 7.4502 6.8605 6.3381 (H1) (2.64) *** (2.30) ** (2.08) ** USt + 16.1983 16.5845 13.6800 (H1) (4.96) *** (4.77) *** (3.88) *** ADOPTt*IFRSt*HGB-1t - -4.2710 -1.9214 -1.7374 (-1.60) * (-0.70) (-0.60) ADOPTt*IFRSt*US-1t +/- 0.6493 1.3848 -0.0177 (0.10) (0.21) (0.00) ADOPTt*USt*HGB-1t - -16.4251 -13.7932 -10.0408 (H2) (-3.06) *** (-2.50) *** (-1.82) ** ADOPTt*USt*IFRS-1t +/- -46.3720 -42.3178 -39.2372 (-1.33) (-1.21) (-1.11) ADOPT-1t*IFRSt +/- -2.5044 -0.1861 -0.4530 (H3) (-0.77) (-0.06) (-0.14) ADOPT-1t*USt +/- -7.1962 -4.3945 -4.1854 (H3) (-2.45) ** (-1.41) (-1.38) TIMEt - -0.0585 -0.0582 -0.0471 (-1.90) ** (-1.81) ** (-1.49) * Log(MCAPt) + 5.7674 (9.38) *** COVERAGEt + 0.5533 (5.86) *** DAXt + 11.4323 (3.98) *** MDAXt + 3.6224 (2.21) ** TECDAXt + 12.0880 (3.33) *** NEW_MARKETt + 18.1248 (4.93) *** SDAXt + -2.6919 (-1.12) BETAt - -24.9404 -25.4776 -25.0322 (-6.78) *** (-6.45) *** (-6.30) *** LOSSt - -22.0877 -26.0161 -26.9576 (-9.91) *** (-11.08) *** (-11.43) *** LOSS-1t - -1.5068 -4.5817 -5.0928 (-0.54) (-1.57) * (-1.75) ** US_CROSSLISTt +/- -12.3034 -5.7817 -2.5684 (-4.37) *** (-2.07) ** (-0.82) GDPt + 1.9811 2.8533 2.7190 (1.37) * (1.93) ** (1.86) ** Year dummies +/- Yes Yes Yes Industry dummies +/- Yes Yes Yes Observations 2,104 2,104 2,104 Firms 591 591 591 Adjusted R² 31.47% 28.21% 28.47%
The table shows the regression results using yearly aggregated data for model (2) as described in the text, i.e. the coefficients of the variables and the t-statistics (standard errors clustered by firm) in brackets below. Aggregated data are means except for the index dummies and US_CROSSLIST which are modes. For a description of the variables see Table 2. The dependent variable is the analysts’ forecast accuracy based on the median consensus forecasts (FA_MEDIAN). Industry dummy variables and year dummy variables are included in all models but not reported. *, **, and *** indicate significance at the 10%, 5%, and 1% levels, respectively. Test statistics are one-tailed if the expected sign is one-sided and two-tailed otherwise.

BuR - Business Research Official Open Access Journal of VHB Verband der Hochschullehrer für Betriebswirtschaft e.V. Volume 1 | Issue 1 | May 2008 | 26-53
45
our knowledge – have not been included in an analysis before. Table 8 shows the regression results for model (2), again for three different specifications. The interac-tion term indicating that a company that previously reported under German GAAP has switched to US GAAP (ADOPTt*USt*HGB-1t) is significant (at least at the 10% level) in all three specifications of model (2) and negatively related to forecast accuracy. The interaction term for a change from German GAAP to IFRS in the respective period (ADOPTt
*IFRSt*HGB-1t) is only significant in specification (2a) at the 10% level but not in the other specifica-tions. The other interaction terms indicating a change in the respective period are not significant at any conventional level in any specification of model (2). These results suggest that according to our hy-pothesis 2 the forecast accuracy of periods in which a company switched from German GAAP to US GAAP is lower than in other years. However, we do not find an effect such as this for a change from IFRS to US GAAP or for adoptions of IFRS regard-less of the previous accounting principles. Model (2) also provides evidence for the third hy-pothesis. As can be seen from the results, the coeffi-cients of the interactions terms ADOPT-1t*IFRSt und ADOPT-1t*USt indicating the year after the adoption of IFRS or US GAAP are not significant at any conventional level (with one exception for speci-fication (2a) with a weak significance at the 10% level). This means that the forecast accuracy in the second year of applying IAS/IFRS or US GAAP is not significantly different to that of other periods (except for the periods of adoption). Consequently, financial analysts seem to incur difficulties in modi-fying their prediction models in the first year of the application of US GAAP, but learn to cope with the new information basis from the second year on-wards. The results for the control variables are very similar to those of the first model.
8. Sensitivity analyses In the following we report results of sensitivity tests and robustness checks aimed at increasing the con-fidence in our main empirical results. We first evaluate whether our results hold when using firm-yearly observations instead of firm-monthly obser-vations. Next, we examine the impact of self-selection on our results. Finally, we explore the sen-sitivity of the main analyses to variable specifica-
tions. Here we only report the results for models (2a)-(2c) as all hypotheses can be answered by them, and models (1a)-(1c) do not lead to different conclusions regarding any variable employed.
8.1 Aggregated yearly data The sample of the previous analysis includes multi-ple observations per firm year while the main vari-ables of interest (i.e. IFRS, US, ADOPT, and ADOPT-1) are firm-year specific. In the following, we investigate whether the results also hold when an aggregated sample with firm-yearly observations instead of firm-monthly observations is used. This aggregated sample encompasses 2,104 firm-year observations. The results of estimating models (1) and (2) for this aggregated sample are qualitatively the same as in our main analyses shown (the results for specifica-tions (2a)-(2c) are depicted in Table 9). The dummy variables IFRS and US are positive and significant at least at the 5% level in all models. Moreover, hy-pothesis (2) is supported, because the interaction term (ADOPTt*USt*HGB-1t) has a significantly negative coefficient in all specifications of model (2). Similar to the main analysis, in specification (2a) the interaction term ADOPTt*IFRSt*HGB1t is signifi-cantly negative at the 10% level. Regarding the year after adoption of IAAP, the interaction term ADOPT-1t*IFRSt is no longer significant as expected (hypothesis 3). However, the interaction term ADOPT-1t*USt in model (2a) is significantly nega-tive at the 5% level. The coefficients of the control variables are very similar to those of the main analy-ses in terms of sign and significance.
8.2 Self-selection In a further sensitivity test, we examine the issue of self-selection. Our methodological approach in-volves assessing the relationship of analysts’ forecast accuracy and the type of accounting regime applied. Since we are investigating voluntary or quasi-voluntary adopters of IAS/IFRS and US GAAP the type of accounting principles applied are endoge-nous choice variables. However, the exogenous determinants of the choice of the accounting regime could also affect the forecast accuracy of analysts. If these determinants are not (fully) included in our models, then the dummy variables for the type of accounting regime applied are correlated with the true (but not observed) error term which leads to a

BuR - Business Research Official Open Access Journal of VHB Verband der Hochschullehrer für Betriebswirtschaft e.V. Volume 1 | Issue 1 | May 2008 | 26-53
46
correlated omitted variable problem. This so-called self-selection bias is addressed by other studies about the voluntary adoption of international ac-counting regimes in different means. While Gassen and Sellhorn (2006) use a propensity score match-ing procedure to determine a matched sample, other studies (Leuz and Verrecchia 2000; Hung and Subramanyam 2007) apply a two-stage model fol-lowing Heckman (1979). In our study, we also apply a two-stage model where in the first stage the pro-pensity of companies to switch to an international accounting regime is estimated and in the second stage the Inverse Mills Ratio (IMR), which is calcu-lated from the results of the first stage, is included in our regression. Following the prior studies that also apply a two-stage model, we predict that the decision of compa-nies to adopt IAAP depends on a company’s size, profitability, ownership structure, capital intensity, leverage, degree of foreign sales, listing in the New Market as well as on the number of years a company is listed and on whether it is cross-listed or not. Consequently, we estimate the following probit model: (3) US_IFRSi,y =
γ0 + γ1 log(MCAPi,y) + γ2 ROAi,y + γ3 OWNi,y + γ4 CAPINTi,y
+ γ5 LEVERAGEi,y + γ6 FOREIGNi,y + γ7 NEW_MARKETi,y
+ γ8 Y_LISTEDi,y + γ9 US_CROSSLISTi,y + year dummies
+ industry dummies + ηi,y,
where for company i and year y US_IFRS is a dummy variable indicating the use of IAAP, log(MCAP) is the natural logarithm of the market value of equity, ROA is the return on assets, OWN is the percentage of closely held shares, CAPINT is the capital intensity (long-term assets divided by total assets), LEVERAGE is the leverage, FOREIGN is the percentage of foreign sales, NEW_MARKET is a dummy variable indicating if the company is listed at the New Market, Y_LISTED is the number of years a company is listed at the stock exchange, and US_CROSSLIST is a dummy for indicating whether the company is cross-listed in the US or not. All data for variables not previously introduced in section 5.3 are from Datastream. The results from estimating this model are depicted in Table 10. The additional data requirements leave us with a reduced sample of 1,247 yearly observa-tions (in comparison to the 2,104 observations in the aggregated models). The variables log(MCAP),
ROA, OWN, CAPINT, and NEW_MARKET are significant (at least at the 5% level) in explaining the decision of companies to apply IAS/IFRS or US GAAP. The dummies for the respective years (which are not tabulated) are all significantly positive (at the 1% level). More specifically, they become gradu-ally more and more significant over time: Taking 1998 as a reference group, the z-statistic of 1999 is 3.83 compared to 11.54 for 2004). The McFadden R2 of the model (36.58%) is considerably high in comparison to other studies (e.g. Leuz 2003 with 29.3% and 7.7% for 1999 and 2000, respectively).
Table 10: Regression results for the pro-pensity of applying IAS/IFRS and US GAAP
Variable Exp. sign Coefficient
(z-statistics)
Intercept +/- -1.0374 (-1.92) * Log(MCAPy) + 0.0974 (1.82) ** ROAy +/- -0.0137 (-2.23) ** OWNy - -0.0069 (-2.11) ** CAPINTy - -0.0125 (-2.38) *** LEVERAGEy + -0.0031 (-0.64) FOREIGNy + 0.0039 (1.24) NEW_MARKETy + 0.9015 (1.70) ** Y_LISTEDy +/- -0.0092 (-0.89) US_CROSSLISTy + -0.1713 (-0.61) Year dummies +/- Yes Industry dummies +/- Yes Observations 1,247 Firms 389 McFadden R² 36.58%
The table shows the regression results, i.e. the coefficients of the variables and the z-statistics (standard errors clustered by firm) in brackets below, for model (3) as described in the text. The dependent variable is a dummy variable indicating the application of an international accounting regime (IAS/IFRS or US GAAP). Industry dummy variables (only for the one-digit SIC code due to the lower number of obser-vations) and year dummy variables are included in all models but not reported. *, **, and *** indicate significance at the 10%, 5%, and 1% levels, respectively.

BuR - Business Research Official Open Access Journal of VHB Verband der Hochschullehrer für Betriebswirtschaft e.V. Volume 1 | Issue 1 | May 2008 | 26-53
47
Table 11: Regression results for models (2a)–(2c) including the Inverse Mills Ratio
Variable Exp. sign Model (2a) Model (2b) Model (2c) with IMR with IMR with IMR
Intercept +/- -14.6578 10.3315 10.3905 (-1.50) (1.19) (1.17) IMRt +/- -0.4707 -4.7434 -3.0724 (-0.14) (-1.44) (-0.89) IFRSt + -0.7836 -1.6486 -0.9147 (H1) (-0.36) (-0.73) (-0.39) USt + 10.5468 9.1725 8.2753 (H1) (3.46) *** (2.91) *** (2.52) *** ADOPTt*IFRSt*HGB-1t - 2.0943 3.2586 2.5831 (0.92) (1.42) (1.05) ADOPTt*IFRSt*US-1t +/- 6.1046 4.0564 3.2727 (0.68) (0.45) (0.37) ADOPTt*USt*HGB-1t - -12.8951 -11.8634 -9.8492 (H2) (-1.92) ** (-1.75) ** (-1.42) * ADOPTt*USt*IFRS-1t +/- -63.6207 -58.9799 -56.3192 (-1.69) * (-1.50) (-1.43) ADOPT-1t*IFRSt +/- -1.0079 0.3252 -0.0617 (H3) (-0.21) (0.06) (-0.01) ADOPT-1t*USt +/- -7.0714 -5.6937 -4.6845 (H3) (-2.47) ** (-1.96) * (-1.56) TIMEt - -0.0045 -0.0039 -0.0021 (-1.69) ** (-1.45) * (-0.79) Log(MCAPt) + 4.1525 (6.39) *** COVERAGEt + 0.4068 (4.74) *** DAXt + 10.9229 (4.01) *** MDAXt + 3.7547 (1.88) ** TECDAXt + 9.5564 (2.62) *** NEW_MARKETt + 11.6146 (2.17) ** SDAXt + 0.8103 (0.37) BETAt - -14.3777 -16.8708 -16.8654 (-4.40) *** (-4.87) *** (-4.78) *** LOSSt - -24.7961 -28.0818 -28.9042 (-7.81) *** (-8.41) *** (-8.49) *** LOSS-1t - -1.9054 -3.8291 -4.2183 (-0.49) (-0.96) (-1.06) US_CROSSLISTt +/- -8.6084 -3.1902 -1.4082 (-2.95) *** (-1.14) (-0.48) GDPt + 0.3204 1.1839 1.0394 (0.18) (0.65) (0.56) Year dummies +/- Yes Yes Yes Industry dummies +/- No No No Observations 13,611 13,611 13,611 Firms 389 389 389 Adjusted R² 28.48% 25.98% 25.92%
The table shows the regression results, i.e. the coefficients of the variables and the t-statistics (standard errors clustered by firm) in brackets below, for model (2) as described in the text, but including the Inverse Mills Ratio (IMR) calculated from the probit re-gression in Table 10. The standard errors for the t-statistics are not adjusted according to the Heckman procedure because IMR is not significantly different from zero in any specification (see footnote 6). For a description of the variables see Table 2. The de-pendent variable is the analysts’ forecast accuracy based on the median consensus forecasts (FA_MEDIAN). Year dummy vari-ables are included but not reported, industry dummies are not included due to multicollinearity. *, **, and *** indicate signifi-cance at the 10%, 5%, and 1% levels, respectively. Test statistics are one-tailed if the expected sign is one-sided and two-tailed otherwise.

BuR - Business Research Official Open Access Journal of VHB Verband der Hochschullehrer für Betriebswirtschaft e.V. Volume 1 | Issue 1 | May 2008 | 26-53
48
In the second stage, we include the Inverse Mills Ratio (IMR) calculated from the results of the first stage in our models (1a)–(1c) and (2a)–(2c). We did not include industry dummies due to multicollinear-ity. The results for models (2a)–(2c) are shown in Table 11. Our sample is reduced to 13,611 monthly observations. We test the null hypothesis of a selec-tion bias by conducting a standard t-test on IMR. This is appropriate if the coefficient of IMR is zero (Wooldridge 2002, p. 564) as in our case.6 IMR is not significant at any conventional level in any of the models, which indicates no issue of self-selection. Further, the inclusion of the Inverse Mills Ratio leads to IFRS being no longer significant in all mod-els. However, estimating all models for the reduced sample of 13,611 observations covering 389 firms (for which all data for calculating IMR are available) without including IMR also yields an insignificant coefficient for IFRS (with t-statistics between –0.65 and –0.19 in models (1a)–(1c) and between –0.36 and –0.18 in models (2a)–(2b) for IFRS). This indi-cates that the result of a non-significant coefficient for IFRS is due to the reduction of our sample and not to self-selection. For financial statements under US GAAP the results suggest that forecast accuracy is clearly higher than for HGB even in this reduced sample and after controlling for self-selection. Basi-cally, the coefficients for the other variables are qualitatively similar to those in the main analyses. One exception is the coefficient of the interaction term indicating the second year of applying US GAAP (ADOPT-1t*USt) which is significantly nega-tive in specifications (2a) and (2b). We also tested for self-selection using aggregated data (see Section 8.1) and by running the regres-sions including IMR for each of the respective years using model specifications (1a)–(1c). Again, we did not find any significance of IMR (with only one exception of a weak significance at the 10% level for specification (1b) in 1999). We therefore conclude that our results are not affected by self-selection.
8.3 Further sensitivity analyses To assess the sensitivity of the results to the de-pendent variable, we re-estimate all models using
6 As IMR is not significantly different from zero in any of our model specifications, we do not adjust the standard errors in our regressions (e.g. according to Maddala 1983, pp. 252-256), because an adjustment is not necessary in this case (Wooldridge 2002, p. 565).
FA_MEAN based on the mean consensus forecasts alternatively. The inferences do not change. IFRS and US are significantly positive for all models with t-statistics between 1.70 and 2.22 for IFRS and be-tween 3.57 and 4.61 for US GAAP for specifications (2a)–(2c). The interaction term indicating a switch from HGB to US GAAP is significantly negative (with t-statistics between –2.82 and –1.39). As consensus forecasts based on one or two esti-mates only could be biased, we assess the impact of excluding observations with a number of analysts following smaller than three. This restricts our sam-ple to 15,660 observations. Re-estimating both models for this sub-sample shows that IFRS is no longer or only weakly significant (with t-statistics for specifications (2a)–(2c) between 1.08 and 1.44), but the other inferences do not change. Finally, we also perform the tests winsorizing the dependent variable at –100% and not at the 99th percentile. We find higher adjusted R2 (between 37.74% and 41.36% for models (1a)–(1c) and be-tween 38.01% and 41.76% for models (2a)–(2c)). The coefficients in the regressions are very similar to those in the main analyses. In summary, the sensitivity analyses indicate that the results are not driven by the use of monthly or yearly data, by self-selection issues, by the type of dependent variable used or by the treatment of out-liers. However, the forecast accuracy for financial statements under IAS/IFRS in comparison to those under HGB seems to be sensitive to the sample size. In both sensitivity analyses in which several obser-vations are excluded (self-selection and use of ob-servations with at least three analysts following) the dummy IFRS was no longer significant. The results for US GAAP observations are robust even when the sample size is reduced.
9. Conclusions This paper assesses the influence of different ac-counting principles and of a change from domestic to internationally accepted accounting principles on the financial analysts’ forecast accuracy in Germany. It contributes to prior research by investigating (1) the forecast accuracy of financial analysts based on data from applying different accounting principles and (2) the impact of a change of accounting prin-ciples on the forecast accuracy. Our results suggest that the forecast accuracy is higher for estimates based on IAS/IFRS or US GAAP data than for fore-

BuR - Business Research Official Open Access Journal of VHB Verband der Hochschullehrer für Betriebswirtschaft e.V. Volume 1 | Issue 1 | May 2008 | 26-53
49
casts based on German GAAP data. Moreover, in years of the adoption of new accounting principles the forecast accuracy is lower when a company has switched from German GAAP to US GAAP. This does not hold for other types of switches (from German GAAP to IFRS, from US GAAP to IFRS, or from IFRS to US GAAP). In the year after the adop-tion of a new accounting regime the forecast accu-racy is no longer significantly different to other pe-riods (except for periods of adoption). This suggests a learning effect of the analysts. The sensitivity analyses show that our results hold when we use yearly instead of monthly observations and when we control for self-selection of companies. When the sample is reduced due to additional data requirements in the sensitivity analyses, the forecast accuracy for IAS/IFRS observations seems to be no longer significantly different to that for German GAAP observations However, our conclusions re-garding US GAAP are unchanged. Germany provides a unique framework for these analyses because many publicly traded German companies successively switched to IAAP before 2005 and the national GAAP is significantly differ-ent to IAS/IFRS and US GAAP. These facts allow us to examine the influences of the type of accounting principles applied and of a change of the accounting principles besides other control variables used in previous studies on analysts’ forecast accuracy in a homogenous institutional context. Furthermore, it enables us to control for macroeconomic and other variables that could change over time. The German experience, especially in shifting to IAS/IFRS, pro-vides useful insights in what we could expect for publicly traded companies in other European coun-tries, which changed to IFRS in 2005. There are several limitations of this study: First, as forecast accuracy of financial analysts is influenced by many factors, low forecast errors do not neces-sarily translate to high accounting quality and our results do not necessarily imply that accounting information from IAAP is more useful to financial analysts. For example, the assumption that financial analysts have an incentive to provide accurate fore-casts could be violated for our sample. If the incen-tives differ between analysts providing estimates for IAAP companies and other analysts providing esti-mates for German GAAP companies, our results could be (partly) due to the incentives and not to the different properties of the accounting regimes. Sec-ond, we focus on Germany only. Therefore, the find-
ings of the paper may not be generalized to other countries. Third, we do not disentangle the reasons for the higher forecast accuracy of IAS/IFRS- and US GAAP-based forecasts in comparison to German GAAP-based forecasts. Thus, further research is needed to examine whether additional disclosures or properties of the recognition or measurement rules between the accounting regimes, analysts’ abilities of interpreting financial statements under IAAP, or different manager-driven influences in terms of earnings management or expectations management are the decisive factors. Finally, the sample period is 1998–2004. In this period, the adoption of IAS/IFRS or US GAAP was – except for requirements of certain stock segments a company seeks to be included, e.g. the new market – volun-tary. The mandatory adoption of IFRS since 2005 might have different effects on forecast accuracy. Moreover, the accuracy of IFRS-based forecasts for the period after 2004 might have changed as impor-tant standards of the IFRS were revised (e.g. im-pairment-only approach for goodwill) and a new enforcement system was established in Germany.
Acknowledgments The paper has benefited from comments from Sebastian Lobe and participants of the 30th Annual Congress of the European Accounting Association in Lisbon. The comments from two anonymous refe-rees were especially helpful. Moreover, we wish to thank Barra, Inc. for providing the data on predicted betas and the Honors program of the University of Regensburg for its general support. All remaining errors are the authors’ alone.
References Abarbanell, Jeffery and Reuven Lehavy (2003): Biased Fore-casts or Biased Earnings? The Role of Reported Earnings in Explaining Apparent Bias and Over-/Underreaction in Ana-lysts’ Earnings Forecasts, Journal of Accounting and Econom-ics, 36 (1–3): 105–146.
Acker, Daniella, Jo Horton, and Ian Tonks (2002): Accounting Standards and Analysts’ Forecasts: The Impact of FRS3 on Analysts’ Ability to Forecast EPS, Journal of Accounting & Public Policy, 21 (3): 193–217.
Alford, Andrew W. and Philip G. Berger (1999): A Simultane-ous Equations Analysis of Forecast Accuracy, Analyst Follow-ing, and Trading Volume, Journal of Accounting, Auditing & Finance, 14 (3): 219–240.
Ang, James S. and Stephen J. Ciccone (2001): International Differences in Analyst Forecast Properties, Working paper, Florida State University and University of New Hampshire.

BuR - Business Research Official Open Access Journal of VHB Verband der Hochschullehrer für Betriebswirtschaft e.V. Volume 1 | Issue 1 | May 2008 | 26-53
50
Ashbaugh, Hollis and Morton Pincus (2001): Domestic Ac-counting Standards, International Accounting Standards, and the Predictability of Earnings, Journal of Accounting Re-search, 39 (3): 417–434.
Ashbaugh-Skaife, Hollis and Joachim Gassen (2006): Can Audit Reforms Change the Monitoring Role of Audits? Evi-dence from the German Audit Market, Working paper, Uni-versity of Wisconsin and University of Berlin.
Auer, Kurt V. (1996): Capital Market Reactions to Earnings Announcements: Empirical Evidence on the Difference in the Information Content of IAS-based Earnings and EC-Direc-tives-based Earnings, The European Accounting Review, 5 (4): 587–623.
Baldwin, Bruce A. (1984): Segment Earnings Disclosure and the Ability of Security Analysts to Forecast Earnings per Share, The Accounting Review, 59 (3): 376–389.
Bamber, Linda S. and Younsoon S. Cheon (1998): Dis-cretionary Management Earnings Forecast Disclosures: Ante-cedents and Outcomes Associated with Forecast Venue and Forecast Specificity Choices, Journal of Accounting Research, 36 (2): 167–190.
Bannister, James W. and Harry A. Newman (1996): Accrual Usage to Manage Earnings toward Financial Analysts’ Fore-casts, Review of Quantitative Finance and Accounting, 7 (3): 259–278.
Barniv, Ran, Mark J. Myring, and Wayne B. Thomas (2005): The Association between the Legal and Financial Reporting Environments and Forecast Performance of Individual Ana-lysts, Contemporary Accounting Research, 22 (4): 727–758.
Barra (2005): United States equity risk model handbook, Berkeley.
Barra (2006): German equity risk model handbook, Berkeley.
Barron, Orie E., Charles O. Kile, and Terrence B. O’Keefe (1999): MD&A Quality as Measured by the SEC and Analysts' Earnings Forecasts, Contemporary Accounting Research, 16 (1): 75–109.
Barron, Orie E., Oliver Kim, Steve C. Lim, and Douglas E. Stevens (1998): Using Analysts’ Forecasts to Measure Proper-ties of Analysts’ Information Environment, The Accounting Review, 73 (4): 421–433.
Barth, Mary E., Wayne R. Landsman, and Mark Lang (2008): International Accounting Standards and Accounting Quality, Working paper, Stanford University, Journal of Accounting Research, 46 (3): 467-498.
Bartov, Eli and Gordon M. Bodnar (1996): Alternative Ac-counting Methods, Information Asymmetry and Liquidity: Theory and Evidence, The Accounting Review, 71 (3): 397–418.
Bartov, Eli, Dan Givoly, and Carla Hayn (2002): The Rewards to Meeting or Beating Earnings Expectations, Journal of Accounting and Economics, 33 (2): 173–204.
Bartov, Eli, Stephen R. Goldberg, and Myungsun Kim (2005): Comparative Value Relevance among German, U.S., and International Accounting Standards: A German Stock Market Perspective, Journal of Accounting, Auditing & Finance, 20 (2): 95–119.
Basu, Sudipta, LeeSeok Hwang, and Ching-Lih Jan (1998): International Variation in Accounting Measurement Rules and Analysts’ Earnings Forecast Errors, Journal of Business Fi-nance & Accounting, 25 (9/10): 1207–1247.
Bartov, Eli, Dan Givoly, and Carla Hayn (2002): The Rewards of Meeting or Beating Earnings Expectations, Journal of Accounting and Economics, 33 (2): 173–204.
Bartov, Eli, Stephen R. Goldberg, and Myungsun Kim (2005): Comparative Value Relevance among German, U.S., and International Accounting Standards: A German Stock Market Perspective, Journal of Accounting, Auditing & Finance, 20 (2): 95–119.
Basu, Sudipta, LeeSeok Hwang, and Ching-Lih Jan (1998): International Variation in Accounting Measurement Rules and Analysts’ Earnings Forecast Errors, Journal of Business Fi-nance & Accounting, 25 (9/10): 1207–1247.
Beckman, Judy, Christina Brandes, and Brigitte Eierle (2007): German Reporting Practices: An Analysis of Reconciliations from German Commercial Code to IFRS or US GAAP, Ad-vances in International Accounting, 20: 253–294.
Behn, Bruce K., Nancy B. Nichols, and Donna L. Street (2002): The Predictive Ability of Geographic Segment Disclosures by U.S. Companies: SFAS No. 131 vs. SFAS No. 14, Journal of International Accounting Research, 1 (1): 31–44.
Bessler, Wolfgang and Matthias Stanzel (2007): Qualität und Effizienz der Gewinnprognosen von Analysten – Eine em-pirische Untersuchung für den deutschen Kapitalmarkt, Kredit und Kapital, 40 (1): 89–129.
Brown, Lawrence D. (1983): Accounting Changes and the Accuracy of Analysts` Earnings Forecasts, Journal of Account-ing Research, 21 (2): 432–443.
Brown, Lawrence D., Gordon D. Richardson, and Steven J. Schwager (1987): An Information Interpretation of Financial Analyst Superiority, Journal of Accounting Research, 25 (1): 49–67.
Burgstahler, David and Michael Eames (2006): Management of Earnings and Analysts' Forecasts to Achieve Zero and Small Positive Earnings Surprises, Journal of Business Finance and Accounting, 33 (5–6): 633–652.
Cairns, David (2006): The Use of Fair Value in IFRS, Account-ing in Europe, 3 (1): 5–22.
Capstaff, John, Krishna Paudyal, and William Rees (1998): Analysts’ Forecasts of German Firms’ Earnings: A Compara-tive Analysis, Journal of International Financial Management & Accounting, 9 (2): 83–116.
Chang, James J., Tarun Khanna, and Krishna Palepu (2000): Analyst Activity around the World, Working paper, University of Pennsylvania and Harvard Business School.
Clement, Michael B. (1999): Analyst Forecast Accuracy: Do Ability, Resources and Portfolio Complexity Matter?, Journal of Accounting & Economics, 27 (3): 285–303.
Clement, Michael B., Lynn Rees, and Edward B. Swanson (2003): The Influence of Culture and Corporate Governance on the Characteristics that Distinguish Superior Analysts, Journal of Accounting, Auditing, and Finance, 18 (4): 593–618.
Cuijpers, Rick and Willem Buijink (2005): Voluntary Adoption of Non-local GAAP in the European Union: A Study of Deter-minants and Consequences, European Accounting Review, 14 (3): 487–524.
Das, Somnath (1998): Financial Analysts’ Earnings Forecasts for Loss Firms, Managerial Finance, 24 (6): 39–50.
Das, Somnath and Shahrokh M. Saudagaran (1998): Accuracy, Bias, and Dispersion in Analysts’ Earnings Forecasts: the Case of Cross-listed Foreign Firms, Journal of International Finan-cial Management and Accounting, 9 (1): 16–33.
Das, Somnath, Carolyn B. Levine, and Kartik K. Siva-ramakrishnan (1998): Earnings Predictability and Bias in Analysts’ Earnings Forecasts, The Accounting Review, 73 (2): 277–294.
BuR - Business Research Official Open Access Journal of VHB Verband der Hochschullehrer für Betriebswirtschaft e.V. Volume 1 | Issue 1 | May 2008 | 26-53
51
Daske, Holger (2005): Adopting International Financial Reporting standards in the European Union: Empirical Essays on Causes, Effects and Economic Consequences, Frankfurt/Main.
Daske, Holger (2006): Economic Benefits of Adopting IFRS or US-GAAP – Have the Expected Cost of Equity Capital Really Decreased?, Journal of Business Finance & Accounting, 33 (3/4): 329–373.
Daske, Holger and Günther Gebhardt (2006): International Financial Reporting Standards and Experts’ Perceptions of Disclosure Quality, Abacus, 42 (3/4): 461–498.
Dechow, Patricia M., Richard G. Sloan, and Amy P. Hutton (1996): Causes and Consequences of Earnings Manipulation: An Analysis of Firms Subject to Enforcement Actions by the SEC, Contemporary Accounting Research, 13 (1): 1–36.
Degeorge, Francois, Jayendu Patel, and Richard Zeckhauser (1999): Earnings Management to Exceed Thresholds, The Journal of Business, 72 (1): 1–34.
Ding, Yuan, Ole K. Hope, Thomas Jeanjean, and Hervé Stolowy (2007): Differences between Domestic Accounting Standards and IAS: Measurement, Determinants and Implica-tions, Journal of Accounting and Public Policy, 26 (1): 1–38.
Duru, Augustine and David M. Reeb (2002): International Diversification and Analysts’ Forecast Accuracy and Bias, The Accounting Review, 77 (2): 415–434.
Easterwood, John C. and Stacey R. Nutt (1999): Inefficiency in Analysts’ Earnings Forecasts: Systematic Misreaction or Sys-tematic Optimism?, Journal of Finance, 54 (5): 1777–1797.
El Shamy, Mostafa A. and Rashid Al-Qenae (2005): The Change in the Value-relevance of Earnings and Book Values in Equity Valuation over the past 20 Years and the Impact of the Adoption of IASs: The Case of Kuwait, International Journal of Accounting, Auditing and Performance Evaluation, 2 (1–2): 153–167.
Elliott, John A. and Donna R. Philbrick (1990): Accounting changes and earnings predictability, The Accounting Review, 65 (1): 157-174.
Gassen, Joachim and Thorsten Sellhorn (2006): Applying IFRS in Germany: Determinants and Consequences, Betrieb-swirtschaftliche Forschung und Praxis, 58 (4): 365–386.
Gebhardt, William R., Charles M. C. Lee, and Bhaskaran Swaminathan (2001): Toward an Implied Cost of Capital, Journal of Accounting Research, 39 (1): 135–176.
German Stock Exchange (Deutsche Börse) (2007): Guide to the Equity Indices of Deutsche Börse. Version 6.4, Dec. 2007, (http://www.deutsche-boerse.com/dbag/dispatch/en/binary/ gdb_content_pool/imported_files/public_files/10_downloads/50_informations_services/30_Indices_Index_Licensing/21_guidelines/10_share_indices/equity_indices_guide.pdf).
Goncharov, Igor (2005): Earnings Management and its Determinants: Closing Gaps in Empirical Accounting Re-search, Peter Lang: Frankfurt/Main et al.
Gu, Feng and Weimin Wang (2005): Intangible Assets, Infor-mation Complexity, and Analysts’ Earnings Forecasts, Journal of Business Finance & Accounting, 32 (9–10): 1673–1702.
Haller, Axel (2002): Financial Accounting Developments in the European Union: Past Events and Future Prospects, The European Accounting Review, 11 (1): 153–190.
Haller, Axel and Brigitte Eierle (2004): The Adaptation of German Accounting Rules to IFRS: A Legislative Balancing Act, Accounting in Europe, 1 (1): 27–50.
Hand, John R. M. (1990): A Test of the Extended Functional Fixation Hypothesis, The Accounting Review, 65 (4): 740–763.
Harris, Marry S. and Karl A. Muller (1999): The Market Valua-tion of IAS versus US-GAAP Accounting Measures Using Form 20-F Reconciliations, Journal of Accounting and Economics, 26 (1–3): 285–312.
Hayn, Carla (1995): The Information Content of Losses, Jour-nal of Accounting and Economics, 20 (2): 125–153.
Heckman, James J. (1979): Sample Selection Bias as a Specifi-cation Error, Econometrica, 47 (1): 153–161.
Higgins, Huong N. (1998): Analyst Forecasting Performance in Seven Countries, Financial Analysts Journal, 54 (3): 58–62.
Higgins, Huong N. (2002): Analysts’ Forecasts of Japanese Firms’ Earnings: Additional Evidence, The International Journal of Accounting, 37 (4): 371–394.
Holthausen, Robert W., David F. Larcker, and Richard G. Sloan (1995): Annual Bonus Schemes and the Manipulation of Earnings, Journal of Accounting and Economics, 19 (1): 29–74.
Hope, Ole K. (2003a): Disclosure Practices, Enforcement of Accounting Standards, and Analysts’ Forecast Accuracy: An International Study, Journal of Accounting Research, 41 (2): 235–272.
Hope, Ole K. (2003b): Accounting Policy Disclosures and Analysts’ Forecasts, Contemporary Accounting Research, 20 (2): 295–321.
Hope, Ole K. (2004): Variations in the Financial Reporting Environment and Earnings Forecasting, Journal of Interna-tional Financial Management and Accounting, 15 (1): 21–43.
Hüfner, Bernd and Hans P. Möller (1997): Erfolge börsen-notierter Unternehmen aus der Sicht von Finanzanalysten: Zur Verlässlichkeit von DVFA-Ergebnissen und deren Prog-nose, Zeitschrift für Bankrecht und Bankwirtschaft, 9 (1): 1–14.
Hung, Mingyi and Ram K. Subramanyam (2007): Financial statement effects of adopting International Accounting Stan-dards: the case of Germany, Review of Accounting Studies, 12 (4): 623–657.
Hussain, Simon (1998): Lead Indicator Models and UK Ana-lysts Earnings Forecasts, Accounting and Business Research, 28 (4): 271–280.
Hutton, Amy P. (2005): Determinants of Managerial Earnings Guidance Prior to Regulation Fair Disclosure and Bias in Analysts' Earnings Forecasts, Contemporary Accounting Research, 22 (4): 867–914.
Hwang, LeeSeok, Ching-Lih Jan, and Sudipta Basu (1996): Loss Firms and Analysts’ Earnings Forecast Errors, Journal of Financial Statement Analysis, 1 (2): 18–30.
Ijiri, Yuji and James Noel (1984): A Reliability Comparison of the Measurement of Wealth, Income, and Force, The Account-ing Review, 59 (1): 52–63.
Irvine, Paul J. (2004): Analysts’ Forecasts and Brokerage-firm Trading, The Accounting Review, 79 (1): 125–150.
Jacob, John, Thomas Z. Lys, and Margaret A. Neale (1999): Expertise in Forecasting Performance of Security Analysts, Journal of Accounting and Economics, 28 (1): 51–82.
Jaggi, Bikki and Rohit Jain (1998): An Evaluation of Financial Analysts’ Earnings Forecasts for Hong Kong Firms, Journal of International Financial Management and Accounting, 9 (3): 177–200.

BuR - Business Research Official Open Access Journal of VHB Verband der Hochschullehrer für Betriebswirtschaft e.V. Volume 1 | Issue 1 | May 2008 | 26-53
52
Kinnunen, Juha, Jyrki Niskanen, and Eero Kasanen (2000): To whom are IAS Earnings Informative? Domestic versus Foreign Shareholders’ Perspectives, The European Accounting Review, 9 (4): 499–517.
Knutson, Peter H. (1992): Financial Reporting in the 1990s and beyond, Association for Investment Management and Research (AIMR), New York.
Lang, Mark H. and Russel J. Lundholm (1996): Corporate Disclosure Policy and Analyst Behavior, The Accounting Re-view, 71 (4): 467–492.
Lang, Mark H., Karl V. Lins, and Darius P. Miller (2003): ADRs, Analysts, and Accuracy: Does Cross Listing in the United States Improve a Firm’s Information Environment and Increase Market Value?, Journal of Accounting Research, 41 (2): 317–345.
Lennox, Clive S. and Chul W. Park (2006): The informative-ness of earnings and management’s issuance of earnings forecasts, Journal of Accounting and Economics, 42 (3): 439–458.
Leuz, Christian (2003): IAS versus US GAAP: Information Asymmetry-based Evidence from Germany’s New Market, Journal of Accounting Research, 41 (3): 445–472.
Leuz, Christian and Robert E. Verrecchia (2000): The Eco-nomic Consequences of Increased Disclosure, Journal of Accounting Research, 38 (3): 91–124.
Lin, Beixin and Rong Yang (2006): The Effect of Repeat Re-structuring Charges on Analysts’ Forecast Revisions and Accu-racy, Review of Quantitative Finance & Accounting, 27 (3): 267–283.
Lobo, Gerald J., Sung S. Kwon, and Gordian A. Ndubizu (1998): The Impact of SFAS No. 14 Segment Information on the Price Variability and Earnings Forecast Accuracy, Journal of Business Finance & Accounting, 25 (7/8): 969–985.
Lys, Thomas and Lisa G. Soo (1995): Analysts’ Forecast Preci-sion as a Response to Competition, Journal of Accounting, Auditing & Finance, 10 (4): 751–765.
Maddala, Gangadharrao S. (1983): Limited-Dependent and Qualitative Variables in Econometrics, Cambridge University Press: New York.
Markov, Stanimir and Ane Tamayo (2006): Predictability in Financial Analyst Forecast Errors: Learning or Irrationality?, Journal of Accounting Research, 44 (4): 725–761.
Matsumoto, Dawn A. (2002): Management’s Incentives to Avoid Negative Earnings Surprises, The Accounting Review, 77 (3): 483–514.
Mensah, Yaw M., Xiaofei Song, and Simon S.M. Ho (2004): The Effect of Conservatism on Analysts’ Annual Earnings Forecast Accuracy and Dispersion, Journal of Accounting, Auditing & Finance, 19 (2): 159–183.
Mikhail, Michael B., Beverly R. Walther, and Richard H. Willis (1997): Do Security Analysts Improve their Performance with Experience?, Journal of Accounting Research, 35 (3): 131–157.
Niskanen, Jyrki, Juha Kinnunen, and Eero Kasanen (2000): The Value Relevance of IAS Reconciliation Components: Empirical Evidence from Finland, Journal of Accounting & Public Policy, 19 (2): 119–137.
Nobes, Christopher and Robert Parker (1998): Comparative International Accounting, 5th ed., Prentice Hall Europe: London.
O’Brien, Patricia C. (1990): Forecast Accuracy of Individual Analysts in Nine Industries, Journal of Accounting Research, 28 (2): 286–304.
Peek, Erik (2005): The Influence of Accounting Changes on Financial Analysts’ Forecast Accuracy and Forecasting Superi-ority: Evidence from the Netherlands, European Accounting Review, 14 (2): 261–295.
Petersen, Mitchell A. (2007): Estimating Standard Errors in Finance Panel Data Sets: Comparing Approaches, Working paper, Northwestern University, forthcoming Review of Fi-nancial Studies.
Plumlee, Marlene A. (2003): The Effect of Information Com-plexity on Analysts’ Use of that Information, The Accounting Review, 78 (1): 275–296.
Revsine, Lawrence, Daniel Collins, and Bruce W. Johnson (2001): Financial Reporting & Analysis, 2nd ed., Prentice Hall: Upper Saddle River, NJ.
Richardson, Scott, Siew H. Teoh, and Peter D. Wysocki (2004): The Walkdown to Beatable Analyst Forecasts: The Roles of Equity Issuance and Insider Trading Incentives, Contemporary Accounting Research, 21 (4): 885–924.
Swaminathan, Siva (1991): The Impact of SEC Mandated Segment Data on Price Variability and Divergence of Beliefs, The Accounting Review, 66 (1): 23–41.
Teoh, Siew H., Welch Ivo, and T.J. Wong (1998): Earnings Management and the Long-Run Market Performance of Initial Public Offerings, Journal of Finance, 53 (6): 1935–1974.
Van Tendeloo, Brenda and Ann Vanstraelen (2005): Earnings Management under German GAAP versus IFRS, European Accounting Review, 14 (1): 155–180.
Vanstraelen, Ann, Marilyn T. Zarzeski, and Sean W.G. Robb (2003): Corporate Nonfinancial Disclosure Practices and Financial Analyst Forecast Ability across Three European Countries, Journal of International Financial Management and Accounting, 14 (3): 249–278.
Wallmeier, Martin (2005): Analysts’ Earnings Forecasts for DAX100 Firms during the Stock Market Boom of the 1990s, Financial Markets and Portfolio Management, 19 (2): 131–151.
Williams, Patricia A. (1996): The Relation between a Prior Earnings Forecast by Management and Analyst Response to a Current Management Forecast, The Accounting Review, 71 (1): 103–115.
Wooldridge, Jeffrey M. (2002): Econometric Analysis of Cross Section and Panel Data, MIT Press: Cambridge et al.
Biographies
Jürgen Ernstberger is senior research associate at the Chair of Financial Accounting and Auditing (Prof. Dr. Haller), University of Regensburg, Germany. He has earned his doctorate from this university in 2004 and is now striving for his “Habilitation” which will qualify him for an application as a full professor. His research subjects are the internationalization of accounting, corporate gov-ernance, and corporate social responsibility (CSR). Simon Krotter was research associate at the Chair of Finance (Prof. Dr. Dr. h.c. Drukarczyk), University of Regensburg, Germany until July 2007. Now he is working in the Corporate Finance department of a leading German industrial company. His research interests are company valuation, value-based management, performance meas-urement, and analyst forecasts.

BuR - Business Research Official Open Access Journal of VHB Verband der Hochschullehrer für Betriebswirtschaft e.V. Volume 1 | Issue 1 | May 2008 | 26-53
53
Christian Stadler has recently graduated in Business Management from the University of Regensburg in Ger-many. Since September 2007 he has been undertaking Ph.D. studies at the Royal Holloway School of Manage-
ment, University of London in the United Kingdom. His research interests are international differences in corpo-rate financial reporting, particularly in pension account-ing.