analysts presentation 1h13 results · analysts presentation 1h13 results 26 august 2013. 2 agenda...
TRANSCRIPT

Analysts Presentation 1H13 Results
26 August 2013

2
Agenda
1. Key Highlights
2. CIMB Group 1H13 Financials
3. Malaysia & Singapore Consumer Banking
4. CIMB Niaga
5. CIMB Thai
6. Wholesale Banking
7. Investments
8. Other Highlights
9. 2013 Priorities and Other Highlights
10. Final Remarks

CIMB Group : 1H13 ResultsKey Highlights

4
1H13 Highlights
15% Y-o-Y increase in net profits with one-off gain on sale of CIMB Aviva (less restructuring charges)
Excluding one-off items in 1Q13, 1H13 net profit was flat Y-o-Y and Q-o-Q
Tough operating conditions for Treasury Markets and CIMB Niaga
MS Consumer Bank and Regional Corporate Bank showing good traction from CIMB 2.0
CIMB Singapore and Thailand grew strongly
IB declined slightly Y-o-Y with absence of mega IPOs
Total credit growth of 13.7% Y-o-Y (target 15%) despite contraction in Indonesia corporate book
Proposed BoC acquisition aborted
Mutual Separation Scheme (MSS) successfully completed in July
Net dividend of 12.82 sen per share, equivalent to 40% pay out, with DRS

5
Key Financial Highlights (1)Operating Income
RM’ mil
-12.7% Q-o-Q
Net Profit
RM’ mil
-24.0% Q-o-Q
ROE
%
-500bps Q-o-Q
Cost to Income
%
+300bps Q-o-Q
+12.3% +15.1% +60bps +240bps
2,440
2,120
1H131H12
16.6 16.0
1H131H12
57.7
55.3
1H131H12
7,390
6,581
1H131H12

6
Key Financial Highlights (2)
Total Credit*
RM’ bil
+3.8% Q-o-Q
Deposits++
RM’ bil
-2.4% Q-o-Q
NIM
%
+1bps Q-o-Q
Gross Impaired Loans Ratio
%
-20bps Q-o-Q
+12.7% +12.5% -80bps
Notes: * Credit includes gross loans (excluding bad bank), AFS and HTM (excluding allowance for impairment loss)Excluding FX fluctuations, total credit grew +13.7% Y-o-Y and +3.9% Q-o-Q
++ Excluding FX fluctuations, total group deposits grew +13.5% Y-o-Y and fell -2.4% Q-o-Q
258.4
229.8
Jun-13Jun-12
3.6
4.4
Jun-13Jun-12
2.88
3.09
1H131H12
-21bps
257.2
228.3
Jun-13Jun-12

7
PBT By Division
1H13 PBT Y-o-Y Growth by Key Divisions
Consumer Banking
Investment Banking
CorporateBanking
Treasury & Markets Investments
+12.2% +24.6%-8.2%
1H13*
RM ‘mil
1H12
RM ‘mil
-15.0%*
* Excluding Aviva gains, amortisation of intangible assets and organisational restructuring
-32.3%
ConsumerBanking
41%
Treasury &Markets
18%
CorporateBanking
28%
Investments8%
InvestmentBanking
5%
ConsumerBanking
36%
Treasury &Markets
27%
CorporateBanking
22%
Investments10%
Investment Banking
5%

8
1H13 PBT Y-o-Y Growth by Key Countries
PBT By Country
+2.7%* +1.2%^ +188.2%
1H13* 1H12
+24.1%
* Excluding Aviva gains, amortisation of intangible assets and organisational restructuring
^IDR depreciated 5.5% Y-o-Y. In local currency, CIMB Niaga’s PBT recorded a growth of 6.0% Y-o-Y
Thailand1%
Indonesia31%
Malaysia60%
Singapore4%
Others4%
Thailand4%
Indonesia31%
Malaysia61%
Singapore5%
Others-1%

CIMB Group : 1H13 ResultsCIMB Group 1H13 Financials

10
Quarterly Earnings Trend
Notes: * Amounts denoted in RM ’mil
** Annualised
2,959 3,032
3,381 3,255 3,326 3,544
3,369
3,945
3,445
1,278 1,287 1,405 1,341 1,470 1,496 1,371
1,718
1,387
970 1,012 1,133
1,011 1,109 1,143 1,082 1,386
1,054
16.1% 16.3%17.8%
15.6%16.8% 16.8%
15.5%
19.0%
14.0%
2Q11 3Q11 4Q11 1Q12 2Q12 3Q12 4Q12 1Q13 2Q13
Operating income* PBT* Net profit* ROE**

11
Earnings Summary
(RM ’mil) 1H13 1H12 Y-o-Y 2Q13 1Q13 Q-o-Q
Net interest income 4,606 4,262 8.1% 2,345 2,261 3.7%
Non interest income 2,784 2,319 20.1% 1,100 1,684 (34.7%)
Operating income 7,390 6,581 12.3% 3,445 3,945 (12.7%)
Overhead expenses (4,262) (3,639) 17.1% (2,043) (2,219) (7.9%)
PPOP 3,128 2,942 6.3% 1,402 1,726 (18.8%)
Loan impairment (152) (195) (22.1%) (71) (81) (12.3%)
Other provisions (6) (18) (66.7%) (4) (2) 100.0%
Share of JV / Associates 135 82 64.6% 60 75 (20.0%)
PBT * 3,105 2,811 10.5% 1,387 1,718 (19.3%)
Net profit 2,440 2,120 15.1% 1,054 1,386 (24.0%)
EPS (sen) 32.6 28.5 14.4% 14.0 18.7 (25.1%)
ROE (Annualised) 16.6% 16.0% 60bps 14.0% 19.0% (500bps)
Notes: Weighted average shares of 7.54 bil in 2Q13 and 7.43bil in 1Q13 * Includes discontinued operations

12
PBT by Segment (Estimated)
PBT (RM ’mil) 1H13 1H12 Y-o-Y 2Q13 1Q13 Q-o-Q
Consumer Banking (36.6%) 1,137 1,013 12.2% 629 508 23.7%
Malaysia (28.5%) 879 779 12.6% 489 390 25.6%
Indonesia (7.9%) 246 239 3.1% 136 110 23.1%
Singapore (0.4%) 13 2 686.3% 10 3 211.8%
Thailand (0.0%) (1) (4) 84.7% (7) 6 n.a.
Others (0.0%) 0 (3) n.a. 1 (1) n.a.
Wholesale Banking (45.5%) 1,414 1,516 (6.8%) 685 729 (6.1%)
Investment Banking (4.3%) 136 148 (8.2%) 81 55 45.0%
Corporate Banking (24.8%) 769 617 24.6% 382 387 (1.2%)
Treasury & Markets (16.4%) 509 751 (32.3%) 222 287 (22.7%)
Investments (17.9%) 554 282 97.1% 73 481 (84.7%)
PBT 3,105 2,811 10.5% 1,387 1,718 (19.3%)
Notes: Corporate Banking includes corporate lending and deposit taking
Treasury & Markets includes treasury activities and services which include foreign exchange, money market, derivatives and trading of capital market instruments. It includes the Group’s equity derivatives which develops and issues new equity derivatives instruments such as structured warrants and over-the-counter options to provide investors with alternative investment avenues.

13
(%) 1H13 1H12 Y-o-Y 2Q13 1Q13 Q-o-Q
ROE * 16.6 16.0 14.0 19.0
NIM ** 2.88 3.09 2.89 2.88
Non-interest income / total income 37.7 35.2 31.9 42.7
Cost to income 57.7 55.3 59.3 56.3
Allowance coverage 82.1 82.3 82.1 82.3
Allowance coverage after regulatory reserve # 100.6 90.0 100.6 97.9
Loan loss charge * 0.14 0.20 0.13 0.15
Gross impaired loans ratio 3.6 4.4 3.6 3.8
Net impaired loans ratio (Net of IA and PA) 0.7 0.8 0.7 0.7
Average shareholders’ funds (RM ’mil) 29,341 26,578 30,150 29,186
ROA * 1.39 1.38 1.16 1.58
Book value per share (RM) 3.98 3.64 3.98 4.04
Loan to Deposit (LDR) 86.2 87.2 86.2 81.1
CASA ratio 34.2 34.4 34.2 33.7
Notes: * Annualised
** Daily Average
# Regulatory reserve maintained in equity as an additional credit risk absorbent in accordance with BNM requirement. This is to ensure robustness on the loan/financing loss estimates methodology with the adoption of FRS 139 beginning 1 January 2010
Key Ratios

14
Operating Expenses
(RM ’mil) 1H13 1H12 Y-o-Y 2Q13 1Q13 Q-o-Q
Personnel 2,411 1,958 23.1% 1,183 1,228 (3.7%)
Establishment 841 802 4.9% 418 423 (1.2%)
Marketing 193 195 (1.0%) 106 87 21.8%
Admin & General 817 684 19.4% 336 481 (30.1%)
Total 4,262 3,639 17.1% 2,043 2,219 (7.9%)
Total excluding One-off Cost Items and RBS 3,818 3,639 4.9% 1,921 1,897 1.3%
(%) 1H13 1H12 2Q13 1Q13
Cost to income 57.7 55.3 59.3 56.3
Cost to income excluding One-off items and RBS 56.1 - 56.2 56.1

15
Gross Loans and Credit GrowthLoans by Country as at 30 Jun 13 #
Y-o-Y Growth
Loans* Credit**
Malaysia +11.8% +12.0%
Singapore ̂ +27.2% +25.0%
Indonesia ^ +9.8% +8.5%
Thailand ̂ +22.6% +24.3%
Group ~ +13.3% +13.7%
Divisions / Products (RM ‘bil) 30 Jun 13 30 Jun 12 Y-o-Y 31 Mar 13 Q-o-Q
Retail Financial Services (50.4%) 110.5 97.8 13.0% 106.8 3.5%
Mortgages 53.5 49.1 9.0% 52.2 2.4%
Term Loans 22.5 17.2 30.2% 21.3 5.5%
Auto 20.0 18.0 11.1% 19.4 3.0%
Credit Cards 5.8 5.5 6.6% 5.6 4.7%
Micro Credit 3.9 3.7 6.5% 4.0 (1.1%)
Enterprise 3.4 2.3 46.7% 3.1 10.2%
Others 1.4 2.0 (31.0%) 1.2 12.2%
Commercial Banking (17.0%) 37.3 30.7 21.4% 34.9 6.9%
Corporate Banking (32.6%) 71.3 67.3 6.1% 69.3 2.9%
Gross Loans * 219.1 195.8 11.9% 211.0 3.9%
Other Credit 38.1 32.5 17.4% 36.8 3.5%
Total Credit ** 257.2 228.3 12.7% 247.8 3.8%
Notes: * Gross loans excludes bad bank. Excluding FX fluctuations, total gross loans grew +13.3% Y-o-Y and +4.0% Q-o-Q** Credit includes gross loans (excluding bad bank), AFS and HTM (excluding allowance for impairment loss)
Excluding FX fluctuations, total credit grew +13.7% Y-o-Y and +3.9% Q-o-Q# Based on geographical location of counterparty, excluding bad bank ^ In local currency ~ Excluding FX fluctuations
Malaysia60%
Indonesia23%
Thailand7%
Singapore8%
Others2%

16
Deposits Growth
Divisions / Products (RM ‘bil) 30 Jun 13 30 Jun 12 Y-o-Y 31 Mar 13 Q-o-Q
Retail Financial Services (39.8%) 102.9 94.6 8.7% 102.7 0.2%
Current 17.0 14.7 15.3% 15.7 8.6%
Savings 28.9 26.1 10.8% 29.2 (0.9%)
Fixed & Structured Deposits 57.0 53.8 5.8% 57.8 (1.5%)
Commercial Banking ** (18.7%) 48.4 43.1 12.5% 47.8 1.3%
Corporate & Treasury (41.5%) 107.1 92.1 16.1% 114.3 (6.4%)
Total 258.4 229.8 12.5% 264.8 (2.4%)
Note: * Excluding FX fluctuations, total group deposits grew +13.5% Y-o-Y and fell -2.4% Q-o-Q^ In local currency~ Excluding FX fluctuations** Including Enterprise Banking
Deposits Growth Y-o-Y
Malaysia +11.4%
Singapore ̂ +39.7%
Indonesia ^ +9.0%
Thailand ̂ +21.4%
Group ~ +13.5%
30 Jun 13
Malaysia64%
Indonesia19%
Thailand6%
Singapore7%
Others4%

17
CASA Growth
Country 30 Jun 13 30 Jun 12 Y-o-Y 31 Mar 13 Q-o-Q
Malaysia & Singapore (RM ’bil) * 62.5 55.6 12.4% 60.1 4.2%
Indonesia (IDR ’bil) ** 67,387 59,898 12.5% 77,729 (13.3%)
Thailand (THB ’bil) 39.2 30.1 30.4% 41.0 (4.4%)
Others (RM ’bil) 0.3 0.1 200.0% 0.1 200.0%
Total (RM ‘bil) 88.3 79.1 11.6% 89.2 (1.0%)
30 Jun 13
30 Jun 12
Notes: * Malaysia CASA (excluding Singapore) grew 9.7% Y-o-Y and 2.5% Q-o-Q
** Adjusted for high cost saving deposits classified as Structured Deposits
Malaysia &Singapore
71%
CIMB Niaga24%
CIMB Thai5%
Others<1%
Malaysia &Singapore
70%
CIMB Niaga26%
CIMB Thai4%
Others<1%
18
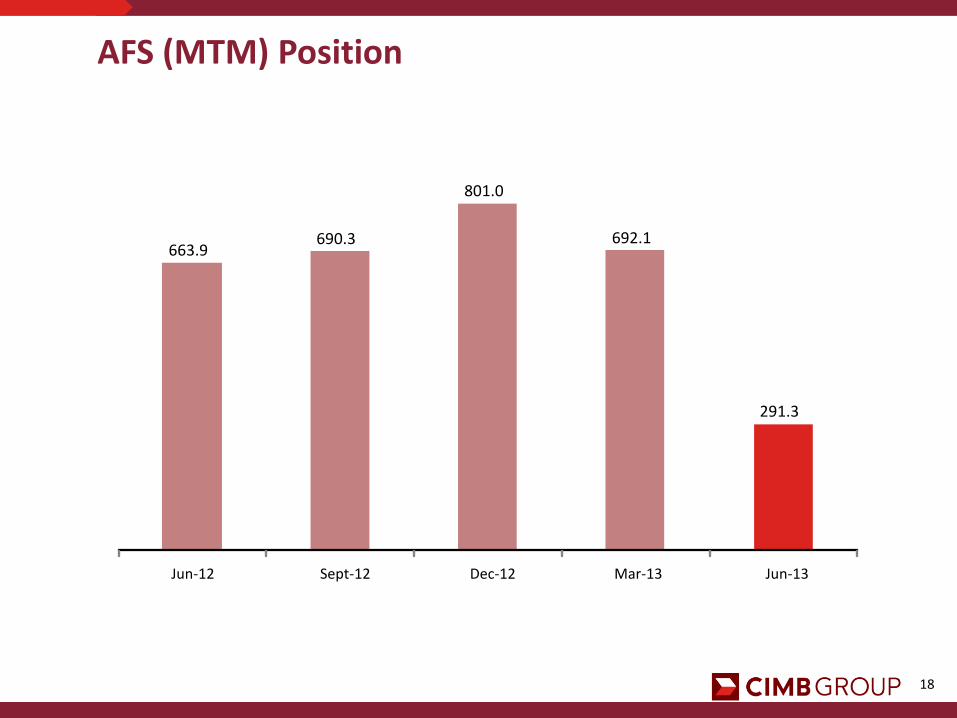
AFS (MTM) Position
663.9 690.3
801.0
692.1
291.3
Jun-12 Sept-12 Dec-12 Mar-13 Jun-13

19
Capital Management – CIMB Group
Minimum Regulatory
Requirements
Total Capital 8.0%
Tier 1 4.5%
Core Equity Tier 1 3.5%7.8%
8.2% 8.4%
9.9% 10.1% 10.3%
14.3% 14.1% 14.1%
Dec-12 Mar-13 Jun-13
DRS take-up rate of 84.4% on the FY12 second interim dividend
Includes gain from disposal of CIMB Aviva
First interim dividend for FY13 of 12.82 sen per share, equivalent to 40% pay out ratio, with DRS
Notes: * Includes quarterly net profits
^ Post dividend from CIG in relation to the disposal of CIMB Aviva # After half year net profits, CIMBGH First Interim Dividend and DRS
#
#
#
*
*
*
Leverage Ratio Gearing Ratio Double Leverage Ratio
5.5%5.4%
5.5%
Dec-12 Mar-13 Jun-13
26.1%
18.1%16.1%
Dec-12 Mar-13 Jun-13
^
124.1%
116.5%114.3%
Dec-12 Mar-13 Jun-13
^

CIMB Group : 1H13 ResultsMalaysia & Singapore Consumer Banking

21
Consumer Banking – MY and SG
(RM ’mil) 1H13 1H12 Y-o-Y 2Q13 1Q13 Q-o-Q
Net interest income 1,758 1,617 8.7% 902 856 5.4%
Non interest income 512 505 1.4% 265 247 7.3%
Operating income 2,270 2,122 7.0% 1,167 1,103 5.8%
Overhead expenses (1,465) (1,442) 1.6% (717) (748) (4.1%)
PPOP 805 680 18.4% 450 355 26.8%
(Provisions) / Writeback 82 99 (17.2%) 47 35 34.3%
Share of JV / Associates 5 (1) n.a. 3 2 50.0%
PBT 892 778 14.7% 500 392 27.6%
Loan loss charge (0.08%) (0.11%) 3bps (0.05%) (0.04%) (1bps)

22
Malaysian Consumer Gross Loans Growth
Divisions / Products (RM ‘bil) 30 Jun 13 30 Jun 12 Y-o-Y 31 Mar 13 Q-o-Q
Retail Financial Services (88.9%) 83.4 73.3 14.0% 80.9 3.2%
Mortgages 40.1 36.7 9.0% 39.2 2.4%
Term loans 20.1 15.7 28.4% 19.3 4.3%
Auto 12.1 10.9 11.1% 11.7 3.1%
Credit cards 3.9 3.9 - 3.8 3.6%
CIMB Xpress 3.1 3.1 - 3.2 (1.4%)
Enterprise 3.4 2.3 46.7% 3.1 10.2%
Others 0.7 0.7 - 0.6 7.6%
Commercial Banking (11.1%) 10.4 9.4 10.0% 10.1 2.6%
Total 93.8 82.7 13.5% 91.0 3.1%

23
Malaysian Consumer Deposits Growth
Divisions / Products (RM ‘bil) 30 Jun 13 30 Jun 12 Y-o-Y 31 Mar 13 Q-o-Q
Retail Financial Services (70.1%) 63.3 59.2 6.9% 63.8 (0.9%)
Current 9.8 8.7 13.8% 9.3 6.2%
Savings 14.8 13.8 7.5% 14.8 -
Fixed & structured deposits 38.7 36.7 5.0% 39.7 (2.8%)
Commercial Banking * (29.9%) 27.0 25.3 6.8% 26.5 1.8%
Total 90.3 84.5 6.9% 90.3 -
Note: * Including Enterprise Banking

24
36.7
39.2
40.1
Jun-12 Mar-13 Jun-13
Malaysian Consumer Banking Indicators (1)Mortgages – Loan Base
RM ‘bil
ASB – Loan Base
RM ‘bil
Auto – Loan Base
RM ‘bil
League table and market share:Sources: CIMB estimates and BNMNotes: Loan base excludes bad bank
* As at Mar-13
Jun-13 Dec-12
Market Share
Rank*Market Share
Rank
ASB Financing 23.3% 3 20.8% 3
Retail CASA 12.0% 3 11.9% 3
Auto 7.6% 5 7.4% 5
Residential Mortgages
12.8% 3 13.0% 3
Non-Residential Mortgages
10.7% 3 10.7% 3
Credit Cards 11.9% 4 11.7% 4
+9.0% Y-o-Y
+2.4% Q-o-Q
10.9
11.7
12.1
Jun-12 Mar-13 Jun-13
+3.1% Q-o-Q
+11.1% Y-o-Y
4.8
7.7 8.3
Jun-12 Mar-13 Jun-13
+73.5% Y-o-Y
+7.0% Q-o-Q

25
Credit Cards Debit Cards
Wealth Management Income
RM ‘mil
Consumer Deposits
RM ‘bil
Note: Loan base excludes bad bank
Malaysian Consumer Banking Indicators (2)
59.263.8 63.3
25.326.5 27.0
Jun-12 Mar-13 Jun-13
Retail Commercial
0% Q-o-Q
+6.9% Y-o-Y
84.5 90.3 90.3
82.8
196.1
266.2
7411,611 1,865
Jun-12 Mar-13 Jun-13
Total Spending (RM 'mil) Debit Card Base ('000)
+221.4% Y-o-Y
+35.8% Q-o-Q
16.3 18.427.2
18.424.4 10.5
Jun-12 Mar-13 Jun-13
Others Structured Product
-11.9% Q-o-Q
+8.7% Y-o-Y
34.7
42.837.7
SP Sales: RM450 mil
SP Sales: RM679 mil
SP Sales: RM295 mil
3.9 3.8 3.9
3.2 3.4 3.4
Jun-12 Mar-13 Jun-13
Credit Cards Loan Base Total Spending (RM 'bil)
+6.2% Y-o-Y
0% Q-o-Q
+3.6% Q-o-Q
0% Y-o-Y

26
Singapore Consumer Banking IndicatorsConsumer PBT
RM ‘mil
Consumer Deposits
RM ‘mil
Retail Loan Base
RM ‘mil
Commercial Loan Base
RM ‘mil
1.6
12.7
3.1
9.6
1H12 1H13 1Q13 2Q13
+686.3% Y-o-Y
+211.8% Q-o-Q
6,892 8,263 9,518
1,228
2,570 3,459
Jun-12 Mar-13 Jun-13
Retail deposits Commercial deposits
12,977
8,120
10,833
+19.8% Q-o-Q
+59.8% Y-o-Y
3,504 3,441 3,481
505 675 774
395 396 495
Jun-12 Mar-13 Jun-13
Mortgages Credit cards Term loans
4,512 4,7504,404
+5.3% Q-o-Q
+7.8% Y-o-Y+146.3% Y-o-Y
1,309
2,043
3,225
Jun-12 Mar-13 Jun-13
+57.9% Q-o-Q

CIMB Group : 1H13 ResultsCIMB Niaga

28
CIMB Niaga : Conservative GrowthPBT
IDR ‘bil
Gross Loans
IDR ‘tril
Total Deposits
IDR ‘tril
2,7352,900
1,433 1,467
1H12 1H13 1Q13 2Q13
+6.0% Y-o-Y
+2.4% Q-o-Q
137.6
167.3
149.9
Jun-12 Mar-13 Jun-13
+9.0% Y-o-Y
-10.4% Q-o-Q
137.5
147.1151.0
Jun-12 Mar-13 Jun-13
+9.8% Y-o-Y
+2.6% Q-o-Q
Asset Quality
82.3%91.4%
98.3%
3.3% 2.8% 2.5%
2Q12 1Q13 2Q13
Allowance Coverage Gross Impaired loans Ratio

29
Mortgages – Loan Base
IDR ‘tril
Auto – Loan Base
IDR ‘tril
CIMB Niaga : Consumer Banking Indicators
Mikro Finance Go Mobile
19.6
21.221.8
Jun-12 Mar-13 Jun-13
+2.9% Q-o-Q
+11.0% Y-o-Y
16.4
18.018.6
Jun-12 Mar-13 Jun-13
+3.1% Q-o-Q
+13.3% Y-o-Y
1.8
2.3 2.4
258
350 350
Jun-12 Mar-13 Jun-13
Mikro Laju Loan Base (IDR 'bil) Mikro Laju Outlet
381
9161,098
171
314 386
2Q12 1Q13 2Q13
No of Transactions (IDR 'tril) No of Users ('000)
+188.2% Y-o-Y
+19.9% Q-o-Q+3.4% Q-o-Q
+35.1% Y-o-Y

30
29.9
34.5
Dec-12 Jun-13
CIMB Niaga vs Industry
Savings
IDR ‘tril
Mortgage, Auto and Credit Cards
IDR ‘tril
Commercial Loans (Includes Mikro Laju)
IDR ‘tril
Corporate Loans
IDR ‘trilIndustry growth : +15.3% Y-o-Y
Industry growth : +10.7% Y-o-YIndustry growth : -1.0% YTD
39.2
43.9
Jun-12 Jun-13
+12.1% Y-o-Y
52.3
62.2
Jun-12 Jun-13
+18.8% Y-o-Y
43.7 42.2
Jun-12 Jun-13
Industry growth : +24.4% Y-o-Y
-3.5% Y-o-Y
+15.4% YTD
Outperform in Savings, Consumer and Commercial Loans; High Repayments in Corporate Loans

31
CIMB Niaga : Earnings Summary
(IDR ’bil) 1H13 1H12 Y-o-Y 2Q13 1Q13 Q-o-Q
Net interest income 4,915 4,687 4.9% 2,485 2,430 2.3%
Non interest income 1,605 1,687 (4.9%) 768 837 (8.2%)
Operating income 6,520 6,374 2.3% 3,253 3,267 (0.4%)
Overhead expenses (3,150) (2,989) 5.4% (1,602) (1,548) 3.5%
PPOP 3,370 3,385 (0.4%) 1,651 1,719 (4.0%)
Provisions (470) (650) (27.7%) (184) (286) (35.7%)
PBT 2,900 2,735 6.0% 1,467 1,433 2.4%
Net profit 2,134 1,984 7.6% 1,080 1,054 2.5%
PBT (RM ‘mil) 916 918 (0.2%) 463 456 1.5%
PAT (RM ‘mil) 674 666 1.2% 339 335 1.2%
EPS (sen) 84.9 78.9 7.6% 43.0 41.9 2.6%
ROE (Annualised) 18.2% 20.7% (250bps) 18.1% 18.3% (20bps)

32
CIMB Niaga : Gross Loans Growth
Divisions / Products (IDR ’bil) 30 Jun 13 30 Jun 12 Y-o-Y 31 Mar 13 Q-o-Q
Retail Financial Services (30.9%) 46,624 41,436 12.5% 45,089 3.4%
Mortgage 21,780 19,627 11.0% 21,160 2.9%
Auto 18,555 16,372 13.3% 17,998 3.1%
Credit Cards 3,582 3,170 13.0% 3,511 2.0%
Others 2,707 2,267 19.4% 2,420 11.9%
Corporate Banking (27.9%) 42,168 43,715 (3.5%) 42,370 (0.5%)
Commercial Banking (39.6%) 59,785 50,559 18.2% 57,312 4.3%
Mikro Laju (1.6%) 2,368 1,753 35.1% 2,290 3.4%
Total 150,945 137,463 9.8% 147,061 2.6%
Coal Exposure
IDR ‘bil
8,565
6,995
6.2%
4.6%
Jun-12 Jun-13
Coal Loans % of total loans
-18.3% Y-o-Y

33
CIMB Niaga : Deposits Growth
Divisions / Products (IDR ’bil) 30 Jun 13 30 Jun 12 Y-o-Y 31 Mar 13 Q-o-Q
Retail Financial Services (46.9%) 70,251 61,694 13.9% 70,694 (0.6%)
Current 1,823 1,342 35.8% 1,650 10.5%
Savings 33,343 29,758 12.0% 33,052 0.9%
Fixed & structured deposits 35,085 30,594 14.7% 35,991 (2.5%)
Commercial Banking (33.7%) 50,593 46,158 9.6% 53,113 (4.7%)
Corporate Banking (19.4%) 29,098 29,735 (2.1%) 43,517 (33.1%)
Total 149,942 137,587 9.0% 167,324 (10.4%)
Note: Adjusted for high cost saving deposits classified as Structured Deposits

34
CIMB Niaga : Key Ratios
(Consolidated, %) 1H13 1H12 Y-o-Y 2Q13 1Q13 Q-o-Q
ROE 18.2 20.7 18.1 18.3
NIM 5.26 5.93 5.31 5.14
Cost to Income 48.3 46.9 49.3 47.4
Loan Loss Coverage # 112.9 108.6 112.9 108.8
Allowance Coverage 98.3 82.3 98.3 91.4
Loan Loss Charge 0.6 1.0 0.5 0.8
Gross Impaired Loans Ratio 2.5 3.3 2.5 2.8
Gross NPL (BI Definition) # 2.2 2.5 2.2 2.4
Loan to Deposit (LDR) 99.2 98.8 99.2 86.7
Modified LDR * 91.5 93.3 91.5 81.3
CAR 15.9 15.1 15.9 16.1
CASA ratio 44.9 43.5 44.9 46.5
Notes: * MLDR = (Loans + HTM Bonds-Gov.Bonds-SBI) / (Total Deposits + Long Term Funding)# Based on BI definition

35
CIMB Niaga : Corporate Updates
Consumer Market Share
Jun-13 Jun-12
Market Share
RankMarket Share
Rank
Deposits 4.4% 5 4.6% 5
Mortgages 9.1% 5 9.2% 5
Credit Cards* 10.7% 4 9.0% 5
Outlook
Volatile economic environment
Competitive funding and lending rates
Navigate complex regulatory environment
Loan growth should sustain at these levels
Increase focus on CASA by introduction of point rewards, digital lounges & Go Mobile
Closely monitoring asset quality with rise in inflation
Appointment of Ibu Vera Handajani as Risk Management Director
IB Market Share
1H13 1H12
Market Share
RankMarket Share
Rank
Stock Broking 6.9% 2 5.0% 5
IPO - - - -
ECM 13.9% 3 - -
M&A 8.9% 2 0.5% 12
Syndication ̂ 1.4% 22 4.4% 9
DCM 8.0% 6 8.5% 4
Notes: * Card base^ Mandated lead arranger
Rekening Ponsel (Advanced Mobile Banking)
15
67
5
81
Mar-13 Jun-13
No of Trasaction ('000) No of Users ('000)
+344.3% Q-o-Q
>1000% Q-o-Q

CIMB Group : 1H13 ResultsCIMB Thai

37
CIMB Thai : Improving PBT
THB ‘mil
Total Customer Deposits
THB ‘bil
Total Loans
THB ‘bil
Asset Quality
Note: * Excludes STAMC
75.8 84.0 82.3
8.510.3 10.7
29.941.4 45.7
Jun-12 Mar-13 Jun-13
Retail Commercial Corporate & Treasury
+21.4% Y-o-Y
114.2
138.7135.8
+2.1% Q-o-Q
42.4 52.8 57.6
30.037.4 39.5
47.750.0 51.0
3.12.9
3.0
Jun-12 Mar-13 Jun-13
Retail Commercial Corporate & Treasury Business Support
123.3
151.1
+22.6% Y-o-Y
143.2
+5.5% Q-o-Q
395
655
379
276
1H12 1H13 1Q13 2Q13
-27.0% Q-o-Q
+65.8% Y-o-Y
75.2%86.1% 83.1%
3.5%2.6% 2.8%
2Q12 1Q13 2Q13
Loan Loss Coverage* Gross NPL*

38
CIMB Thai : Earnings Summary
Before GAAP Adjustments (THB ’mil)
1H13 1H12 Y-o-Y 2Q13 1Q13 Q-o-Q
Net interest income 3,031 2,463 23.1% 1,571 1,460 7.6%
Non interest income 1,011 752 34.4% 497 514 (3.2%)
Operating income 4,042 3,215 25.7% 2,069 1,974 4.8%
Overhead expenses (2,898) (2,625) 10.4% (1,516) (1,382) 9.7%
PPOP 1,144 590 94.1% 553 592 (6.6%)
Provisions (489) (249) 96.8% (276) (213) 29.4%
Discontinued Operations - 54 n.a - - -
PBT 655 395 65.8% 276 379 (27.0%)
Net Profit 544 335 62.5% 231 313 (26.3%)
EPS (THB) 0.03 0.02 25.8% 0.01 0.01 -
Net Profit (RM ‘mil) 56 33 69.0% 23 33 (26.8%)
PBT (RM ‘mil) * 72 32 123.2% 35 38 (7.8%)
PAT (RM ‘mil) * 57 27 109.1% 28 29 3.6%
ROE (Annualised) 5.2% 4.6% 60bps 4.4% 6.1% (180bps)
Note: * After GAAP and FRS 139 adjustments

39
CIMB Thai : Gross Loans Growth
Divisions / Products (THB ‘bil) 30 Jun 13 30 Jun 12 Y-o-Y 31 Mar 13 Q-o-Q
Retail Financial Services (38.2%) 57.6 42.4 35.9% 52.8 9.2%
Mortgage 36.0 26.6 35.2% 33.2 8.4%
Auto Loans 14.0 10.3 36.0% 13.0 8.2%
Personal / Others 7.7 5.5 39.8% 6.6 15.1%
Commercial Banking (26.1%) 39.5 30.0 31.4% 37.4 5.6%
Corporate Banking (33.7%) 51.0 47.7 6.8% 50.0 1.8%
Business Support Group (2.0%) 3.0 3.1 (3.0%) 2.9 1.7%
Total 151.1 123.3 22.6% 143.2 5.5%

40
CIMB Thai : Deposits Growth
Divisions / Products (THB ‘bil) 30 Jun 13 30 Jun 12 Y-o-Y 31 Mar 13 Q-o-Q
Retail Financial Services (56.3%) 82.3 75.8 8.5% 84.0 (2.1%)
Current 0.8 0.8 (2.0%) 0.8 1.0%
Savings 22.4 16.7 33.7% 23.0* (2.7%)
Fixed & structured deposits 59.1 58.3 1.4% 60.2* (1.9%)
Commercial Banking (7.3%) 10.7 8.5 26.7% 10.3 3.9%
Corporate and Treasury (31.2%) 45.7 29.9 52.6% 41.4 10.2%
Customer Deposits 138.7 114.2 21.4% 135.8 2.1%
Bills of Exchanges (5.2%) 7.6 21.3 (64.5%) 7.8 (3.2%)
Customer Deposits + Bills of Exchanges 146.2 135.5 7.9% 143.6 1.8%
Note: * Adjusted for large retail customer that moved from savings to FD

41
CIMB Thai : Key Ratios
(Consolidated, %) 1H13 1H12 Y-o-Y 2Q13 1Q13 Q-o-Q
ROE 5.2 4.6 4.4 6.1
NIM 3.22 3.25 3.27 3.17
Cost to Income 71.7 81.7 73.3 70.0
Loan Loss Coverage** 83.1 75.2 83.1 86.1
Loan Loss Charge 0.7 0.4 0.7 0.6
Gross NPL ratio** 2.8 3.5 2.8 2.6
Net NPL ratio** 1.9 2.2 1.9 1.8
Loan to Deposit + BE 103.3 91.0 103.3 99.7
CAR* 14.5 12.4 14.5 15.0
CASA ratio 28.3 26.3 28.3 30.2
Notes: * Bank Only** Excludes STAMC

42
PBT to CIMB Group From Thailand
RM ‘mil
CIMB Thai : Corporate UpdatesConsumer Market Share
Jun-13 Jun-12
Market Share
RankMarket Share
Rank
Deposits* 1.4% 11 1.4% 9
Mortgages** 2.0% 9 1.2% 11
Auto~ 0.6% 15 0.5% 17
SME Loans** 1.1% 6 1.0% 6
Outlook
Loans growth gaining momentum but still behind target
Improving NIM following refocus on alternative funding instruments such as structured products and better cost of funds management
Capital markets deal pipeline remains strong
Tightening credit standard on some retail segments, self-employed unsecured loan, auto loan and speculative mortgage loan
IB Market Share
1H13 1H12
Market Share
RankMarket Share
Rank
Stock Broking 4.0% 10 2.8% 16
IPO - - 20.8% 1
ECM - - 13.3% 4
M&A - - 0.2% 10
Syndication ̂ - - 8.5% 3
Bonds 5.9% 7 1.2% 12
Notes: * As at Jun-13 and Jun-12** As at Mar-13 and Jun-12
~ As at Dec-12 and Jun-12^ Mandated lead arranger
1.8 27.6 6.5
17.2 32.4
72.3
1H12 1H13
Securities STAMC Bank
+165.4% Y-o-Y
+123.2% Y-o-Y
>+1000% Y-o-Y
CIMB Group : 1H13 ResultsWholesale Banking

44
Wholesale Banking
(RM ’mil) 1H13 1H12 Y-o-Y 2Q13 1Q13 Q-o-Q
Net interest income 1,467 1,436 2.2% 745 722 3.2%
Non interest income 1,055 1,254 (15.9%) 483 572 (15.7%)
Operating income 2,522 2,690 (6.2%) 1,228 1,294 (5.2%)
Overhead expenses (1,118) (1,082) 3.3% (551) (567) (2.6%)
PPOP 1,404 1,608 (12.7%) 677 727 (7.1%)
(Provisions) / Writeback 10 (92) n.a. 8 2 195.2%
PBT 1,414 1,516 (6.8%) 685 729 (6.1%)

45
Wholesale Banking – Investment Banking
(RM ’mil) 1H13 1H12 Y-o-Y 2Q13 1Q13 Q-o-Q
Net interest income 50 35 42.9% 27 23 14.7%
Non interest income 553 543 1.8% 294 259 13.5%
Operating income 603 578 4.3% 321 282 13.6%
Overhead expenses (465) (426) 9.2% (241) (224) 7.9%
PPOP 138 152 (8.7%) 80 58 35.4%
(Provisions) / Writeback (2) (4) (50.0%) 1 (3) n.a.
PBT 136 148 (8.2%) 81 55 45.0%

46
Wholesale Banking – Corporate Banking
(RM ’mil) 1H13 1H12 Y-o-Y 2Q13 1Q13 Q-o-Q
Net interest income 815 808 0.8% 416 399 4.1%
Non interest income 297 259 14.5% 123 174 (28.7%)
Operating income 1,112 1,067 4.2% 539 573 (5.9%)
Overhead expenses (355) (362) (2.0%) (164) (191) (14.1%)
PPOP 757 705 7.3% 375 382 (1.8%)
(Provisions) / Writeback 12 (88) n.a 7 5 46.7%
PBT 769 617 24.6% 382 387 (1.2%)

47
Corporate Banking – Gross Loans
Divisions / Products 30 Jun 13 30 Jun 12 Y-o-Y 31 Mar 13 Q-o-Q
Malaysia (RM ’bil) 43.0 39.8 8.2% 41.8 3.0%
Indonesia (IDR ’bil) 42,168 43,715 (3.5%) 42,370 (0.5%)
Singapore (SGD ’bil) 3.5 2.9 17.7% 3.0 14.6%
Thailand (THB ’bil) 51.0 47.7 6.8% 50.0 1.8%
Total Corporate Loans (RM ‘bil) 71.3 67.3 6.1% 69.3 2.9%
30 Jun 13 30 Jun 12
Malaysia60%
Indonesia20%
Singapore12%
Thailand8%
Malaysia59%
Indonesia23%
Singapore11%
Thailand7%

48
Corporate Banking – Total Deposits
Divisions / Products 30 Jun 13 30 Jun 12 Y-o-Y 31 Mar 13 Q-o-Q
Malaysia (RM ’bil) 86.4 73.3 17.8% 90.1 (4.1%)
Indonesia (IDR ’bil) 29,098 29,735 (2.1%) 43,517 (33.1%)
Singapore (SGD ’bil) 2.6 2.3 12.2% 2.3 13.3%
Thailand (THB ’bil) 45.9 29.9 53.4% 41.4 10.7%
Total Corporate Deposits (RM ‘bil) 107.1 92.1 16.1% 114.3 (6.4%)
Divisions / Products (RM ‘bil) 30 Jun 13 30 Jun 12 Y-o-Y 31 Mar 13 Q-o-Q
Current 15.5 15.1 2.4% 18.6 (5.1%)
Savings 1.4 1.1 26.5% 1.2 (16.8%)
Fixed and Structured Deposits 90.2 75.9 19.1% 94.5 (4.5%)
Total 107.1 92.1 16.1% 114.3 (6.4%)

49
Wholesale Banking – Treasury & Markets
(RM ’mil) 1H13 1H12 Y-o-Y 2Q13 1Q13 Q-o-Q
Net interest income 602 593 1.5% 303 299 1.1%
Non interest income 205 452 (54.6%) 66 139 (53.4%)
Operating income 807 1,045 (22.7%) 369 438 (16.3%)
Overhead expenses (298) (294) 1.6% (146) (152) (3.6%)
PPOP 509 751 (32.3%) 223 286 (23.0%)
Provisions - - n.a. (1) 1 n.a.
PBT 509 751 (32.3%) 222 287 (22.7%)

50
IB Market Share and Ranking (1)1H13 1H12
Market Share
RankMarket Share
Rank
Stock Broking 11.8% 1 11.9% 1
IPO 23.1% 1 21.2% 2
ECM 28.3% 2 30.2% 1
M&A 9.0% 5 8.1% 10
Syndication ̂ 4.5% 10 13.6% 3
DCM Domestic Sukuk
15.8%
17.0%
2
3
23.9%
25.7%
2
2
1H13 1H12
Market Share
RankMarket Share
Rank
Stock Broking 6.9% 2 5.0% 5
IPO - - - -
ECM 13.9% 3 - -
M&A 8.9% 2 0.5% 12
Syndication ̂ 1.4% 22 4.4% 9
DCM 8.0% 6 8.5% 4
1H13 1H12
Market Share
RankMarket Share
Rank
Stock Broking 4.0% 10 2.8% 16
IPO - - 20.8% 1
ECM - - 13.3% 4
M&A - - 0.2% 10
Syndication ̂ - - 8.5% 3
DCM 5.9% 7 1.2% 12
1H13 1H12
Market Share
RankMarket Share
Rank
Stock Broking 9.4% 2 10.9% 1
IPO 7.9% 5 - -
ECM 5.7% 6 0.1% 20
M&A 3.7% 12 2.5% 13
Syndication ̂ 0.6% 33 3.6% 9
DCM 0.7% 13 3.8% 7
Sources: Dealogic, Bloomberg, Local Stock Exchanges and internal data
Note: ^ Mandated lead arranger

51
IB Market Share and Ranking (2)
Global
1H13 1H12
Market Share
RankMarket Share
Rank
Sukuk 6.6% 4 8.5% 3
1H13 1H12
Market Share
RankMarket Share
Rank
Stock Broking 0.2% 65 0.1% 96
IPO 0.8% 31 1.7% 15
ECM 0.2% 36 - --
M & A 1.1% 34 0.5% 23
Syndications ̂ - - - -
ASEAN
1H13 1H12
Market Share
RankMarket Share
Rank
IPO 5.4% 7 15.6% 2
ECM 7.5% 4 15.0% 1
M & A 3.5% 16 3.9% 16
Syndication ̂ 1.1% 25 6.6% 5
DCM Domestic 8.3% 2 7.6% 4
Sources: Dealogic, Bloomberg, Local Stock Exchanges and internal data
Note:^ Mandated lead arranger
52
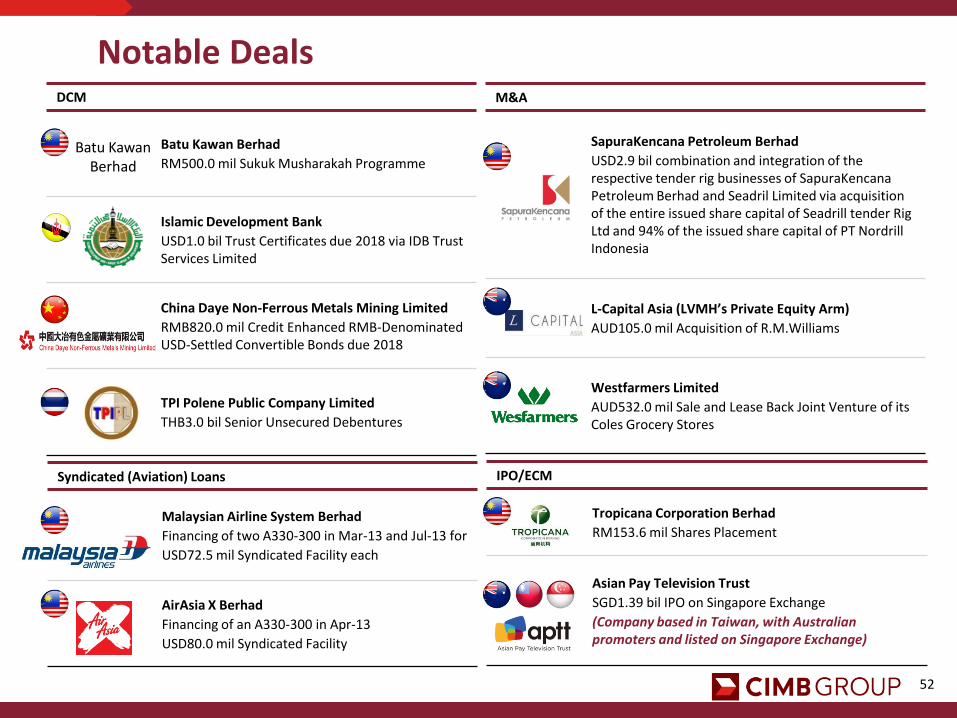
Notable DealsDCM
Batu Kawan Berhad
RM500.0 mil Sukuk Musharakah Programme
Islamic Development Bank
USD1.0 bil Trust Certificates due 2018 via IDB Trust Services Limited
China Daye Non-Ferrous Metals Mining Limited
RMB820.0 mil Credit Enhanced RMB-Denominated USD-Settled Convertible Bonds due 2018
TPI Polene Public Company Limited
THB3.0 bil Senior Unsecured Debentures
IPO/ECM
Tropicana Corporation Berhad
RM153.6 mil Shares Placement
Asian Pay Television Trust
SGD1.39 bil IPO on Singapore Exchange
(Company based in Taiwan, with Australian promoters and listed on Singapore Exchange)
M&A
SapuraKencana Petroleum Berhad
USD2.9 bil combination and integration of the respective tender rig businesses of SapuraKencana Petroleum Berhad and Seadril Limited via acquisition of the entire issued share capital of Seadrill tender Rig Ltd and 94% of the issued share capital of PT Nordrill Indonesia
L-Capital Asia (LVMH’s Private Equity Arm)
AUD105.0 mil Acquisition of R.M.Williams
Westfarmers Limited
AUD532.0 mil Sale and Lease Back Joint Venture of its Coles Grocery Stores
Batu Kawan Berhad
Syndicated (Aviation) Loans
Malaysian Airline System Berhad
Financing of two A330-300 in Mar-13 and Jul-13 for
USD72.5 mil Syndicated Facility each
AirAsia X Berhad
Financing of an A330-300 in Apr-13
USD80.0 mil Syndicated Facility

53
Group Asset Management
PBT (RM ’mil) 1H13 1H12 Y-o-Y 2Q13 1Q13 Q-o-Q
CIMB-P Group 32.1 26.7 20.0% 16.3 15.8 3.3%
Wholesale 9.4 6.0 56.2% 5.2 4.2 22.0%
Total 41.5 32.7 26.6% 21.5 20.0 7.3%
Asset Under Management as at 30 Jun 2013
RM ‘mil
Wholesale AUM as at 30 Jun 2013
47,365
36,869
+28.5% Y-o-Y
33,40543,222
3,464
4,143
Jun-12 Jun-13Wholesale CIMB P
CapAsiaRM1,259 mil
30%
Private EquityRM869 mil
21%
TCARM1,535 mil
37%
CIMB MapletreeRM480 mil
12%

CIMB Group : 1H13 ResultsInvestments
55
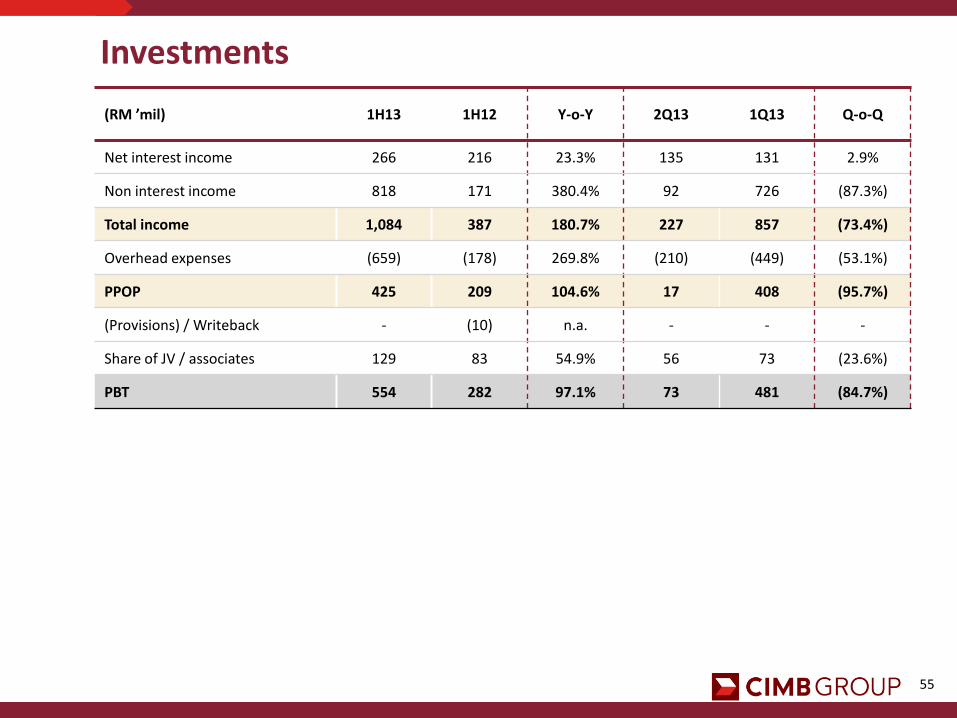
Investments
(RM ’mil) 1H13 1H12 Y-o-Y 2Q13 1Q13 Q-o-Q
Net interest income 266 216 23.3% 135 131 2.9%
Non interest income 818 171 380.4% 92 726 (87.3%)
Total income 1,084 387 180.7% 227 857 (73.4%)
Overhead expenses (659) (178) 269.8% (210) (449) (53.1%)
PPOP 425 209 104.6% 17 408 (95.7%)
(Provisions) / Writeback - (10) n.a. - - -
Share of JV / associates 129 83 54.9% 56 73 (23.6%)
PBT 554 282 97.1% 73 481 (84.7%)

56
27.06%
52.22%
19.99%
Strategic Investments
RM ’mil 1H13 1H12 Y-o-Y 2Q13 1Q13 Q-o-Q
PAT to CIMB Group 7.3 5.3 37.7% 3.3 3.9 (15.4%)
Number of T‘nG reload points at 6,985 (+407 Q-o-Q), active parking sites at 78 (+4 Q-o-Q)
Converting POS terminal to Reload Terminal: First phase, Tanjung Kupang (11 lanes), Lima
Kedai (4 lanes), Ipoh Utara (1 lane). Rolled out at 4 lanes at Plaza Lima Kedai
RM ’mil 1H13 1H12 Y-o-Y 2Q13 1Q13 Q-o-Q
PAT to CIMB Group 42.7 48.8 (12.4%) 26.0 16.7 56.6%
Lower growth Y-o-Y due to margin squeeze and slightly higher provisions
New Huludao branch will be launched on 28 Aug 2013 and new Anshan branch will be
launched in 4Q13
RM ’mil 1H13 1H12 Y-o-Y 2Q13 1Q13 Q-o-Q
PAT to CIMB Group 46.6 1.6 >1000% 17.3 29.3 (40.8%)
Tune Insurance Holdings’ share price increased 54% to RM2.08 (29 Jul) from IPO price of
RM1.35. At RM2.08, CIMB’s 15% effective stake is worth approximately RM237 mil

CIMB Group : 1H13 ResultsOther Highlights

58
Insurance
PBT (RM ’mil) 1H13 1H12 Y-o-Y 2Q13 1Q13 Q-o-Q
CIMB Aviva^ - 27.4 n.a. - - -
CIMB Sun Life (6.7) (7.8) 13.6% (2.9) (3.9) 25.4%
Others* 4.5 (0.9) n.a. 4.2 0.3 >1000%
Total CIG & GID (2.3) 18.7 n.a. 1.3 (3.6) n.a.
Notes: * Includes CIMB Insurance Brokers PBT, GID expenses & Others•The Group has disposed off the associates shares in CIMB Aviva / Takaful., hence will fully deconsolidate 2013 profit and loss in the Group’s account.
Banca Income (RM ’mil) Y-o-Y
Malaysia 27.6%
Indonesia 33.0%
Thailand 66.7%
Singapore 27.5%
Total 34.7%

59
CIMB Islamic
Ranking of Total Islamic Assets as at 31 Mar 2013
Rank CompanyTotal Assets
RM ’milMarket Share
1 MIBB 96,786 24%
2 CIMB Islamic 52,424 13%
3 Bank Islam 41,105 10%
4 AmIslamic 32,528 8%
5 PBB-i 31,043 8%
Sukuk
1H13 1H12
Market Share
RankMarket Share
Rank
Malaysia 17.0% 3 25.7% 2
Sukuk 6.6% 4 8.5% 3
Islamic Deposits and Financing
RM ‘bil
Islamic Residential Mortgage and Market Share
RM ‘mil
Ranking 2 2 n.a
Market Share 18.3% 16.9% 16.4%
28.5
37.0 35.4
Jun-12 Mar-13 Jun-13
Islamic Deposits
30.3
34.1 34.2
Jun-12 Mar-13 Jun-13
Islamic Financing
+0.5% Q-o-Q
+13.2% Y-o-Y
-4.1% Q-o-Q
+24.5% Y-o-Y
7,755
8,6068,912
Jun-12 Mar-13 Jun-13
+3.6% Q-o-Q
+14.9% Y-o-Y

60
CIMB SingaporePBT
RM ‘mil
Corporate Loan Base
RM ‘mil
Corporate Deposits
RM ‘mil
Note: ^ Mandated lead arranger
1H13 1H12
Market Share
RankMarket Share
Rank
Stock Broking 9.4% 2 10.9% 1
IPO 7.9% 5 - -
ECM 5.7% 6 0.1% 20
M&A 3.7% 12 2.5% 13
Syndication ̂ 0.6% 33 3.6% 9
DCM 0.7% 13 3.8% 7
108 95
39
56
1
35
1
34
1H12 1H13 1Q13 2Q13
Bank Securities
+42.9% Q-o-Q
-11.7% Y-o-Y
7,363 7,531
8,684
Jun-12 Mar-13 Jun-13
+18.0% Y-o-Y
+15.3% Q-o-Q
5,879 5,798
6,610
Jun-12 Mar-13 Jun-13
+14.0% Q-o-Q
+12.4% Y-o-Y

CIMB Group : 1H13 Results2013 Priorities and Other Highlights

62
Key 2013 Priorities Round-up Updates
Cost Management
Containing BAU costs better
Restructuring charge done
Malaysia MSS – 867 exits confirmed in July; more under review
Deconsolidation of non-core assets WIP
Capital Management Continuing DRS RWA optimisation plans
Investment Banking Integration Completed platform in July with Taiwan launch
Focus on synergies and deal flow
1Platform 1Platform Malaysia on track for SPD in 1Q14
Network Expansion
BoC negotiations ceased
CIMB Shanghai & HK branch WIP
CIMB Thai Laos WIP

63
New Regional Risk Leadership
Richard Baskerville
Group Head of the Operational Risk
Centre of Excellence
Frederic Salomon
Head of Market Risk Centre of Excellence
Alan Ni
Head of Retail Risk
Dave Richard Thomas
Group Chief Risk Officer
Vera Handajani
Risk Director, CIMB Niaga

64Note: * Credit includes gross loans (excluding bad bank), AFS and HTM (excluding allowance for impairment loss)
Achievements vs Targets for 2013
1H13 Y-o-Y FY13
ROE 16.6% 16%
TSR +4.2%>FBMKLCI > FBMKLCI
Dividend 40% 40%
Total Credit Growth * 13% 15%
Loan loss charge 0.14 < 0.4
Total Capital (CIMB Group) 14.1% > 11%
CET 1 (CIMB Group) 8.4% > 8%
Leverage (CIMB Group) 5.5% < 20x

CIMB Group : 1H13 ResultsFinal Remarks

66
Final Remarks
Weakening external macro economic environment and markets
Regional Corporate Banking, MS Consumer, CIMB Singapore and Thai have
momentum to continue to do well in 2H13
Treasury Markets will have to navigate market turbulence but also capitalise on new
opportunities
CIMB Niaga must watch NPLs as IDR depreciates, rates rise and growth slows
IB pipeline is strong but susceptible to equity market conditions
Retain 16% ROE target but will be more challenging with weakening external
environment

67
THANK YOU

Appendices

69
Contribution by Entity
Legal Entity1H13 1H12 2Q13 1Q13
RM ’mil % of PBT RM ’mil % of PBT RM ’mil % of PBT RM ’mil % of PBT
CIMB Bank 1.307 42% 1,547 55% 714 52% 593 35%
CIMB Niaga 916 30% 918 33% 460 33% 456 27%
CIMB Islamic 239 8% 242 9% 134 10% 105 6%
CIMB Labuan 65 2% 23 1% 47 3% 18 1%
CIMB Investment Bank 53 2% 104 3% 34 2% 19 1%
CIMB Thai 72 2% 32 1% 34 2% 38 2%
CIMB Securities Group (96) (3%) (1) 0% (44) (3%) (52) (3%)
CIMB Cambodia (4) 0% (4) 0% (3) 0% (1) 0%
Others * 553 17% (50) (2%) 11 1% 542 31%
PBT 3.105 100% 2,811 100% 1,387 100% 1,718 100%
Note: * SEASAM, Asset Management, Group Insurance, Bank of Yingkou, CIMBGH/CIMBG level and consol adjustment.

70
Consolidated Balance Sheet Changes
(RM ‘mil) 31 Jun 1331 Jun 12
(Restated)Y-o-Y 31 Mar 13 Q-o-Q
Cash & short term funds 32,317 25,020 29% 36,065 (10%)
Securities purchased under resale agreements 9,529 4,217 126% 11,082 (14%)
Deposits & placements with financial institutions 6,734 5,005 35% 9,617 (30%)
Financial investments at fair value through profit or loss 24,257 23,093 5% 27,745 (13%)
Money Market 14,042 17,821 (21%) 18,455 (24%)
Corporate Bonds 8,199 3,853 113% 7,638 7%
Equity 2,016 1,418 42% 1,652 22%
Financial investments available for sale 31,412 23,294 35% 29,492 7%
Financial investments held to maturity 8,077 10,740 (25%) 8,742 (8%)
Loans, advances & financing 216,445 193,179 12% 208,388 4%
Other assets 35,464 30,748 15% 33,928 5%
Total assets 364,235 315,296 16% 365,059 (0.2%)
Deposits from customers 258,416 229,843 12% 264,787 (2%)
Deposits & placements of banks and other FI 21,737 18,361 18% 19,025 14%
Other borrowings 23,558 18,456 28% 23,266 1%
Other liabilities 29,235 20,611 42% 26,995 8%
Total liabilities 332,946 287,271 16% 334,073 (0.3%)
Shareholders’ funds 30,296 27,076 12% 29,995 1%
Total liabilities & equity 364,235 315,296 16% 365,059 (0.2%)

71
CIMB Niaga : Balance Sheet Changes
(IDR ’bil) 30 Jun 13 30 Jun 12 Y-o-Y 31 Mar 13 Q-o-Q
Placements & Other MS 30,574 24,679 23.9% 52,316 (41.6%)
Government Bonds 6,577 7,862 (16.3%) 6,505 1.1%
Loans (Net) 147,175 133,747 10.0% 143,250 2.7%
Other Assets 17,871 13,137 36.0% 15,393 16.1%
Total Assets 202,197 179,425 12.7% 217,464 (7.0%)
CASA 67,387 59,898 12.5% 77,729 (13.3%)
Time Deposits & CD 82,554 77,689 6.3% 89,595 (7.9%)
Total Customer Deposits 149,941 137,587 9.0% 167,324 (10.4%)
Other Liabilities 28,212 21,723 29.9% 26,712 5.6%
Total liabilities 178,153 159,310 11.8% 194,036 (8.2%)
Equity 24,044 20,115 19.5% 23,429 2.6%
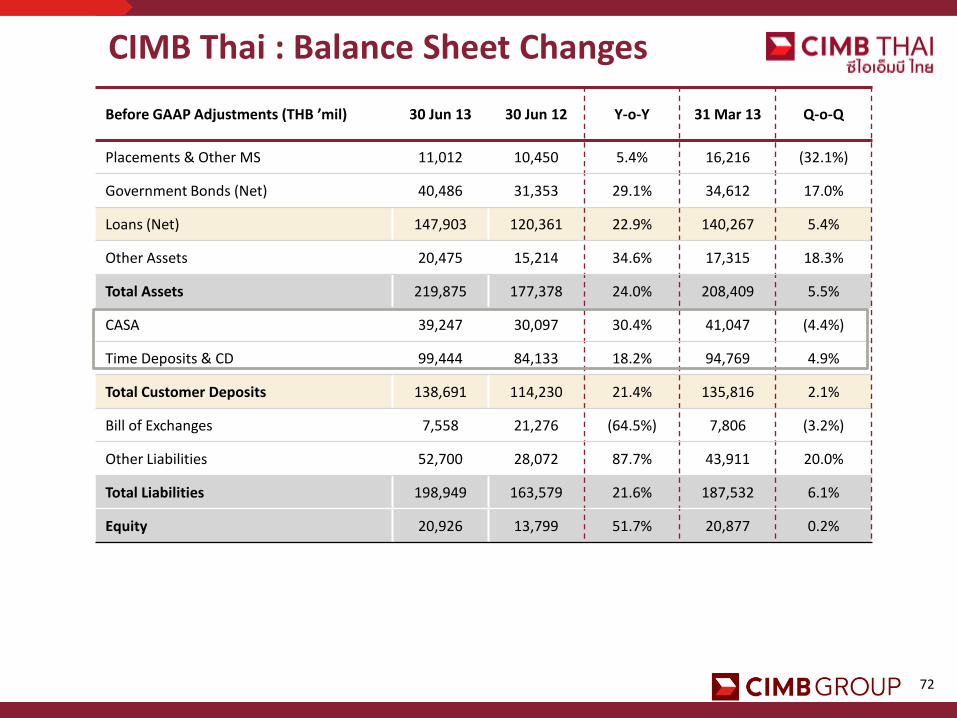
72
CIMB Thai : Balance Sheet Changes
Before GAAP Adjustments (THB ’mil) 30 Jun 13 30 Jun 12 Y-o-Y 31 Mar 13 Q-o-Q
Placements & Other MS 11,012 10,450 5.4% 16,216 (32.1%)
Government Bonds (Net) 40,486 31,353 29.1% 34,612 17.0%
Loans (Net) 147,903 120,361 22.9% 140,267 5.4%
Other Assets 20,475 15,214 34.6% 17,315 18.3%
Total Assets 219,875 177,378 24.0% 208,409 5.5%
CASA 39,247 30,097 30.4% 41,047 (4.4%)
Time Deposits & CD 99,444 84,133 18.2% 94,769 4.9%
Total Customer Deposits 138,691 114,230 21.4% 135,816 2.1%
Bill of Exchanges 7,558 21,276 (64.5%) 7,806 (3.2%)
Other Liabilities 52,700 28,072 87.7% 43,911 20.0%
Total Liabilities 198,949 163,579 21.6% 187,532 6.1%
Equity 20,926 13,799 51.7% 20,877 0.2%

73
Asset Quality Ratios – CIMB Group
79.1% 80.0%82.3%
80.8% 80.0% 79.5% 80.7% 81.1%82.2%
84.3% 82.6% 81.9% 81.7%78.4% 79.3%
81.1% 80.6% 80.4% 80.0% 81.1% 81.3% 82.3%
84.0%82.8% 82.3% 82.1%
7.2%6.6%
6.1% 5.9% 5.7% 5.5%5.1%
4.8%4.4%
4.2%3.8% 3.8% 3.6%
5.5%5.0%
4.7% 4.5% 4.5% 4.4% 4.1%3.9% 3.6%
3.5%3.2% 3.1% 3.0%
1.7%1.4% 1.2% 1.2% 1.2% 1.2% 1.0% 0.9% 0.8% 0.7% 0.7% 0.7% 0.7%1.2%
1.0% 0.9% 0.9% 0.9% 0.9% 0.8% 0.8% 0.7% 0.6% 0.6% 0.6% 0.6%
2Q10 3Q10 4Q10 1Q11 2Q11 3Q11 4Q11 1Q12 2Q12 3Q12 4Q12 1Q13 2Q13
Loan Loss Coverage Allowance Coverage (excl SEASAM) Allowance Coverage
Gross NPL Ratio Gross Impaired Loans Ratio Gross Impaired Loans Ratio (excl SEASAM)
Net NPL Ratio Net Impaired Loans Ratio (net of IA & PA) Net NPL Ratio (net of SP & GP)
Net Impaired Loans Ratio (net of IA & PA) (excl SEASAM)

74
Capital Management – All Banking Entities
Notes: 1 Includes half year net profits, except for CIMB Niaga and CIMB Thai
2 Includes 1st interim dividend in respect of FY2013 and post reinvestment of excess cash pursuant to DRS at CIMBGH
3 Includes 50% of quarterly net profits. The capital adequacy ratios of CIMB Niaga remained unchanged under Basel 2 based on Bank Indonesia’s requirements. The approach for Credit Risk and Market Risk is Standardised Approach. Operational Risk is based on Basic Indicator Approach
4 The capital adequacy ratios of CIMB Thai are computed under Basel 3 as per Bank of Thailand’s requirements. The approach for Credit Risk and Market Risk are based on Standardised Approach. Operational Risk is based on Basic Indicator Approach
Basel IIIJun-131
Common Equity Tier 1 Ratio
Tier 1 Total Capital Ratio
CIMB Bank 2 10.1% 12.1% 13.1%
CIMB Investment Bank 20.9% 20.9% 20.9%
CIMB Islamic 9.1% 9.4% 13.3%
CIMB Bank Group 2 8.5% 10.1% 13.2%
CIMB Investment Bank Group 20.5% 20.5% 20.5%
CIMB Niaga 3 n.a 13.4% 15.9%
CIMB Thai 4 10.2% 10.2% 14.5%
Basel III Minimum Regulatory Requirements
Common Equity Tier 1 Ratio
Tier 1 Total Capital Ratio
CIMB Bank 3.5% 4.5% 8.0%
CIMB Investment Bank 3.5% 4.5% 8.0%
CIMB Islamic 3.5% 4.5% 8.0%
CIMB Bank Group 3.5% 4.5% 8.0%
CIMB Investment Bank Group 3.5% 4.5% 8.0%
CIMB Niaga 3 n.a. n.a. 8.0%
CIMB Thai 4 4.5% 6.0% 8.5%