analytics and business -...
TRANSCRIPT
Analytics and Business Intelligence 2015
Vendor Report
Prepared for
2
© Ventana Research 2016
Ventana Research Value Index: Analytics and Business Intelligence 2015
San Ramon, California April 2015
Ventana Research performed this research and analysis independently. Our goals were to determine the Value Index for Analytics and Business Intelligence and to evaluate vendors and products in accordance with the Ventana Research business intelligence blueprint and specific operational and performance activities and processes. We charged no fees for this research and invited to participate all vendors that are delivering applications to enable business intelligence. This report includes vendors and products generally available as of December 2014.
Our purpose in conducting this research was to evaluate the maturity of software vendors and products and their appropriateness for the methodology and processes of analytics and business intelligence. This research and report are not intended to imply that one vendor or product is the right choice for any particular organization. Rather, they provide a baseline of knowledge that organizations can use to evaluate vendors and products to manage and improve analytics and business intelligence by aligning business and IT. Unlike IT analyst firm reports that use subjective influences to score vendors, our research is based on thorough analysis of customer assurance and product categories that best represent how an organization should evaluate its technology supplier.
The full report with detailed analysis is available for purchase. We can provide detailed insights on this Value Index and advice on its relevance to an organization through the Ventana On-Demand research and advisory service. Assessment services based on this benchmark research also are available.
We certify that Ventana Research performed the research to the best of our ability; that the analysis is a faithful representation of our knowledge of vendors and products; and that the analysis and scoring are our own.
Ventana Research 2603 Camino Ramon, Suite 200
San Ramon, CA 94583-9137 [email protected]
(925) 242-2579 www.ventanaresearch.com
3
© Ventana Research 2016
Ventana Research Value Index: Analytics and Business Intelligence 2015
Analytics and Business Intelligence Ventana Research defines business intelligence (BI) as a business technology managed by IT that is designed to produce from business data insights to guide decision-making. BI has undergone a continuing evolution. The processes that comprise business intelligence today have expanded beyond standard query, reporting, analysis and publishing capabilities. They now include the sourcing and integration of data and at later stages the use of analytics for planning and forecasting as well as capabilities utilizing analytics and metrics for collaborative interaction and performance management. Analytics, an essential component of BI, is a technology-based set of methodologies used by business-based analysts as well as the information gained through the use of those methodologies. In the past year, Ventana Research conducted benchmark research in the areas of information optimization and big data analytics. In those and our next-generation business intelligence and analytics research
conducted from 2012 to 2014, we examined the expansion of business intelligence through the incorporation of the innovative technologies of cloud computing, mobility and advanced analytics as well as of colla-boration, social media techniques and loca-tion-related analytics into products. The findings of these benchmark research un-dertakings inform our evaluations in this 2015 Value Index for Analytics and Business Intelligence.
The research on big data analytics finds that new technologies collectively known as big data are influencing the evolution of business intelligence as well; here in-memory systems (used by 50% of participating organizations), Hadoop (42%) and data warehouse appliances (33%) are the most important innovations. In-memory computing in particular has changed BI because of the ability it conveys to rapidly process computation of even complex models with very large data sets. In-memory computing also can change how users access data through data visualization and incorporate data
Our research finds that new technologies collectively known as big data are influencing the evolution of business intelligence.
4
© Ventana Research 2016
Ventana Research Value Index: Analytics and Business Intelligence 2015
mining, simulation and predictive analytics into business intelligence systems. In-memory computing has made viable new analytic discovery approaches such as just-in-time calculation and visualization that enable business users to move quickly and easily through data and create useful new types of information. According to our benchmark research on information optimization, charts (for 78% of participants) and tables (76%) are the most common ways of presenting information, and visual discovery tools make it possible for them to be more interactive. It’s hardly inconsequential that visual discovery tools can help small and midsize companies move away from reliance on spreadsheets, which are not suited for complex and collaborative modeling and analysis. For larger companies, such tools can deliver
new capabilities of interactivity and root-cause analysis to complement their established business intelligence tools. Also newly available are self-service tools that can enable business users to reduce their reliance on IT to access and use data and analysis. However, our information optimization research shows that this change is slow to proliferate. In four out of five organizations, IT currently is involved in making information available to end users and remains entrenched in the operations of business intelligence systems.
Despite the importance of visualization, the category of
analytic discovery, extends farther to include automated statistical analysis, search and monitoring of events in real time. It plays a role in all phases of the analytic life cycle today, from data access and data preparation through optimization of information for the end user. Complementing analytic discovery is prediction, which typically follows discovery. Discovery facilitates root-cause and historical analysis, but to look ahead and make decisions that produce desired business outcomes, organizations need processes to rely on appropriate metrics to make informed predictions. Predictive analytics has a number of
In four out of five organizations, IT is involved making information available to end users and generally remains entrenched with business intelligence systems.
5
© Ventana Research 2016
Ventana Research Value Index: Analytics and Business Intelligence 2015
components, among them confirmatory analytics that are hypotheses-driven and exploratory techniques that rely on data to generate hypotheses. Another component of prediction is simulation or what-if analysis, which is a key aspect of performance management systems. Predictive analytics are often complemented by rules-based systems that provide parameters for both analysis and action. For this next generation of BI to deliver significant added value to companies that use it, it will have to work with their existing applications and systems and be able to draw information from them. Thus another important feature of today’s advanced BI systems is analytic integration, which involves customization of both discovery and predictive analytics and embedding of them in other organizational systems such as applications and portals. Our research finds strong interest in both mobile and collaborative BI. Two-thirds of participants in our next-generation business intelligence research said that collaborative capabilities are important or very important to their BI processes, and those in executive and management positions most often said they are very important. The overall percentage was about the same for mobile capabilities, and
nearly half of executives and management said that this is very important. The re-search shows also that a range of func-tional roles will use next-generation busi-ness intelligence in business: 14 roles for collaborative BI and eight for mobile BI were named by at least 30 percent of par-ticipants. The benefits participants most often seek from collaborative BI, each identified by two-thirds or more, are to improve decision-making, improve com-munication and knowledge sharing, and increase productivity. The expanding use of BI tools by business
people also increases the importance of tools being easy to use. In our research the
evaluation criterion most often identified as very important for business intelligence products is usability. In the previous generation
The expanding use of BI by business people also puts an emphasis on tools being easy to use. The criterion most often identified as very important for business intelligence products is usability.
6
© Ventana Research 2016
Ventana Research Value Index: Analytics and Business Intelligence 2015
of business intelligence, applications were not always optimized for visual analysis or mobile capabilities such as touch-screen interfaces and gestures. Today’s mobile workforce requires the ability to access and analyze data simply, straightforwardly and through an intuitive interface.
The Value Index for Analytics and Business Intelligence uses the Ventana Research methodology, a framework that evaluates application vendors and their products in seven categories of requirements. Five are product-related, assessing usability, manageability, reliability, capability and adaptability, while two quantify the customer assurance issues of vendor validation and total cost of ownership and return on investment (TCO/ROI). This Value Index report evaluates the following vendors that offer products that address key elements of business intelligence as we define it: Actuate, IBM, Information Builders, Logi Analytics, Microsoft, MicroStrategy, Oracle, Pentaho, Qlik, SAP, SAS, SpagoBI, Tableau, Tibco and Yellowfin. Where the acquisition and deployment of new systems is indicated, we urge organizations to do a thorough job of evaluating business intelligence systems and tools and offer this Value Index as both the results of our in-depth analysis of these vendors and as an evaluation methodology. The Value Index can be used to evaluate existing suppliers and also provides evaluation criteria for new projects; applying it thus can shorten the RFP cycle time. Unlike many IT analyst firms that rank vendors from an IT-only perspective, Ventana Research has designed the Value Index to provide a balanced perspective of vendors and products that is rooted in an understanding of business drivers and needs. This approach not only reduces cost and time but also minimizes the risk of making a decision that is bad for the business. Using the Value Index will enable your organization to achieve the levels of efficiency and effectiveness needed to optimize business intelligence.
7
© Ventana Research 2016
Ventana Research Value Index: Analytics and Business Intelligence 2015
Value Index Overview The Ventana Research Value Index: Analytics and Business Intelligence in 2015 is the distillation of a year of market and product research efforts by Ventana Research, the premier benchmark research and advisory services firm. Built on a foundation of 10 years of business and technology research, this unbiased, fact-based index is
the first such industry undertaking to assess the value of software designed specifically for enabling analytics and business intelligence. This Ventana Research Value Index is an analytic representation of our assessment of how well vendors’ offerings meet buyers’ requirements for software that enables and supports business intelligence. The Index evaluates the software in seven key categories. Five are product-related: Usa-bility, Manageability, Reliability, Capability and Adaptability. In addition, we consi-dered two customer assurance categories: Vendor Validation and Total Cost of Owner-ship and Return on Investment (TCO/ROI).
To assess functionality, one of the components of capability, we applied the Ventana Research business intelligence methodology and blueprint, which links the business process of business intelligence to an organization’s information technology. We use our research-based analytics and methodology to generate the Value Index percentages. We then build them into a set of indicators that we present graphically as temperature charts. In these indicators the colors reflect our assessment of the value to you, the potential buyer, on a scale from minimally valuable, or Frigid (blue), to very valuable, or Hot (red). Thus, we present the Value Index in both analytic and graphic form, each depicting the value of a specific vendor’s offering based on an evaluation of what it can deliver that is relevant to your business intelligence needs.
This Ventana Research Value Index is an analytic representation of our assessment of how well vendors’ offerings meet buyers’ requirements for software that enables and supports business intelligence.
8
© Ventana Research 2016
Ventana Research Value Index: Analytics and Business Intelligence 2015
The Value Index is not an abstraction; Ventana Research used a carefully crafted best practices-based methodology to represent how organizations actually will assess vendors. We believe it is important to take this approach, since making the wrong decisions can raise the
total cost of ownership, lower the return on investment and hamper your organization’s ability to reach its complete potential. In addition, this approach can reduce the project’s development and deployment time and eliminate the risk of placing on your short list vendors that are wrong for your organization. To ensure the accuracy of the information we collected, we required participating vendors to provide evaluation data across seven categories designed to reflect the concerns of a well-crafted RFP. Ventana Research then validated the information, first independently through our database of
product information and extensive Web-based research, and then in consultation with the vendors. The majority of selected vendors participated in one-on-one consultative sessions, after which we requested them to provide additional documentation to support any new inputs.
Making the wrong decision in assessing vendors can raise the total cost of ownership, lower the return on investment and hamper your organization’s ability to reach its complete potential.
9
© Ventana Research 2016
Ventana Research Value Index: Analytics and Business Intelligence 2015
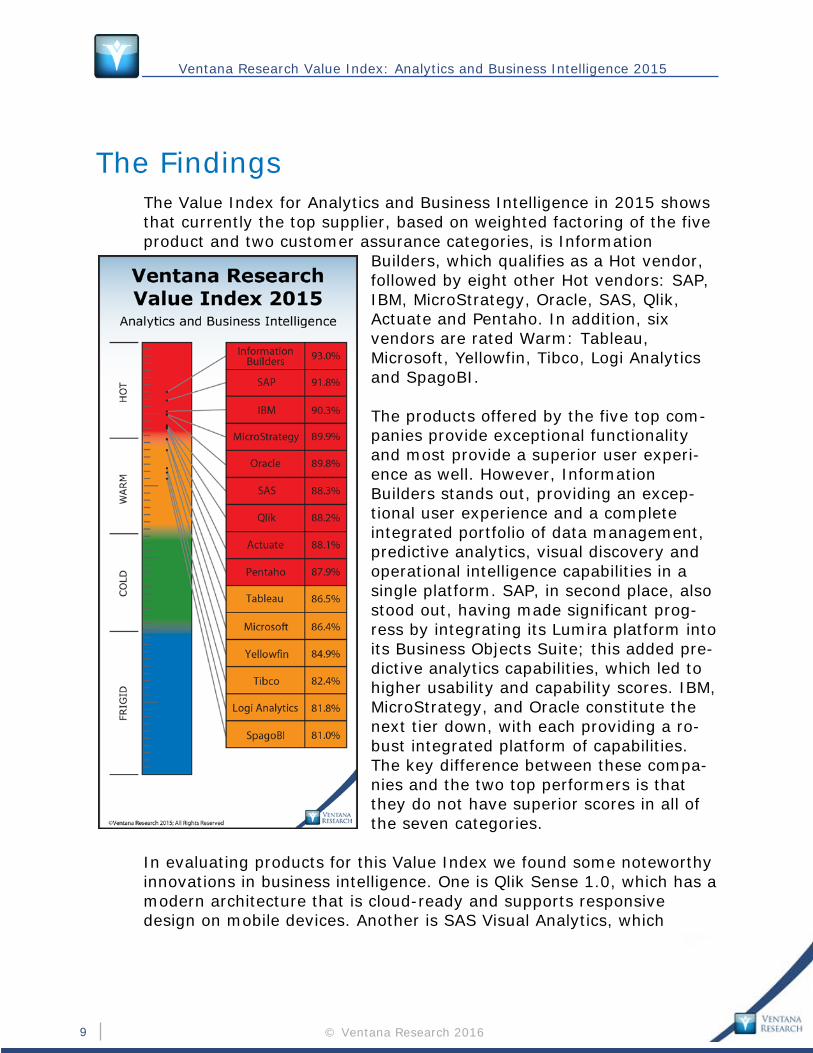
The Findings The Value Index for Analytics and Business Intelligence in 2015 shows that currently the top supplier, based on weighted factoring of the five product and two customer assurance categories, is Information
Builders, which qualifies as a Hot vendor, followed by eight other Hot vendors: SAP, IBM, MicroStrategy, Oracle, SAS, Qlik, Actuate and Pentaho. In addition, six vendors are rated Warm: Tableau, Microsoft, Yellowfin, Tibco, Logi Analytics and SpagoBI. The products offered by the five top com-panies provide exceptional functionality and most provide a superior user experi-ence as well. However, Information Builders stands out, providing an excep-tional user experience and a complete integrated portfolio of data management, predictive analytics, visual discovery and operational intelligence capabilities in a single platform. SAP, in second place, also stood out, having made significant prog-ress by integrating its Lumira platform into its Business Objects Suite; this added pre-dictive analytics capabilities, which led to higher usability and capability scores. IBM, MicroStrategy, and Oracle constitute the next tier down, with each providing a ro-bust integrated platform of capabilities. The key difference between these compa-nies and the two top performers is that they do not have superior scores in all of the seven categories.
In evaluating products for this Value Index we found some noteworthy innovations in business intelligence. One is Qlik Sense 1.0, which has a modern architecture that is cloud-ready and supports responsive design on mobile devices. Another is SAS Visual Analytics, which
10
© Ventana Research 2016
Ventana Research Value Index: Analytics and Business Intelligence 2015
combines predictive analytics with visual discovery in ways that are a step ahead of others currently in the market. Pentaho’s Automated Data Refinery concept adds its unique Pentaho Data Integration platform to business intelligence for a flexible, well-managed user experience. IBM Watson Analytics uses advanced analytics and natural language processing for an interactive experience beyond the traditional drag-and-drop or menu-oriented paradigm of business intelligence. MicroStrategy’s innovative Usher technology addresses the need for identity management and security, especially in an evolving era in which individuals utilize multiple devices to access information. The Value Index analysis uncovered notable differences in how products satisfy the business intelligence needs of employees working in a range of IT and business roles. Our analysis also found substantial variation in how products provide development, security and collaboration capabilities and role-based support for users. Thus, we caution that similar vendor scores should not be taken to imply that
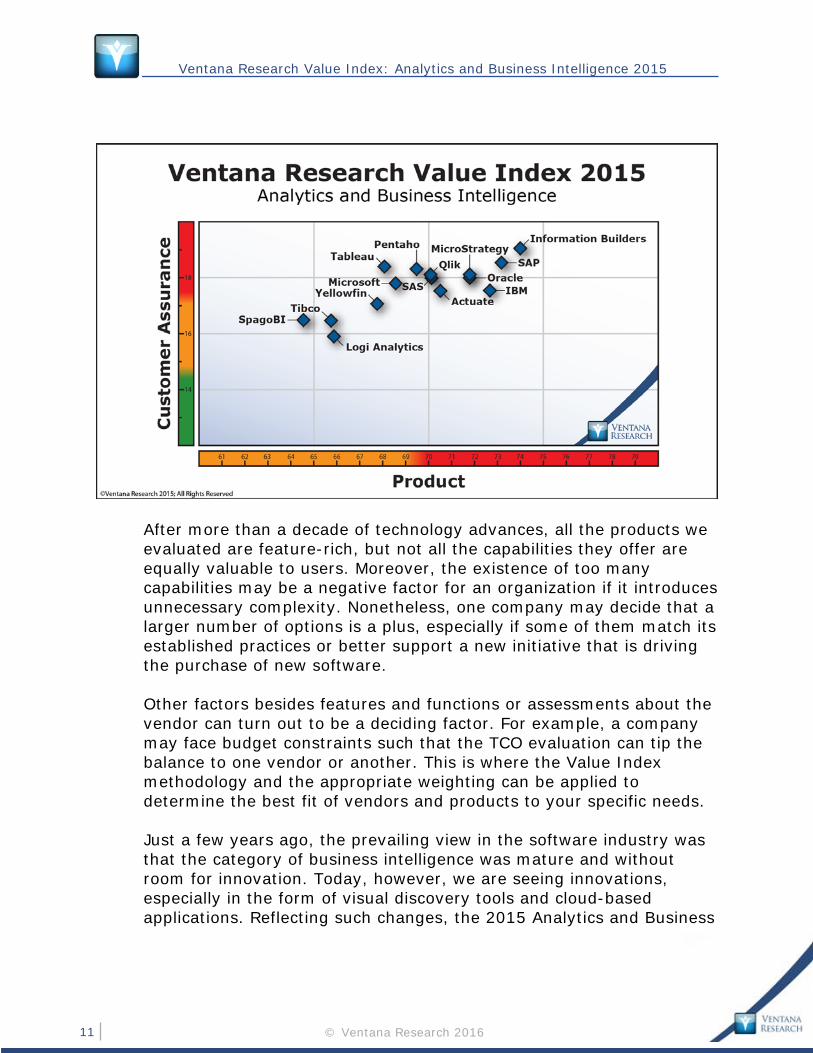
the packages evaluated are functionally identical or equally well suited for use by every organization or for a specific process. As noted above, this Ventana Research Value Index evaluates the software in seven key categories. Five are product-related: Usability, Manageability, Reliability, Capa-bility and Adaptability. In addition, we con-sidered two customer assurance categories: Vendor Validation and Total Cost of Owner-ship and Return on Investment (TCO/ROI). The chart below places the product-related
and customer assurance scores on the X and Y axes respectively to provide a visual representation
of our Value Index scores. Those vendors whose products scored higher in aggregate in the five product categories place higher, to the right, with their standing shown by the color-coding of the horizontal axis; the combination of scores for the two customer assurance categories determine their placement on the vertical access and the corresponding color-coded standing in that area.
Similar vendor scores should not be taken to imply that the packages evaluated are functionally identical or equally well suited for use by every organization or for a specific process.
11
© Ventana Research 2016
Ventana Research Value Index: Analytics and Business Intelligence 2015
After more than a decade of technology advances, all the products we evaluated are feature-rich, but not all the capabilities they offer are equally valuable to users. Moreover, the existence of too many capabilities may be a negative factor for an organization if it introduces unnecessary complexity. Nonetheless, one company may decide that a larger number of options is a plus, especially if some of them match its established practices or better support a new initiative that is driving the purchase of new software. Other factors besides features and functions or assessments about the vendor can turn out to be a deciding factor. For example, a company may face budget constraints such that the TCO evaluation can tip the balance to one vendor or another. This is where the Value Index methodology and the appropriate weighting can be applied to determine the best fit of vendors and products to your specific needs. Just a few years ago, the prevailing view in the software industry was that the category of business intelligence was mature and without room for innovation. Today, however, we are seeing innovations, especially in the form of visual discovery tools and cloud-based applications. Reflecting such changes, the 2015 Analytics and Business
12
© Ventana Research 2016
Ventana Research Value Index: Analytics and Business Intelligence 2015
Intelligence Value Index has advanced from the previous version in three major respects. First, we increased the specificity of the characteristics we evaluated in Usability, Manageability, Reliability and Adaptability to be able to differentiate the products better. Second, we continued to add to the list of elements we assessed in the Capabilities section to reflect the ongoing evolution of the product offerings. Third, we included cloud-based products. However, because the Ventana Research Value Index focuses on today’s practical buying environment for enterprise products, cloud systems did not have a major impact on our scoring. Our research, as well as the lack of maturity of the cloud-based products evaluated here, shows that organizations are still in the early stages of cloud adoption for analytics and business intelligence; deployments are mostly departmental in scope. The addition of two vendors, Tableau and Yellowfin, and the removal of three others (arcplan, InetSoft and Jaspersoft) reflect changes in the market including the advancement of visual discovery, acquisitions and company momentum. The changes in our evaluation as well as the innovations that vendors have made shape the findings of this new Value Index.
13
© Ventana Research 2016
Ventana Research Value Index: Analytics and Business Intelligence 2015
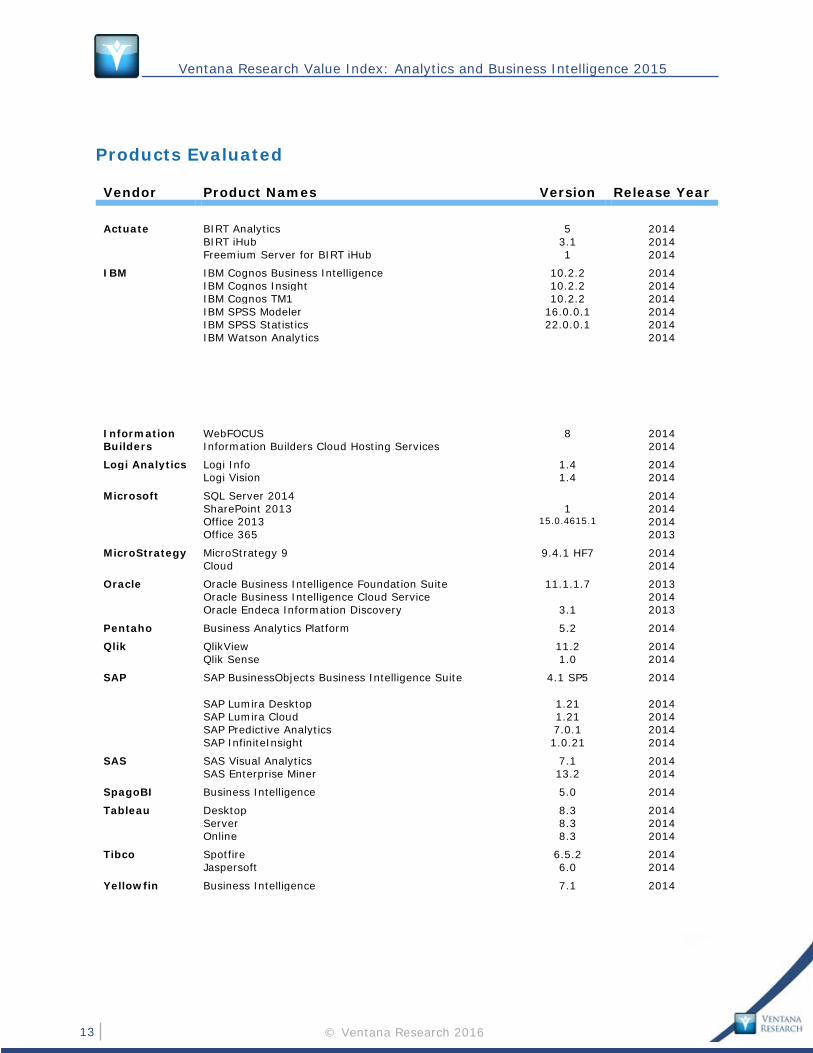
Products Evaluated Vendor Product Names Version Release Year
Actuate BIRT Analytics 5 2014 BIRT iHub 3.1 2014 Freemium Server for BIRT iHub 1 2014
IBM IBM Cognos Business Intelligence 10.2.2 2014 IBM Cognos Insight 10.2.2 2014 IBM Cognos TM1 10.2.2 2014 IBM SPSS Modeler 16.0.0.1 2014 IBM SPSS Statistics 22.0.0.1 2014 IBM Watson Analytics 2014
Information WebFOCUS 8 2014 Builders Information Builders Cloud Hosting Services 2014
Logi Analytics Logi Info 1.4 2014 Logi Vision 1.4 2014
Microsoft SQL Server 2014 2014 SharePoint 2013 1 2014 Office 2013 15.0.4615.1 2014 Office 365 2013
MicroStrategy MicroStrategy 9 9.4.1 HF7 2014 Cloud 2014
Oracle Oracle Business Intelligence Foundation Suite 11.1.1.7 2013 Oracle Business Intelligence Cloud Service 2014 Oracle Endeca Information Discovery 3.1 2013
Pentaho Business Analytics Platform 5.2 2014
Qlik QlikView 11.2 2014 Qlik Sense 1.0 2014
SAP SAP BusinessObjects Business Intelligence Suite 4.1 SP5 2014 SAP Lumira Desktop 1.21 2014 SAP Lumira Cloud 1.21 2014 SAP Predictive Analytics 7.0.1 2014 SAP InfiniteInsight 1.0.21 2014
SAS SAS Visual Analytics 7.1 2014 SAS Enterprise Miner 13.2 2014
SpagoBI Business Intelligence 5.0 2014
Tableau Desktop 8.3 2014 Server 8.3 2014 Online 8.3 2014
Tibco Spotfire 6.5.2 2014 Jaspersoft 6.0 2014
Yellowfin Business Intelligence 7.1 2014
14
© Ventana Research 2016
Ventana Research Value Index: Analytics and Business Intelligence 2015
15
© Ventana Research 2016
Ventana Research Value Index: Analytics and Business Intelligence 2015
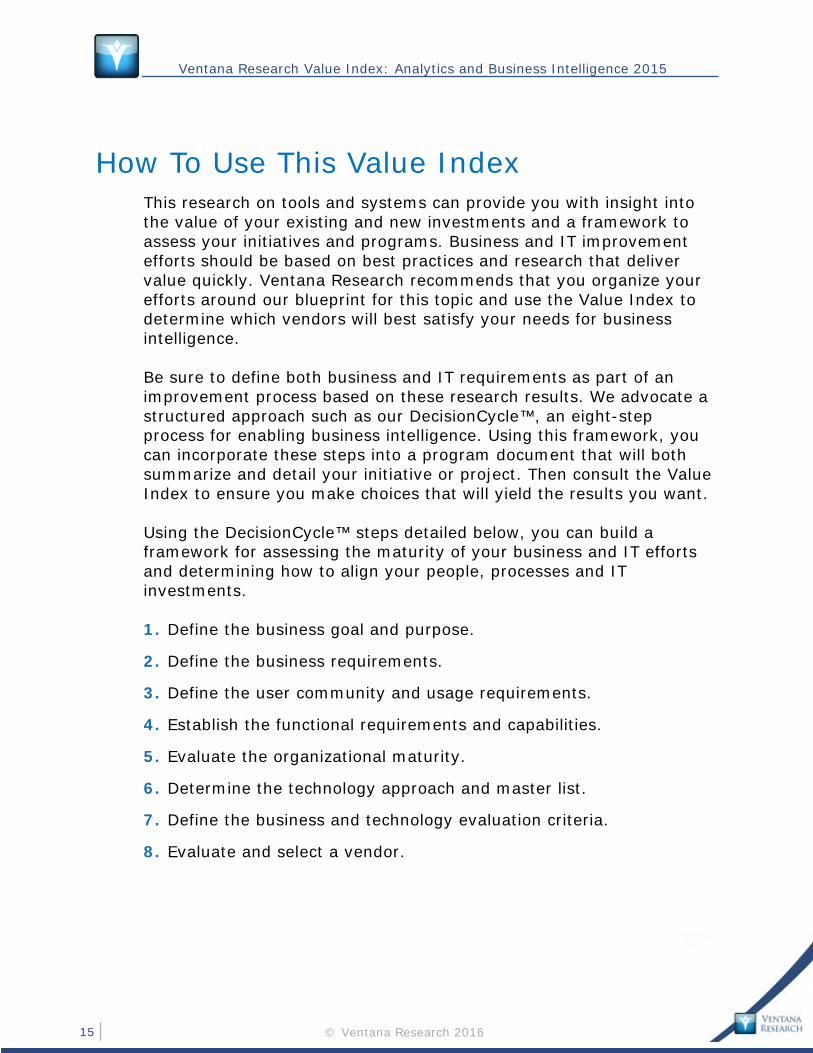
How To Use This Value Index This research on tools and systems can provide you with insight into the value of your existing and new investments and a framework to assess your initiatives and programs. Business and IT improvement efforts should be based on best practices and research that deliver value quickly. Ventana Research recommends that you organize your efforts around our blueprint for this topic and use the Value Index to determine which vendors will best satisfy your needs for business intelligence. Be sure to define both business and IT requirements as part of an improvement process based on these research results. We advocate a structured approach such as our DecisionCycle™, an eight-step process for enabling business intelligence. Using this framework, you can incorporate these steps into a program document that will both summarize and detail your initiative or project. Then consult the Value Index to ensure you make choices that will yield the results you want. Using the DecisionCycle™ steps detailed below, you can build a framework for assessing the maturity of your business and IT efforts and determining how to align your people, processes and IT investments. 1. Define the business goal and purpose.
2. Define the business requirements.
3. Define the user community and usage requirements.
4. Establish the functional requirements and capabilities.
5. Evaluate the organizational maturity.
6. Determine the technology approach and master list.
7. Define the business and technology evaluation criteria.
8. Evaluate and select a vendor.
16
© Ventana Research 2016
Ventana Research Value Index: Analytics and Business Intelligence 2015
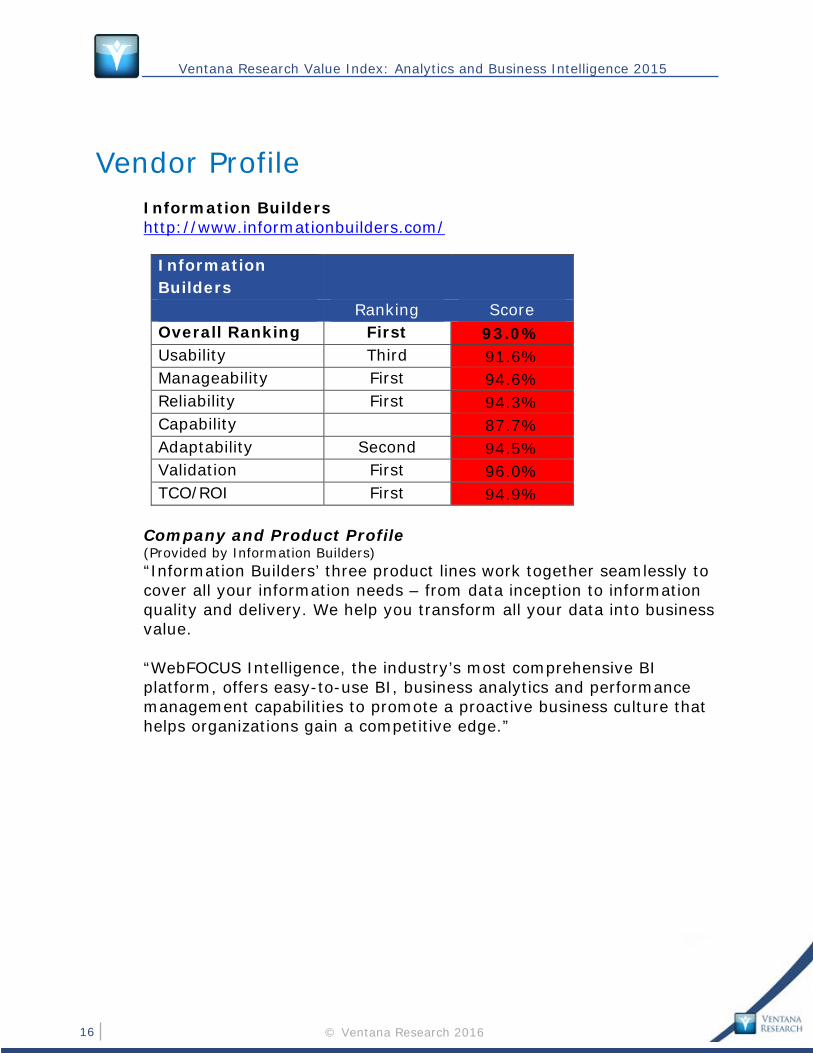
Vendor Profile Information Builders
http://www.informationbuilders.com/
Information Builders
Ranking Score Overall Ranking First 93.0% Usability Third 91.6% Manageability First 94.6% Reliability First 94.3% Capability 87.7% Adaptability Second 94.5% Validation First 96.0% TCO/ROI First 94.9%
Company and Product Profile (Provided by Information Builders) “Information Builders’ three product lines work together seamlessly to cover all your information needs – from data inception to information quality and delivery. We help you transform all your data into business value. “WebFOCUS Intelligence, the industry’s most comprehensive BI platform, offers easy-to-use BI, business analytics and performance management capabilities to promote a proactive business culture that helps organizations gain a competitive edge.”
17
© Ventana Research 2016
Ventana Research Value Index: Analytics and Business Intelligence 2015
Ventana Research Evaluation Information Builders is an established global software company that continues to advance in many areas of business intelligence including access to big data, visual discovery, predictive analytics, mobile business intelligence and operational intelligence. It focuses on outcomes by integrating predictive analytics and supporting performance management through metrics to track progress toward goals. Information Builders also advances access to, integration of and quality control of data through information management technology that accelerates the processing of data to which analytics can be applied. WebFOCUS 8’s inclusion of data integration, data quality, master data management, performance management and visualization is a key reason for the company having the top position in this Value Index. Furthermore, WebFOCUS 8 has an HTML5 rendering engine and Active Technology to enhance usability and optimize information in the browser for delivery to any device in a timely fashion. Information Builders scored highest in four of the seven categories, with its highest score in Validation, which reflects a business focus on customer use cases and support for customer success. The company also has the highest rating in Reliability due to the scalability and performance of its platform. Its lowest rating is in Capability, but it is nonetheless a Hot vendor in that category. It scores well in the Capability subcategories of data and analytics, and specific areas of the subcategory of Optimization, which describes the abilities to manage performance, support a range of skill levels among users and automate notification of information. Information Builders should improve its access to cloud data sources and enable a broader class of predictive analytic tasks; it also should provide more social collaboration capabilities for interactive dialogue on the analytics and metrics. Information Builders continues to innovate around its InfoApps and Active Technology for mobile operational intelligence and embedded use.
18
© Ventana Research 2016
Ventana Research Value Index: Analytics and Business Intelligence 2015
Appendix: Vendor Inclusion We invited all vendors with relevant business intelligence offerings to participate in the Value Index evaluation process, at no cost to them. If the vendor did not respond to the invitation, we made a determination whether to include it in our analysis based on our knowledge of the company, its products and customers. We have adopted this approach because we view it as our responsibility to assess all relevant vendors whether or not they choose to invest the time and effort to participate. Ten of the 15 suppliers evaluated above responded positively to our requests for information to help in our analysis of their business intelligence products; those that did not are Logi Analytics, Microsoft, Oracle, SAP and Tibco. For these vendors we based our evaluations on reviews of their products and customers and on information available on the Internet and through briefings and demonstrations from them. We did not include a number of other vendors in this Value Index evaluation because they did not satisfy a sufficient number of the criteria that our methodology for this research requires.
This Vendor Report is drawn from the full Ventana Research Value Index report, which lays out in detail the analysis underlying the Value Index, lists the products evaluated, and suggests a methodology for preparing for a related RFP. The full report is available for purchase, payable by check or credit card. For more information about the full Value Index report or assessment of your organization using the Value Index, please contact us at [email protected].
19
© Ventana Research 2016
Ventana Research Value Index: Analytics and Business Intelligence 2015
About Ventana Research Ventana Research is the leading benchmark research and business technology advisory services firm. We provide insight and expert guidance on trends and mainstream and disruptive technologies. Our unparalleled insights and best practices guidance are based on our rigorous research-based benchmarking of people, processes, information and technology across business and IT functions worldwide. The combination we offer of benchmark research, market coverage and in-depth knowledge of hundreds of technology providers means we can deliver business and technology education and expertise to our clients where and when needed to reduce the time requirements, cost and risk of technology investments. The Ventana Research Indexes – the Value Index and the Benchmark Index family – have redefined the research industry by providing accessible, easy-to-use research-based business and technology guidance to businesses. Ventana Research provides the most comprehensive analyst and research coverage in the industry; the many business and IT professionals worldwide who are members of our community benefit from Ventana Research’s insights, as do highly regarded media and association partners around the globe. Our views and analyses are distributed daily through blogs and social media channels including Twitter, Facebook, LinkedIn and Google+. Ventana Research was ranked the #1 analyst firm you can trust in enterprise software for 2009 for its relevance to the industry. To learn how Ventana Research advances the maturity of organizations use of information and technology through benchmark research, education and advisory services, visit www.ventanaresearch.com. We offer a variety of customizable services to meet your specific needs including workshops, assessments and advisory services. Our education service, led by analysts with more than 20 years of experience, provides a great starting point to learn about important business and technology topics from compliance to business intelligence to building a strategy and driving adoption of best practices. We also offer tailored Value Index Assessment Services to help you define your strategy, build a business case and connect the business and technology phases of your project. And we can provide Ventana On-Demand access to our analysts on an as-needed basis to help you keep up with market trends, technologies and best practices.
20
© Ventana Research 2016
Ventana Research Value Index: Analytics and Business Intelligence 2015
Everything at Ventana Research begins with our focused research, of which this Value Index is a part. We work with thousands of organizations worldwide, conducting research and analyzing market trends, best practices and technologies to help our clients improve the efficiency and effectiveness of their organizations. Through the Ventana Research community we also provide opportunities for professionals to share challenges, best practices and methodologies. Sign up for Individual membership at www.ventanaresearch.com to gain access to our weekly insights and learn about upcoming educational and collaboration events – webinars, conferences and opportunities for social collaboration on the Internet. We offer the following membership levels: Individual membership: For business and IT professionals* interested in full access to our website and analyst team for themselves. The membership includes access to our library of hundreds of white papers and research notes, briefings and telephone or email consulting sessions to provide input and feedback. Team membership: For business and IT professionals* interested in full access to our Web site and analysts for a five-member team. The membership includes access to our library of hundreds of white papers and research notes, briefings, telephone/e-mail consulting sessions to provide input and feedback and the use of Ventana Research materials for business purposes. Business membership: For business and IT professionals* interested in full access to our website and analyst team for their larger team or small business unit. The membership includes access to our library of hundreds of white papers and research notes, briefings, telephone or email consulting sessions to provide input and feedback, use of Ventana Research materials for business purposes and additional analyst availability. Business Plus membership: For business and IT professionals* interested in full access to our website and analyst team for larger numbers of company employees. The membership includes access to our library of hundreds of white papers and research notes, briefings, telephone or email consulting sessions to provide input and feedback,
21
© Ventana Research 2016
Ventana Research Value Index: Analytics and Business Intelligence 2015
quotes and validation for media, use of Ventana Research materials for business purposes, additional analyst availability and access to our team for scheduled strategy consulting sessions. This Value Index report is one of a series that are available for purchase. Also available are any of our extensive library of Benchmark Research reports. To purchase a report or learn more about Ventana Research services – including workshops, assessments and advice – please contact [email protected]. * Additional services are available for solution providers, software vendors, consultants and systems integrators.
This material is copyrighted. Reproduction or distribution of this research in any form without prior written permission is forbidden. The research is based on information obtained from sources believed to be reliable, which can include communications from the technology supplier and information made available publicly on the Internet. Ventana Research is not liable for any inaccuracies in the information supplied.