analyzing data properties using statistical sampling ... · analyzing data properties using...
TRANSCRIPT

Analyzing Data Properties using
Statistical Sampling Techniques
Illustrated on Scientific File Formats and Compression Features
Julian M. Kunkel
June 2, 2016
Introduction Exploring a Subset of Data Statistical Sampling Summary
Outline
1 Introduction
2 Exploring a Subset of Data
3 Statistical Sampling
4 Summary
Julian Kunkel HPC-IODC Workshop, 2016 2 / 22

Introduction Exploring a Subset of Data Statistical Sampling Summary
Motivation
Understanding data characteristics is useful
Relation of file types to optimize relevant file formatsConducting what-if analysis
Influence of compression, deduplicationPerformance expectations
Analysing large quantities of data is time consuming and costly
Scanning petabytes of data in > 100 millions of filesWith 50 PB of data and 5 GiB/s read, 115 node days are neededThe complete experiment for this paper would have cost 4000 e
⇒ Working on a representative data set reduces costs
Conducting analysis on representative data is difficult
What data makes up a representative data set?How can we infer knowledge for all data based on the subset?
Based on file numbers (i.e. a typical file is like X)Based on capacity (i.e. 10% of storage capacity is like Y)
Many studies simply select a data set and claim it is representative
Julian Kunkel HPC-IODC Workshop, 2016 3 / 22
Introduction Exploring a Subset of Data Statistical Sampling Summary
Contribution
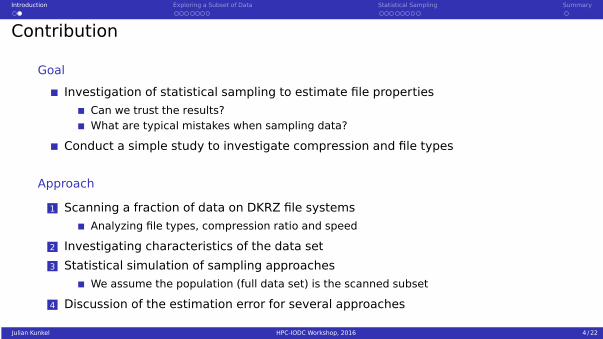
Goal
Investigation of statistical sampling to estimate file properties
Can we trust the results?What are typical mistakes when sampling data?
Conduct a simple study to investigate compression and file types
Approach
1 Scanning a fraction of data on DKRZ file systems
Analyzing file types, compression ratio and speed
2 Investigating characteristics of the data set
3 Statistical simulation of sampling approaches
We assume the population (full data set) is the scanned subset
4 Discussion of the estimation error for several approaches
Julian Kunkel HPC-IODC Workshop, 2016 4 / 22
Introduction Exploring a Subset of Data Statistical Sampling Summary
1 Introduction
2 Exploring a Subset of DataSampling ApproachProcessing of FilesDistribution of File SizesScientific File FormatsCompression RatioCompression SpeedDifferences Between Projects
3 Statistical Sampling
4 Summary
Julian Kunkel HPC-IODC Workshop, 2016 5 / 22

Introduction Exploring a Subset of Data Statistical Sampling Summary
Sampling of the Test Data
DKRZ usage: 320 million files in 12 PB, 270 project dirsScan of user accessible data (scan is done by a regular user)
Accessible data: 58 million files, 160 project dirs
Scanned files: 380 k files (0.12%) in 53.1 TiB (0.44%) capacityDiscrepancy since home directories contain very small files
Scanning Process
1 Run a find for each project directory, store it is a file
2 Select up to 10 k files from each project randomly (scan list)
3 Permutate the scan list
4 Partition the scan list into chunks (file lists)
5 Run multiple processes concurrently, each working on a file list
6 Terminate the processes after a couple of days
As we will see this approach is not optimal for analyzing by capacity
Julian Kunkel HPC-IODC Workshop, 2016 6 / 22

Introduction Exploring a Subset of Data Statistical Sampling Summary
Processing of Files
Processing is implemented as simple shell script
Starter script spawns multiple scripts each working on a file list
The process reads the file list and current progress
Allows to restart processes and continue processing
Process ignores non-existing files
Some files are deleted after the scan
Copy the file
(Best alternative, copy data into memory)You would not believe how many files changed on the flyRunning different tools on the data falsifies results
Run tools to investigate properties:
file to identify file type (based on magic), suboptimalCDO to identify scientific file format (high accuracy)Compression tools: LZMA, GZIP, BZIP2, ZIP
Julian Kunkel HPC-IODC Workshop, 2016 7 / 22
Introduction Exploring a Subset of Data Statistical Sampling Summary
Distribution of File Sizes
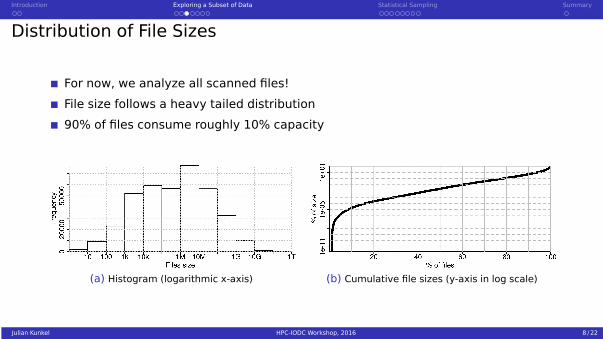
For now, we analyze all scanned files!
File size follows a heavy tailed distribution
90% of files consume roughly 10% capacity
(a) Histogram (logarithmic x-axis) (b) Cumulative file sizes (y-axis in log scale)
Julian Kunkel HPC-IODC Workshop, 2016 8 / 22

Introduction Exploring a Subset of Data Statistical Sampling Summary
Scientific File Formats
The computation by file count and capacity differs
The heavy-tailed distribution skews analysis
file often determines wrong formats
(c) CDO types (d) File types
Julian Kunkel HPC-IODC Workshop, 2016 9 / 22

Introduction Exploring a Subset of Data Statistical Sampling Summary
Compression Ratio
Figure: Arithmetic mean compression of the full data set for each scientific file format computedon file number. The column “all” shows the mean values for the whole data set. Yellow diamondsshow compress % computed by file size
Julian Kunkel HPC-IODC Workshop, 2016 10 / 22

Introduction Exploring a Subset of Data Statistical Sampling Summary
Compression Speed
Measured user-time for the execution of each tool
Ignored I/O
Again difference between compression by size and count
(a) Compression (b) Decompression
Figure: Boxplots showing compression/decompression speed per file, mean shown under the plot
Julian Kunkel HPC-IODC Workshop, 2016 11 / 22
Introduction Exploring a Subset of Data Statistical Sampling Summary
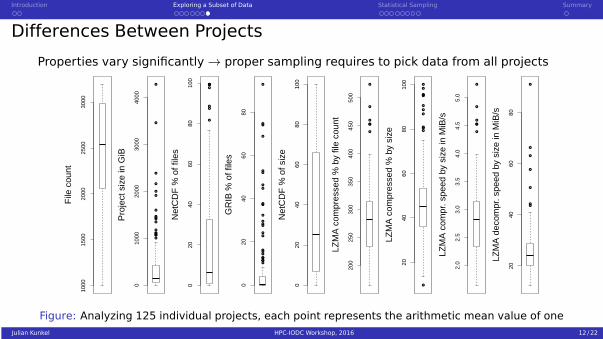
Differences Between Projects
Properties vary significantly → proper sampling requires to pick data from all projects
1000
1500
2000
2500
3000
File
cou
nt
●
●
●
●
●
●
●
●
●
●
●
●
●●
●
●
●
010
0020
0030
0040
00
Pro
ject
siz
e in
GiB
●●●
●
●
●●
●
020
4060
8010
0
Net
CD
F %
of f
iles
●
●
●
●
●
●
●
●
●
●
●
●
●
●●
●
●
●
●
●
●
●
●
●
020
4060
80
GR
IB %
of f
iles
020
4060
8010
0
Net
CD
F %
of s
ize
●
●
●
●
●
●
200
250
300
350
400
450
500
LZM
A c
ompr
esse
d %
by
file
coun
t
●
●
●
●●
●
●
●
●
●
●
●
2040
6080
100
LZM
A c
ompr
esse
d %
by
size
●
●
●
●
●
●
2.0
2.5
3.0
3.5
4.0
4.5
5.0
LZM
A c
ompr
. spe
ed b
y si
ze in
MiB
/s
●
●
●
●
●
●
●
2040
6080
LZM
A d
ecom
pr. s
peed
by
size
in M
iB/s
Figure: Analyzing 125 individual projects, each point represents the arithmetic mean value of oneJulian Kunkel HPC-IODC Workshop, 2016 12 / 22

Introduction Exploring a Subset of Data Statistical Sampling Summary
1 Introduction
2 Exploring a Subset of Data
3 Statistical SamplingOverviewDemonstration of the Strategies
4 Summary
Julian Kunkel HPC-IODC Workshop, 2016 13 / 22

Introduction Exploring a Subset of Data Statistical Sampling Summary
Statistical Sampling
Can we determine the error when analyzing only a fraction of data?We simulate sampling by drawing samples from the totally analyzed files
Statistics offers methods to determine confidence interval and sample size
We analyze random variables for quantities that are continuous or proportions
Proportions: fraction of samples for which a property holds
Sample size and confidence intervals
For proportions Cochran’s sample size formula estimates sample size
Independent to population sizeError bound ±5% requires 400 samples (95% confidence)Error bound ±1% requires 10,000 samples
For continuous variables
Models require to know the distribution of the valueA-priori unknown, usually not Gaussian, difficult to apply→ out-of-scope (here)Nevertheless, we will demonstrate convergence
Julian Kunkel HPC-IODC Workshop, 2016 14 / 22

Introduction Exploring a Subset of Data Statistical Sampling Summary
Sampling Strategies
Sampling to Compute by File Count
1 Enumerate all files
2 Create a simple random sample
Select a random number of files to analyze without replacementFor proportional variables, the number of files can be computed with Cochran’s formulaYou can use simulation to estimate the error for contiguous variables
You may increase sampling size if the accuracy does not suffice
Sampling to Compute by File Size
1 Enumerate all files AND determine their file size
2 Pick a random sample based on the probability filesizetotalsize with replacement
Large files are more likely to be chosen (even multiple times)
3 Create a list of unique file names and analyze them
4 Compute the arithmetic mean for the variables
If a file has been picked multiple times in Step 2., its value is used multiple times
Julian Kunkel HPC-IODC Workshop, 2016 15 / 22

Introduction Exploring a Subset of Data Statistical Sampling Summary
Demonstration of the Strategies
Apply the approach with an increasing number of samples
Compare true value with the estimated value
Running one simulation for increasing sample counts
●
●
●
● ● ● ● ● ● ●
Files scanned
% o
f typ
e/co
mpr
.siz
e
●
●
●
● ● ● ● ● ● ●
●
●
●
● ● ● ● ● ● ●
●
●
●● ● ● ● ● ● ●
11
1 1 1 1 1 1 1
2
2 2
22 2 2 2 2 2
3
33 3 3 3 3 3 3 3
4
4 44 4 4 4 4 4 4
5 5 5 5 5 5 5 5 5 56
6
66 6 6 6 6 6 6
4 16 64 256 1024 4096 16384 65536 262144 316465
010
2030
4050
60
o o o oLZMA GZIP ZIP BZIP2
1 2 3 4 5 6type: unknown netCDF GRIB NetCDF2 NetCDF4 others
(a) Compute mean by count
●●
● ● ● ● ● ● ● ● ●
Random samples
% o
f typ
e/co
mpr
.siz
e
●
● ● ● ● ● ● ● ● ● ●
●
● ● ● ● ● ● ● ● ● ●
●
● ●● ● ● ● ● ● ● ●
1
1 1 1 1 1 1 1 1 1
2
2 2 2 2 2 2 2 2 2 2
3 3
33
3 3 3 3 3 3 3
3 3
33
3 3 3 3 3 3 3
4
44
4 4 4 4 4 4 4 4
5 55 5 5 5 5 5 5 5 5
6
6 6 6 6 6 6 6 6 6 6
4 16 64 256 1024 4096 16384 65536 262144 all
010
2030
4050
60
(b) Compute mean by size
Figure: Evaluating various metrics (proportions) for an increasing number of samples
This suggests that the results converge quickly but how trustworthy is one run?
Julian Kunkel HPC-IODC Workshop, 2016 16 / 22

Introduction Exploring a Subset of Data Statistical Sampling Summary
Investigating Robustness: Computing by File Count
Running the simulation 100 times to understand the variance of the estimateClear convergence: thanks to Cochran’s formula the total file count is irrelevant
●●
●●
● ●
4 16 64 256 1024 4096 16384 65536
010
2030
4050
Random samples
GR
IB fi
les
% o
f file
s
Figure: Simulation of sampling by file count to compute compr.% by file count
Julian Kunkel HPC-IODC Workshop, 2016 17 / 22

Introduction Exploring a Subset of Data Statistical Sampling Summary
Investigating Robustness: Computing by File Size
Using the correct sampling by weighting probability with file size
●
●●●
●●
●
●● ●
4 16 64 256 1024 4096 16384 65536
020
4060
8010
0
Random samples
GR
IB fi
les
% o
f siz
e
Figure: Simulation of sampling to compute proportions of types by size
Julian Kunkel HPC-IODC Workshop, 2016 18 / 22
Introduction Exploring a Subset of Data Statistical Sampling Summary
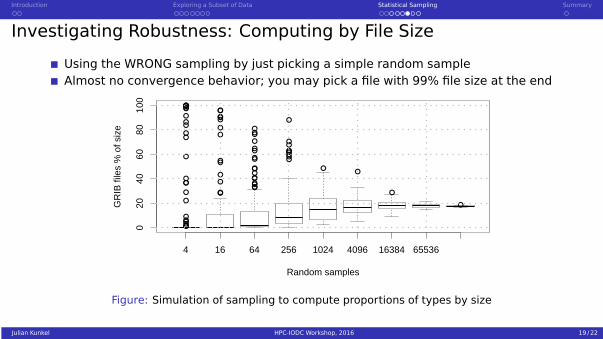
Investigating Robustness: Computing by File Size
Using the WRONG sampling by just picking a simple random sampleAlmost no convergence behavior; you may pick a file with 99% file size at the end
●
●
●
●
●
●
●
●
●
●
●
●
●
●●
●
●
●●
●
●
●
●
●
●
●
●
●
●
●
●
●
●●●
●
●
●
●
●●●●
●
●
●
●
●
●●●
●
●
●
●
●●●●●●
●
●
●●
●
●
4 16 64 256 1024 4096 16384 65536
020
4060
8010
0
Random samples
GR
IB fi
les
% o
f siz
e
Figure: Simulation of sampling to compute proportions of types by size
Julian Kunkel HPC-IODC Workshop, 2016 19 / 22
Introduction Exploring a Subset of Data Statistical Sampling Summary
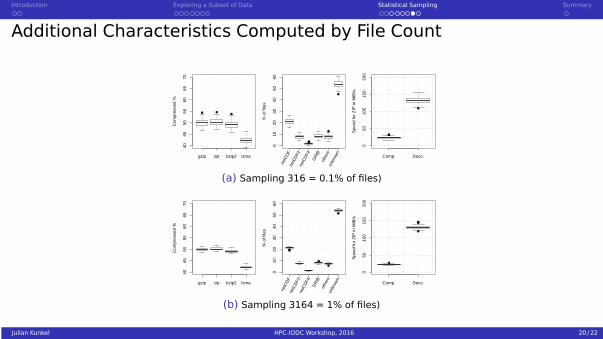
Additional Characteristics Computed by File Count
● ●●
gzip zip bzip2 lzma
4045
5055
6065
70
Com
pres
sed
%
●●●
●
●
010
2030
4050
60
% o
f file
s
netC
DF
netC
DF2
netC
DF4
GR
IBot
hers
unkn
own
●●●
●
Comp. Deco.
050
100
150
200
Spe
ed fo
r Z
IP in
MiB
/s
(a) Sampling 316 = 0.1% of files)
gzip zip bzip2 lzma
4045
5055
6065
70
Com
pres
sed
%
●●
●
●
●
010
2030
4050
60
% o
f file
s
netC
DF
netC
DF2
netC
DF4
GR
IBot
hers
unkn
own
●
●
●
●●
Comp. Deco.
050
100
150
200
Spe
ed fo
r Z
IP in
MiB
/s
(b) Sampling 3164 = 1% of files)
Julian Kunkel HPC-IODC Workshop, 2016 20 / 22

Introduction Exploring a Subset of Data Statistical Sampling Summary
Additional Characteristics Computed by File Size
●
gzip zip bzip2 lzma
4045
5055
6065
70
Com
pres
sed
%
●
●
●●●●0
1020
3040
5060
% o
f file
s
netC
DF
netC
DF2
netC
DF4
GR
IBot
hers
unkn
own
●
●
Comp. Deco.
050
100
150
200
Spe
ed fo
r Z
IP in
MiB
/s
(c) Drawing 256 samples with replacement
●● ●●
●
●
gzip zip bzip2 lzma
4045
5055
6065
70
Com
pres
sed
%
●●
010
2030
4050
60
% o
f file
s
netC
DF
netC
DF2
netC
DF4
GR
IBot
hers
unkn
own
●
Comp. Deco.
050
100
150
200
Spe
ed fo
r Z
IP in
MiB
/s
(d) Drawing 4096 samples with replacement
Julian Kunkel HPC-IODC Workshop, 2016 21 / 22

Introduction Exploring a Subset of Data Statistical Sampling Summary
Summary
We investigated statistical sampling to estimate data characteristics for a system
The approach is demonstrated for analyzing scientific file formats and compression
Several sources of error have been discussed
Estimation of values that should be computed by file size requires proper sampling
Statistic simulation helps to understand the error when analyzing continuous vars
Julian Kunkel HPC-IODC Workshop, 2016 22 / 22