analyzing data - numberyes.files.wordpress.com€¦ · web viewclil unitanalyzing datamaths through...
TRANSCRIPT


Analyzing data
Top 10 Mobile Vendors from July 2012 to June 2013
From http://news.cnet.comThe 10 goals to help you succeed:
1. You will analyze different facts studying numerical and graphical data.2. You will practice a class survey about the media platforms used by
the students of your class.3. You will search for statistical studies on a given topic on the internet.4. You will contribute with your own ideas in the process of designing a
statistical study.5. You will use English in your team to discuss how to design and
conduct a survey and to report the results to the rest of the class with the aid of a Google presentation.
6. You will identify the different statistical terms and parameters to make frequency tables.
7. You will use Google questionnaire to represent data in different kinds of graphs.
8. You will decide the best graph for your oral presentation in order to avoid misleading first-sight conclusions.
9. You will help assess your classmates’ performance and outcomes.
2

First steps in the Data Analysis.
Step 1: Describing what we see with Data:
In the last page you have seen a graph that was used in a piece of news to compare different Smartphone Web Usage. It is very common that journalists use statistical studies to support many kink of news such as scientific discoveries, political opinion polls, sports results, health care articles... the list could be infinite.
The following graphs have been found in different media webs:
PRIVATE COVERANCE IN EE UU
Source: http://www.cdc.gov/
3

Source: CIA Worll Factbook
Source: www.forbes.com
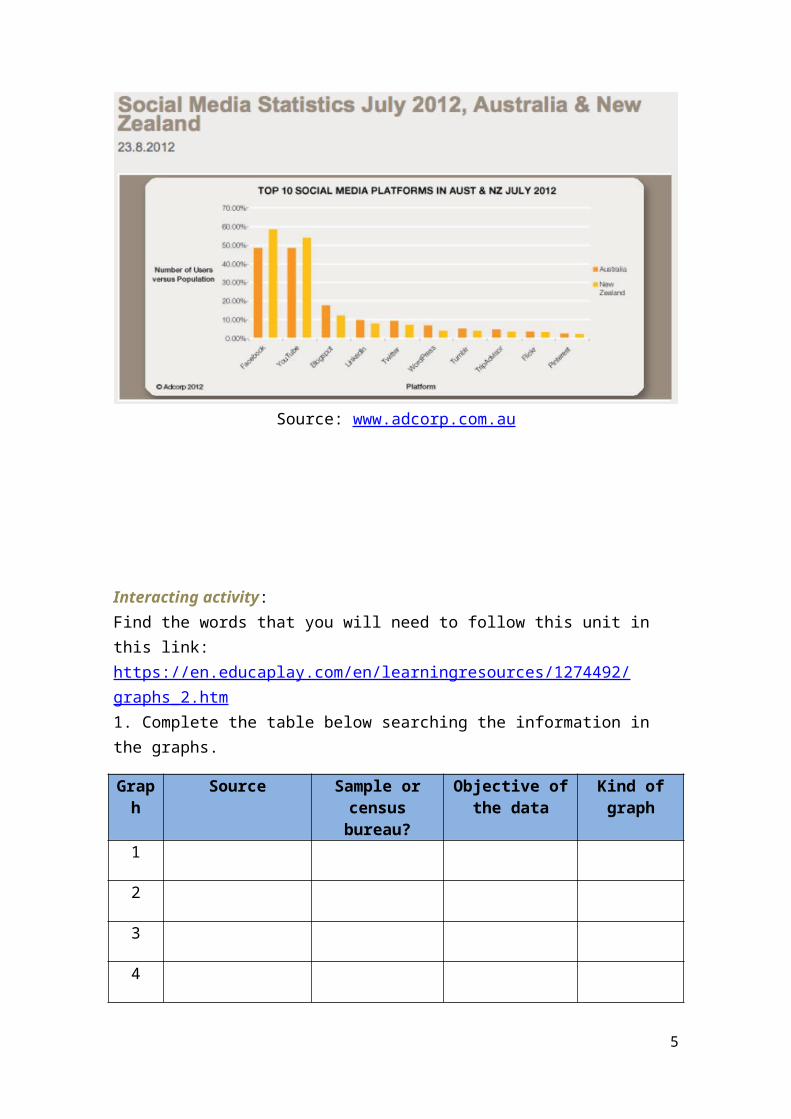
Source: www.adcorp.com.au
4
Interacting activity: Find the words that you will need to follow this unit in this link: https://en.educaplay.com/en/learningresources/1274492/graphs_2.htm1. Complete the table below searching the information in the graphs.
Graph
Source Sample or census bureau?
Objective of the data
Kind of graph
1
2
3
4
2. Now we will put the focus on the variables. Look the graphs and identify the statistical variables. Think about what they represent and the magnitudes that are involved.
Graph Statistical variable Magnitude 1 (horizontal) Magnitude 2 (vertical)
1
2
3
4
3.- Analyze any possible relationship between magnitudes 1 and 2 in each graph and decide if:
a) Magnitude 1 depends on magnitude 2.
b) Magnitude 2 depends on magnitude 1.
c) There is no relationship between magnitude 1 and 2.
Step 2: A closer look. More specific information.
Now it’s time to look for more information from the graphs.
1.- Around which percentage of population prefer private coverage?
2.- What percentage of population is not using any kind coverage?
5

3.- Around which percentage of population is using a public coverage?
4.- What does it show? Read the sentences and decide if the statement is true or false.
a) Most people prefer not to use private coverage.b) In 2010 there was a rise of the people that use private coverage.c) Most of people prefer to use public coverage.d) Around 1/3 of the population has not an insurance.
5.- Let’s focus now on the Statistical Study about the 10 top social media platforms in Australia and New Zealand in July 2012.
Let’s do a Class Survey!!
a) Your team wants to design a survey similar to Australia and New Zealand one with the students in your class.
b) What questions would you like to ask to your mates?c) Organize all the class together to make turns and ask questions to the
whole class. The students can respond the questions by raising their hands. Two students will count the answers.
d) Once you have the data, represent the results in a suitable graph.e) Analyze the results and draw conclusions.f) Compare the percentages the percentages with the population in
Australia and New Zealand.
Hint: You can use one of the Google Applications to make the graphs.
Step 3: Internet Research. What would be the results in Catalonia or Spain?
1.- Individually, search for similar statistical studies about social media in Catalonia or Spain. Every time you use a source found on the interned you have to mention the web that published the graph, the institution that make the study and the yeart; this is very important for your research.
2.- Share the results of your research with your team mates.
3.- Analyze the data you have found and draw conclusions.
4.- Compare the results in Catalonia or Spain with the data of the survey you have studied.
5.- Write a report following the last four suggestions in teams.
Hint: You can visit http://www.idescat.cat for the data.
PROJECT: HOW TO BE A STATISTICIAN
6

The process of collecting, organizing and interpreting huge amounts of data is called statistics. In the project you have to do you will design a statistical study about one aspect of your school mates.
Step1: Think about the next points.
The goal in a statistical study is.... A statistical variable is.... Average, mean and median is... The difference between absolute frequency and relative frequency
is...
Step2: Did you know that...
When you buy a product sometimes, you are given a questionnaire with a little gift if you answer the questions.
People that conduct surveys stop you on the streets or call you at home and ask you some questions.
These examples are ways to obtain information for statistical purposes.
Why do you think that enterprises take these statistical date into account?
Step3: Think and discuss.
First of all, the most important is to decide what do you want to investigate and to define very clearly your research goals. In your team, discuss these questions and complete the table.
About what item would you like to do a research? What would be the question of your research? What is the sort of population you will target at? (age, social status....)
Survey Title:
Research Question
Population
Step 4: Planning.
It will be very difficult to interview all the students in your school or even in your class. That is why you have to work with a sample. You have now to decide what will be your target group or group of study and the sample has to be big enough.
How many students will answer your question? How will you choose the target group? How will you choose the sample?
7

Step 5. Designing the Survey.
The most important when you design the Survey is to decide what sort of question will you ask and how will you do it. You must think the questions you will ask and, if it is possible, you can provide a range of answers, that could be numerical or qualitative answers.
Make a list of the most appropriate questions to achieve the data you want.
How will you gather the answers?
To decide how will you obtain the data, think about the following questions:
How will you get the answers? (telephone, mail, on the street, at what moment of the day...)
Where? When?
Survey Title:
Target group
How? When? Where?
Question 1 and possible answersQuestion 2 and possible answersQuestion 3 and possible answers...
Hint: Nowadays there are a lot of survey tools that guarantee the anonymity of the participants. You can use those easy tools to collect the answers to your questions. Website like www.surveymonkey.com or Google Drive are an example of this.
Step 6. Carry out the Survey.
Once you have organize how will you carry out the survey, you have to get the information from your target group. Gather the results taking notes about any incident that may alter your plan,
Step 7. Representing data.
Now that you have collected the data you have to organize the information. Do the following work for each variable:
A table of frequencies (absolute and relative)
8

Obtain the mode. If the variable is numerical calculate:
Its range. Its mean. Its median.
Hint: A spreadsheet will facilitate you all sorts of operations when you use large amounts of date
Step 8. The Most Appropriate graph.
Now you have to decide what will be the most appropriate graph for each variables in your study. Use different kinds of graphs, design an ideogram and be creative!
What kind of information would you like to highlight?
What kind of variable are you working with?
Are the variables numerical or qualitative?
If you want to show an evolution is better to use a lineal graph because...
If you want to compare different aspects is better to use an histogram because...
Is it necessary to distinguish between boys and girls?
ConclusionFor the statistical variable______________________________ it’s better to use a bar/sector/lineal _______________________ graph because____________________________.
Once you have made the decisions, each student of the team will be assigned a question and will make a graph with the data obtained.
Hint: There are many tools that can be used to create graphs easily and quickly. One example is Google Drive that again is a very useful tool.
Step 9. Drawing conclusions.
Once the graphs are made, you must interpret the information in them. Compare the results in order to see if the parameters have an influence on the results of the survey.
9

Make hypotheses based on the information you have. The next sentences can help you to write your conclusions:
As you can see in this graph,________ % of the students in ESO year__________ think/ like/ prefer/ use_____________.
On the one hand, ________% of the boys/girls in ESO year__________ think/ like/prefer/use______________.
On the other hand, ____________% of the girls of ESO year__________think/like/ prefer/ use____________.
Whereas..... To draw conclusions, we can say that most/ half/ a quarter of the
students_________________and only __________% of them______________. To sum up________________.
Step 10. Report the Results of the Survey.
Design a Presentation to show your class the results of your research. Each member of the team have to participate by presenting the variable she/ he has studied commenting the data and the graphs.
You can follow the next points to do a good presentation:
Design a nice Opening Slide (title, members, class, date) Table of Contents. Introduction (explain the topic, research question, your motivations...) The Survey (target group, sample, questions, variables, how, when,
where...) Report the results (numerical data of each question, graphs and
comments) Conclusions ( of the research, the process, the experience, the
comparations...) Sources of information and tools you have used.
Interactive activity:
To improve your vocabulary when you need to speak about description of variables behaviour try to do the following activity:https://en.educaplay.com/en/learningresources/1859139/pro___a2m5__graphs_in_meetings.htm
Assesment
Your research team is going to be assessed by other teams and your teacher that will listen to your presentation and will ask you questions. Your team will also ask questions to the other research teams when they will
10

present their research. The questions your team will ask are going to be assessed by the teacher.
Here are some questions you can ask:
About the appropriateness/ relevance/use of the graphs presentation. About possible manipulation/misunderstanding of the data. About the variables. About what you have found interesting in the research they have
presented. About the difficulties the team had faced. The advantages/difficulties of working in team.
In order to do a good assessment of your classmates teams you can use the next table:
Oral Presentation Assessment GridTitle:Team:a. Good introduction of the topic, goals, research question and population target.
1 2 3 4 5
b. Parameters of the survey ( sample, questions, variables) are relevant and important to answer the research question.
1 2 3 4 5
c. Decisions on when, where, and how the survey was conducted.
1 2 3 4 5
d. The graphs show the results clearly and are appropriate.
1 2 3 4 5
e. The student explanations are clear and points out the important facts.
1 2 3 4 5
f. The results of the survey are clearly shown. 1 2 3 4 5
g. General Conclusions are well exposed. 1 2 3 4 5
h. The team commented the process, the experience and problems.
1 2 3 4 5
i. The sources used are mentioned. 1 2 3 4 5
j. The English used is correct. 1 2 3 4 5
Observations: Total score____/10FINAL GRADE:
11