analyzing forces on amusement park rides with mobile devices
TRANSCRIPT

Analyzing Forces on Amusement Park Rides with Mobile DevicesRebecca E. Vieyra and Chrystian Vieyra
Citation: The Physics Teacher 52, 149 (2014); doi: 10.1119/1.4865516 View online: http://dx.doi.org/10.1119/1.4865516 View Table of Contents: http://scitation.aip.org/content/aapt/journal/tpt/52/3?ver=pdfcov Published by the American Association of Physics Teachers Articles you may be interested in Analyzing collision processes with the smartphone acceleration sensor Phys. Teach. 52, 118 (2014); 10.1119/1.4862122 Analyzing free fall with a smartphone acceleration sensor Phys. Teach. 50, 182 (2012); 10.1119/1.3685123 Innovative Interactive Lecture Demonstrations Using Wireless Force Sensors and Accelerometers forIntroductory Physics Courses Phys. Teach. 48, 567 (2010); 10.1119/1.3517018 Is It More Thrilling to Ride at the Front or the Back of a Roller Coaster? Phys. Teach. 45, 536 (2007); 10.1119/1.2809145 Normal Forces Phys. Teach. 41, 514 (2003); 10.1119/1.1631618
This article is copyrighted as indicated in the article. Reuse of AAPT content is subject to the terms at: http://scitation.aip.org/termsconditions. Downloaded to IP:
128.123.35.41 On: Fri, 05 Sep 2014 16:16:02
DOI: 10.1119/1.4865516 The Physics Teacher ◆ Vol. 52, March 2014 149
Analyzing Forces on Amusement Park Rides with Mobile DevicesRebecca E. Vieyra, Cary-Grove High School, Cary, ILChrystian Vieyra, Vieyra Software, Crystal Lake, IL
Mobile device accelerometers are a simple and easy way for students to collect accurate and detailed data on an amusement park ride. The resulting
data can be graphed to assist in the creation of force diagrams to help students explain their physical sensations while on the ride. This type of activity can help students overcome some of the conceptual difficulties often associated with understand-ing centripetal force and typical “elevator-type problems” that are inherent in so many amusement park rides that move, lift, and drop riders. This article provides some sample data and examples from a visit to Six Flags Great America.
Recent contributions to The Physics Teacher have been replete with discussions concerning the use of cellphones,1-3 tablets,4,5 and even gaming controllers6-8 to directly measure acceleration and time, but relatively few articles have ad-dressed their usefulness in measuring g-forces as a way for students to create quantitative force diagrams.
The physics teachers of Cary-Grove High School annually take high school physics students to an amusement park for a project to analyze the physics of thrill rides. Students in the lead author’s classes are asked to analyze linear acceleration and force, circular motion, and energy transformations as part of a comprehensive end-of-year project—the project de-scription and associated rubric may be accessed online.9 For many years at the school, this project entailed mostly qualita-tive experiences and a few quantitative analyses with equip-ment—standard timers, paper inclinometers, and spring ac-celerometers—that often resulted in inadequate or inaccurate data that could not be verified by a teacher as being legitimate. Further, students were limited by a lack of access to more pro-fessional and costly data collection sensors and vests.
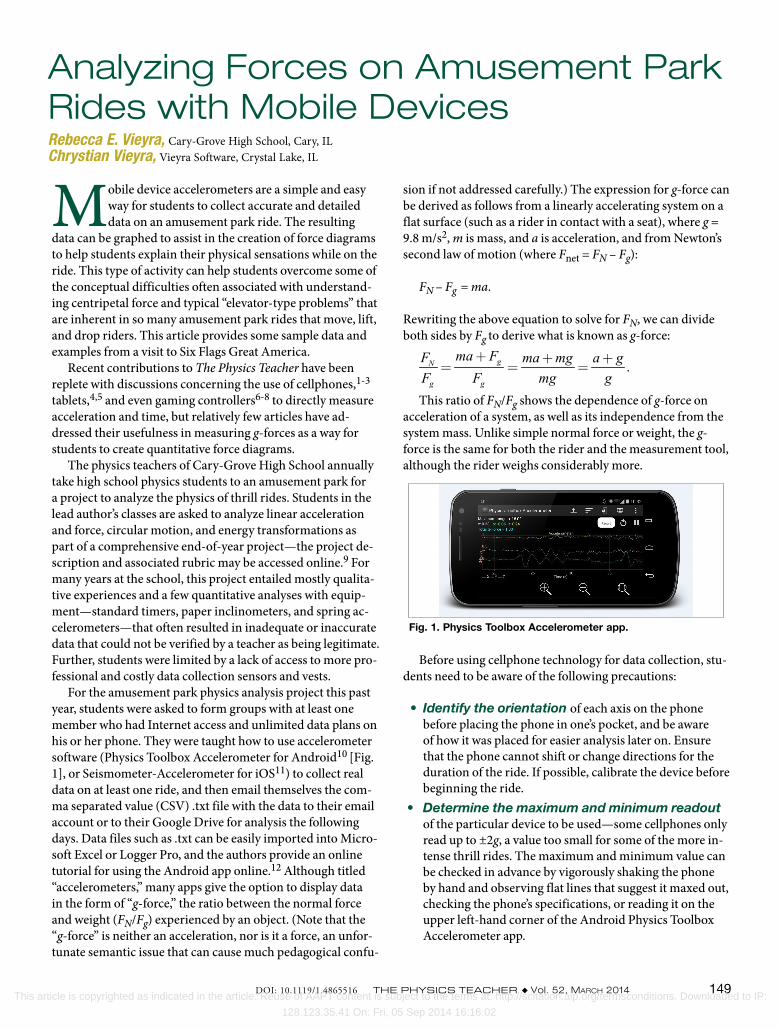
For the amusement park physics analysis project this past year, students were asked to form groups with at least one member who had Internet access and unlimited data plans on his or her phone. They were taught how to use accelerometer software (Physics Toolbox Accelerometer for Android10 [Fig. 1], or Seismometer-Accelerometer for iOS11) to collect real data on at least one ride, and then email themselves the com-ma separated value (CSV) .txt file with the data to their email account or to their Google Drive for analysis the following days. Data files such as .txt can be easily imported into Micro-soft Excel or Logger Pro, and the authors provide an online tutorial for using the Android app online.12 Although titled “accelerometers,” many apps give the option to display data in the form of “g-force,” the ratio between the normal force and weight (FN/Fg) experienced by an object. (Note that the “g-force” is neither an acceleration, nor is it a force, an unfor-tunate semantic issue that can cause much pedagogical confu-
sion if not addressed carefully.) The expression for g-force can be derived as follows from a linearly accelerating system on a flat surface (such as a rider in contact with a seat), where g = 9.8 m/s2, m is mass, and a is acceleration, and from Newton’s second law of motion (where Fnet = FN – Fg):
FN – Fg = ma.
Rewriting the above equation to solve for FN, we can divide both sides by Fg to derive what is known as g-force:
This ratio of FN/Fg shows the dependence of g-force on acceleration of a system, as well as its independence from the system mass. Unlike simple normal force or weight, the g-force is the same for both the rider and the measurement tool, although the rider weighs considerably more.
Before using cellphone technology for data collection, stu-dents need to be aware of the following precautions:
• Identify the orientation of each axis on the phone before placing the phone in one’s pocket, and be aware of how it was placed for easier analysis later on. Ensure that the phone cannot shift or change directions for the duration of the ride. If possible, calibrate the device before beginning the ride.
• Determine the maximum and minimum readout of the particular device to be used—some cellphones only read up to ±2g, a value too small for some of the more in-tense thrill rides. The maximum and minimum value can be checked in advance by vigorously shaking the phone by hand and observing flat lines that suggest it maxed out, checking the phone’s specifications, or reading it on the upper left-hand corner of the Android Physics Toolbox Accelerometer app.
Fig. 1. Physics Toolbox Accelerometer app.
This article is copyrighted as indicated in the article. Reuse of AAPT content is subject to the terms at: http://scitation.aip.org/termsconditions. Downloaded to IP:
128.123.35.41 On: Fri, 05 Sep 2014 16:16:02

150 The Physics Teacher ◆ Vol. 52, March 2014
data likely demonstrate the “lurching” forward and backward felt while the rider went up and down, while the nearly con-stant, negative x-axis value demonstrates a fairly consistent, inward-directed centripetal force. All dimensions of a rider’s accelerations can be estimated at any moment using this data,
• Determine the maximum and minimum refresh rates of the device to be used. This value can differ wide-ly between even similar model phones. If possible, within the app, choose the maximum refresh rate to collect as much data as possible to improve precision and accuracy.
• Ensure the safety of all riders by securing the phone while riding. Turn on the app and press record before get-ting on the ride, and only remove the cellphone after the ride has completely ended. Consider placing the phone in a tight-fitting buttoned or interior pocket.
Because this was an end-of-year project, students were already familiar with drawing force diagrams and Newton’s laws. From the resulting data, students were expected to (1) relate at least three different points on the graph to physi-cal points on the ride, (2) draw proportionally accurate and quantitative force diagrams, and (3) use Newton’s laws of mo-tion to explain and justify their physical sensations at those points on the ride.
The analysis of uniform circular motion, such as on the Columbia Carousel (Fig. 2), can be quite simple. Rides that display non-uniform motion, such as standard “teacup” rides, or changes in angle, such as suspended swing rides, can be much more complex. Students will need to make rough esti-mates of a rider’s angles at important points in order to draw accurate force diagrams. Students should also be reminded that, from the cellphone’s perspective, the three dimensions along which it is making measurements remain in the same frame of reference of the rider.
Although the rider might not always note the orientation of the recording device, so long as the phone is suspended directly along one of the primary planes (x, y, or z), it can be easily inferred which axis points “up”—this direction will read around a value of 1 while at rest or at zero acceleration, whereas the other two values should read near 0. (Occasion-ally, a rider will find that the phone pointed “down” and will get a reading of -1, in which case the data must be inverted upon analysis). The Columbia Carousel data (Fig. 3) dem-onstrates a change in y-axis g-force values resulting from the up-and-down motion of the horse. The highly variable z-axis
Fig. 2. Columbia Carousel. Fig. 3. Columbia Carousel data.
Fig. 4. Giant Drop.
Fig. 5. Giant Drop (vertical free-fall ride) data.
This article is copyrighted as indicated in the article. Reuse of AAPT content is subject to the terms at: http://scitation.aip.org/termsconditions. Downloaded to IP:
128.123.35.41 On: Fri, 05 Sep 2014 16:16:02

The Physics Teacher ◆ Vol. 52, March 2014 151
given a student’s mass, and centrip-etal force can be checked against calculations from manual measure-ment of the ride’s radius and period.
Likewise, rides involving linear motion can easily be analyzed. In the case of the Giant Drop (Fig. 4) at Six Flags Great America, the relevant measurements are only in the verti-cal direction—the ride entails a slow lift to the top of a tall tower, followed by free fall and then a quick break-ing until it is complete. In essence, this reflects a standard “elevator problem.” Not only can the accelera-tion due to gravity be measured with a readout of linear acceleration,13 but students can use these data to evaluate force diagrams. Figure 5 demonstrates only the downward
motion of the ride in the y-axis dimension. Although these data were collected on a device with a rather slow refresh rate, reasonable estimates can be made with respect to the normal forces experienced by the rider at various points (Fig. 6). Stu-dents might naturally pick three points along the ride such as A (riders at rest at the top of the ride), B (riders in free fall in the middle of the ride), and C (riders coming to a stop near the bottom of the ride). Using g-forces simplifies the quanti-fying of forces, so long as students know their given mass or weight. Assuming a student has a weight of 500 N, point A, with a g-force of 1, would have a resulting normal force from the seat of the same amount. Point B, however, has a g-force averaging around 0, meaning that the normal force is nonex-istent because the student is in free fall. Point C, with a g-force of about 3.2, results in a normal force on the student of about 500 N33.2, or about 1600 N.
Requiring students to draw and quantify force diagrams helps students to overcome the very common misconception that they feel light because their weight has decreased, as sug-gested by the word “weightless.” Rather, students are forced to demonstrate visually that, while their weight truly does stay the same, their sensations are a result of changing normal forces on their body.
References1. P. Vogt and J. Kuhn, “Analyzing free fall with a smartphone ac-
celeration sensor,” Phys. Teach. 50, 182–183 (March 2012).2. P. Vogt and J. Kuhn, “Analyzing simple pendulum phenom-
ena with a smartphone acceleration sensor,” Phys. Teach. 50, 439–440 (Oct. 2012).
3. J. Kuhn and P. Vogt, “Analyzing spring pendulum phenomena with a smartphone acceleration sensor,” Phys. Teach. 50, 504 (Nov. 2012).
4. J. Streepey, “Using iPads to illustrate the impulse-momentum relationship,” Phys. Teach. 51, 54 (Jan. 2013).
5. T. Jadji, “IPad & weightlessness,” Phys. Teach. 50, 307 (May 2012).
6. M. Erickson, R. Ochoa, and C. Ochoa, “The Wiimote on the playground,” Phys. Teach. 51, 272 (May 2013).
7. D. Mullenax, “Using the Wii Balance Board in elevator physics,” Phys. Teach. 51, 210 (April 2013).
8. M. Kouh, D. Holtz, A. Kawam, and M. Lamont, “Wiimote experi-ments: Circular motion,” Phys. Teach. 51, 146 (March 2013).
9. Six Flags Project Rubric, https://docs.google.com/file/d/0B4-sNY3DrSFHSUM5b1JJckZDN0k/edit?usp=sharing.
10. Physics Toolbox Accelerometer, https://play.google.com/store/search?q=vieyra+software&c=apps.
11. Seismograph and accelerometer with Export, from Apple Store, accessed from iTunes.
12. Physics Toolbox Apps, https://sites.google.com/site/physicstool-boxapps/accelerometer.
13. See Ref. 1.
Rebecca Vieyra is a physics teacher at Cary-Grove High School in Cary, IL 60013; [email protected]
Chrystian Vieyra is a software engineer with Vieyra Software, and has produced a number of free physics education apps to help his wife imple-ment mobile device technology with her students. He currently is working on developing a Physics Toolbox Suite for Android, which currently includes Physics Toolbox Accelerometer, Gyroscope, Magnetometer, and Light [email protected]
A B C
FN FN
Fg Fg Fg
Fig. 6. Qualitative force diagrams for points A, B, and C on Fig. 5.
Members $12.99 • Nonmembers $18.99order online: www.aapt.org/store or call: 301-209-3333
Concerned aboutthe safety of your students?
Promote safety awareness and encourage safe habits with this essential manual. Appropriate for elementary to advanced undergraduate labo-ratories.
BestSeller!
This article is copyrighted as indicated in the article. Reuse of AAPT content is subject to the terms at: http://scitation.aip.org/termsconditions. Downloaded to IP:
128.123.35.41 On: Fri, 05 Sep 2014 16:16:02