analyzing meteorological relationships to aerosols in...
TRANSCRIPT
ANALYZING
METEOROLOGICAL
RELATIONSHIPS TO
AEROSOLS IN CHINA
Carl Svenhag Bachelor’s Thesis
Supervisors:
Kristian Pagh Nielsen & Elna Heimdal Nilsson
Danish Meteorological institute Lund University, Department of Physics
May 2017

ii
iii
Abstract
Meteorological conditions are influenced everyday by air-bound aerosols and pollution in the
atmosphere, and understanding these processes from micro to synoptic scale, is essential for forecasting
and creating high resolution weather models. In this study, three different experimental weather models
are analysed to provide some understanding on how various meteorological parameters are influenced
by modelling atmospheric aerosols. Conclusions surrounding relations between the individual
parameters are drawn from the results and discussed with respect to previous studies and knowledge on
meteorology and atmospheric chemistry.
This analytic observation was made from data covering the Chinese Yangtze River Delta region over
the months January and July 2010. This region holds the metropolitan city of Shanghai and experiences
a relative subtropical monsoon climate.
Examining how the direct and indirect climate effects influence weather parameters through the
three simulated experimental models, attempting to draw conclusions connecting aerosol characteristics
to the dynamics of the atmosphere. The primarily investigated parameters include surface temperature,
cloud cover, precipitation in the form of rain, long and shortwave radiation measured near surface and
at top of atmosphere. Differences in solid precipitation between the experiments are very small and will
not be covered in this analytic study.
Highlighting the relation between certain simulated parameters with respect to urban aerosols for
additional observation concerning the climate effects.
Furthermore, a modest investigation of a special case day scenario is analyzed to observe how short-
term forecasting could be influenced by simulated aerosol modelling in hourly depict data.
iv
Acknowledgements
This research was performed under the supervision of Kristian Pagh Nielsen at Danske
Meteorologiske Institut (DMI) who provided great help during my project. I am grateful for all the
background material and articles he presented me during my bachelor project and additionally helping
me understand the operating system of Linux and the Gnuplot software. I am certain these provided
skills will come to help me in my future studies and I am grateful for the opportunity to access research
material and supervision at DMI.
I would also like to thank Elna Heimdal Nilsson at Lund University for her support and guidance
during my bachelor work and throughout my three years at Lund University.
This thesis is an individual extension of the Marco Polo (2014-2017) project at DMI, which is
“Monitoring and Assessment of Regional air quality in China using space Observations, Project Of
Long-term sino-european co-Operation”. This implies that papers on similar outcome and research could
be found in future publications.
v
Contents
Abstract iii
Acknowledgements iv
Acronyms vi
1. Introduction ................................................................................................................. 1
2. Background .................................................................................................................. 2
2.1 Aerosols Atmospheric Effects .................................................................................. 2
2.2 Aerosol Modelling studies ........................................................................................ 3
3. Methodology ............................................................................................................... 5
3.1 Model Features ........................................................................................................... 5
4. Results and Discussion ............................................................................................. 7
4.1 Cloud Cover and Radiation ................................................................................... 10
4.2 July 30th CC ................................................................................................................ 18
5. Summary and Outlook ............................................................................................ 22
References 24
Appendix 27
vi
Acronyms
DMI Danske Meteorologiske Institut
YRD Yangtze River Delta
HARMONIE HIRLAM-ALADIN Research for Mesoscale Operational
Numerical Weather Prediction in Euromed
HIRLAM High Resolution Limited Area Model
ALADIN Aire Limitee Adaptation dynamique Developpement International
IFS Integrated Forecast System
CC Cloud Cover
AOD Aerosol Optical Depth
CCN Cloud Condensation Nuclei
CDNC Cloud Droplet Number Concentration
NWP Numerical Weather Prediction
CAPE Convective Available Potential Enerergy
1
Introduction
The massive economic growth of China over last decades have led to a huge dependence on coal
burning and transportation by combustion of fossil fuel. These processes exhausts millions of particles
into the lower troposphere and these particles can be carried away distances extending over the Pacific
Ocean and ascending through the lower stratosphere. However, the Chinese megacities producing these
anthropogenic aerosols are the ones confronting the most hazardous concentrations of particulate matter
(PM), with air quality levels considered to be severely unhealthy in some urban areas. This abundant
increase of larger aerosols into the atmosphere is bound to have some climate effect as well,
ramifications that could perturbate the atmospheric balance forcing further cooling or warming to the
environment depending on characteristics of the emitted pollution.
The atmosphere is experiencing both direct and indirect climate effects associated with
characteristics of the air-bound aerosols. By simulating experimental models which implement the two
climate effects, generating distinctive result for various weather parameters, one could partially describe
the relationship between aerosol particles and atmospheric mechanisms. A Cooperation between
European meteorological institutes have created an operational non-hydrostatic weather model called
HARMONIE, able to perform weather-data simulations over eastern Asia, which was used as basis and
reference for our cases during this analytic study over the YRD region in China.
The incoming and outgoing short and longwave radiation gives some description of the aerosols
climate effect, and by studying cloud cover variations and precipitation one could portray how aerosols
possibly supplement large-scale droughts and other meteorological phenomena’s, which also could be
useful for related climate and weather forecasting studies. Aerosols relation to radiation from the Sun
and climate is described by the mentioned direct and indirect effect, and by analysing both winter and
summer seasonal data over a highly populated area in China, you can observe and analyse how important
changes in model urban aerosol dynamics could significantly change the accuracy of a forecast.
2
2. Background
2.1 Aerosols Atmospheric Effects
There are considerable amounts of physical processes occurring in the atmosphere, from small micro-
scale systems to large synoptic circulations. The certain correlation air-bound particles have with
radiation the climate is one of many altering factors, and understanding their mechanisms can help
interpret the dynamics of the atmosphere.
As the shortwave solar radiation enters our atmosphere it immediately begins to interact with the
present aerosols, scattering and absorbing the radiation. When the particle absorbs radiation, it must
release energy by applying heat to its surrounding environment. As this could lead to a local temperature
increase, by containing high concentrations of absorbing aerosols, the region is then experiencing a
warming direct climate effect and possible radiative forcing. High concentrations of soot and Black
Carbon are shown to have this positive radiative forcing effect (Boucher 2006). A case of direct cooling
effects e.g. occurs when the highly concentrated aerosols have efficient scattering characteristic of
shortwave solar radiation. This prevents energy (heat) to reach lower altitudes implying negative
radiative forcing and resulting in cooling of its surrounding atmosphere. Additional information
concerning radiative forcing given in Ahrens (2008).
To characterize which of these processes the aerosol will undergo for a certain wavelength, the
aerosol optical depth (AOD) gives a description of the radiation-aerosol interaction. A detailed
explanation of AOD is given in Thomas and Stamnes (1999).
Clouds are also known to include absorbing and reflecting capability on solar radiation, with a
varying single scattering albedo depending on cloud type. Twomey (1959) gives a description of how
aerosols influence the formation of clouds, illustrating how the indirect climate effect occurs when
aerosols act as cloud condensation nuclei to form additional cloud droplets, thereby increasing the
overall cloud cover. Furthermore, Twomey (1977) explains how certain anthropogenic aerosols produce
clouds which scatter solar radiation more efficiently than regular ones, also how this could generate
smaller cloud droplets which prevents formation of precipitation. This is due to gravity not overcoming
the buoyancy of the smaller cloud droplet and thereby forcing it to remain aloft. This could be insightful
when observing the experimental models simulated rainfall in our analysis with and without Twomey’s
indirect effect included.
The cloud-lifetime effect, or Albrecht effect, also adds that possible anthropogenic aerosols, acting
as cloud condensation nuclei (CCN), generating clouds with longer lifetime which may decrease the
total amount of shortwave radiation reaching the surface during overcast, and so resulting in cooling of
the lower troposphere (Albrecht 1989).
3
Absorption by aerosols in the atmosphere may also cause clouds to influence the vertical
temperature profile, determining the atmospheric stability, described as the semi-direct effect. For
example, producing surface cooling and atmospheric heating creates a vertically stable atmosphere, this
environmental condition produces no convective available potential energy (CAPE) and prohibits
convective formation of clouds, this could bring about a dryer environment with calmer weather. Further
explanation of this phenomenon is made by Fan et al. (2008).
2.2 Aerosol Modelling Studies
Inquiry to improve the accuracy of weather forecasts has been developing since Carl-Gustav Rossby
and a group of meteorologists in Stockholm assembled the first operational weather model in 1954.
However, even if the numerical weather predictions (NWP) we use today are digitized and significantly
more advanced, we still lack the modelling proficiency to produce flawless forecasts of weather and
climate over a longer period.
Additional research on how anthropogenic and naturally occurring aerosols influence weather
models could improve their accuracy for the future. Toll et al. 2015 studied how the HARMONIE model
perceives solar radiation due to this aerosol effect. Their study includes how aerosols in forest-fire
smoke over Russia reduced the amount of shortwave radiation reaching the surface. The increased
thickness of aerosols in the study shares some insight to the analysed YRD area which has an atmosphere
with average AOD 5 times the global average (Stier et al. 2005). These areas should be expected to
experience greater consequences from the aerosol effects.
Radiative Forcing from the influence of aerosols in East-Asian climate has been investigated by
Zhang et al. (2011). The research showed that the average temperature decreased with more than 0.5
degrees Celsius due to carbon and sulphate aerosols, and resulting in a decreased amount of precipitation
falling over eastern Asia by 0.14 mm per day during summer months. Connecting with results from
Bollasina et al. (2011) which concluded that the summer monsoon is weakening due to anthropogenic
aerosols gives some background on the YRD region conditions to include in this analysis.
The mentioned aerosol-influenced semi-direct effect has been studied by Wang et al. (2012) over
south-eastern China, with research covering a weekly cycle to observe a maximum and minimum
occurrence of sulphate (SO₂) due to urban activity in relation to this climate effect. Their case showed
small anomalies in cloud cover and humidity over the studied timeframe, but the study puts emphasis
on necessary further investigation on the semi-direct effect from urban pollution and aerosols
Studies on the Chinese YRD domain, positioned on latitudes and altitudes 28.5–33.5◦ N and 117.5–
123.5◦ E, show significantly high Black Carbon and sulphate emissions (Streets et al., 2001; Lu et al.,
4
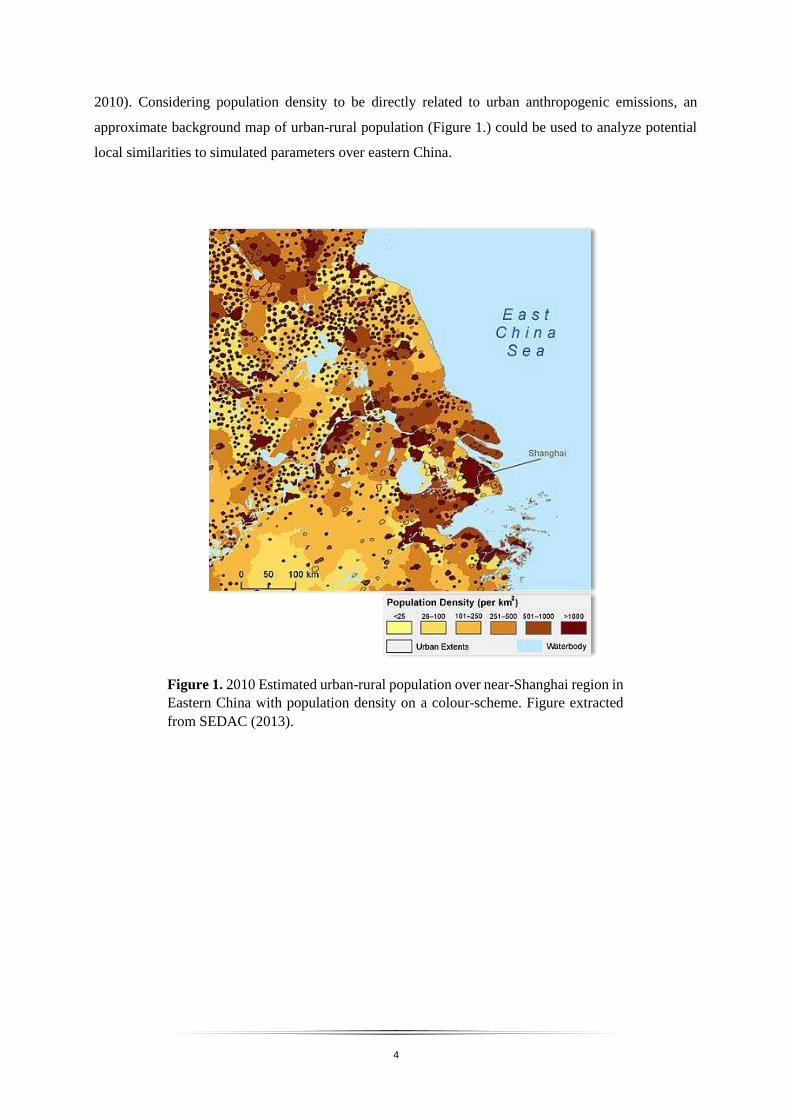
2010). Considering population density to be directly related to urban anthropogenic emissions, an
approximate background map of urban-rural population (Figure 1.) could be used to analyze potential
local similarities to simulated parameters over eastern China.
Figure 1. 2010 Estimated urban-rural population over near-Shanghai region in
Eastern China with population density on a colour-scheme. Figure extracted
from SEDAC (2013).

5
3. Methodology
During this analysis, the main tool for observing the YRD data over January and July 2010 is applied
with the Gnuplot software through the Linux command terminal, primarily to plot figures and tables.
The acquired data sets mainly consist of 15-minute time steps accumulated into six hour fixtures for
each parameter on three simulated model experiment, stretching from UTC time-steps 00+6, 06+6, 12+6
and 18+6 hours, accounted that the YRD time zone is UTC/GMT+8h. These parameters are plotted on
a two-dimensional colormap over the YRD region with a spatial resolution of 1⁰ in the datasets,
designating each parameter with a certain colour-scheme to provide a satisfying observation. The
produced script to plot this map is then attached with a data-scheme to produce an x and y axis realigned
with latitudes and longitudes relative to Earth (see appendix). Hourly accumulated data is obtained as
well to study specific cases.
Datasets of averaged land area mean results, also with 6-hour frequency, is additionally provided
for plotting diagrams to observe and analyse relative differences between models and parameters.
3.1 Model Features
The acquired data sets were originally produced from the TERRA and AQUA satellites equipped
with the MODIES instrument, this tool could analyze the relationship between AOD, CC and water
vapor. Further studies on this is done by Kourtidis et al. (2015). The provided model experiments
originate from a HARMONIE weather model cycle described by Bengtsson et al. (2017), and this high-
resolution model is the one we use primarily at DMI.
The HARMONIE cycle is acting as a reference experimental model in this analytic study, this
implements radiation physics generated through the integrated forecast system (IFS) cycle by ECMWF
(2015). This includes a radiation scheme with cloud droplet number concentrations (CDNC) described
by Martin et al. (1994), which was assumed to be constant over the whole YRD region covering both
land and sea. The types of aerosols included in the IFS scheme covers land, sea, desert, urban, volcanic
(stratosphere) and stratospheric background aerosols. Regarding the IFS climatology, it was considered
that the model consists of AOD characteristics which has too low thickness compared to what is
realistically believed to be present in the YRD region.
That is why the second aerosol experimental model, labelled the Direct Aerosol case, is included in
the analysis to study the previous HARMONIE cycles with a reanalyzed AOD data set (MACC) from
Inness et al. (2013). They were converted into IFS aerosol categories of land, sea, urban and desert types.
This includes a more realistic AOD thickness and thereby implementing the direct climate effects on
our analyzed parameters, describing simulated long and shortwave radiation’s relation to AOD. The

6
MACC reanalysis also covers the mentioned semi-direct effect, possibly detecting the absorption within
and surrounding clouds.
To include the indirect effect in our analysis, data sets acquired from the third experimental model,
labelled the Total Aerosol case, is added. These simulated results are also run with the MACC aerosol
replacements but is substituting the default constant CDNC assumption with Menon et al. (2002)
parametrization to include the mentioned Twomey effect. This enables observation of the changes in
cloud cover (CC) and accumulated rainfall due to this effect in addition to the change in AOD data.
7
4. Results and Discussion
The progression of our analytic process is produced in this section with selected figures for
observation. Firstly, displaying the foregoing diagrams of the available parameters which directed the
focus of our study, followed with an investigation of those specific parameters. The chosen parameters
for evaluation were based on significant differences between the three experimental models, and motives
to establish connections to previous studies in Section 2. The main analysed parameters are cloud cover,
surface longwave (LW) and shortwave (SW) radiation, and these are illustrated in diagrams and maps
bound with a special day case (see Section 4.2).
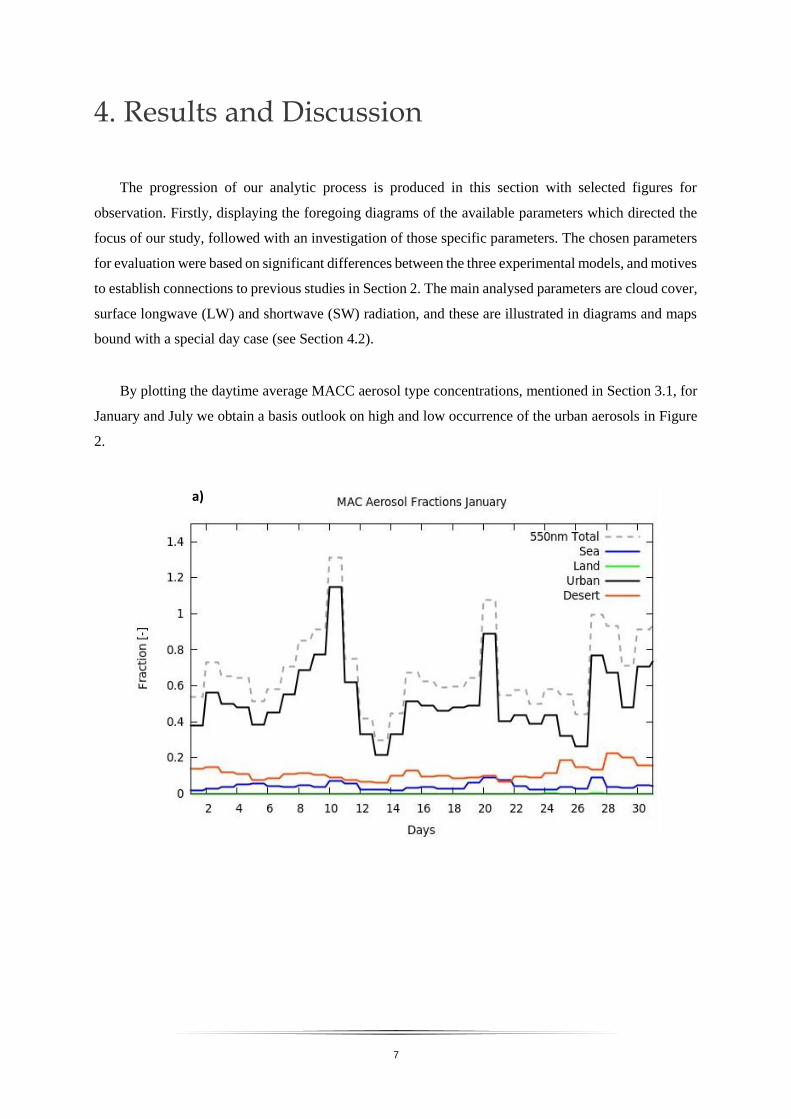
By plotting the daytime average MACC aerosol type concentrations, mentioned in Section 3.1, for
January and July we obtain a basis outlook on high and low occurrence of the urban aerosols in Figure
2.
a)

8
Then additionally, the reference model land area mean data for investigated parameters is
plotted to get an overview of the overall meteorological conditions during the two months, this is
also used to analyse mentioned distinguishable relationships between parameters and Figure 2a-b.
Figure 2. Average daytime MACC AOD fractions and types from January (a) and July
(b) 2010 over the YRD domain. 550nm was the electromagnetic wavelength for the
used AOD in the provided data, see section 2.1.
b)
a) b)
9
c) d)
g) h)
f) e)
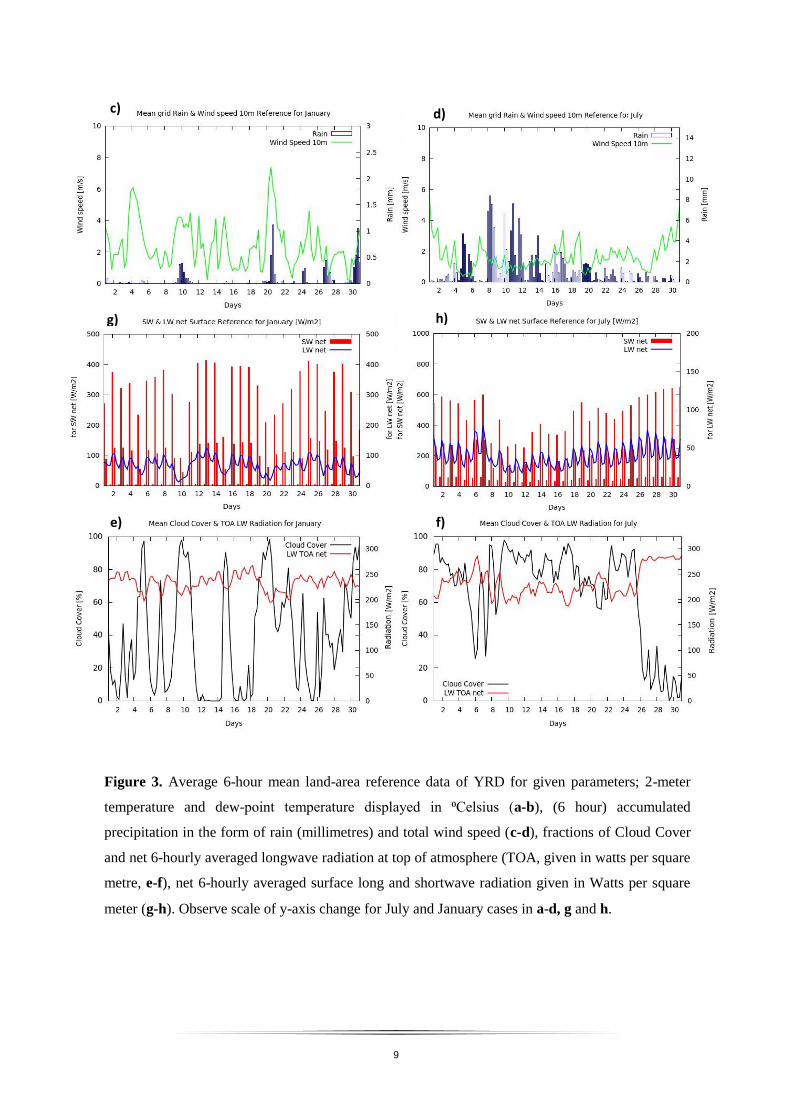
Figure 3. Average 6-hour mean land-area reference data of YRD for given parameters; 2-meter
temperature and dew-point temperature displayed in ⁰Celsius (a-b), (6 hour) accumulated
precipitation in the form of rain (millimetres) and total wind speed (c-d), fractions of Cloud Cover
and net 6-hourly averaged longwave radiation at top of atmosphere (TOA, given in watts per square
metre, e-f), net 6-hourly averaged surface long and shortwave radiation given in Watts per square
meter (g-h). Observe scale of y-axis change for July and January cases in a-d, g and h.
10
For Figure 3a-b an approximation formula from Holton and Hakim (2012) was used to convert mixing
ratio into dew-point temperature, approximating the 2-meter pressure over YRD to be 1013.14 hPa
(global mean surface pressure). This formula is not significantly accurate, but good enough to provide
an overview of the relative humidity. The net LW and SW radiation in Figure 3.e-h was converted from
Jules per 6-hours over the area into watts per square metre for simplification as well. The total mean
land area wind speed in Figure 3c-d is displayed as the vector sum of the mean west-east and south-
north wind.
The mentioned relationship between CC, net TOA LW, net SW and LW radiation was plotted in
Figure 3e-f to generally grasp in what magnitude the radiation changes through cloud cover fractions.
The most distinct period of increased net TOA LW radiation from less fraction of CC is seen in the end
of July, 26th to the 31st. The indirect climate effects from clouds are also roughly displayed by Figure
3a-b and 3g-h, where small elevations of surface temperature and net surface SW radiation is observed
during this studied period of reduced CC.
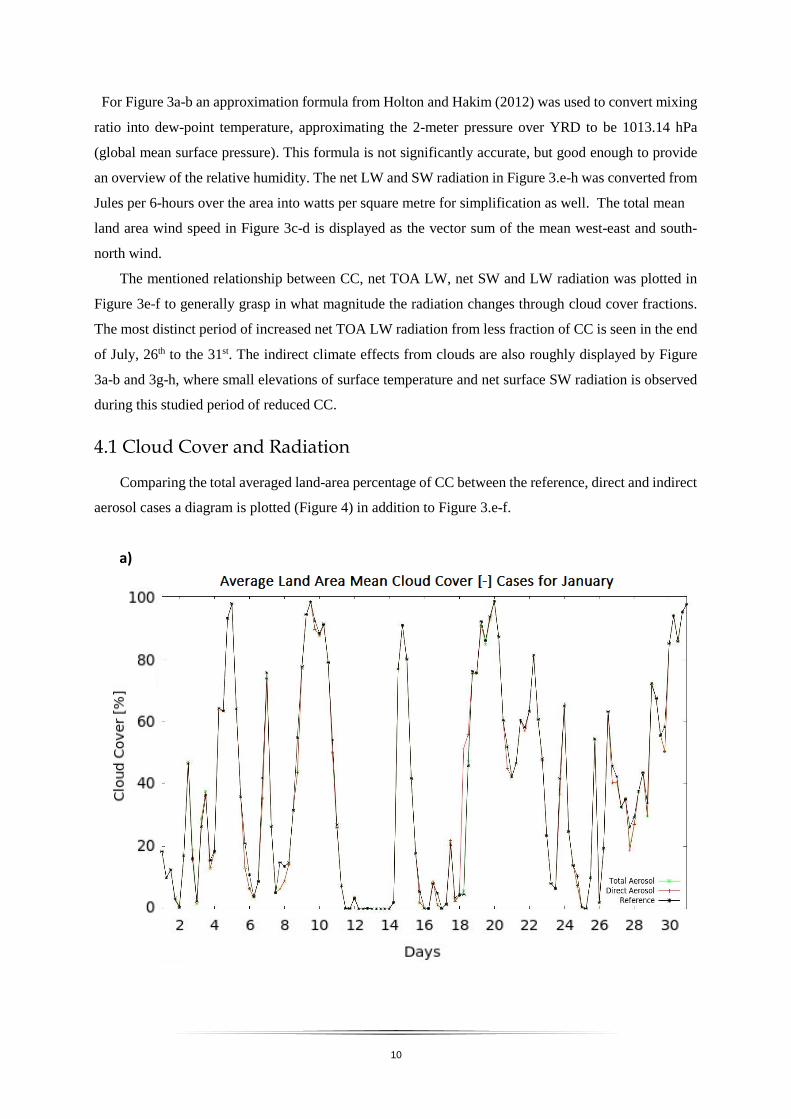
4.1 Cloud Cover and Radiation
Comparing the total averaged land-area percentage of CC between the reference, direct and indirect
aerosol cases a diagram is plotted (Figure 4) in addition to Figure 3.e-f.
a)
11
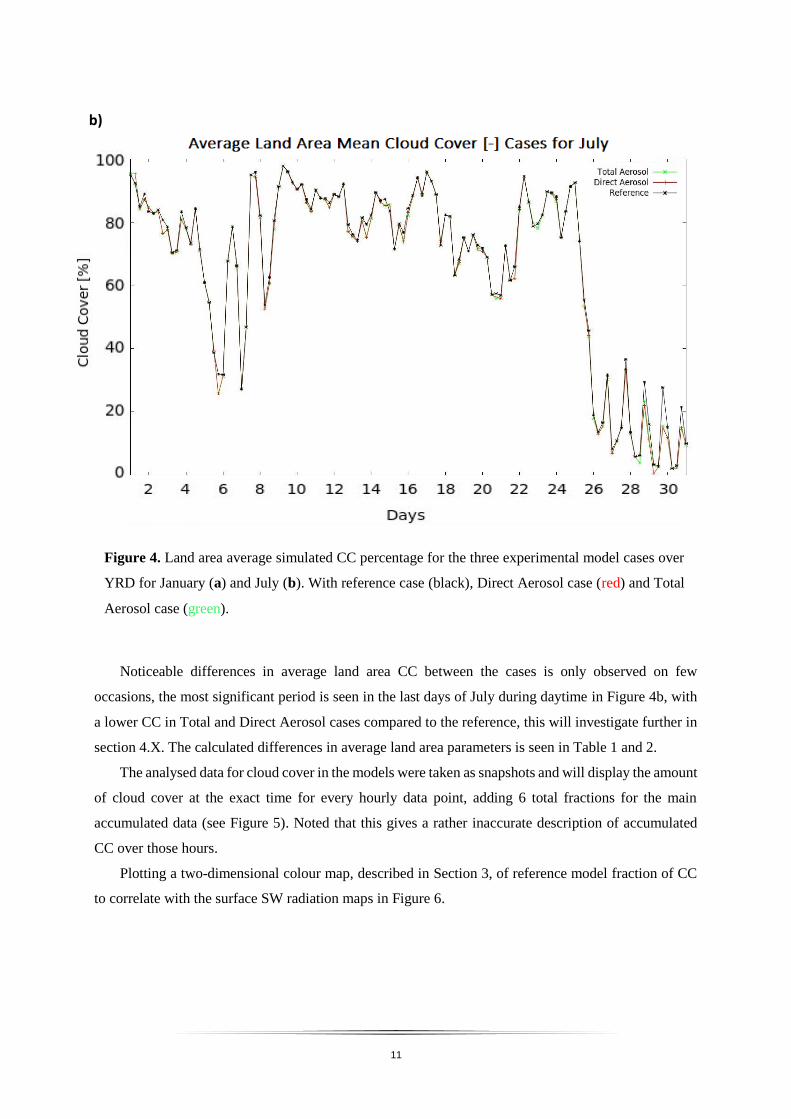
Noticeable differences in average land area CC between the cases is only observed on few
occasions, the most significant period is seen in the last days of July during daytime in Figure 4b, with
a lower CC in Total and Direct Aerosol cases compared to the reference, this will investigate further in
section 4.X. The calculated differences in average land area parameters is seen in Table 1 and 2.
The analysed data for cloud cover in the models were taken as snapshots and will display the amount
of cloud cover at the exact time for every hourly data point, adding 6 total fractions for the main
accumulated data (see Figure 5). Noted that this gives a rather inaccurate description of accumulated
CC over those hours.
Plotting a two-dimensional colour map, described in Section 3, of reference model fraction of CC
to correlate with the surface SW radiation maps in Figure 6.
Figure 4. Land area average simulated CC percentage for the three experimental model cases over
YRD for January (a) and July (b). With reference case (black), Direct Aerosol case (red) and Total
Aerosol case (green).
b)
12
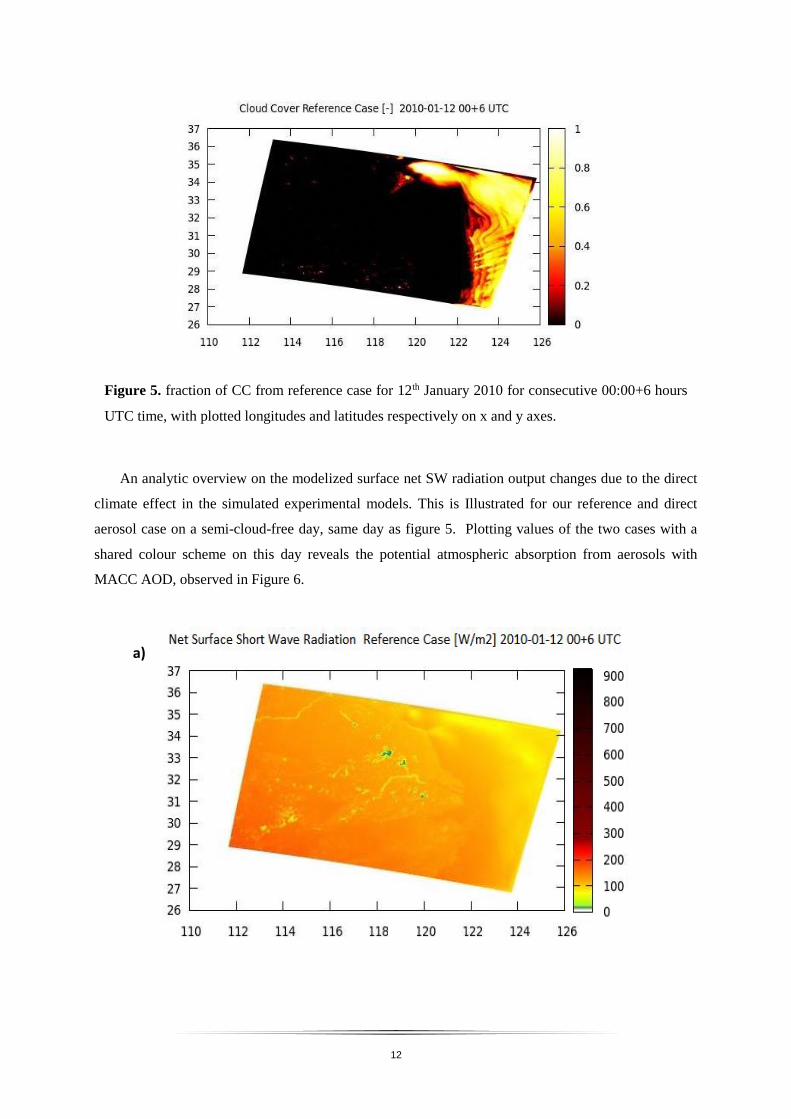
An analytic overview on the modelized surface net SW radiation output changes due to the direct
climate effect in the simulated experimental models. This is Illustrated for our reference and direct
aerosol case on a semi-cloud-free day, same day as figure 5. Plotting values of the two cases with a
shared colour scheme on this day reveals the potential atmospheric absorption from aerosols with
MACC AOD, observed in Figure 6.
Figure 5. fraction of CC from reference case for 12th January 2010 for consecutive 00:00+6 hours
UTC time, with plotted longitudes and latitudes respectively on x and y axes.
a)
13
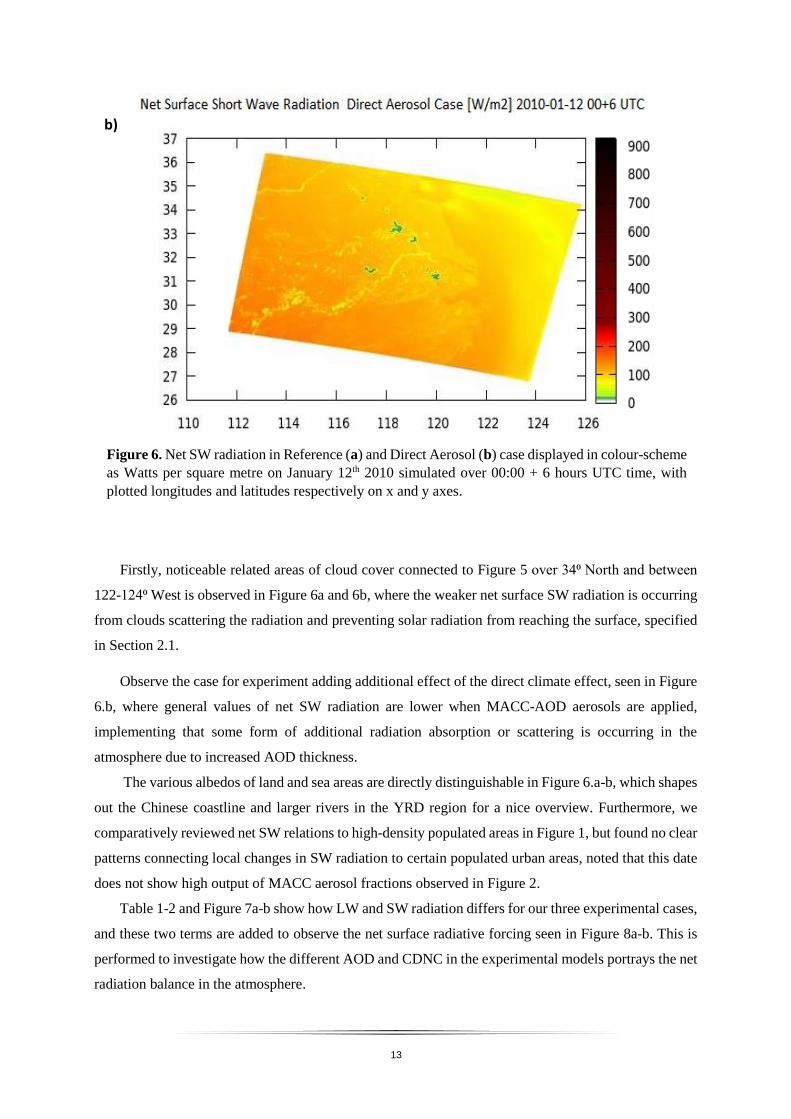
Firstly, noticeable related areas of cloud cover connected to Figure 5 over 34⁰ North and between
122-124⁰ West is observed in Figure 6a and 6b, where the weaker net surface SW radiation is occurring
from clouds scattering the radiation and preventing solar radiation from reaching the surface, specified
in Section 2.1.
Observe the case for experiment adding additional effect of the direct climate effect, seen in Figure
6.b, where general values of net SW radiation are lower when MACC-AOD aerosols are applied,
implementing that some form of additional radiation absorption or scattering is occurring in the
atmosphere due to increased AOD thickness.
The various albedos of land and sea areas are directly distinguishable in Figure 6.a-b, which shapes
out the Chinese coastline and larger rivers in the YRD region for a nice overview. Furthermore, we
comparatively reviewed net SW relations to high-density populated areas in Figure 1, but found no clear
patterns connecting local changes in SW radiation to certain populated urban areas, noted that this date
does not show high output of MACC aerosol fractions observed in Figure 2.
Table 1-2 and Figure 7a-b show how LW and SW radiation differs for our three experimental cases,
and these two terms are added to observe the net surface radiative forcing seen in Figure 8a-b. This is
performed to investigate how the different AOD and CDNC in the experimental models portrays the net
radiation balance in the atmosphere.
Figure 6. Net SW radiation in Reference (a) and Direct Aerosol (b) case displayed in colour-scheme
as Watts per square metre on January 12th 2010 simulated over 00:00 + 6 hours UTC time, with
plotted longitudes and latitudes respectively on x and y axes.
b)
14
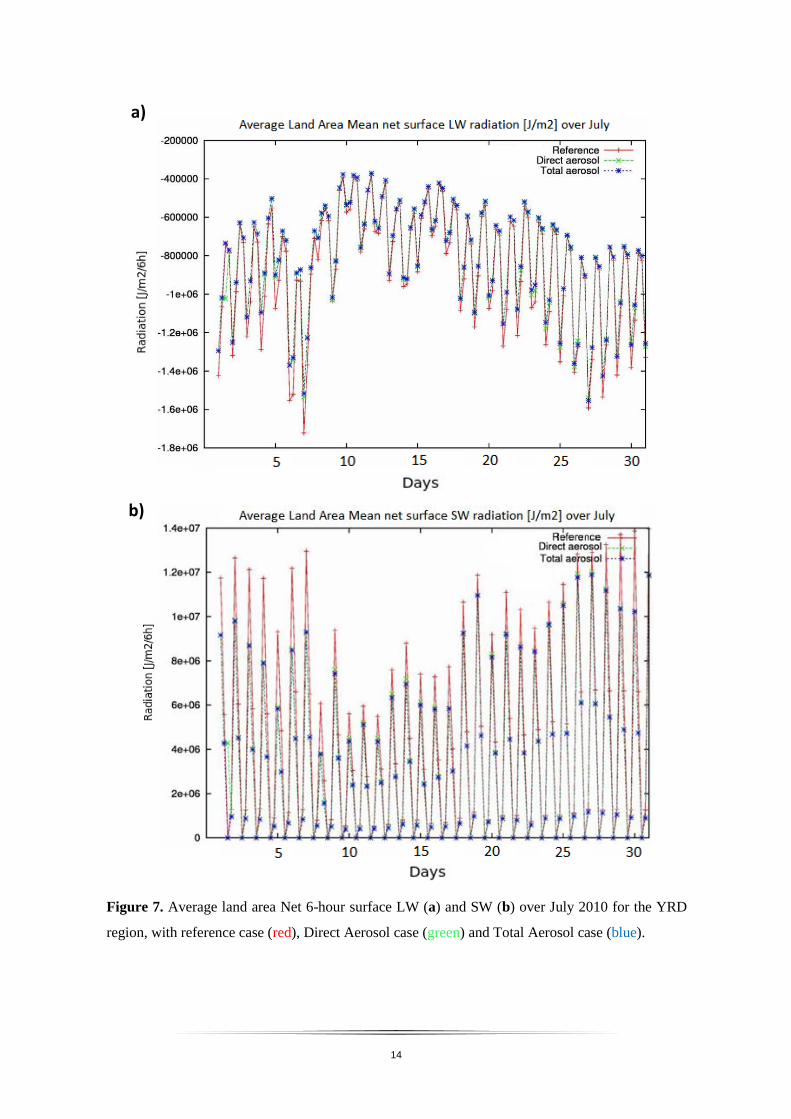
Figure 7. Average land area Net 6-hour surface LW (a) and SW (b) over July 2010 for the YRD
region, with reference case (red), Direct Aerosol case (green) and Total Aerosol case (blue).
a)
b)
15
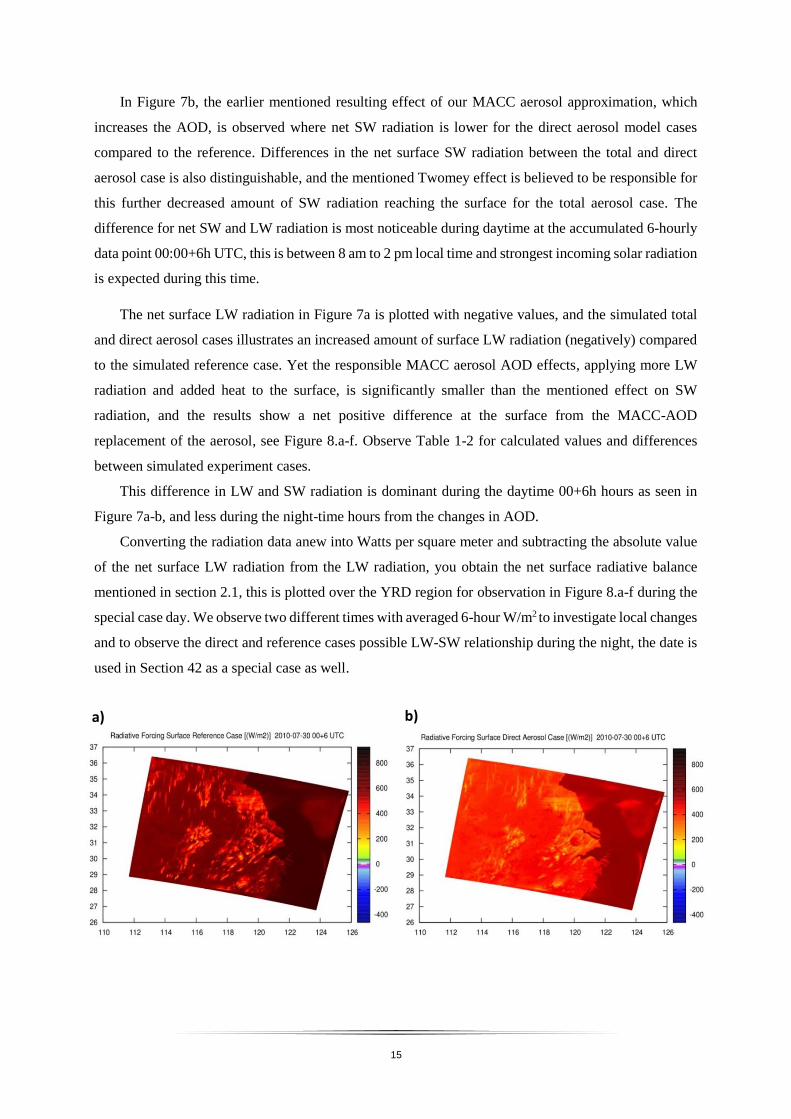
In Figure 7b, the earlier mentioned resulting effect of our MACC aerosol approximation, which
increases the AOD, is observed where net SW radiation is lower for the direct aerosol model cases
compared to the reference. Differences in the net surface SW radiation between the total and direct
aerosol case is also distinguishable, and the mentioned Twomey effect is believed to be responsible for
this further decreased amount of SW radiation reaching the surface for the total aerosol case. The
difference for net SW and LW radiation is most noticeable during daytime at the accumulated 6-hourly
data point 00:00+6h UTC, this is between 8 am to 2 pm local time and strongest incoming solar radiation
is expected during this time.
The net surface LW radiation in Figure 7a is plotted with negative values, and the simulated total
and direct aerosol cases illustrates an increased amount of surface LW radiation (negatively) compared
to the simulated reference case. Yet the responsible MACC aerosol AOD effects, applying more LW
radiation and added heat to the surface, is significantly smaller than the mentioned effect on SW
radiation, and the results show a net positive difference at the surface from the MACC-AOD
replacement of the aerosol, see Figure 8.a-f. Observe Table 1-2 for calculated values and differences
between simulated experiment cases.
This difference in LW and SW radiation is dominant during the daytime 00+6h hours as seen in
Figure 7a-b, and less during the night-time hours from the changes in AOD.
Converting the radiation data anew into Watts per square meter and subtracting the absolute value
of the net surface LW radiation from the LW radiation, you obtain the net surface radiative balance
mentioned in section 2.1, this is plotted over the YRD region for observation in Figure 8.a-f during the
special case day. We observe two different times with averaged 6-hour W/m2 to investigate local changes
and to observe the direct and reference cases possible LW-SW relationship during the night, the date is
used in Section 42 as a special case as well.
a) b)
16
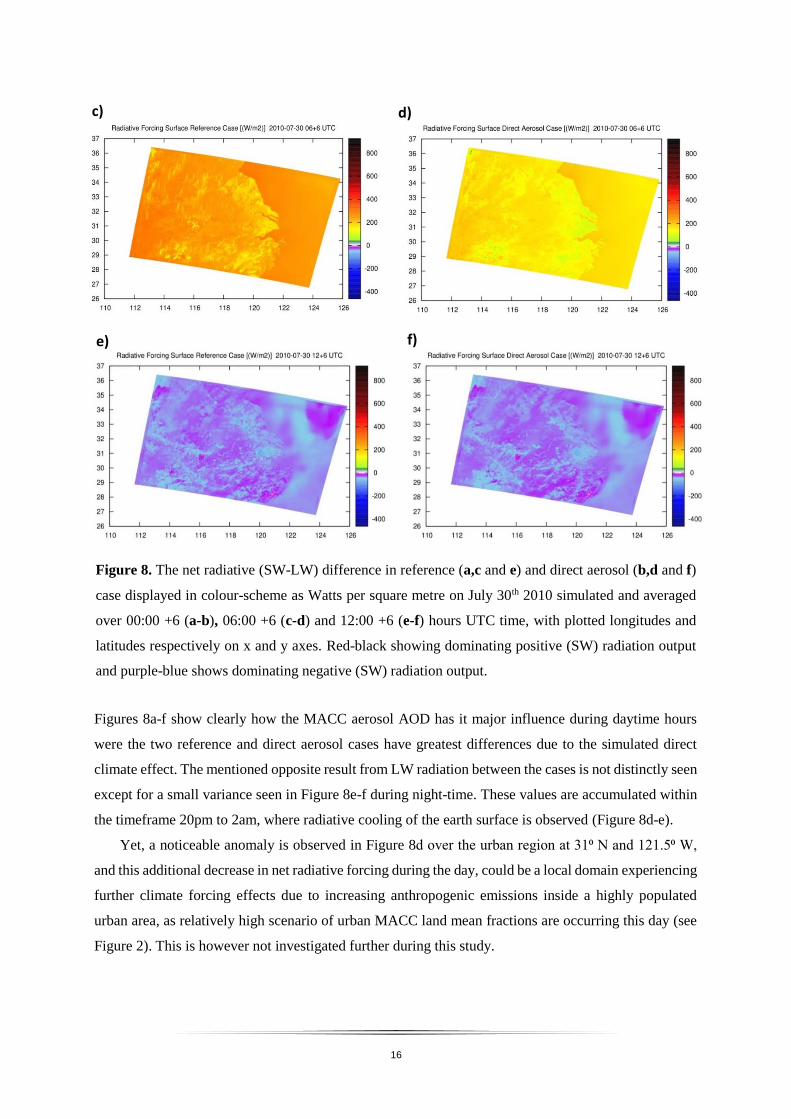
Figures 8a-f show clearly how the MACC aerosol AOD has it major influence during daytime hours
were the two reference and direct aerosol cases have greatest differences due to the simulated direct
climate effect. The mentioned opposite result from LW radiation between the cases is not distinctly seen
except for a small variance seen in Figure 8e-f during night-time. These values are accumulated within
the timeframe 20pm to 2am, where radiative cooling of the earth surface is observed (Figure 8d-e).
Yet, a noticeable anomaly is observed in Figure 8d over the urban region at 31⁰ N and 121.5⁰ W,
and this additional decrease in net radiative forcing during the day, could be a local domain experiencing
further climate forcing effects due to increasing anthropogenic emissions inside a highly populated
urban area, as relatively high scenario of urban MACC land mean fractions are occurring this day (see
Figure 2). This is however not investigated further during this study.
Figure 8. The net radiative (SW-LW) difference in reference (a,c and e) and direct aerosol (b,d and f)
case displayed in colour-scheme as Watts per square metre on July 30th 2010 simulated and averaged
over 00:00 +6 (a-b), 06:00 +6 (c-d) and 12:00 +6 (e-f) hours UTC time, with plotted longitudes and
latitudes respectively on x and y axes. Red-black showing dominating positive (SW) radiation output
and purple-blue shows dominating negative (SW) radiation output.
c)
e) f)
d)
17
January 2010 Tsurface [⁰C] Cloud Cover [-] Rainfall
[mm/6h] SWsurface [W] LWsurface [W]
Reference Case
Average 11,49 0,390 0,0884 107,41 -64,81
Average Changes
Direct Aerosol
Case
-0,53 -0,004 -0,0037 -21,76 -2,31
(-0,2%) (-1,1%) (-4,2%) (-20,4%) (+3,7%)
Average Changes
Total Aerosol Case
-0,54 -0,008 -0,0034 -22,69 -2,31
(-0,2%) (-2,0%) (-3,9%) (-20,9%) (+3,7%)
July 2010 T surface
[⁰C] Cloud Cover [-]
Rainfall [mm/6h]
SWsurface [W] LWsurface [W]
Reference Case
Average 7,67 0,664 1,22 189,35 -64,81
Average Changes
Direct Aerosol
Case
-0,57 -0,0080 -0,12 -36,11 -1,85
(-0,2%) (-1,2%) (-9,9%) (-19,2%) (+5,1%)
Average Changes
Total Aerosol Case
-0,60 -0,0081 -0,14 -38,89 -2,31
(-0,2%) (-1,3%) (-11,3%) (-20,6%) (+5,5%)
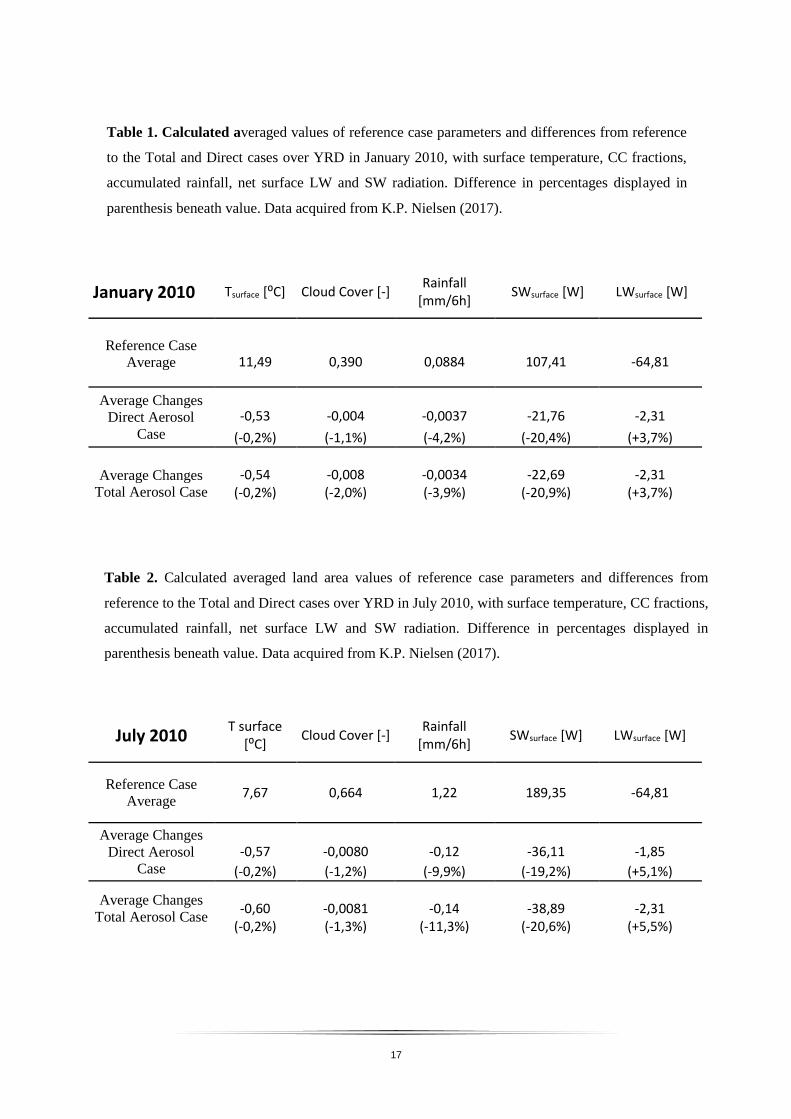
Table 1. Calculated averaged values of reference case parameters and differences from reference
to the Total and Direct cases over YRD in January 2010, with surface temperature, CC fractions,
accumulated rainfall, net surface LW and SW radiation. Difference in percentages displayed in
parenthesis beneath value. Data acquired from K.P. Nielsen (2017).
Table 2. Calculated averaged land area values of reference case parameters and differences from
reference to the Total and Direct cases over YRD in July 2010, with surface temperature, CC fractions,
accumulated rainfall, net surface LW and SW radiation. Difference in percentages displayed in
parenthesis beneath value. Data acquired from K.P. Nielsen (2017).
18
Observing table 1 and 2, which demonstrate the monthly average mean values for the reviewed
parameters over the YRD land area, confirms some of the suggested relations and is described below.
Firstly, depicting the 1
2 ⁰C surface temperature decrease in the direct and total aerosol case,
consequently due to the mentioned increase of AOD for MACC aerosols, seen in Figure 6.a-b, where
the surface temperature show direct relation to the amount of net surface radiation as more surface
radiation result in increasing surface temperatures. Also, the additional decrease in the total aerosol case,
concerning values of surface temperature and SW radiation, occurs because of the Twomey effect.
Estimating that the increasing (negatively) amount of net surface LW radiation for the total aerosol case
is due to the CDNC parametrizations by Menon et al. (2002). Where applying the indirect climate effect
with larger cloud optical thickness results in more LW radiated towards the surface and increasing the
net LW radiation value. The studied Twomey effect relates with the given rainfall changes of the total
aerosol case in Table 1-2. By resulting in further decreased amounts of rainfall, it partially confirms the
mentioned phenomena where the higher CDNC prevents droplets from overcoming gravity and fall as
precipitation. The Albrecht effect from Section 2.1 show no observed increase, as CC is decreasing for
both aerosol cases in relation to the reference.
Connecting the decreasing amount of rainfall to observed parameter changes such as the decreased
CC (about 1.2%) and elevated atmospheric SW absorption from urban aerosols (-20%), as the probable
main factor of simulated reduced rainfall, brought up in Section 2.1.
However, observing values of decreased rainfall during the July (-11%) period in respect to January
(-4%), could relate to the mentioned studies on anthropogenic emissions weakening the southeast-Asian
summer monsoon by Bollasina et al. (2011). No further analysis on this connection was performed.
The general reduction of cloud cover in aerosol cases could be related to mentioned semi-direct
climate effect stabilizing the vertical profile of the atmosphere and preventing convective cloud
formation, this is also covered in Section 4.2.
4.2 July 30th Cloud Cover
This case was created to observe the hourly data sets, with accumulation and differences of CC, and
mainly as follow-up investigation of the greatest case difference in CC seen in Figure 4b occurring at
this date. The amount of convective clouds at these dates is significantly lower for the aerosol cases and
was chosen to observe the 1-hour data sets with original snapshots of CC compared to the 6-hour
accumulated snapshots to understand how big influence the reanalysed aerosols could have producing
hourly forecast.
19
a)
b)
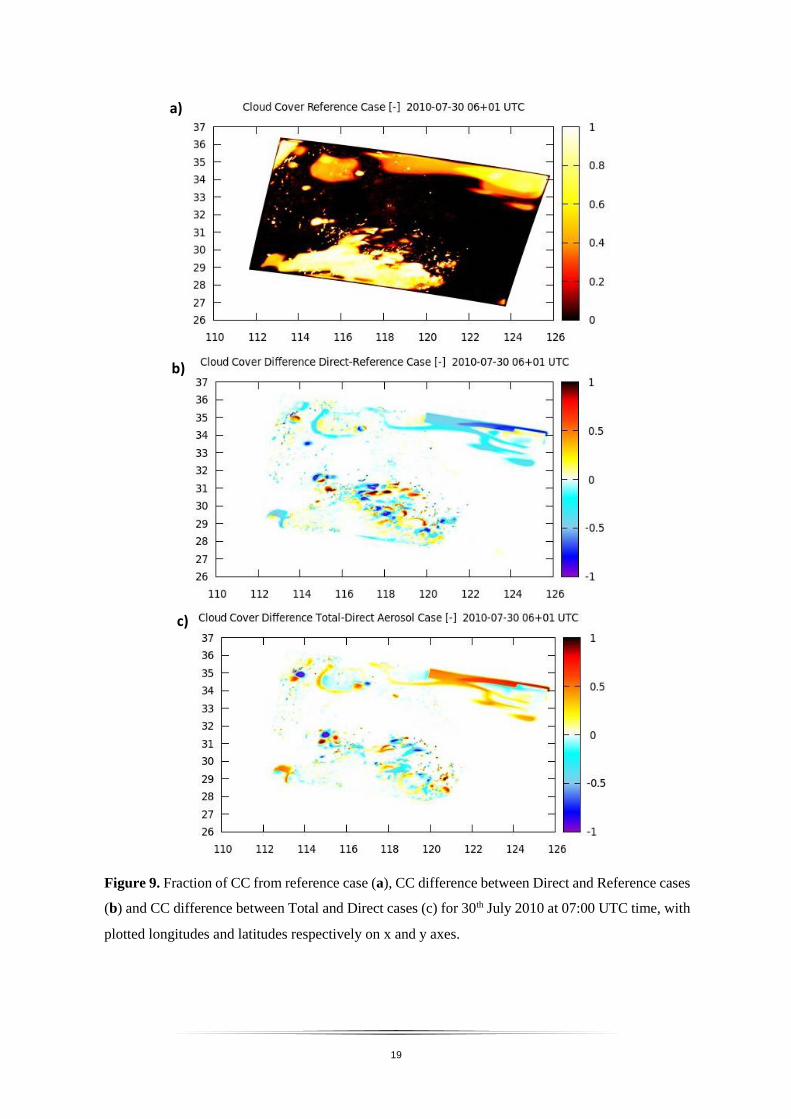
Figure 9. Fraction of CC from reference case (a), CC difference between Direct and Reference cases
(b) and CC difference between Total and Direct cases (c) for 30th July 2010 at 07:00 UTC time, with
plotted longitudes and latitudes respectively on x and y axes.
c)

20
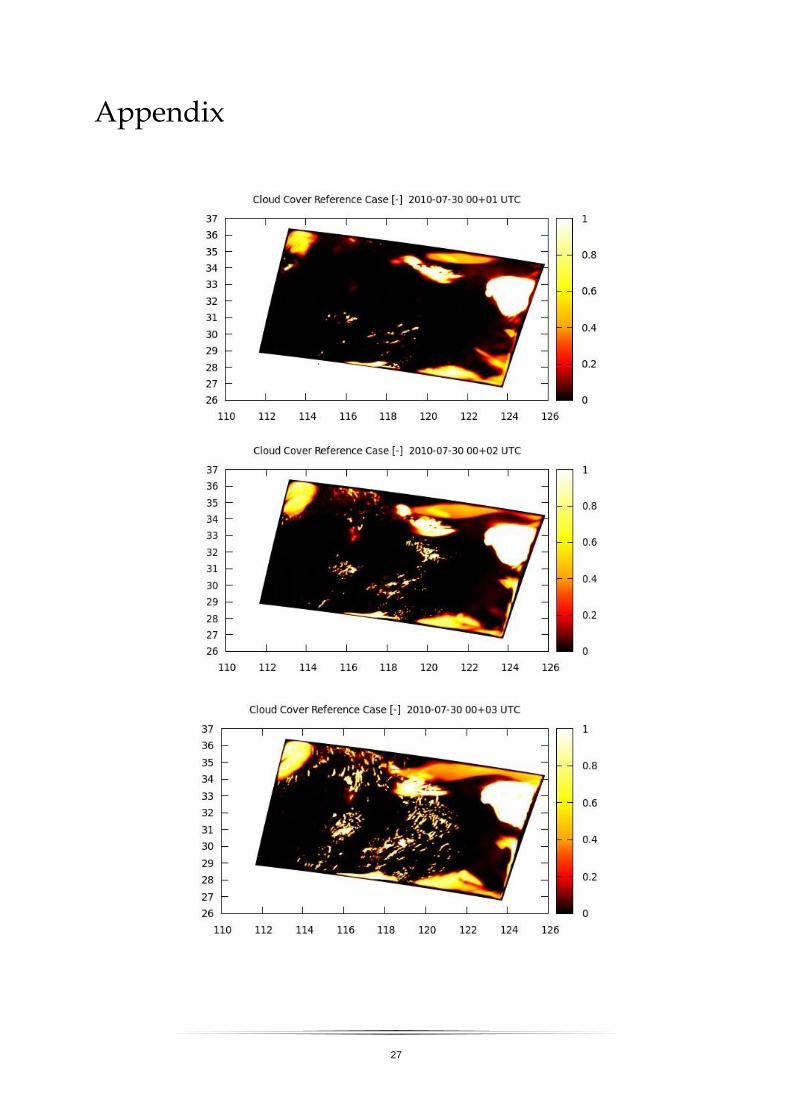
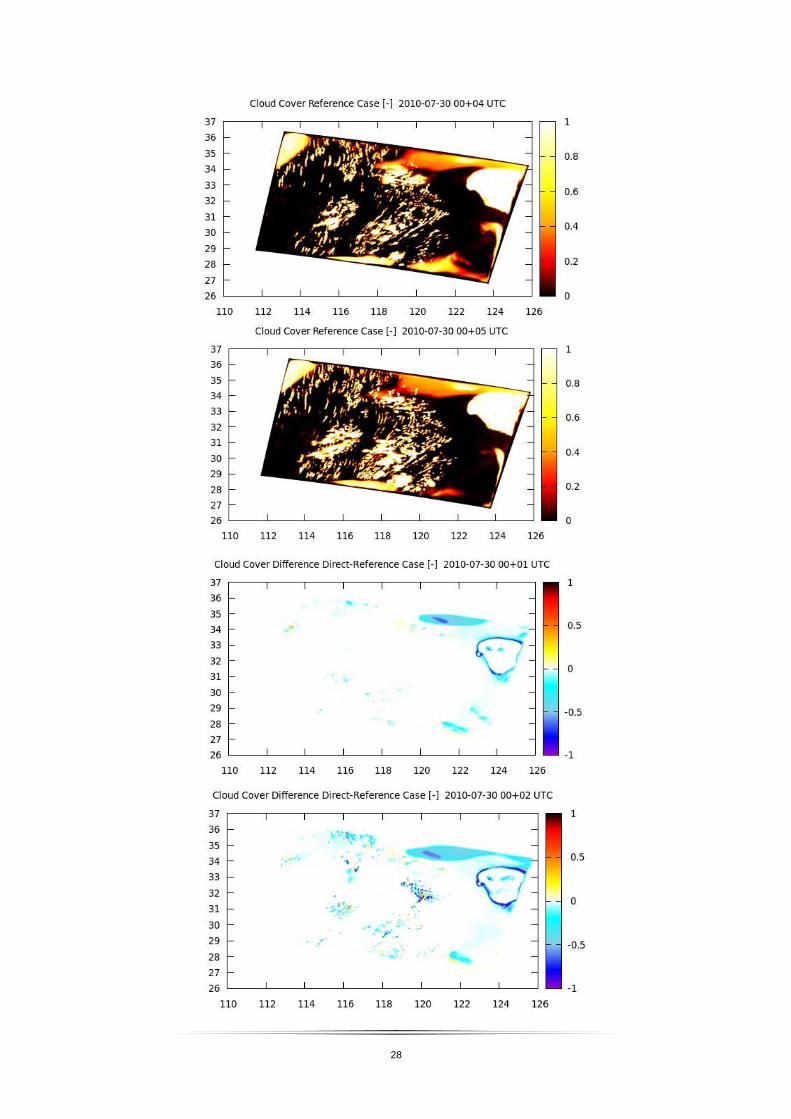
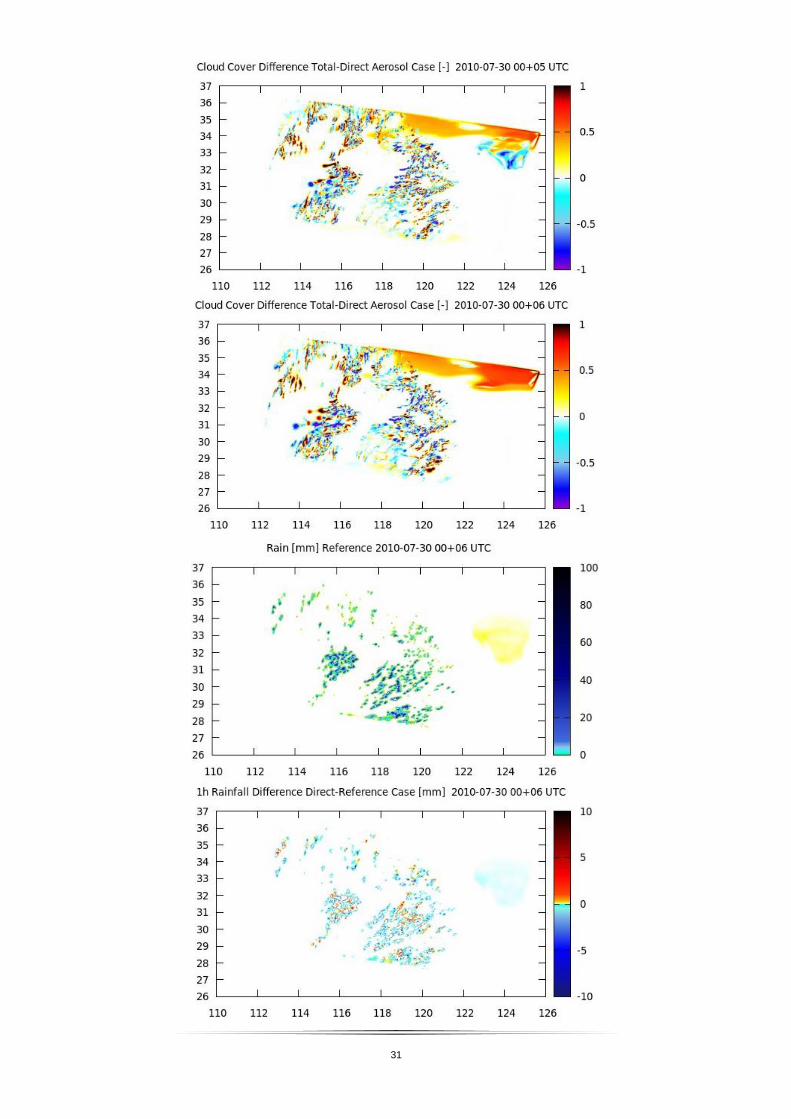
Figure 10. Fraction of CC from reference case (a), CC difference between Direct and Reference
cases (b) and CC difference between Total and Direct cases (c) for 30th July 2010 hourly accumulated
CC 00:00 +6h UTC time, with plotted longitudes and latitudes respectively on x and y axes.
a)
b)
c)
21
The observed differences for our cases in Figure 9 and 10 imply a significant CC variation due to
the AOD approximation, where the snapshot in Figure 9b shows how the CC differs from just one data
value of one hour at 15:00 local time between the direct and reference case.
Considering that this date show relative high fractions of urban MACC aerosols, which implements
that specific scenarios of greater anthropogenic emission rates during the day. This could prove some
influence on the meteorological conditions related to specific days of high urban activity as studied in
Wang et al. 2012. Though the other high urban MACC scenarios show fewer anomalies than July 30th.
Here the mentioned semi-direct climate effect (Wang et al. 2012) is expected to stabilize the
surrounding atmosphere and be an important factor regarding the considerable decrease of convective
clouds seen in Figure 10b, and in Figure 9b as well. The stabilizing effect decreases the magnitude of a
possible CAPE and formation of convective clouds. The convective cloud pattern is noticeable in Figure
8 where the net surface radiative forcing is decreased by overlying CC, and possible cloud trajectory is
distinguishable near the coastline in Figure 9a-c, but was not investigated further. The difference
between the total and direct aerosol experiments in Figure 9c and 10c shows how the simulated total
case computes more convective CC from the increased number of aerosols acting as CCN and higher
CDNC. All simulated cases for each accumulated hour are displayed in appendix with the additional
plots of accumulated rain-showers to observe the substantial decrease comparing direct aerosol case to
the reference, yet no further research on this is made.
However, by close observation of Figure 10, the coastline over the YRD can be fairly distinguished
by the formation of convective clouds due to warm near-ground moist air-parcels experiencing ascent
and generating cumulus clouds, which is an elegant display from a meteorological perspective.
The atmospheric MACC AOD reanalysis models show significant decreased amount of CC and
rain-showers during this day, but is not analysed in further depth, see Section 5.

22
5. Summary and Outlook
The direct and indirect climate effect was previously known by earlier studies on atmospheric physics
and depicted by related literatures and papers in Section 2. This effect is observed through mentioned
alterations in the AOD of aerosols simulated with the HARMONIE models, set to create three
experimental models. These alterations were previously applied in two aerosol model cases for us to
investigate and correlate studies and facts concerning the direct climate effect. Combining the AOD
alterations together with a Menon et al. (2002) parametrization of CDNC, established a total aerosol
case which was provided for the analytic study accounting for the indirect climate effect.
The clear relations between the new AOD and net radiation schemes is observed in Section 4.1.
Evaluating how CC, surface temperatures and rain relate to the aerosols ability to perceive long and
shortwave radiation, simultaneously under the influence of the indirect Twomey effects, mentioned in
Section 2.
Significant CC differences between the experimental model cases in Figures 9 and 10 were
observed, providing the clear analytic conclusion that by applying and experimenting with alternative
aerosol characteristics in weather-modelling, you enable a more accurate NWP in regions of high
anthropogenic and natural aerosol emissions, such as YRD. The 30th July case presented considerable
case difference in rain-showers but was only brought through light observation.
Section 2 states that the accounted Twomey effect with increased CDNC and CCN elevates the
scattering characteristics of clouds. Yet Table 1 and 2, with calculated average land area mean values,
display significantly lower influence by this indirect effect compared to the resulting MACC-AOD
effect from Inness et al. (2013).
But note that the actual AOD’s could vary significantly in reality, and the estimated urban aerosols
simulated through the models for this study implies large uncertainties in the results. This is not further
explored in our analysis, as this focus study is made to understand the general relationship between
simulated model aerosols and meteorological parameters.
However, studying these variations, including a vertically profiled data set, could conduct further
discussion on how and where the increased urban aerosols absorb (or scatter) the SW radiation resulting
in the observed greatly decreased amounts of surface net SW radiation. This case could be appealing for
future studies as this input also provides an accurate stability simulation of the YRD atmosphere related
to the semi-direct climate effect.
It is worth inferring that the acquired simulated experimental models for this study only include
the mentioned direct, semi-direct and indirect radiative effects of aerosols. Other meteorological effects

23
brought about by AOD alterations like drizzle formation and ice precipitation in clouds are not
accounted for. Furthermore, chemical effects and cycles occurring in the atmosphere through mixing or
aging of particles are not accounted for by HARMONIE weather model. and could cause altering results
compared to the provided data when reacting with additional present aerosols. Example and further
studies on this is done by Yu and Zhang (2011).
24
References
Ahrens, C.D. Meteorology Today: An Introduction to Weather and the Environment. Belmont,
USA, 11th edition, 536-583. 2008.
Albrecht, B., Aerosols, cloud microphysics, and fractional cloudiness, Science, Vol.245, 1227–
1230. 1989.
Bengtsson, L., U. Andrae, T. Aspelien, Y. Batrak, J. Calvo, W. de Rooy, E. Gleeson, B. H. Sass,
M. Homleid, M. Hortal, K.-I. Ivarsson, G. Lenderink, S. Niemelä, K. P. Nielsen, J. Onvlee, L.
Rontu, P. Samuelsson, D. Santos Muñoz, A. Subias, S. Tijm, V. Toll, X. Yang, M. Ø. Køltzow, The
HARMONIE-AROME model configuration in the ALADIN-HIRLAM NWP system, Bull. Amer.
Meteorol. Soc., accepted for publication, doi:10.1175/MWR-D-16-0417.1. 2017.
Bollasina, M. A., Y. Ming and V. Rawaswamy, Anthropogenic aerosols and the weakening of the
South Asian summer monsoon, Science. doi:10.1126/science.1204994, 334, 501. 2011.
ECMWF, IFS documentation, European Centre for Medium Range Weather Forecasts.
http://www.ecmwf.int/en/elibrary/16648- part-ivphysical-processes. 2015.
Fan, J., R. Zhang, W.-K. Tao and K. I. Mohr, Effects of aerosol optical properties on deep
convective clouds and radiative forcing, J. Geophys. Res, doi:10.1029/2007JD009257, Vol.113,
D08209. 2008
Holton, J. Hakim, G. An Introduction to Dynamic Meteorology, Volume 88, 5th edition, 58-59.
2012.
Inness, A., F. Baier, A. Benedetti, I. Bouarar, S. Chabrillat, H. Clark, C. Clerbaux, P. Coheur, R. J.
Engelen, Q. Errera, J. Flemming, M. George, C. Granier, J. Hadji-Lazaro, V. Huijnen, D. Hurtmans, L.
Jones, J. W. Kaiser, J. Kapsomenakis, K. Lefever, J. Leitão, M. Razinger, A. Richter, M. G. Schultz, A.
J. Simmons, M. Suttie, O. Stein, J.-N. Thépaut, V. Thouret, M. Vrekoussis, C. Zerefos, and the MACC
team, The MACC reanalysis: an 8 yr data set of atmospheric composition, Atmos. Chem. Phys. Vol.13,
4073–4109. 2013.
25
Kourtidis, K., S. Stathopoulos, A. K. Georgoulias, G. Alexandri and S. Rapsomanikis, A study of
the impact of synoptic weather conditions and water vapor on aerosol–cloud relationships over major
urban clusters of China. Atmos. Chem. Phys. Vol.15, 10955– 10964. 2015.
Lu, Z., Streets, D. G., Zhang, Q., Wang, S., Carmichael, G. R., Cheng, Y. F., Wei, C., Chin, M.,
Diehl, T., and Tan, Q.: Sulfur dioxide emissions in China and sulfur trends in East Asia since 2000,
Atmos. Chem. Phys. Vol.10, 6311–6331. 2010.
Martin, G. M., D. W. Johnson and A. Spice, The measurement and parameterization of effective
radius of droplets in warm stratocumulus clouds, J. Atmos. Sci. Vol.51, 1823-1842. 1994.
Menon, S., A. D. Del Genio, D. Koch and G. Tselioudis, GCM simulations of the aerosol indirect
effect: Sensitivity to cloud parameterization and aerosol burden, J. Atmos. Sci. Vol.59, 692-713. 2002.
Nielsen, K.P., E. Gleeson, L. Rontu, V. Toll, Radiation Experiments and Developments, Met
Eireann, Ireland, FMI, Finland, DMI, Denmark, Reading University, UK. 1, Poster. 2017
Reddy, S. M. and Boucher, O.: Climate Impact of Black Carbon Emitted from Energy
Consumption in the World’s Regions, Geophys. Res. Lett. Vol.34, 1-5 2006.
Stier, P., J. Feichter, S. Kinne, S. Kloster, E. Vignati, J. Wilson, L. Ganzeveld, I. Tegen, M. Werner,
Y. Balkanski, M. Schulz, O. Boucher, A. Minikin and A. Petzold. The aerosol-climate model ECHAM5-
HAM. Atmos. Chem. Phys. Vol.5, 1125-1156. 2005.
Streets, D. G., Gupta, S., Waldhoff, S. T., Wang, M. Q., Bond, T. C., and Yiyun, B.: Black carbon
emissions in China, Atmos. Environ. Vol.35, 4281–4296. 2001
Thomas, G. E. and Stamnes, K. Radiative Transfer in the Atmosphere and Ocean, Cambridge
University Press, New York, NY, USA,1st Edition, 35-53. 1999
Toll, V., Reis, K., Ots, R., Kaasik, M., Männik, A., Prank, M., and Sofiev, M. Silam, MACC
reanalysis aerosol data used for simulating the aerosol direct radiative effect with the NWP model
HARMONIE for summer 2010 wildfire case in Russia. Atmospheric Environment. Vol.121, 75–85.
2015.
26
Toll, V., Gleeson, E., Nielsen, K.P., Männik, A., Masek, J., Rontu, L., Post, P. Impacts of the direct
radiative effect of aerosols in numerical weather prediction over Europe using the ALADIN-HIRLAM
NWP system. Vol.172-173, 163-173. 2016.
Twomey, S. A. The nuclei of natural cloud formation. Part II: The supersaturation in natural clouds
and the variation of cloud droplet concentrations. Geofis. Pure Appl. Vol.43, 227–242. 1959.
Twomey, S. A. The influence of pollution on the shortwave albedo of clouds. J. Atmos. Sci. Vol.34,
1149–1152. 1977.
Wang, W., D. Gong, Z. Zhou and Y. Guo, Robustness of the aerosol weekly cycle over
Southeastern China, Atmospheric Environment. doi:10.1016/j.atmosenv.2012.07.029. 2012.
Wang, Y., Zhang, R. Y. & Saravanan, R. Asian pollution climatically modulates mid-latitude
cyclones following hierarchical modelling and observational analysis. Nature Communications 5.
doi:10.1016/j.atmosenv.2012.07.029. 2014.
Yu, S. and Y. Zhang, An Examination of the effects of aerosol chemical composition and size on
radiative properties of multi-component aerosols, Atmos. Clim. Sci. doi:10.4236/acs.2011.12003. 2011.
Zhang, H., Z. Wang, Z. Wang, Q. Liu, S. Gong, X. Zhang, Z. Shen, P. Lu, X. Wei, H. Che, L. Li,
Simulation of direct radiative forcing of aerosols and their effects on East Asian climate using an
interactive AGCM-aerosol coupled system. Clim. Dyn. doi:10.1007/s00382-011-1131-0. 2011.
Picture references
SEDAC. Center for International Earth Science Information Network. Columbia University, New
York. http://sedac.ciesin.columbia.edu/. (2013)
DMI logo. Accessed May 3rd 2017 at http://www.dmi.dk/om-dmi/presse/dmis-logo/
Lund university logo. Accessed May 3rd 2017 at http://www.medarbetarwebben.lu.se/
27
Appendix
28

29

30
31
32
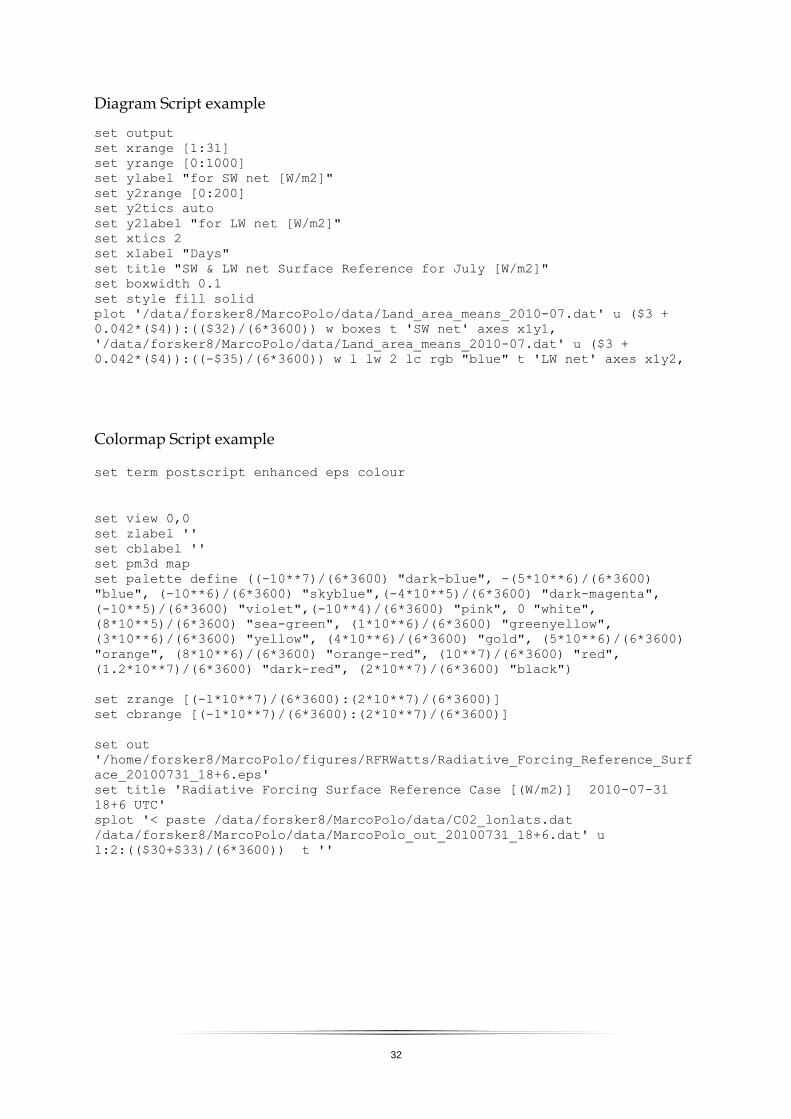
Diagram Script example
set output
set xrange [1:31]
set yrange [0:1000]
set ylabel "for SW net [W/m2]"
set y2range [0:200]
set y2tics auto
set y2label "for LW net [W/m2]"
set xtics 2
set xlabel "Days"
set title "SW & LW net Surface Reference for July [W/m2]"
set boxwidth 0.1
set style fill solid
plot '/data/forsker8/MarcoPolo/data/Land_area_means_2010-07.dat' u ($3 +
0.042*($4)):(($32)/(6*3600)) w boxes t 'SW net' axes x1y1,
'/data/forsker8/MarcoPolo/data/Land_area_means_2010-07.dat' u ($3 +
0.042*($4)):((-$35)/(6*3600)) w l lw 2 lc rgb "blue" t 'LW net' axes x1y2,
Colormap Script example
set term postscript enhanced eps colour
set view 0,0
set zlabel ''
set cblabel ''
set pm3d map
set palette define ((-10**7)/(6*3600) "dark-blue", -(5*10**6)/(6*3600)
"blue", (-10**6)/(6*3600) "skyblue",(-4*10**5)/(6*3600) "dark-magenta",
(-10**5)/(6*3600) "violet",(-10**4)/(6*3600) "pink", 0 "white",
(8*10**5)/(6*3600) "sea-green", (1*10**6)/(6*3600) "greenyellow",
(3*10**6)/(6*3600) "yellow", (4*10**6)/(6*3600) "gold", (5*10**6)/(6*3600)
"orange", (8*10**6)/(6*3600) "orange-red", (10**7)/(6*3600) "red",
(1.2*10**7)/(6*3600) "dark-red", (2*10**7)/(6*3600) "black")
set zrange [(-1*10**7)/(6*3600):(2*10**7)/(6*3600)]
set cbrange [(-1*10**7)/(6*3600):(2*10**7)/(6*3600)]
set out
'/home/forsker8/MarcoPolo/figures/RFRWatts/Radiative_Forcing_Reference_Surf
ace_20100731_18+6.eps'
set title 'Radiative Forcing Surface Reference Case [(W/m2)] 2010-07-31
18+6 UTC'
splot '< paste /data/forsker8/MarcoPolo/data/C02_lonlats.dat
/data/forsker8/MarcoPolo/data/MarcoPolo_out_20100731_18+6.dat' u
1:2:(($30+$33)/(6*3600)) t ''

33
Loop script example for 248 figures