analyzing using tam modul on primary school …etd.uum.edu.my/4119/2/s806074_abstarct.pdf · due to...
TRANSCRIPT
i
ANALYZING USING TAM MODUL ON PRIMARY
SCHOOL TEACHERS IN IMPLEMENTING SPPBS: STUDY
OF TEACHERS IN KEDAH, PERLIS AND PENANG.
NAILILHUDA BINTI AHMAD
UNIVERSITI UTARA MALAYSIA
2014
ii
PERMISSION TO USE
In presenting this thesis in fulfilment of the requirements for a postgraduate degree
from Universiti Utara Malaysia, I agree that the University‟s Library may make it
freely available for inspection. I further agree that permission for the copying of this
thesis in any manner, in whole or in part, for scholarly purpose may be granted by
my supervisor(s) or, in their absence, by the Dean of Postgraduate Studies and
Research. It is understood that any copying or publication or use of this thesis or
parts thereof for financial gain shall not be allowed without my written permission. It
is also understood that due recognition shall be given to me and to Universiti Utara
Malaysia for any scholarly use which may be made of any material from my thesis.
Requests for permission to copy or to make other use of materials in this thesis, in
whole or in part should be addressed to:
Dean (Othman Yeop Abdullah Graduate School of Business)
Universiti Utara Malaysia
06010 UUM Sintok
Kedah Darul Aman

iii
ABSTRACT
Adaptation to the changes of information age cause educational discipline all over
the world to adopt the use of information systems in the educational institutions.
With this regards, Ministry of Education introduced that the School Based
Assessment (PBS) as a component of the assessment conducted by the school
assessment carried out by teachers of subjects continuously in the process of teaching
and learning. Due to the nature of PBS as a type of continuous assessment to observe
the student‟s development as a whole, the introduction of SPPBS application is
thought to be handy for teachers to record and store the academic and non-academic
data. Despite the benefit of better information management by the system, users
among the teachers found the system too difficult to use and have not been able to
scale down that hurdle to user acceptance and usage of the SPPBS. Therefore, this
research aimed to find the determinants of system usage and relationship between
system acceptance and system adoption among the primary school teachers. The data
was collected through the use of survey questionnaire, distributed to 379 primary
school teachers dispersed around the area of Kedah, Perlis and Penang. The result
showed that the most important factor in determining teachers‟ adoption towards
SPPBS was perceived of ease in using the system. There were negative correlation
between perceive of usefulness and perceive of dependability towards SPPBS
adoption, while there was positive correlation between perceive of ease of use and
SPPBS adoption among the primary school teachers.

iv
ABSTRAK
Penyesuaian terhadap perubahan zaman maklumat menyebabkan disiplin pendidikan
di seluruh dunia mula menerima pakai penggunaan sistem maklumat dalam institusi
pendidikan. Sehubungan dengan itu , Kementerian Pelajaran Malaysia telah
memperkenalkan Sistem Pentaksiran Berasaskan Sekolah (PBS) sebagai satu
komponen penilaian oleh sekolah yang dijalankan oleh guru-guru mata pelajaran
secara berterusan dalam proses pengajaran dan pembelajaran. Disebabkan sifat PBS
sebagai sejenis penilaian secara berterusan untuk memantau perkembangan pelajar
secara keseluruhan, pengenalan aplikasi SPPBS dianggap berguna untuk guru-guru
untuk merekod dan menyimpan data akademik dan bukan akademik.Walaupun
terdapat faedah pengurusan maklumat yang lebih baik yang disumbangkanoleh
sistem ini, pengguna di kalangan guru-guru mendapati sistem tersebut terlalu sukar
untuk digunakan dan tidak dapat untuk melepasi halangan tersebut kepada
penerimaan dan penggunaan SPPBS. Oleh itu , kajian ini bertujuan untuk mencari
penentu penggunaan sistem serta hubungan antara penerimaan sistem dan
penggunaan sistem di kalangan guru-guru sekolah rendah. Data dikumpulkan melalui
penggunaan soal selidik yang diedarkan kepada 379 guru sekolah rendah yang
mengajar di sekitar kawasan Kedah , Perlis dan Pulau Pinang. Keputusan
menunjukkan bahawa faktor yang paling penting dalam menentukan penerimaan
guru terhadap SPPBS ialahtanggapan kemudahan dalam menggunakan sistem.
Terdapat korelasi negatif antara tanggapan penggunaan dan tanggapan
kebergantungan terhadap penggunaan SPPBS , manakala terdapat korelasi positif
antara tanggapankemudahan untuk menggunakan SPPBS kalangan guru-guru
sekolah rendah.
v
ACKNOWLEDGEMENT
I would like to express my grateful and sincere appreciation to my supervisor,
Associate Professor Dr Amlus bin Ibrahim for his monitoring, encouraging advice,
compliments and constructive critics. Throughout the completion of this
dissertation, her guidance, knowledge and wisdom have been resourceful and
engaging.
A special thanks goes to the primary school teachers around Perlis, Kedah and
Penang area whom have greatly give their co-operation for data collection.
Though each and every one of you has given your feedback anonymously, the co-
operation given indeed has significant contribution to the completion of this study.
Only Allah S.W.T can repay all your kindness.
Thanks to all my friends and colleague too who helped me directly or indirectly to
complete this research. Finally, I wish to express my gratitude to my family
especially my parents (Hj Ahmad bin Mat Piah and Hjh Rosidah binti Ismail) for
their constant support, encouragement and understanding which led to the
completion of this report.
Sincerely,
NAILILHUDA AHMAD
vi
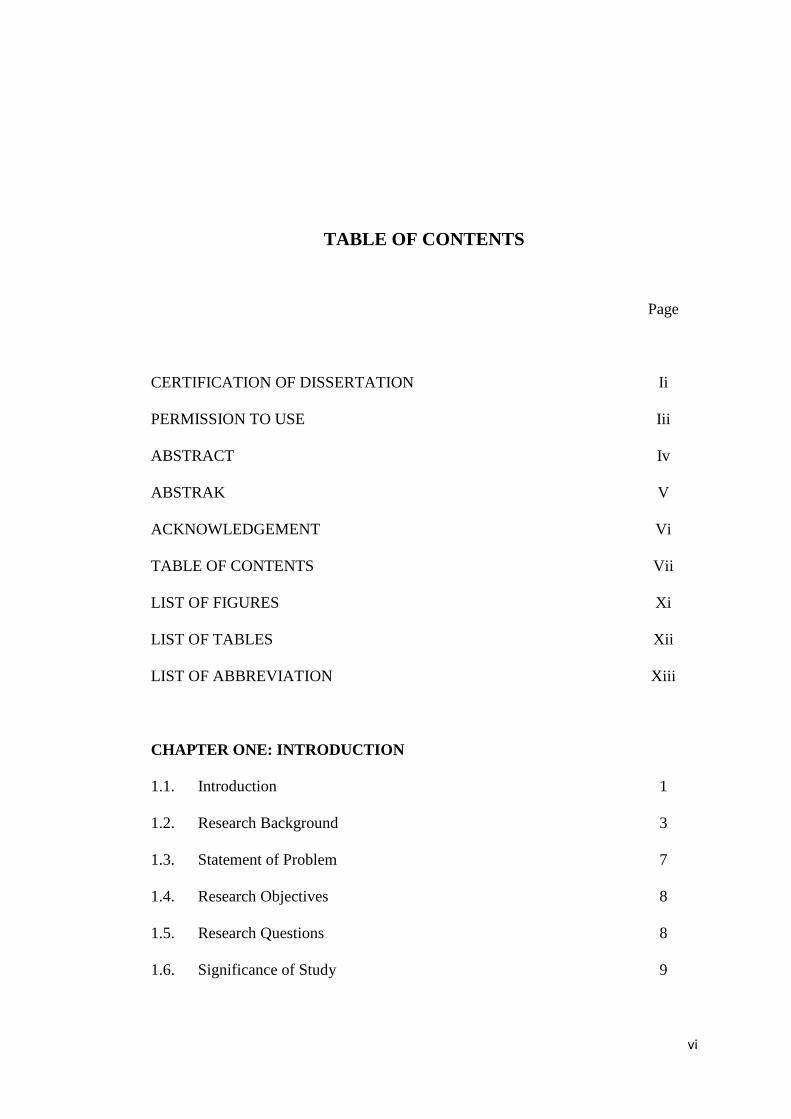
TABLE OF CONTENTS
Page
CERTIFICATION OF DISSERTATION Ii
PERMISSION TO USE Iii
ABSTRACT Iv
ABSTRAK V
ACKNOWLEDGEMENT Vi
TABLE OF CONTENTS Vii
LIST OF FIGURES Xi
LIST OF TABLES Xii
LIST OF ABBREVIATION Xiii
CHAPTER ONE: INTRODUCTION
1.1. Introduction 1
1.2. Research Background 3
1.3. Statement of Problem 7
1.4. Research Objectives 8
1.5. Research Questions 8
1.6. Significance of Study 9

vii
1.7. Scopes and Limitations 10
1.8. Definition of Terms 10
1.9. Organization of Thesis 12
Page
CHAPTER TWO: LITERATURE REVIEW
2.1. Introduction 13
2.2. Information Technology 13
2.3. Information Communication Technology (ICT) in Education 15
2.4. User Acceptance 16
2.5. Teachers Acceptance towards PBS 19
2.6. Technology Acceptance Model (TAM) 20
2.7. Individual Differences 24
2.7.1. Gender difference in technology acceptance 26
2.7.2. Age differences in technology acceptance 27
2.8. Theoretical Framework 28
2.9. Hypotheses 29
2.10 Summary 31
CHAPTER THREE: METHODOLOGY
3.1 Introduction 32
3.2 Research Design 32
3.2.1. Model Selection 33

viii
3.3 Data Collection Method 34
3.4 The Sampling Design 34
3.4.1. The sample and sampling technique 35
3.4.2. The population and sampling frame 35
Page
3.5. Questionnaire Design 37
3.5.1 Administrative of Field Study 38
3.6. Data Collection 39
3.7. Data Analysis 39
3.7.1. Descriptive Analysis 39
3.7.2. One-way ANOVA 40
3.8. Hypotheses Testing 40
3.8.1. Pearson‟s Correlation 40
3.8.2. Multiple Regression Analysis 41
3.9. Summary 42
CHAPTER FOUR: RESULTS AND ANALYSIS
4.1. Introduction 43
4.2. Sample Characteristics 43
4.3. Descriptive Statistics of Respondents Information 44
4.4. Descriptive of Variables 45
4.4.1 Perceive of Usefulness 45
4.4.2 Perceive of Ease of Use 47
4.4.3 Perceive of Dependability 448
4.4.4 SPPBS Adoption 50
ix
4.5. Factor Analysis 50
4.6. Descriptive Statistic of Variables 55
4.7. One-way ANOVA for Variables 56
4.8.1 SPPBS Acceptance 56
4.7.2 SPPBS Adoption 57
4.8. Restatement of Hypotheses 58
4.9. Hypothesis Testing 59
4.9.1 Correlation 59
4.9.2 Multiple Regression 61
4.10 Summary 62
CHAPTER FIVE: DISCUSSION
5.1. Factors that Determine the System Acceptance among Primary
School Teachers
64
5.2. Most Important Factors that Determine the Users‟ System
Acceptance among Primary School Teachers
65
5.3. The Relationship between Acceptance Factors and Adoption
Factors
65
5.4. Gender, Age and Education Qualification Moderation in the
Relationship between Adaptation Factors and Acceptance Level of the
System
67
CHAPTER SIX: CONCLUSION 69
REFERENCES 70

x
APPENDIX A: SURVEY QUESTIONNAIRE 74
APPENDIX B: Descriptive Analysis 80
APPENDIX C: Reliability Analysis 84
APPENDIX D: Factor Analysis 92
APPENDIX E: One-way ANOVA 96
APPENDIX F: Correlation 98
APPENDIX G: Multiple Regression 99

xi
LIST OF FIGURES
Figure 1.1: Data stored in SPPBS produce synchronous report for school, PPD,
JPN and MOE (adapted from Examination Board, 2012) 6
Figure 2.1: The Technology Acceptance Model (Adapted from Slatten, 2010) 24
Figure 2.2: Theoretical Framework 29

xii
LIST OF TABLES
Table 3.1: Questionnaire Structure 37
Table 3.2: Range of mean value to determine the level of respondents‟
agreement 40
Table 4.1: Response rate 44
Table 4.2: Respondent‟s demographic profile and information 45
Table 4.3: Mean and standard deviation of items measuring perceive of
usefulness 46
Table 4.4: Mean and standard deviation of items measuring perceive of ease of
use 47
Table 4.5: Mean and standard deviation of items measuring perceive of
dependability 49
Table 4.6: Mean and standard deviation of items measuring SPPBS Adoption 50
Table 4.7: Kaiser-Meyer-Olkin and Bartlestt‟s Test 52
Table 4.8: Factors influencing the SPPBS system acceptance 53
Table 4.9: Descriptive statistics of variables 56
Table 4.10: One-way ANOVA between gender, age, highest qualification and
broadband/wireless subscriber with SPPBS acceptance 57
Table 4.11: One-way ANOVA between gender, age, highest qualification and
broadband/wireless subscriber with SPPBS adoption 58
Table 4.12: Correlation between perceive of usefulness and SPPBS adoption 60
Table 4.13: Correlation between perceive of ease of use and SPPBS adoption 61
Table 4.14: Correlation between perceive of dependability and SPPBS adoption
61
Table 4.15: Multiple regression 63
xiii
LIST OF ABBREVIATION
SPPBS Sistem Pengurusan Pentaksiran Berasaskan Sekolah
KSSR Kurikulum Standard Sekolah Rendah
TAM Technology Acceptance Model

1
CHAPTER ONE
INTRODUCTION
1.1. Introduction
We call the world we live in today as information age,booming with various
technological developments and advancements, urge different sectors, disciplines
and organizations to stay critically sensitive with technology changes. At this age,
due to many significant factors such as continuous developments in information
technologies, information exchange, increasing expectations of the society, modern
managing perceptions and applications, force the organizations around the globe to
develop new information system or information technology in order to survive
(Demir, 2003). Recently, contributions of information technologies (IT) to
educational field have been among the most highlighted in past researches (Yuen et
al., 2003; Webber, 2003; Flanagan & Jacopsen, 2003; Pelgrum, 2001).
Haag et al., (1998) emphasized that information systems support not only
information process but also innovations to educational institutions, such as school.
These systems are helpful in order to cope with the demands for change as the
entities being adaptable to changes. Therefore, the management of information
systems posed several advantages to the educational field: (1) improve the adaptation
of the educational institutions to the environment, (2) enable the institutions to

The contents of
the thesis is for
internal user
only

70
REFERENCES
Al-adaileh, R.M. (2009). An evaluation of information systems success: A user
perspective – the case of Jordan Telecom Group. European Journal of Scientific
Research, 37 (2), 226-239.
Al-Fahim, N.H. (2012). Factors affecting the adoption of internet banking amongst
IIUM‟s students: A structural equation modelling approach (SEM). Journal of Intenet
Banking and Commerce, 17 (3), 1-14.
Alkis N., & Ozkan, S. (2010). Work in progress – A modified technology acceptance
model for e-assessment: Intentions of engineering students to use web-based
assessment tools. Proceeding of 40th
ASEE/IEEE Frontiers in Education Conference,
October 27-30, Wachington, DC, S1G1 – S1G3.
Brumbulli, M., Topciu, B., & Dalaci, A. (2008). SMIS: A web-based school
management information system. Proceeding of International Scientific Conference
Computer Science 2008, 564-569.
Bugembe, J. (2010). Perceived usefulness, perceived ease of use, attitude and actual
usage of a new financial management system: A case study of Uganda National
Examinations Board. Master Dissertation, Makerere University Business School.
Cavana, R. Y., Delahaye, B. L., & Sekaran, U. (2001).Applied business research:
Qualitative and quantitative methods. Queensland: John Wiley & Sons
Chen, Y.N., Chen, H.M., Huang, W., & Ching, R.K.H. (2006). E-government
strategies in developed and developing countries: An implementation framework and
case study. Journal of Global Information Management, 14 (1), 23- 46.
Chesney, T. (2006).An acceptance model for useful and fun information systems. An
Interdisciplinary Journal on Humans in ICT Environments, 2 (2), 225-235.
Davis, F.D., Bagozzi, R.P., & Warshaw, P.R. (1989). User acceptance of computer
technology: A comparison of two theoretical models. Management Science, 35 (8),
982-1003.
Demir, K. (2006). School management information systems in primary schools. The
Turkish Online Journal of Educational Technology, 5 (2), 32-45.
Department of Statistics Malaysia.(2012). Social statistics bulletin. Retreived from
http://www.statistics.gov.my/portal/download_Labour/files/BPS/Buletin_Perangkaan
_Sosial2012.pdf
Dillon, A., & Morris, M.G. (1996). User acceptance of new information technology:
Theories and models. In M. Williams (ed.). Annual Review of Information Science

71
and Technology, 31, Medford NJ: Information Today, 3 -32. Retrieved from
https://www.ischool.utexas.edu/~adillon/BookChapters/User%20acceptance.htm
El-Gayar, O., & Moran, M. (2007). College students‟ acceptance of tablet PCs: An
application of the UTAUT model. Retrieved from
http://www.homepages.dsu.edu/moranm/research/publications/dsi06-rip-tam-
utaut.pdf
Examination Board.(2012). Panduan pengurusan pentaksiran berasaskan sekolah
(PBS). Kementerian Pelajaran Malaysia, Putrajaya.
Gong, M., Xu, Y., & Yu, Y. (2004). An enhanced technology acceptance model for
web-based learning.Journal of Information Systems Education, 15 (4), 36.
Harakahdaily. (2013). Guru kecewa SPPBS guna teknologi ketinggalan zaman.
Retrieved from http://bm.harakahdaily.net/index.php/berita-utama/22793-guru-
kecewa-sistem-sppbs
Johnson, A.M. (2005). The technology acceptance model and the decision to invest
in information security.Proceedings of the 2005 Southern Association of Information
systems Conference.
Krish, P., & Noraza, A.Z. (2007).Teachers and the new ICT challenges.Jurnal
Elektronik Fakulti Sains Sosial dan Kemanusiaan, 2 (2), 1-13.
Ku, C.H. (2009). Extending the technology acceptance model using perceived user
resources in higher education web-based online learning courses.Doctoral
dissertation, College of Education, University of Central Florida.
Laitenberger, O., & Dreyer, H.M. (1998).Evaluating the usefulness and the ease of
use of a web-based inspection data collection tool.Proceeding of 5th
International
Software Metric Symposium, 20-21 Nov, Bethesda, MD.
Lau, B.T., & Sim, C.H. (2008).Exploring the extent of ICT adoption among
secondary school teachers in Malaysia.International Journal of Computing and ICT
Research, 2 (2), 19-36.
Lee, Y., Kozar, K.A., & Larsen, K.R.T. (2003). The technology acceptance model:
Past, present and future. Communications of the Association for Information Systems,
12 (50), 752-780.
Mathieson, K., Peacock, E., & Chin, W.W. (2001).Extending the technology
acceptance model: The influence of perceived user resources.ACM SIGMIS
Database – Special issue onadoption, diffusion and infusion of IT, 32 (3), 86-112.
Ministry of Education Malaysia.(2010). Policy on ICT in education Malaysia.Frost
& Sullivan. Retrieved from
72
http://www.mscmalaysia.my/sites/default/files/pdf/publications_references/Policy%2
0on%20ICT%20in%20Education%20Malaysia%202010.pdf
Moghadam, A.H., & Bairamzadeh, S. (2009). Extending the technology acceptance
model for e-learning: A case study of Iran.Proceeding of 6th
International
Conference on Information technology: New Generations, 27-29 April, Las Vegas,
NV.
Mohd Solihin, C.R. (2014). Dilema guru, PBS dan SPPBS. Retrieved from
http://www.sinarharian.com.my/karya/pendapat/dilema-guru-pbs-dan-sppbs-
1.242981
Money, W., & Turner, A. (2005).Assessing knowledge management system user
acceptance with the technology acceptance model.International Journal of
Knowledge Management, 1 (1), 8 – 26.
Ndubisi, N.O.(2007). Evaluating the Direct and Indirect Impact of Traits and
Perceptions on Technology Adoption by Women Entrepreneurs in
Malaysia. Academy of Entrepreneurship Journal, 13 (2), 1-20.
Ndubisi, N.O., Jantan, M. & Richardson, S. (2001). Modified Technology
Acceptance Model: Moderating Impact of Users Traits. Asian Academy of
Management Journal, 6 (2), 31-54.
Phuangthong, D., & Malisuwan, S. (2008). User acceptance of multimedia mobile
internet in Thailand.International Journal of the Computer, the Internet and
Management, 16 (3), 22-33.
Porter, C.E., & Donthu, N. (2006). Using the technology acceptance model to
explain how attitudes determine Internet usage: The role of perceived access barriers
and demographics. Journal of Business Research, 59, 999-1007.
Ramayah, T., & Aafaqi, B. (2004).Role of self-efficacy in e-library usage among
students of a public university in Malaysia.Malaysian Journal of Library &
Information Science, 19 (1), 39-57.
Ramayah, T., & Jantan, M. (n.d.). Technology acceptance: An individual perspective
current and future research in Malaysia. Retrieved from http://www.ramayah.com
Raziatul Hanum, A.R. (2013). SPPBS, PBS: Cantik pada kertas tapi… Retrieved
from http://www.sinarharian.com.my/sppbs-pbs-cantik-pada-kertas-tapi-1.227677
Sekaran, U. (2003). Research methods for business: A skill building approach (4th
ed.). New Jersey: John Wiley & Sons, Inc, 116-138.
Sharma, K.D. (2002). Impact of information technology on management education
through distance mode.Proceeding of 2nd
Pan-Commonwealth Forum on Open
Learning, July 29th
– August 2nd
, International Convention Centre, Durban.

73
Sim, J.C.H., & Lau, B.T. (2007).Teachers’ perceptions of the use of ICT as an
instructional tool in Mathematics and Science. Retrieved from
http://ictl.intimal.edu.my/ictl2007/proceeding/Full_Paper/1A-03-
Paper%2069%20(Malaysia).pdf
Slatten, L.A.D. (2010). An application and extension of the technology acceptance
model to nonprofit certification. Journal of Nonprofit Management, 14, 1-9.
Smith, J.A.B. (2006). The effect of social presence on teacher technology
acceptance, continuance intention, and performance in an online teacher
professional development course.Doctorate dissertation, College of Education,
University of Central Florida.
Tosun, N., & Baris, M.F. (2011).Using information and communication technologies
in school improvement.TOJET: The Turkish Online Journal of Educational
Technology, 10 (1), 223-231.
Vaidyanathan, G., Sabbaghi, A., & Bargellini, M. (2005). User acceptance of digital
library: An empirical exploration of individual and system components. Issues in
Information Systems, VI (2), 279-285.
Van der Heijen, H. (2003). Factors influencing the usage of websites: the case of a
generic portal in The Netherlands. Information & Management, 40, 541-549.
Venkatesh, V., & Bala, H. (2008). Technology acceptance model 3 and a research
agenda on interventions. Decision Sciences, 39 (2), 273-315.
Venkatesh, V., Morries, M.G., Daviz, G.B., & Davis, F.D. (2003). User acceptance
of information technology: Toward a unified view. MIS Quarterly, 27, (3), 425-478.
Visscher, A.J. (1996). Information technology in educational management as an
emerging discipline. International Journal of Educational Research, 25(4), 291-296.
Yuen, A.H.K., Law, N., & Wong, K.C. (2003). ICT implementation and school
leadership – case studies of ICT integration in teaching and learning. Journal of
Educational Administration, 41 (2), 158-170.
74
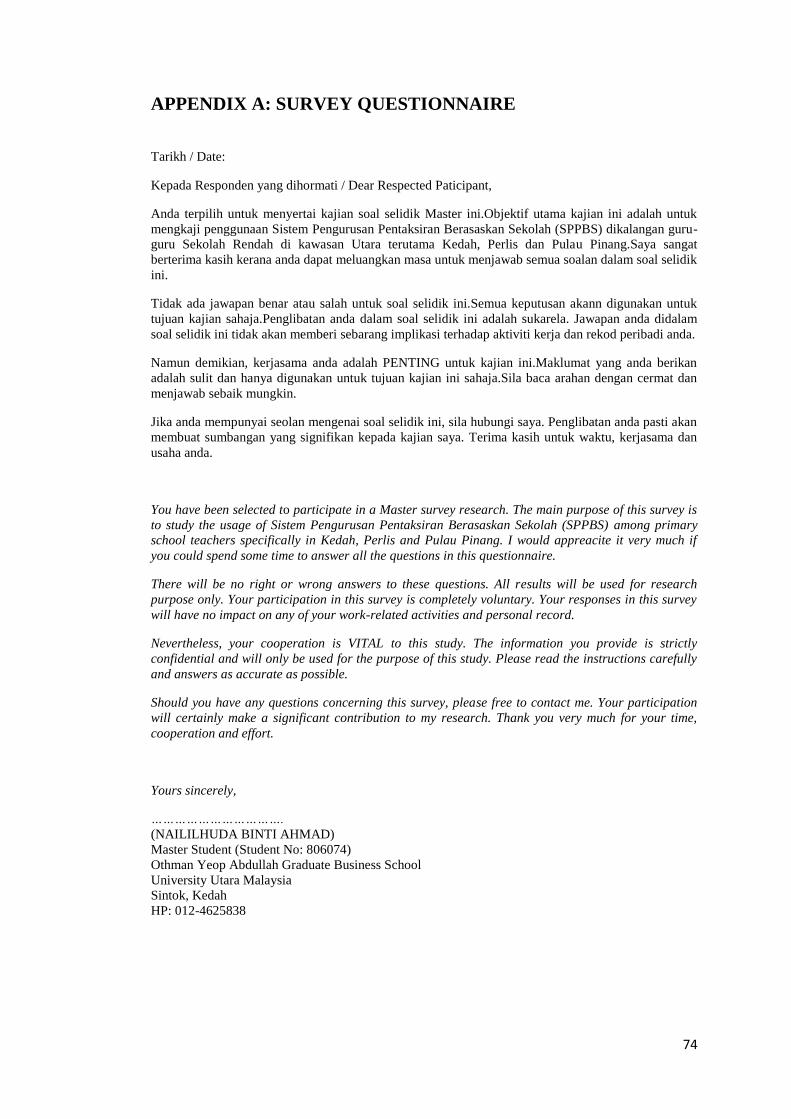
APPENDIX A: SURVEY QUESTIONNAIRE
Tarikh / Date:
Kepada Responden yang dihormati / Dear Respected Paticipant,
Anda terpilih untuk menyertai kajian soal selidik Master ini.Objektif utama kajian ini adalah untuk
mengkaji penggunaan Sistem Pengurusan Pentaksiran Berasaskan Sekolah (SPPBS) dikalangan guru-
guru Sekolah Rendah di kawasan Utara terutama Kedah, Perlis dan Pulau Pinang.Saya sangat
berterima kasih kerana anda dapat meluangkan masa untuk menjawab semua soalan dalam soal selidik
ini.
Tidak ada jawapan benar atau salah untuk soal selidik ini.Semua keputusan akann digunakan untuk
tujuan kajian sahaja.Penglibatan anda dalam soal selidik ini adalah sukarela. Jawapan anda didalam
soal selidik ini tidak akan memberi sebarang implikasi terhadap aktiviti kerja dan rekod peribadi anda.
Namun demikian, kerjasama anda adalah PENTING untuk kajian ini.Maklumat yang anda berikan
adalah sulit dan hanya digunakan untuk tujuan kajian ini sahaja.Sila baca arahan dengan cermat dan
menjawab sebaik mungkin.
Jika anda mempunyai seolan mengenai soal selidik ini, sila hubungi saya. Penglibatan anda pasti akan
membuat sumbangan yang signifikan kepada kajian saya. Terima kasih untuk waktu, kerjasama dan
usaha anda.
You have been selected to participate in a Master survey research. The main purpose of this survey is
to study the usage of Sistem Pengurusan Pentaksiran Berasaskan Sekolah (SPPBS) among primary
school teachers specifically in Kedah, Perlis and Pulau Pinang. I would appreacite it very much if
you could spend some time to answer all the questions in this questionnaire.
There will be no right or wrong answers to these questions. All results will be used for research
purpose only. Your participation in this survey is completely voluntary. Your responses in this survey
will have no impact on any of your work-related activities and personal record.
Nevertheless, your cooperation is VITAL to this study. The information you provide is strictly
confidential and will only be used for the purpose of this study. Please read the instructions carefully
and answers as accurate as possible.
Should you have any questions concerning this survey, please free to contact me. Your participation
will certainly make a significant contribution to my research. Thank you very much for your time,
cooperation and effort.
Yours sincerely,
…………………………….
(NAILILHUDA BINTI AHMAD)
Master Student (Student No: 806074)
Othman Yeop Abdullah Graduate Business School
University Utara Malaysia
Sintok, Kedah
HP: 012-4625838

75
Jawab SEMUA soalan dalam soal selidik ini.Keputusan dalam soal selidik ini adalah sulit
dan hanya digunakan untuk tujuan kajian ini sahaja. Maklumat anda tidak akan diberi atau
digunakan oleh individu ataupun organisasi lain. Tidak ada jawapan benar atau salah.Yang
penting adalah anda harus menjawab semua solan dengan sejujur mungkin dengan membaca
setiap soalan dengan cermat.
Please answer ALL questions in this questionnaire. Your responses in this questionnaire will
be treated strictly confidential and will only be used for the purpose of this study. Your
information will not be forwarded or employed by any other individual or organizations. As
each respondent may perceive the question differently, there is therefore no right or wrong
answers. What is important is you have to answer all the questions as honest as you can by
reading carefully each of the following questions.
Berikut adalah beberapa soalan tentang peribadi dan latar belakang pekerjaan.Soalan berikut
ini hanya untuk tujuan analisis. Mohon menjawab dengan menulis tanda (√) bagi pilihan
jawapan anda:
Below are few questions on your personal and job background. The following questions are
meant only for analysis purpose. Kindly answer by writing or tick (√) your choice of answer:
A1. Jantina / Gender Lelaki/ Wanita/
MaleFemale
A2. Umur/ Age: Sila nyatakan/ Please specify Tahun/ Years
A3. Kelayakan Tertinggi / Highest Qualification SRP
SPM
STPM
Diploma
Ijazah/ degree
Lain-lain/others; Sila nyatakan/ Please specify
A4. Adakah anda melanggan perkhidmatan jalur lebar? (Maxis, Celcom, Digi, P1
Wimax,Streamyx) Do you subscribe any broadband or wireless services? (Maxis, Celcom,
Digi, P1 Wimax,Streamyx)
Ya/ Yes Tidak/ No
SPPBS: Technology Acceptance among School Teachers in Kedah, Penang and
Perlis
Section A: Maklumat Peribadi dan Kerja /
Personal and Work Information
76
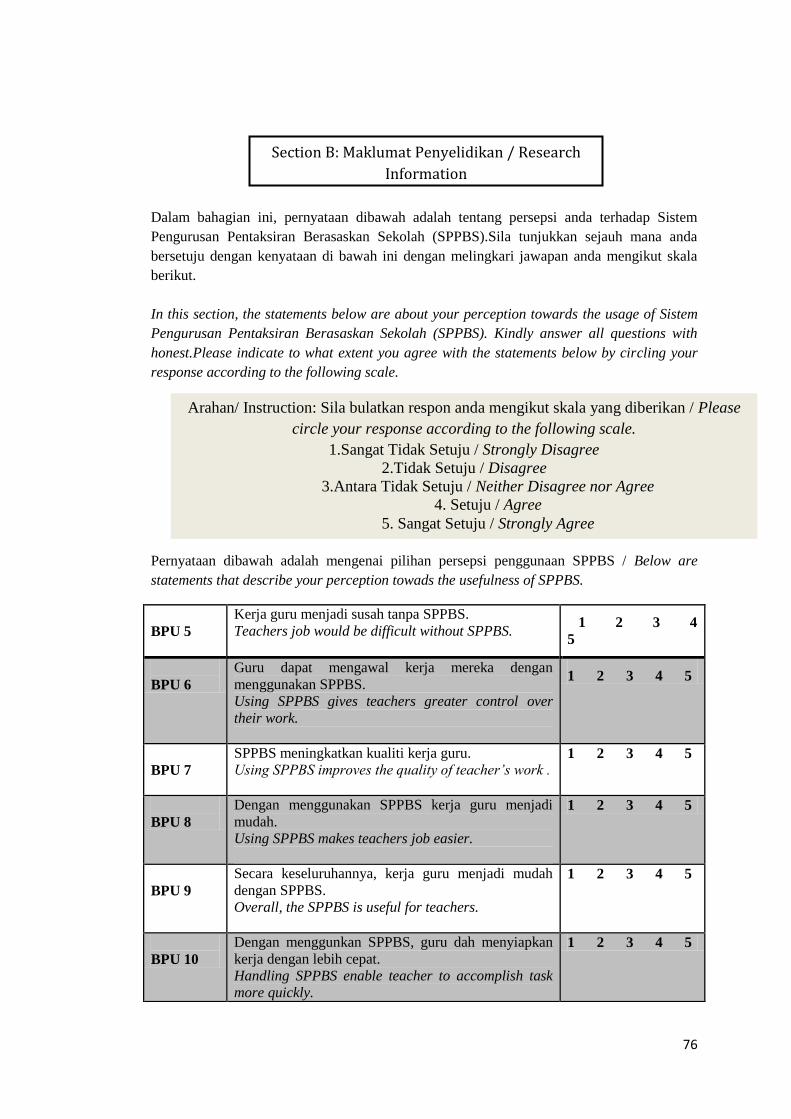
Dalam bahagian ini, pernyataan dibawah adalah tentang persepsi anda terhadap Sistem
Pengurusan Pentaksiran Berasaskan Sekolah (SPPBS).Sila tunjukkan sejauh mana anda
bersetuju dengan kenyataan di bawah ini dengan melingkari jawapan anda mengikut skala
berikut.
In this section, the statements below are about your perception towards the usage of Sistem
Pengurusan Pentaksiran Berasaskan Sekolah (SPPBS). Kindly answer all questions with
honest.Please indicate to what extent you agree with the statements below by circling your
response according to the following scale.
Pernyataan dibawah adalah mengenai pilihan persepsi penggunaan SPPBS / Below are
statements that describe your perception towads the usefulness of SPPBS.
BPU 5
Kerja guru menjadi susah tanpa SPPBS.
Teachers job would be difficult without SPPBS.
1 2 3 4
5
BPU 6
Guru dapat mengawal kerja mereka dengan
menggunakan SPPBS.
Using SPPBS gives teachers greater control over
their work.
1 2 3 4 5
BPU 7
SPPBS meningkatkan kualiti kerja guru.
Using SPPBS improves the quality of teacher’s work .
1 2 3 4 5
BPU 8
Dengan menggunakan SPPBS kerja guru menjadi
mudah.
Using SPPBS makes teachers job easier.
1 2 3 4 5
BPU 9
Secara keseluruhannya, kerja guru menjadi mudah
dengan SPPBS.
Overall, the SPPBS is useful for teachers.
1 2 3 4 5
BPU 10
Dengan menggunkan SPPBS, guru dah menyiapkan
kerja dengan lebih cepat.
Handling SPPBS enable teacher to accomplish task
more quickly.
1 2 3 4 5
Section B: Maklumat Penyelidikan / Research
Information
Arahan/ Instruction: Sila bulatkan respon anda mengikut skala yang diberikan / Please
circle your response according to the following scale.
1.Sangat Tidak Setuju / Strongly Disagree
2.Tidak Setuju / Disagree
3.Antara Tidak Setuju / Neither Disagree nor Agree
4. Setuju / Agree
5. Sangat Setuju / Strongly Agree

77
Dalam bahagian ini, pernyataan dibawah adalah tentang persepsi mudah terhadap Sistem
Pengurusan Pentaksiran Berasaskan Sekolah (SPPBS).Sila tunjukkan sejauh mana anda
bersetuju dengan kenyataan di bawah ini dengan melingkari jawapan anda mengikut skala
berikut.
In this section, the statements below are about your perception of ease towards Sistem
Pengurusan Pentaksiran Berasaskan Sekolah (SPPBS). Kindly answer all questions with
honest.Please indicate to what extent you agree with the statements below by circling your
response according to the following scale.
BPE 11
Kesalahan biasa tidak kerap berlaku apabila
menggunakan SPPBS.
Frequent errors are not common when using SPPBS.
1 2 3 4
5
BPE 12
Saya jarang memerlukan pertolongn bil menggunkan
SPPBS.
I rarely need help when using SPPBS.
1 2 3 4 5
BPU 13
Ia adalah mudah untuk menggunakan SPPBS untuk
melakukan apa yang saya perlu ia lakukan.
It is easy to use SPPBS to do what I need them to do.
1 2 3 4 5
BPU 14
Senang untuk mahir dalam SPPBS.
It is easy to become skillful in using SPPBS.
1 2 3 4 5
BPU 15
Belajar menggunakan/ mengoperasikan SPPBS
adalah senang.
Learning to operate SPPBS is easy.
1 2 3 4 5
BPU 16
Keputusan SPBBS adalah jelas.
The results of using SPPBS are apparent.
1 2 3 4 5
BPU 17
SPPBS senang digunakan.
SPPBS is easy to use.
1 2 3 4 5
Arahan/ Instruction: Sila bulatkan respon anda mengikut skala yang diberikan / Please circle your
response according to the following scale.
1.Sangat Tidak Setuju / Strongly Disagree 2.Tidak Setuju / Disagree
3.Antara Tidak Setuju / Neither Disagree nor Agree 4. Setuju / Agree
5. Sangat Setuju / Strongly Agree

78
Dalam bahagian ini, pernyataan dibawah adalah tentang tahap kebergantungan anda
terhadap Sistem Pengurusan Pentaksiran Berasaskan Sekolah (SPPBS). Sila tunjukkan
sejauh mana anda bersetuju dengan kenyataan di bawah ini dengan melingkari jawapan anda
mengikut skala berikut.
In this section, the statements below are about your dependability towards Sistem
Pengurusan Pentaksiran Berasaskan Sekolah (SPPBS). Kindly answer all questions with
honest.Please indicate to what extent you agree with the statements below by circling your
response according to the following
BD 18
Apabila guru mempunyai masalah, SPPBS akan
membantu guru-guru menyelesaikannya.
When teachers have problems, SPPBS will help
teachers solving it.
1 2 3 4
5
BD 19
SPPBS menyediakan perkhidmatan yang baik untuk
pengguna kali pertama.
SPPBS provides the good service for the first time
users.
1 2 3 4
5
BD 20
SPPBS menyediakan perkhidmatan mereka untuk
guru-guru pada mengikut masa yang telah dijanjikan/
dinyatakan.
SPPBS provides their service for teachers at the time it
promises to do so.
1 2 3 4
5
BD 21
Guru percaya, SPPBS adalah dipercayai dan bebas
masalasah dalam pengumpulan data/markah murid.
Teachers believe handling the SPPBS are reliable and
trouble free for data collection.
1 2 3 4
5
BD 22
Guru boleh bergantung dengan SPPBS terutama dalam
pengumpulan data/ markah.
Teachers believe SPPBS is dependable systems for that
data collection.
1 2 3 4
5
BD 23
Guru percaya, SPPBS boleh menyediakan koleksi data
yang tepat untuk sistem pendidikan pada bila-bila
masa.
Teachers believe handling computer is available for
education systems to use for accurate data collection
at any times.
1 2 3 4
5
Arahan/ Instruction: Sila bulatkan respon anda mengikut skala yang diberikan / Please circle your
response according to the following scale.
1.Sangat Tidak Setuju / Strongly Disagree 2.Tidak Setuju / Disagree
3.Antara Tidak Setuju / Neither Disagree nor Agree 4. Setuju / Agree
5. Sangat Setuju / Strongly Agree

79
BAU 24- Pengetahuan saya tentang SPPBS / My knowledge about SPPBS
(1) Tidak pernah mendengar tentangnya. /Never heard of it.
(2) Saya tahu hanya sedikit tentang SPPBS./ I know little about it.
(3) Saya Cuma ada sedikit pengetahuan tentang SPPBS./ I have some basic ideas about
it.
(4) Saya tahu tentang SPPBS. / I know it quite well.
(5) Saya memang tahu tentang SPPBS. / I know it very well.
BAU 25 – My frequency of using SPPBS / Kekerapan menggunakan SPPBS.
(1) Kurang dari sekali / Less than once.
(2) 2-5 kali / 2-5 times.
(3) 6-10 kali / 6-10 times.
(4) 11- 15 kali / 11-15 times.
(5) Lebih dari 15 kali / More than 15 times.
BAU 26 – My experience of using SPPBS is. / Pengalaman menggunakan SPPBS.
(1) Tiada pengalaman / No experience at all.
(2) Sangat sedikit pengalaman / I have a little experience.
(3) Sedikit pengalaman / I have some experience.
(4) Pengalaman yang sederhana / I have considerable experience.
(5) Banyak pengalaman / I have a lot of experience.
80
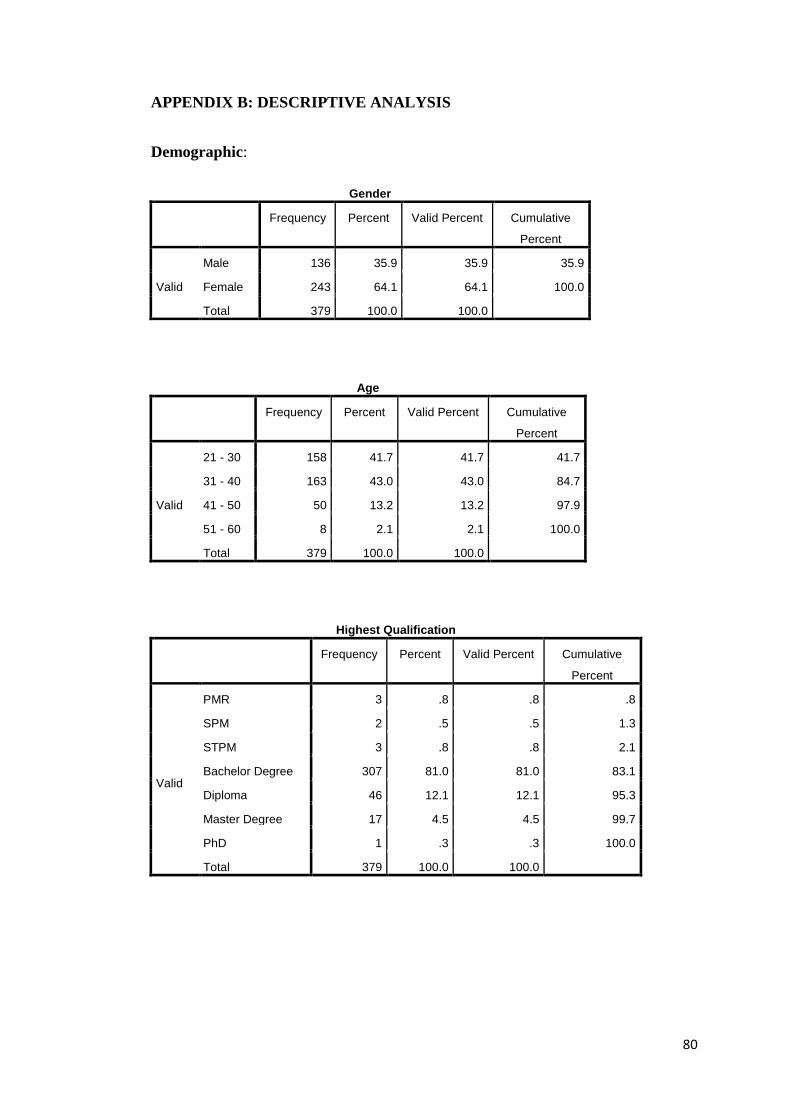
APPENDIX B: DESCRIPTIVE ANALYSIS
Demographic:
Gender
Frequency Percent Valid Percent Cumulative
Percent
Valid
Male 136 35.9 35.9 35.9
Female 243 64.1 64.1 100.0
Total 379 100.0 100.0
Age
Frequency Percent Valid Percent Cumulative
Percent
Valid
21 - 30 158 41.7 41.7 41.7
31 - 40 163 43.0 43.0 84.7
41 - 50 50 13.2 13.2 97.9
51 - 60 8 2.1 2.1 100.0
Total 379 100.0 100.0
Highest Qualification
Frequency Percent Valid Percent Cumulative
Percent
Valid
PMR 3 .8 .8 .8
SPM 2 .5 .5 1.3
STPM 3 .8 .8 2.1
Bachelor Degree 307 81.0 81.0 83.1
Diploma 46 12.1 12.1 95.3
Master Degree 17 4.5 4.5 99.7
PhD 1 .3 .3 100.0
Total 379 100.0 100.0

81
Broadband or Wireless Subcriber
Frequency Percent Valid Percent Cumulative
Percent
Valid
Yes 352 92.9 92.9 92.9
No 27 7.1 7.1 100.0
Total 379 100.0 100.0
Variable Items:
Perceive of Usefulness
Statistics
Teacher's
job would
be difficult
without
SPPBS
Using
SPPBS
gives
teachers
greater
control over
their work
Using
SPPBS
improves
the quality
of teacher’s
work
Using
SPPBS
makes
teachers job
easier
Overall, the
SPPBS is
useful for
teachers
Handling
SPPBS
enable
teacher to
accomplish
task more
quickly
N
Valid 379 379 379 379 379 379
Missin
g 0 0 0 0 0 0
Mean 1.50 1.58 1.56 1.44 1.45 1.36
Std. Deviation 1.009 .929 .948 .872 .878 .815

82
Perceive of Ease of Use
Statistics
Frequent
errors are
not
common
when
using
SPPBS
I rarely
need help
when
using
SPPBS
It is easy
to use
SPPBS to
do what I
need them
to do
It is easy
to become
skillful in
using
SPPBS
Learning
to operate
SPPBS is
easy
The
results of
using
SPPBS
are
apparent
SPPBS is
easy to
use
N
Valid 379 379 379 379 379 379 379
Missi
ng 0 0 0 0 0 0 0
Mean 1.73 2.22 1.65 2.42 2.31 1.85 1.73
Std.
Deviation .989 1.319 .994 1.333 1.301 1.157 1.092
Perceive of Dependability
Statistics
When
teachers
have
problems,
SPPBS will
help
teachers
solving it
SPPBS
provides
the good
service for
the first
time users
SPPBS
provides
their service
for teachers
at the time
it promises
to do so
Teachers
believe
handling
the SPPBS
are reliable
and trouble
free for data
collection
Teachers
believe
SPPBS is
dependable
systems for
that data
collection
Teachers
believe
handling
computer is
available
for
education
systems to
use for
accurate
data
collection at
any times
N
Valid 379 379 379 379 379 379
Missin
g 0 0 0 0 0 0
Mean 1.48 1.51 1.38 1.47 1.56 1.56
Std.
Deviation .892 .895 .775 .895 .939 .939

83
SPPBS Adoption
Statistics
Knowledge
about SPPBS
Frequency of
using SPPBS
Experience of
using SPPBS
N Valid 379 379 379
Missing 0 0 0
Mean 4.18 4.01 4.11
Std. Deviation .897 1.274 1.061
Variables:
Descriptive Statistics
N Mean Std. Deviation
Perceive of Usefulness 379 1.4802 .77918
Perceive of Ease of Use 379 1.9872 .91506
Perceive of Dependability 379 1.4943 .75790
SPPBS Adoption 379 4.0976 .92240
Valid N (listwise) 379
84
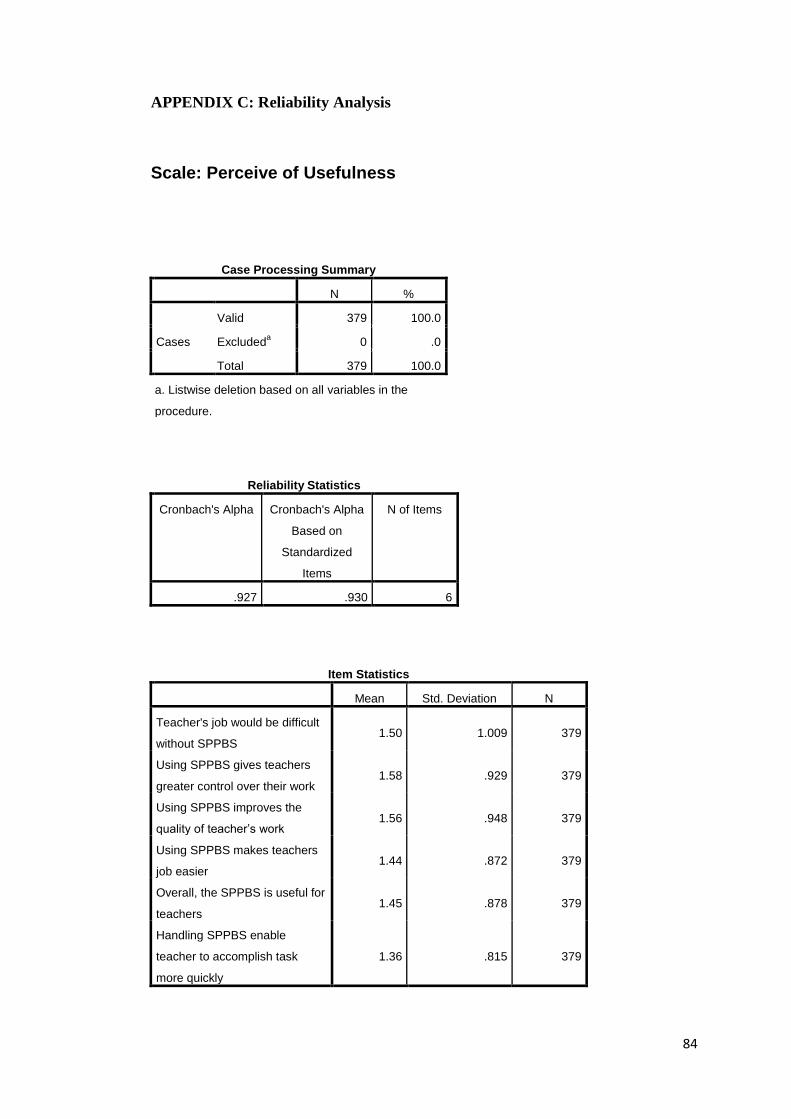
APPENDIX C: Reliability Analysis
Scale: Perceive of Usefulness
Case Processing Summary
N %
Cases
Valid 379 100.0
Excludeda 0 .0
Total 379 100.0
a. Listwise deletion based on all variables in the
procedure.
Reliability Statistics
Cronbach's Alpha Cronbach's Alpha
Based on
Standardized
Items
N of Items
.927 .930 6
Item Statistics
Mean Std. Deviation N
Teacher's job would be difficult
without SPPBS 1.50 1.009 379
Using SPPBS gives teachers
greater control over their work 1.58 .929 379
Using SPPBS improves the
quality of teacher’s work 1.56 .948 379
Using SPPBS makes teachers
job easier 1.44 .872 379
Overall, the SPPBS is useful for
teachers 1.45 .878 379
Handling SPPBS enable
teacher to accomplish task
more quickly
1.36 .815 379

85
Inter-Item Correlation Matrix
Teacher's
job would
be difficult
without
SPPBS
Using
SPPBS
gives
teachers
greater
control over
their work
Using
SPPBS
improves
the quality
of teacher’s
work
Using
SPPBS
makes
teachers job
easier
Overall, the
SPPBS is
useful for
teachers
Handling
SPPBS
enable
teacher to
accomplish
task more
quickly
Teacher's job would
be difficult without
SPPBS
1.000 .534 .601 .550 .547 .567
Using SPPBS gives
teachers greater
control over their
work
.534 1.000 .727 .702 .678 .664
Using SPPBS
improves the quality
of teacher’s work
.601 .727 1.000 .782 .775 .722
Using SPPBS makes
teachers job easier .550 .702 .782 1.000 .833 .801
Overall, the SPPBS
is useful for teachers .547 .678 .775 .833 1.000 .850
Handling SPPBS
enable teacher to
accomplish task
more quickly
.567 .664 .722 .801 .850 1.000
Item-Total Statistics
Scale Mean if
Item Deleted
Scale
Variance if
Item Deleted
Corrected
Item-Total
Correlation
Squared
Multiple
Correlation
Cronbach's
Alpha if Item
Deleted
Teacher's job would be
difficult without SPPBS 7.38 15.818 .626 .406 .937
Using SPPBS gives
teachers greater control
over their work
7.30 15.461 .757 .590 .918
Using SPPBS improves
the quality of teacher’s
work
7.32 14.828 .840 .719 .906
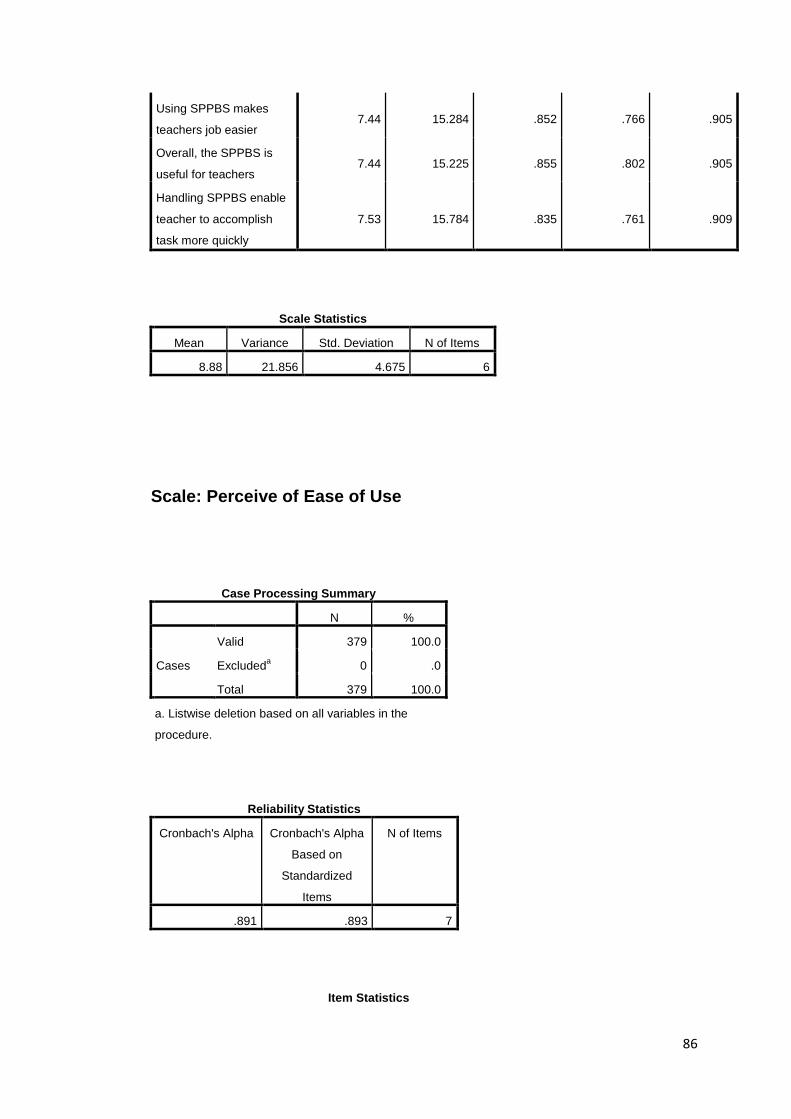
86
Using SPPBS makes
teachers job easier 7.44 15.284 .852 .766 .905
Overall, the SPPBS is
useful for teachers 7.44 15.225 .855 .802 .905
Handling SPPBS enable
teacher to accomplish
task more quickly
7.53 15.784 .835 .761 .909
Scale Statistics
Mean Variance Std. Deviation N of Items
8.88 21.856 4.675 6
Scale: Perceive of Ease of Use
Case Processing Summary
N %
Cases
Valid 379 100.0
Excludeda 0 .0
Total 379 100.0
a. Listwise deletion based on all variables in the
procedure.
Reliability Statistics
Cronbach's Alpha Cronbach's Alpha
Based on
Standardized
Items
N of Items
.891 .893 7
Item Statistics

87
Mean Std. Deviation N
Frequent errors are not
common when using SPPBS 1.73 .989 379
I rarely need help when using
SPPBS 2.22 1.319 379
It is easy to use SPPBS to do
what I need them to do 1.65 .994 379
It is easy to become skillful in
using SPPBS 2.42 1.333 379
Learning to operate SPPBS is
easy 2.31 1.301 379
The results of using SPPBS are
apparent 1.85 1.157 379
SPPBS is easy to use 1.73 1.092 379
Inter-Item Correlation Matrix
Frequent
errors are
not
common
when
using
SPPBS
I rarely
need help
when
using
SPPBS
It is easy
to use
SPPBS to
do what I
need them
to do
It is easy
to become
skillful in
using
SPPBS
Learning
to operate
SPPBS is
easy
The
results of
using
SPPBS
are
apparent
SPPBS is
easy to
use
Frequent errors
are not common
when using
SPPBS
1.000 .507 .581 .458 .417 .463 .511
I rarely need help
when using
SPPBS
.507 1.000 .553 .614 .550 .421 .518
It is easy to use
SPPBS to do what
I need them to do
.581 .553 1.000 .518 .438 .566 .671
It is easy to
become skillful in
using SPPBS
.458 .614 .518 1.000 .757 .555 .567
Learning to
operate SPPBS is
easy
.417 .550 .438 .757 1.000 .569 .563
88
The results of
using SPPBS are
apparent
.463 .421 .566 .555 .569 1.000 .620
SPPBS is easy to
use .511 .518 .671 .567 .563 .620 1.000
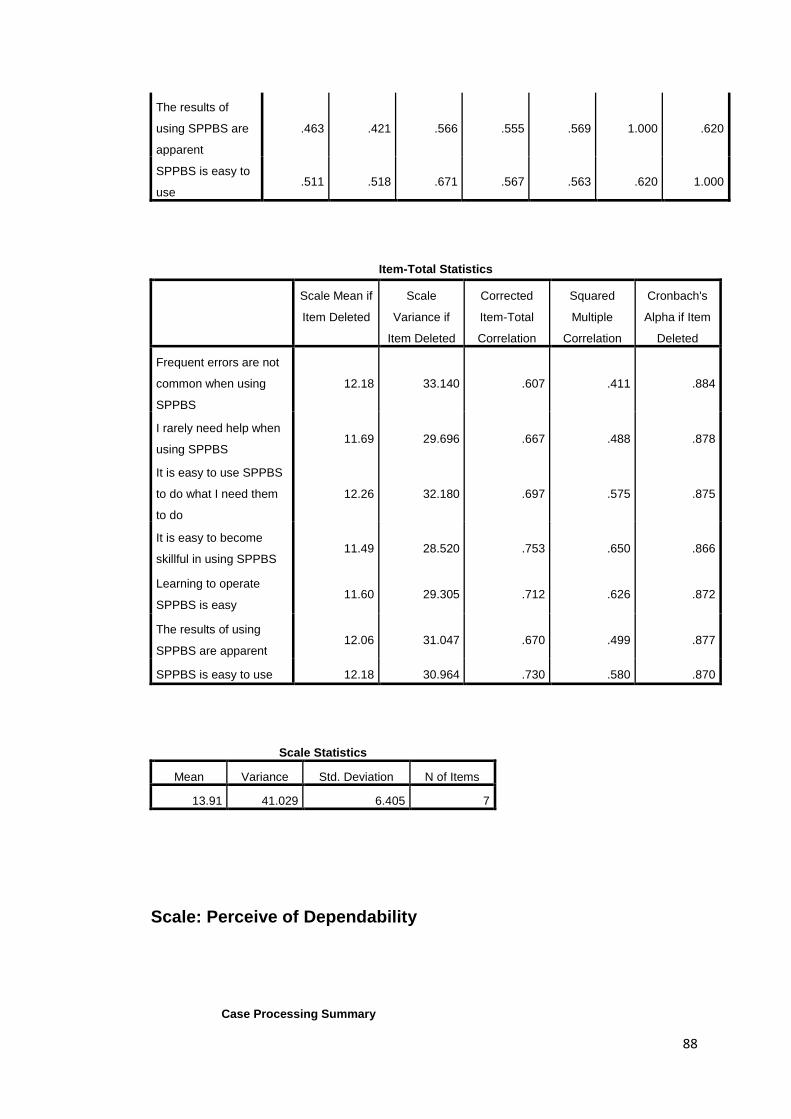
Item-Total Statistics
Scale Mean if
Item Deleted
Scale
Variance if
Item Deleted
Corrected
Item-Total
Correlation
Squared
Multiple
Correlation
Cronbach's
Alpha if Item
Deleted
Frequent errors are not
common when using
SPPBS
12.18 33.140 .607 .411 .884
I rarely need help when
using SPPBS 11.69 29.696 .667 .488 .878
It is easy to use SPPBS
to do what I need them
to do
12.26 32.180 .697 .575 .875
It is easy to become
skillful in using SPPBS 11.49 28.520 .753 .650 .866
Learning to operate
SPPBS is easy 11.60 29.305 .712 .626 .872
The results of using
SPPBS are apparent 12.06 31.047 .670 .499 .877
SPPBS is easy to use 12.18 30.964 .730 .580 .870
Scale Statistics
Mean Variance Std. Deviation N of Items
13.91 41.029 6.405 7
Scale: Perceive of Dependability
Case Processing Summary

89
N %
Cases
Valid 379 100.0
Excludeda 0 .0
Total 379 100.0
a. Listwise deletion based on all variables in the
procedure.
Reliability Statistics
Cronbach's Alpha Cronbach's Alpha
Based on
Standardized
Items
N of Items
.924 .924 6
Item Statistics
Mean Std. Deviation N
When teachers have problems,
SPPBS will help teachers
solving it
1.48 .892 379
SPPBS provides the good
service for the first time users 1.51 .895 379
SPPBS provides their service
for teachers at the time it
promises to do so
1.38 .775 379
Teachers believe handling the
SPPBS are reliable and trouble
free for data collection
1.47 .895 379
Teachers believe SPPBS is
dependable systems for that
data collection
1.56 .939 379
Teachers believe handling
computer is available for
education systems to use for
accurate data collection at any
times
1.56 .939 379
Inter-Item Correlation Matrix

90
When
teachers
have
problems,
SPPBS will
help
teachers
solving it
SPPBS
provides
the good
service for
the first
time users
SPPBS
provides
their
service for
teachers at
the time it
promises to
do so
Teachers
believe
handling
the SPPBS
are reliable
and trouble
free for
data
collection
Teachers
believe
SPPBS is
dependable
systems for
that data
collection
Teachers
believe
handling
computer is
available
for
education
systems to
use for
accurate
data
collection at
any times
When teachers have
problems, SPPBS
will help teachers
solving it
1.000 .601 .658 .642 .613 .618
SPPBS provides the
good service for the
first time users
.601 1.000 .732 .580 .652 .659
SPPBS provides
their service for
teachers at the time
it promises to do so
.658 .732 1.000 .670 .682 .654
Teachers believe
handling the SPPBS
are reliable and
trouble free for data
collection
.642 .580 .670 1.000 .732 .730
Teachers believe
SPPBS is
dependable systems
for that data
collection
.613 .652 .682 .732 1.000 .843
Teachers believe
handling computer is
available for
education systems
to use for accurate
data collection at
any times
.618 .659 .654 .730 .843 1.000

91
Item-Total Statistics
Scale Mean if
Item Deleted
Scale
Variance if
Item Deleted
Corrected
Item-Total
Correlation
Squared
Multiple
Correlation
Cronbach's
Alpha if Item
Deleted
When teachers have
problems, SPPBS will
help teachers solving it
7.48 14.928 .719 .532 .918
SPPBS provides the
good service for the first
time users
7.45 14.772 .742 .603 .915
SPPBS provides their
service for teachers at
the time it promises to
do so
7.59 15.280 .792 .660 .910
Teachers believe
handling the SPPBS
are reliable and trouble
free for data collection
7.49 14.542 .782 .637 .910
Teachers believe
SPPBS is dependable
systems for that data
collection
7.40 13.966 .831 .755 .903
Teachers believe
handling computer is
available for education
systems to use for
accurate data collection
at any times
7.41 13.988 .827 .753 .903
Scale Statistics
Mean Variance Std. Deviation N of Items
8.97 20.679 4.547 6
92
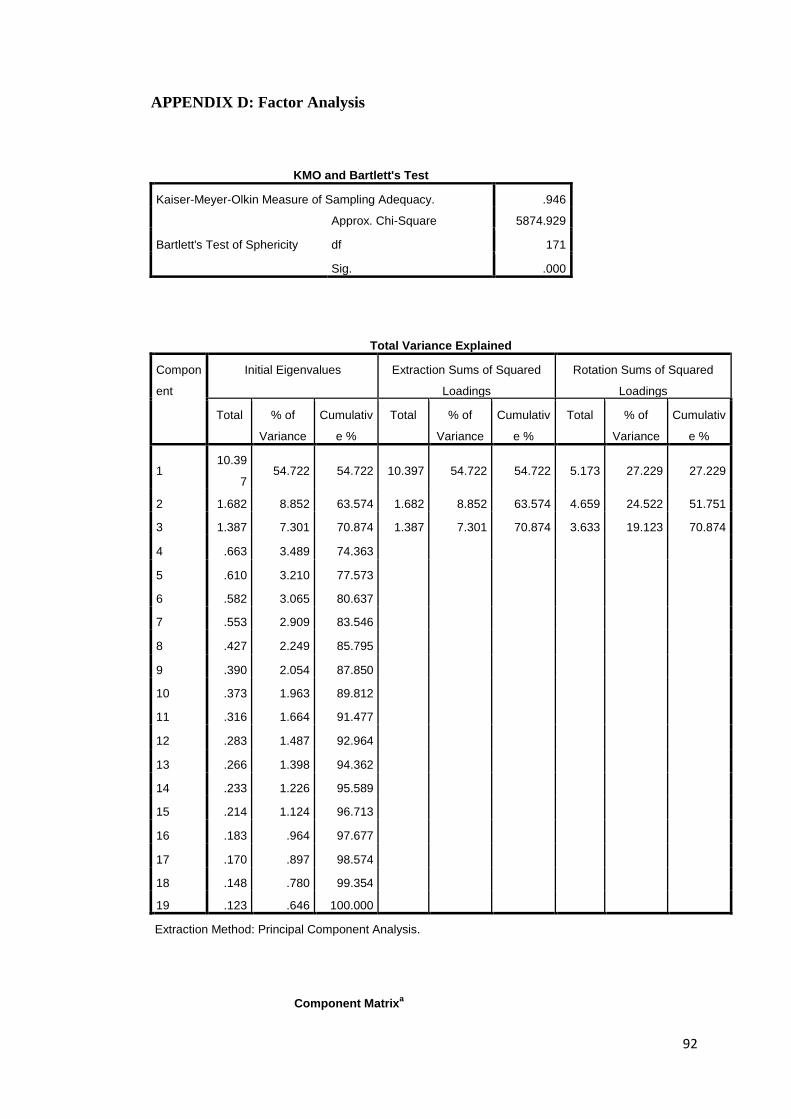
APPENDIX D: Factor Analysis
KMO and Bartlett's Test
Kaiser-Meyer-Olkin Measure of Sampling Adequacy. .946
Bartlett's Test of Sphericity
Approx. Chi-Square 5874.929
df 171
Sig. .000
Total Variance Explained
Compon
ent
Initial Eigenvalues Extraction Sums of Squared
Loadings
Rotation Sums of Squared
Loadings
Total % of
Variance
Cumulativ
e %
Total % of
Variance
Cumulativ
e %
Total % of
Variance
Cumulativ
e %
1 10.39
7 54.722 54.722 10.397 54.722 54.722 5.173 27.229 27.229
2 1.682 8.852 63.574 1.682 8.852 63.574 4.659 24.522 51.751
3 1.387 7.301 70.874 1.387 7.301 70.874 3.633 19.123 70.874
4 .663 3.489 74.363
5 .610 3.210 77.573
6 .582 3.065 80.637
7 .553 2.909 83.546
8 .427 2.249 85.795
9 .390 2.054 87.850
10 .373 1.963 89.812
11 .316 1.664 91.477
12 .283 1.487 92.964
13 .266 1.398 94.362
14 .233 1.226 95.589
15 .214 1.124 96.713
16 .183 .964 97.677
17 .170 .897 98.574
18 .148 .780 99.354
19 .123 .646 100.000
Extraction Method: Principal Component Analysis.
Component Matrixa

93
Component
1 2 3
Using SPPBS makes teachers
job easier .833 -.331 .137
Using SPPBS improves the
quality of teacher’s work .816 -.327
Overall, the SPPBS is useful
for teachers .809 -.383 .151
Handling SPPBS enable
teacher to accomplish task
more quickly
.797 -.385 .147
Teachers believe SPPBS is
dependable systems for that
data collection
.792 .125 -.404
Teachers believe handling
computer is available for
education systems to use for
accurate data collection at any
times
.792 -.397
It is easy to use SPPBS to do
what I need them to do .774 .184
SPPBS is easy to use .766 .186 .168
When teachers have problems,
SPPBS will help teachers
solving it
.753 -.258
Teachers believe handling the
SPPBS are reliable and trouble
free for data collection
.751 .103 -.399
SPPBS provides their service
for teachers at the time it
promises to do so
.749 -.420
SPPBS provides the good
service for the first time users .742 .128 -.304
Using SPPBS gives teachers
greater control over their work .739 -.273 .222
Frequent errors are not
common when using SPPBS .716 .207
The results of using SPPBS
are apparent .705 .375
It is easy to become skillful in
using SPPBS .638 .508 .357
I rarely need help when using
SPPBS .630 .333 .326

94
Learning to operate SPPBS is
easy .594 .579 .286
Teacher's job would be difficult
without SPPBS .590 -.400 .158
Extraction Method: Principal Component Analysis.
a. 3 components extracted.
Rotated Component Matrixa
Component
1 2 3
Overall, the SPPBS is useful
for teachers .831 .310 .194
Handling SPPBS enable
teacher to accomplish task
more quickly
.823 .306 .185
Using SPPBS makes teachers
job easier .806 .344 .236
Using SPPBS improves the
quality of teacher’s work .778 .365 .210
Using SPPBS gives teachers
greater control over their work .737 .230 .274
Teacher's job would be difficult
without SPPBS .706 .171
Frequent errors are not
common when using SPPBS .543 .266 .436
It is easy to use SPPBS to do
what I need them to do .530 .328 .496
Teachers believe SPPBS is
dependable systems for that
data collection
.275 .812 .266
Teachers believe handling
computer is available for
education systems to use for
accurate data collection at any
times
.297 .803 .249
Teachers believe handling the
SPPBS are reliable and trouble
free for data collection
.265 .781 .233
SPPBS provides their service
for teachers at the time it
promises to do so
.332 .779 .142

95
SPPBS provides the good
service for the first time users .277 .704 .294
When teachers have problems,
SPPBS will help teachers
solving it
.429 .647 .189
It is easy to become skillful in
using SPPBS .186 .181 .851
Learning to operate SPPBS is
easy .221 .845
I rarely need help when using
SPPBS .289 .174 .708
SPPBS is easy to use .420 .358 .587
The results of using SPPBS
are apparent .170 .531 .575
Extraction Method: Principal Component Analysis.
Rotation Method: Varimax with Kaiser Normalization.
a. Rotation converged in 6 iterations.
Component Transformation Matrix
Component 1 2 3
1 .636 .602 .482
2 -.684 .152 .713
3 .356 -.784 .508
Extraction Method: Principal Component Analysis.
Rotation Method: Varimax with Kaiser Normalization.
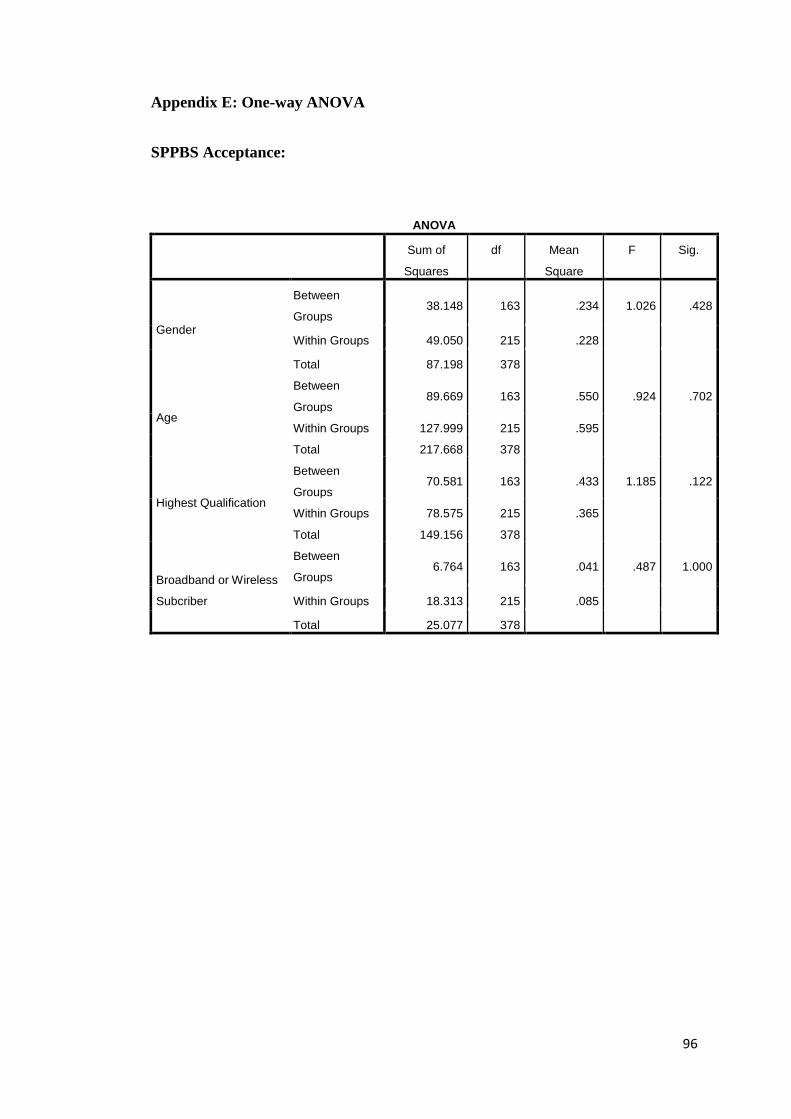
96
Appendix E: One-way ANOVA
SPPBS Acceptance:
ANOVA
Sum of
Squares
df Mean
Square
F Sig.
Gender
Between
Groups 38.148 163 .234 1.026 .428
Within Groups 49.050 215 .228
Total 87.198 378
Age
Between
Groups 89.669 163 .550 .924 .702
Within Groups 127.999 215 .595
Total 217.668 378
Highest Qualification
Between
Groups 70.581 163 .433 1.185 .122
Within Groups 78.575 215 .365
Total 149.156 378
Broadband or Wireless
Subcriber
Between
Groups 6.764 163 .041 .487 1.000
Within Groups 18.313 215 .085
Total 25.077 378

97
SPPBS Adoption:
ANOVA
Sum of
Squares
df Mean
Square
F Sig.
Gender
Between
Groups 5.489 12 .457 2.049 .020
Within Groups 81.709 366 .223
Total 87.198 378
Age
Between
Groups 5.942 12 .495 .856 .593
Within Groups 211.726 366 .578
Total 217.668 378
Highest Qualification
Between
Groups 5.337 12 .445 1.132 .333
Within Groups 143.818 366 .393
Total 149.156 378
Broadband or Wireless
Subcriber
Between
Groups .551 12 .046 .685 .766
Within Groups 24.525 366 .067
Total 25.077 378

98
Appendix F: Correlations
Correlations
Perceive of
Usefulness
SPPBS
Adoption
Perceive of Usefulness
Pearson Correlation 1 -.132**
Sig. (2-tailed) .010
N 379 379
SPPBS Adoption
Pearson Correlation -.132** 1
Sig. (2-tailed) .010
N 379 379
**. Correlation is significant at the 0.01 level (2-tailed).
Correlations
SPPBS
Adoption
Perceive of
Ease of Use
SPPBS Adoption
Pearson Correlation 1 .089
Sig. (2-tailed) .084
N 379 379
Perceive of Ease of Use
Pearson Correlation .089 1
Sig. (2-tailed) .084
N 379 379
Correlations
SPPBS
Adoption
Perceive of
Dependability
SPPBS Adoption
Pearson Correlation 1 -.142**
Sig. (2-tailed) .006
N 379 379
Perceive of Dependability
Pearson Correlation -.142** 1
Sig. (2-tailed) .006
N 379 379
**. Correlation is significant at the 0.01 level (2-tailed).

99
Appendix G: Multiple Regressions
Descriptive Statistics
Mean Std. Deviation N
SPPBS Adoption 4.0976 .92240 379
Perceive of Usefulness 1.4802 .77918 379
Perceive of Ease of Use 1.9872 .91506 379
Perceive of Dependability 1.4943 .75790 379
Correlations
SPPBS
Adoption
Perceive of
Usefulness
Perceive of
Ease of Use
Perceive of
Dependabilit
y
Pearson
Correlation
SPPBS Adoption 1.000 -.132 .089 -.142
Perceive of
Usefulness -.132 1.000 .653 .686
Perceive of Ease of
Use .089 .653 1.000 .691
Perceive of
Dependability -.142 .686 .691 1.000
Sig. (1-tailed)
SPPBS Adoption . .005 .042 .003
Perceive of
Usefulness .005 . .000 .000
Perceive of Ease of
Use .042 .000 . .000
Perceive of
Dependability .003 .000 .000 .
N
SPPBS Adoption 379 379 379 379
Perceive of
Usefulness 379 379 379 379
Perceive of Ease of
Use 379 379 379 379
Perceive of
Dependability 379 379 379 379
Variables Entered/Removeda

100
Model Variables
Entered
Variables
Removed
Method
1
Perceive of
Dependability,
Perceive of
Usefulness,
Perceive of Ease
of Useb
. Enter
a. Dependent Variable: SPPBS Adoption
b. All requested variables entered.
Model Summaryb
Mo
del
R R
Squar
e
Adjusted
R
Square
Std.
Error of
the
Estimate
Change Statistics Durbin-
Watson R
Square
Change
F
Chan
ge
df1 df2 Sig. F
Change
1 .328a .108 .101 .87478 .108
15.09
0 3 375 .000 1.821
a. Predictors: (Constant), Perceive of Dependability, Perceive of Usefulness, Perceive of Ease of
Use
b. Dependent Variable: SPPBS Adoption
ANOVAa
Model Sum of
Squares
df Mean Square F Sig.
1
Regression 34.643 3 11.548 15.090 .000b
Residual 286.967 375 .765
Total 321.610 378
a. Dependent Variable: SPPBS Adoption
b. Predictors: (Constant), Perceive of Dependability, Perceive of Usefulness, Perceive of
Ease of Use
Coefficientsa
Model Unstandardized
Coefficients
Standardized
Coefficients
t Sig.
B Std. Error Beta

101
1
(Constant) 4.141 .113 36.685 .000
Perceive of Usefulness -.251 .084 -.212 -2.974 .003
Perceive of Ease of Use .433 .072 .430 5.989 .000
Perceive of
Dependability -.356 .091 -.293 -3.920 .000
a. Dependent Variable: SPPBS Adoption
Residuals Statisticsa
Minimum Maximum Mean Std. Deviation N
Predicted Value 3.1564 5.5188 4.0976 .30273 379
Residual -2.96672 1.73034 .00000 .87131 379
Std. Predicted Value -3.109 4.694 .000 1.000 379
Std. Residual -3.391 1.978 .000 .996 379
a. Dependent Variable: SPPBS Adoption