ancient genomics and the peopling of the southwest pacific · department of life sciences,...
TRANSCRIPT

Ancient Genomics and the Peopling of the Southwest Pacific
Pontus Skoglund1,2,3, Cosimo Posth4,5, Kendra Sirak6,7, Matthew Spriggs8,9, Frederique Valentin10, Stuart Bedford9,11, Geoffrey Clark11, Christian Reepmeyer12, Fiona Petchey13, Daniel Fernandes6,14, Qiaomei Fu1,15,16, Eadaoin Harney1,2, Mark Lipson1, Swapan Mallick1,2, Mario Novak6,17, Nadin Rohland1, Kristin Stewardson1,2,18, Syafiq Abdullah19, Murray P. Cox20, Françoise R. Friedlaender21, Jonathan S. Friedlaender22, Toomas Kivisild23,24, George Koki25, Pradiptajati Kusuma26, D. Andrew Merriwether27, Francois-X. Ricaut28, Joseph T. S. Wee29, Nick Patterson2, Johannes Krause5, Ron Pinhasi6,*, and David Reich1,2,18,*
1Department of Genetics, Harvard Medical School, Boston, Massachusetts 02115, USA 2Broad Institute of MIT and Harvard, Cambridge, Massachusetts 02142, USA 3Archaeological Research Laboratory, Department of Archaeology and Classical Studies, Stockholm University, 10691 Stockholm, Sweden 4Institute for Archaeological Sciences, Archaeo- and Palaeogenetics, University of Tübingen, Tübingen 72070, Germany 5Max Planck Institute for the Science of Human History, 07745 Jena, Germany 6School of Archaeology and Earth Institute, Belfield, University College Dublin, Dublin, Ireland 7Department of Anthropology, Emory University, Atlanta, Georgia 30322, USA 8School of Archaeology and Anthropology, College of Arts and Social Sciences, The Australian National University, Canberra, ACT 2601, Australia 9Vanuatu National Museum, Vanuatu Cultural Centre, Port Vila Vanuatu 10Maison de l’Archéologie et de l’Ethnologie, CNRS, UMR 7041, 92023 Nanterre, France 11Department of Archaeology and Natural History. College of Asia and the Pacific, The Australian National University, Canberra, ACT 2601, Australia 12College of Arts, Society and Education, James Cook University, QLD 4870, Australia 13Radiocarbon Dating Laboratory, University of Waikato, Hamilton, New Zealand 14CIAS,
Users may view, print, copy, and download text and data-mine the content in such documents, for the purposes of academic research, subject always to the full Conditions of use: http://www.nature.com/authors/editorial_policies/license.html#termsReprints and permissions information is available at www.nature.com/reprints.
Correspondence and requests for materials should be addressed to P.S. ([email protected]) or R.P. ([email protected]) or D.R. ([email protected]).*Co-senior authors
The authors declare no competing financial interests. Readers are welcome to comment on the online version of the paper
Supplementary Information is available in the online version of the paper.
Author contributions J.K., R.P. and D.R. supervised the study. M.S., F.V., S.B., G.A.C., and C.R. assembled archaeological material and information. P.S., C.P., Q.F., M.L., S.M., N.R. and D.R. analyzed genetic data. C.P., K.Si., F.P., D.F., E.H., N.R, and K.St. performed laboratory work. S.A., M.P.C., F.R.F., J.S.F., T.K., G.K., P.K., D.A.M., F-X.R., and T.S.W. assembled the sample collection from present-day populations. P.S. and D.R. wrote the manuscript with major input from C.P., M.S., F.V., G.A.C., M.P.C., J.S.F, J.K., R.P. and additional input from all other co-authors.
The aligned sequences are available through the European Nucleotide Archive under accession number PRJEB14728. The newly reported SNP genotyping data for the subset of individuals who provided informed consent consistent with fully public distribution are available at (http://genetics.med.harvard.edu/reichlab/Reich_Lab/Datasets.html). To access data for the remaining samples, researchers should send a signed letter to D.R. containing the following text: “(a) I will not distribute the data outside my collaboration; (b) I will not post the data publicly; (c) I will make no attempt to connect the genetic data to personal identifiers for the samples; (d) I will use the data only for studies of population history; (e) I will not use the data for any selection studies; (f) I will not use the data for medical or disease-related analyses; (g) I will not use the data for commercial purposes.” Extended Data Table 2 specifies which samples are consistent with which type of data distribution
HHS Public AccessAuthor manuscriptNature. Author manuscript; available in PMC 2017 July 18.
Published in final edited form as:Nature. 2016 October 27; 538(7626): 510–513. doi:10.1038/nature19844.
Author M
anuscriptA
uthor Manuscript
Author M
anuscriptA
uthor Manuscript

Department of Life Sciences, University of Coimbra, 3000-456 Coimbra, Portugal 15Key Laboratory of Vertebrate Evolution and Human Origins of Chinese Academy of Sciences, IVPP, CAS, Beijing 100044, China 16Department of Evolutionary Genetics, Max Planck Institute for Evolutionary Anthropology, Leipzig 04103, Germany 17Institute for Anthropological Research, 10000 Zagreb, Croatia 18Howard Hughes Medical Institute, Harvard Medical School, Boston, Massachusetts 02115, USA 19RIPAS Hospital, Bandar Seri Begawan, Brunei Darussalam 20Institute of Fundamental Sciences, Massey University, Palmerston North, 4442, New Zealand 21Independent Scientist, Sharon, Connecticut 22Department of Anthropology, Temple University, Gladfelter Hall, 1115 West Berks Street, Philadelphia, PA 19122, USA 23Estonian Biocentre, Evolutionary Biology group, Tartu, 51010, Estonia 24Division of Biological Anthropology, University of Cambridge, Fitzwilliam Street, Cambridge, UK 25Papua New Guinea Institute of Medical Research, Goroka, Papua New Guinea 26Eijkman Institute for Molecular Biology, Jakarta 10430, Indonesia 27Department of Anthropology, Binghamton University, Binghamton, NY, USA 28Evolutionary Medicine Group, Laboratoire d’Anthropologie Moléculaire et Imagerie de Synthèse UMR 5288 CNRS, Université de Toulouse, Toulouse 31073, France 29National Cancer Centre Singapore, Singapore 169610, Singapore
Abstract
The appearance of people associated with the Lapita culture in the South Pacific ~3,000 years ago1
marked the beginning of the last major human dispersal to unpopulated lands. However, the
relationship of these pioneers to the long established Papuans of the New Guinea region is unclear.
We report genome-wide ancient DNA data from four individuals from Vanuatu (~3100-2700 years
before present) and Tonga (~2700-2300 years before present), and co-analyze them with 778
present-day East Asians and Oceanians. Today, indigenous peoples of the South Pacific harbor a
mixture of ancestry from Papuans and a population of East Asian origin that does not exist in
unmixed form today, but is a match to the ancient individuals. Most analyses have interpreted the
minimum of twenty-five percent Papuan ancestry in the region today as evidence that the first
humans to reach Remote Oceania, including Polynesia, were derived from population mixtures
near New Guinea, prior to the further expansion into Remote Oceania2–5. However, our finding
that the ancient individuals had little to no Papuan ancestry implies later human population
movements that spread Papuan ancestry through the South Pacific after the islands’ first peopling.
Pacific islanders today derive from a mixture of two highly divergent ancestral populations3.
One arrived in island southeast Asia more than 40,000 years before present (BP), and
contributed to the ancestry of both indigenous Australians and Papuans, and hence to other
Pacific islanders4. The second ancestral population is more closely related to mainland East
Asians4, and is not found in unadmixed form today. The first humans to reach Remote
Oceania—a term we use to refer to the region unoccupied prior to ~3,000 BP beyond the
main Solomon Islands and in this case excluding Micronesia—were associated with the
Lapita culture that spans 3,450-3,250 to 2,700-2,500 BP. These people spread into Remote
Oceania using the first boats capable of long-distance sea travel, introduced new
domesticated animals and plants, and their successors reached the most isolated islands of
the eastern and southern Pacific by 1,000-700 BP6. Several hypotheses have been proposed
Skoglund et al. Page 2
Nature. Author manuscript; available in PMC 2017 July 18.
Author M
anuscriptA
uthor Manuscript
Author M
anuscriptA
uthor Manuscript

to explain why present-day indigenous people of Near Oceania (New Guinea, the Bismarck
Islands, and the Solomon Islands area) and Remote Oceania have ancestry both from
Papuans and from populations of ultimate East Asian origin. In one set of models that has
been favored by recent genetic studies3–5,7, the mixture occurred >3,000 BP during the
expansion of populations of East Asian origin through the New Guinea region8. In the other
set of models, the population of ultimate East Asian origin initially mixed little with
Papuans9 and it is later gene exchanges that account for the ubiquitous Papuan ancestry
today2,10.
We obtained genome-wide ancient DNA data from three individuals from the Teouma site
on Efate island, Vanuatu (Supplementary Information section 1), all directly radiocarbon
dated to between 3110-2740 BP overlapping the Lapita period (Extended Data Table 1). We
also obtained genome-wide ancient DNA data from an individual from the Talasiu site on
Tongatapu island, Tonga, directly radiocarbon dated to 2680-2340, a period spanning the late
Lapita and immediately post-Lapita period (Supplementary Information section 2; Extended
Data Table 1). In dedicated clean rooms, we prepared powder from petrous bones11,
extracted DNA12, and prepared up to four double-stranded libraries from each extract13. We
enriched the libraries for 1.24 million targeted single nucleotide polymorphisms (SNPs)14,
sequenced the products, and restricted to a single randomly drawn sequence for each SNP.
This procedure resulted in 139,461–231,944 SNPs covered at least once in each of the
individuals. The low ratio of sequences aligning to Y chromosome targets compared to
targets on other chromosomes15 reveals that all four individuals are females (Extended Data
Table 1). We obtained three mitochondrial DNA sequences (all from the Vanuatu site) and
all were haplogroup B4a1a1a, the classic “Polynesian motif.”16
Multiple features of the data suggest authentic and minimally contaminated DNA. First, in
all individuals, ~40% of all sites that are cytosines in the human reference sequence appear
as thymines in the terminal nucleotide, as expected for genuine ancient DNA (Extended
Data Figure 1A). Second, when we carried out Principal Component Analysis (PCA)
(Figure 1) of 778 present-day people from 83 East Asian and Oceanian populations
genotyped at 621,799 SNPs (Extended Data Table 2), and projected the ancient individuals,
we found that all clustered tightly with each other and with data from the same individuals
restricting to sequences with cytosine-to-thymine changes at the terminal nucleotide (these
sequences are unlikely to be contaminants17,18) (Extended Data Figure 1B). Third, the
cluster of ancient individuals does not overlap with present-day populations, indicating that
the data are from a population that is not present in unmixed form today (Figure 1). The
distinctiveness of the ancient individuals is also highlighted by their high differentiation
from all present-day groups (0.05<FST<0.26 between all modern individuals and the ancient
Vanuatu individuals) (Extended Data Table 3).
The ancient Vanuatu and Tongan individuals are not shifted in the PCA in the direction of
Papuan ancestry, in contrast to all present-day Remote Oceanians. In this respect, they are
similar to indigenous Taiwanese such as Ami and Atayal as well as to populations from the
Philippines such as the Kankanaey that have no detectable Papuan ancestry (Figure 1). To
test if the ancient individuals have any evidence of Papuan ancestry, we used qpWave/qpAdm to analyze allele frequency correlation statistics19. The ancient individuals and the
Skoglund et al. Page 3
Nature. Author manuscript; available in PMC 2017 July 18.
Author M
anuscriptA
uthor Manuscript
Author M
anuscriptA
uthor Manuscript

Taiwanese Ami are consistent with descending from a common ancestral population to the
exclusion of 14 worldwide outgroups (P ≫ 0.05 for the ancient individuals from both
Vanuatu and Tonga). We estimate the possible range of Papuan ancestry in the Vanuatu
individuals to be 0–11% and in the Tongan individual to be 0–17% (99% confidence
intervals truncated at zero), significantly lower than the >25% Papuan ancestry in all
present-day Oceanians (Figure 2A). To test the hypothesis that the ancient Remote Oceanian
individuals might be from the source population of the non-Papuan ancestry in Oceanians
today, we computed the statistic f4(Africa, Test; Australian, Polynesian), which evaluates the
degree of allele sharing of a candidate Test population with Polynesians (at sites where
Polynesians differ from Australians), and found that it is maximized when
Test=Lapita_Vanuatu or Test=Lapita_Tonga (Extended Data Figure 2B), as expected if
Lapita were the true source. We conclude that the non-Papuan ancestry that is ubiquitous in
Oceania is derived from a population related to the ancient individuals we analyzed, and that
this ancestry reached uninhabited islands in Remote Oceania with little or possibly no
mixture with Papuans. We call the population of which both the ancient Vanuatu and Tongan
individuals were a part the ‘First Remote Oceanians’, and find that the ancestry fraction
from this population is the single most important factor shaping genetic variation among
Pacific islanders, accounting for most variation in measurements including genetic diversity
(Pearson’s R=0.86, P=2×10⁻¹² for 42 non-Polynesian groups) (Extended Data Figure 2) and
proportion of archaic Denisovan ancestry (R=−0.96, P < 10−16 for all 56 Oceanian groups)
(Figure 2).
Our evidence that early and geographically diverse Remote Oceanian individuals had little if
any Papuan ancestry contradicts models that suggest significant Papuan contributions to
Lapita people prior to their dispersal into Remote Oceania3–5. Instead, our results show that
the Papuan genetic signature only appeared in many Remote Oceanian populations
subsequent to initial settlement. To gain further insight into when the Papuan ancestry may
have become ubiquitous in Remote Oceanians, we leveraged the fact that chromosome
segments from ancestral populations break up at a known rate due to recombination, and that
the inverse of the length of the segments translates to a date of mixture20. We estimate dates
of ~50–80 generations ago using ALDER21,, or 1,500–2,300 BP assuming 28.1 years
(Methods) per generation22 (Figure 2D; Extended Data Figure 3). We combined the
statistical error of the genetic estimate and the uncertainty about the generation interval, and
obtained a 95% confidence interval of 1239–1927 BP for a pool of Polynesians all of whom
have similar Papuan ancestry proportions (Methods). This finding that Papuan-First Remote
Oceanian mixture continued long after the Lapita period implies that the Polynesian
ancestral population was not fully formed at that time, although we caution that alternative
methods for dating Papuan mixture in Remote Oceanians arrived at older dates4,23–25.
However, our ALDER dates are supported by direct ancient DNA evidence, as the Tongan
individual at 2680-2340 BP carried little or no Papuan ancestry, providing unambiguous
confirmation that the ancestral population of Polynesians was not fully formed by the end of
the Lapita period.
We used qpGraph to explore models of population separation and mixture that might
accommodate the ancient DNA data26 (Supplementary Information section 3). We obtain fits
Skoglund et al. Page 4
Nature. Author manuscript; available in PMC 2017 July 18.
Author M
anuscriptA
uthor Manuscript
Author M
anuscriptA
uthor Manuscript

using models in which Polynesians today are mixtures of First Remote Oceanians and a
Papuan population related to Highland New Guineans (Figure 3A). We also obtained
consistent findings using TreeMix27 (Extended Data Figure 4). In Figure 3 we show the best
fitting model, which suggests that the ancient individuals from Vanuatu and Tonga descend
from an ancestral (presumably Lapita) population that separated earlier from the population
that is the primary component in present-day Polynesians. This implies that not just Papuan
ancestry but also deeply branching First Remote Oceanian ancestry was introduced to
Remote Oceania through later movement of people. Thus, the minimum 25% Papuan
ancestry seen in present-day Remote Oceanians is a conservative underestimate of the later
population displacement. It is unlikely that there was 100% replacement, however, since we
observe weak excess affinity of present-day Tongans to Lapita_Tonga in symmetry tests
(Methods). More deeply in time, our modeling indicates that Philippine populations
(Kankaney) are the closest outgroup to the First Remote Oceanians, indigenous Taiwanese
(Atayal) second closest, and mainland southeast Asians such as Dai most remote, consistent
with models of population movement along a route from Taiwan to the Philippines to Near
Oceania to Remote Oceania28. We were surprised that we could not fit Australians as
outgroups to New Guinean Highlanders and the Papuan ancestry in Polynesians (Extended
Data Figure 5). However, we could fit Australians as deriving from a mixture of an ancient
Australian lineage and a Papuan lineage from the same group that expanded into Polynesia.
This is plausible if there was continuing gene flow between New Guinea and Australia.
Another parsimonious model is that the ancestry in present-day Polynesians is not all
Papuan, but a Papuan-Australian mix.
Previous studies of mitochondrial DNA and Y chromosomes suggested that present-day
people of the South Pacific harbor more East Asian ancestry from female than from male
ancestors3. Our genome-wide analyses confirm a significant excess of First Remote
Oceanian ancestry on the X-chromosome compared to the autosomes (Z-scores up to 10)
(Figure 2B). Females carry 2/3 of X chromosomes in a population but only 1/2 of the
autosomes (Extended Data Figure 6), and we compared the ancestry estimates in these two
parts of the genome to obtain the most accurate estimates of sex-biased admixture in diverse
Oceanians to date (Extended Data Figure 6; Extended Data Table 4). It has been suggested
that matrilocal social structure in the primarily First Remote Oceanian ancestry populations
of the region is one likely factor explaining these patterns29,30. However, it is also possible
that some of these patterns reflect a scenario in which the later movement of Papuan
ancestry into Remote Oceania was largely mediated by males who then mixed with resident
females.
Our study has documented that many of the first humans in Remote Oceania had little, if
any, Papuan ancestry, a stark contrast to the situation today. While our findings cannot rule
out the possibility that multiple groups—some of which carried substantial amounts of
Papuan ancestry—settled Remote Oceania early on, the lack of such ancestry both in
Vanuatu and Tonga can be more parsimoniously explained by later population movements
bringing the Papuan ancestry. The scenario emerging from ancient DNA analysis is thus
radically different from that suggested by previous genetic studies, which have generally
posited that the first people in Remote Oceania and Polynesia2–5 had substantial Papuan
Skoglund et al. Page 5
Nature. Author manuscript; available in PMC 2017 July 18.
Author M
anuscriptA
uthor Manuscript
Author M
anuscriptA
uthor Manuscript

ancestry. Our finding of major post-Lapita movements of Papuan ancestry into Remote
Oceania also cannot be related to the later arrival of Papuan ancestry that has been suggested
for Fiji, which is estimated to have occurred at least a millennium later at 500 BP4 or 1,100
BP24 (Figure 2). Systematic study of ancient DNA from throughout Remove Oceania should
make it possible to provide a detailed chronicle of the population movements and sex-biased
population mixtures that shaped the ancestry of present-day Oceanians.
Online Content Methods, along with any additional Extended Data display items and
Source Data, are available in the online version of the paper; references unique to these
sections appear only in the online paper.
METHODS
Ancient DNA sampling, extraction, library preparation, enrichment and sequencing
The Vanuatu skeletal samples B30A, B10B, B17 were analyzed with permission from the
Vanuatu National Museum and the excavators of the Teouma site. The Tonga skeletal sample
SK10 was analyzed with permission from the excavators of the Talasiu site.
All preparation of skeletal samples, DNA extraction, and library preparation was carried out
in dedicated ancient DNA laboratories at University College Dublin, Ireland (sample
preparation of the three Lapita_Vanuatu individuals), at Harvard Medical School in Boston,
USA (DNA extraction and library preparation of the three Lapita_Vanuatu individuals), and
at the Max Planck Institute for the Science of Human History in Jena, Germany (sample
preparation, DNA extraction and library preparation of the the Lapita_Tonga individual).
Each of these facilities is spatially separated from other molecular biology laboratories, and
measures are taken to protect ancient individuals from contamination including HEPA
filtered air, head-to-toe suits, face masks with visors, multiple layers of gloves, bleaching of
all surfaces, ultraviolet light (UVC) decontamination of (non-sensitive) consumables and
chemicals, and UVC decontamination of the facility when researchers are not in the room31.
The final step of the library preparation (amplification) was performed outside the ancient
DNA lab.
We prepared powder from the cochlea of petrous bones, extracted DNA12, and prepared
libraries with standard protocols (ref. 13 for the Lapita_Vanuatu individuals and ref 32 for the
Lapita_Tonga individual). For the three Lapita_Vanuatu individuals, the first library was
prepared in the presence of uracil DNA glycosylase (UDG) to cut out errors due to ancient
DNA damage, whereas the remaining three libraries as well as the Lapita_Tonga library
were prepared without UDG as this preserves more DNA for any given sample. We
performed in-solution enrichment using previously reported protocols13,14,33,34 for a
targeted set of 1,237,207 SNPs that comprises two previously separately reported sets of
394,577 SNPs34 (390k capture), and 842,630 SNPs14. We sequenced the product on an
Illumina NextSeq500 instrument for 2×75cycles. Following demultiplexing, and, for the
Lapita_Vanuatu samples removal of both oligonucleotide barcodes that were used to identify
the libraries and trailing adapter sequences, we merged the forward and reverse reads of each
read pair requiring a 15 base pair overlap (allowing one mismatch). We then aligned merged
sequences to the human genome hg19 using BWA 0.6.135. We removed sequences aligned to
Skoglund et al. Page 6
Nature. Author manuscript; available in PMC 2017 July 18.
Author M
anuscriptA
uthor Manuscript
Author M
anuscriptA
uthor Manuscript

identical outer coordinates, choosing the highest quality sequence for each duplication
cluster. We merged the data from the four libraries for each Lapita_Vanuatu individual.
Genomic analysis
We determined sex by comparing the number of X and Y chromosome alignments15. We
estimated damage patterns using PMDtools v0.5918, separating damage patterns observed
inside and outside a CpG context. Since all four individuals were female, we could not
estimate contamination using X-chromosome data. We investigated whether there was
evidence of excess relatedness between any pair of individuals among the Lapita_Vanuatu
individuals, but found that the pairwise mismatch rate using panel 5 of the Affymetrix
Human Origins array (see below) was 19.8%±0.4% for I1368/I1369, 19.7%±0.6% for
I1368/I1370, and 20.5%±0.4% for I1369/I1370. This suggests no atypical pair of individuals
and a similar within-population mismatch rate as some present-day Polynesian populations
(Figure 2).
Genotyping of present-day humans
We genotyped 356 individuals from 38 southeast Asian and Oceanian populations on the
Affymetrix Human Origins array (Extended Data Table 2). The individuals all contributed
DNA samples voluntarily and provided informed consent consistent with studies of human
genetic variation and history. Ethical approval of the component studies was provided by the
Singapore Health IRB, the Research Ethics Committee at the Facultés de Médecine de
Toulouse, the Brunei Medical and Health Research Ethics Committee, the University of
Cambridge Biology Research Ethics Committee, the Government of Papua New Guinea
Medical Research Advisory Committee, and the Temple University IRB. The collection of
genome-wide variation data on de-identified samples was approved by the Harvard Human
Research Protection Program (Protocol 11681), re-reviewed on 12 July 2016.
We restricted analysis to samples that had >95% genotyping completeness and that were not
visual outliers in PCA with respect to the main cluster of samples in the group. We merged
with previously reported Affymetrix Human Origins SNP array data26,36–39. We also co-
analyzed our data with samples genotyped on the Affymetrix 6.0 platform where we
removed three previously published39 Rapa Nui individuals (5s5j, XB3B, and 3p3p), and
two previously published40 Samoan individuals (PLY_07 and PLY_11), that all appeared to
have recent European ancestry based on clustering analyses. We finally compared our data to
high-coverage genomes from an archaic Neanderthal and an archaic Denisovan, both from
Denisova Cave in the Altai Mountains of Siberia41–43.
Population genetic analysis
When overlapping with the Affymetrix Human Origins SNP array data set of present-day
human populations, we have between 74,000–126,000 SNPs covered at least once for each
of the four individuals (Extended Data Table 1). This is more than the minimum coverage
required for high resolution analysis using allele frequency correlation statistics, which is
10,000 SNPs per individual according to Supplementary Information section 6.2 of ref. 44, a
study that had the same median coverage (0.19x) as ours (the range in the present study is
0.14–0.26x). For all analyses, we called genotypes by randomly sampling a single non-
Skoglund et al. Page 7
Nature. Author manuscript; available in PMC 2017 July 18.
Author M
anuscriptA
uthor Manuscript
Author M
anuscriptA
uthor Manuscript

duplicate sequence read at each position45. This procedure is standard for analysis of low-
coverage ancient DNA data and is also often used for higher-coverage data to minimize
reference genome biases that can be introduced when determining diploid
genotypes14,17,34,36,41,44–50. For the qpAdm, qpWave and qpGraph analyses we excluded
transition SNPs to avoid biases from postmortem damage (see below).
We performed PCA using smartpca51, with the option inbreed: YES in order to sample a
single genotype from each individual randomly to match the pseudo-haploid nature of the
ancient DNA genotypes from the ancient individuals52. We computed f3-, f4-, D-statistics,
and FST as in ref. 26, randomly sampling a single haploid chromosome for each individual,
using popstats38. We estimated the date of admixture using ALDER21. We tested the
consistency of a matrix of f4-statistics with one or more sources of ancestry with respect to a
set of outgroups (New_Guinea, Denisova, Sardinian, English, Yakut, Chukchi, Mala,
Japanese, Ju_hoan_North, Mixe, Onge, Yoruba, and Mbuti) using qpWave19.
For the ancient individuals and all present-day populations genotyped on the Human Origins
array, we used qpAdm34, which estimates ancestry proportions from two or more proxy
source populations assuming that the proxies are more closely related to the real source
populations than they are to a set of outgroups (qpAdm also provides a formal statistical test
for whether this is the case, which passes in the context that we use it here). We estimated
First Remote Oceanian and Papuan ancestry using Denisova, Sardinian, English, Yakut,
Chukchi, Mala, Japanese, Ju_hoan_North, Mixe, Onge, Yoruba, and Mbuti as outgroups and
New_Guinea and Ami as proxies for the source populations. For the ancient individuals, we
excluded all transition SNPs to avoid possible biases due to postmortem damage, resulting in
35,194 transversion SNPs for Lapita_Vanuatu and 22,030 for Lapita_Tonga. For estimating
ancestry proportions in the Affymetrix 6.0 Polynesian data, we used whole-genome
sequences from the same populations as outgroups53. We estimated Denisovan ancestry
using the Denisovan genome and Japanese as the two sources, and chimpanzee,
Ju_hoan_North, Mbuti, Yoruba, Dinka and the Altai Neanderthal genome as outgroups.
We computed conditional heterozygosity using panel 5 of the Affymetrix Human Origins
array, which contains SNPs ascertained as heterozygous in a single West African Yoruba
individual. This provides an unbiased estimate of relative heterozygosity since the Yoruba
individual is approximately symmetrically related to all Oceanians (Denisovan ancestry
violates this assumption but should not change the ranking of populations). We estimated
heterozygosity as the average pairwise mismatch rate when sampling 2 chromosomes from 2
different individuals using popstats38, restricting to transversion SNPs for all populations.
For authentication, we used PMDtools18 to extract sequences with clear evidence of
postmortem damage patterns (PMD score of at least 3), disregarding individual bases with
phred-scaled base quality < 30. We randomly sampled new haploid genotypes from the
resulting set of sequences and projected the ancient individuals on the principal components
inferred from the present-day populations as above. After this filtering, we retained 68,450
SNPs for I1368; 98,722 SNPs for I1369; 83,024 SNPs for I1370; and 117,023 SNPs for
CP30. Ninety-nine percent confidence intervals for qpAdm estimates of Papuan ancestry
Skoglund et al. Page 8
Nature. Author manuscript; available in PMC 2017 July 18.
Author M
anuscriptA
uthor Manuscript
Author M
anuscriptA
uthor Manuscript

(see above) using the PMD score-restricted data was 0–21% for Lapita_Vanuatu and 0–24%
for Lapita_Tonga, consistent with the confidence intervals obtained from the full data.
To test whether the Lapita_Vanuatu and the Lapita_Tonga form a clade, we used qpWave to
test a model of Dai, Ami, Kankanaey and a fourth population were consistent with being
outgroups to the two ancient sample groups (we used Dai, Ami and Kankanaey as these span
present-day Mainland East Asia, Taiwan, and the Philippines, and lack Papuan ancestry to
the limits of our resolution). The analysis used the ~12,000 SNPs that remained after
excluding transition SNPs and SNPs missing in one of the two ancient sample groups. We
found that the model was consistent with the data for all tested Oceanian and Asian
populations shown in Figure 1, but that the lowest P-value was observed for present-day
Tongans (P = 0.09). We also found that f4(Ami, Tongan; Lapita_Vanuatu, Lapita_Tonga) =
0.006, Z=3.2, when using all SNPs. This documents an affinity between present-day
Tongans and Lapita_Tonga, consistent with the hypothesis that the ancient population of
Tonga with little Papuan ancestry may have contributed some of the ancestry of present-day
Tongans.
Admixture date estimation
To estimate the date of historical admixture between First Remote Oceanians and Papuans,
we used ALDER21,25 on the full Human Origins array data, with New Guinean Highlanders
and Han Chinese as the two sources. We use Han Chinese for this analysis due to their
substantial sample size compared to populations more closely related to the ancestral First
Remote Oceanian population such as the ancient individuals we analyzed, indigenous
Taiwanese, and indigenous Philippine groups. ALDER estimates are robust even when using
an imperfect surrogate for the ancestral populations26. We estimate an admixture date for a
pool of Polynesian populations by combining data from Tongans, Tikopia, Russell and
Bellona, all genotyped on the Affymetrix Human Origins SNP array.
ALDER and other methods based on admixture linkage disequilibrium estimate dates in
units of generations, which need to be converted to years. For this purpose we require an
estimate of the generation interval—the average age of a parent at the time their gametes
were formed—weighted by the fraction of recombination events that occur in each sex
(62.3% of all autosomal crossovers are estimated to occur in females based on Table 1 of
ref. 54). Using estimates from the anthropological literature, this quantity is 27.8 years for
hunter-gathering societies, 28.6 years for developed nation states, and 29.6 years for less
developed nation states22. These numbers are in the range of the point estimate we use of
28.1 years based on breakdown of admixture linkage disequilibrium in radiocarbon-dated
ancient genomes55 (Methods). To account for the substantial variability in generation
intervals across human societies, we use the sample standard error of 2.15 years measured
across eleven diverse hunter-gatherer groups based on Table 4 of ref. 22. The date estimates
in Figure 2 and Extended Data Figure 4 thus use a generation interval of 28.1 years, and
combine the standard error from ALDER (a) with the uncertainty in generation time, that is,
, where A is the ALDER point estimate in number of
generations.
Skoglund et al. Page 9
Nature. Author manuscript; available in PMC 2017 July 18.
Author M
anuscriptA
uthor Manuscript
Author M
anuscriptA
uthor Manuscript

We do not subtract 66 years from the dates produced by ALDER to obtain BP dates
(conventionally the date before 1950 CE, 66 years ago), because what ALDER is estimating
is a number that is close to the BP date. To see this, note that ALDER estimates the date
between when chromosomes of the two ancestries began crossing over (one generation after
mixing began), and the date of the last cross-over (when the germ cells that mixed to
produce the present-day samples in our study were formed, likely one or two generations
prior to 2016 CE). Accounting for these corrections means that ALDER is estimating a date
of mixture that is likely to be within a generation of the true BP date.
Fitting models of population history
We used qpGraph26,56 to assess the fit of admixture graph models to allele frequency
correlation patterns as measured by f2, f3-, and f4-statistics. We started with a skeleton
phylogenetic tree consisting of Yoruba, New_Guinea, Dai, Atayal, Kankanaey and
Lapita_Vanuatu. We added Tongan, Mamanwa (a Philippine Negrito group), Nasioi and
Kolombangara, respectively, to all possible edges in the tree, and retained only the graph
solutions that provided no individual f4 statistics with |Z| > 3 between empirical and
predicted statistics. For the extended version of the admixture graph, we also added
Australians to all possible edges of the graph that included these populations. Finally, we
modeled the previously documented admixture history relating Denisovans and the Altai
Neanderthal genome to the outgroup chimpanzee and the anatomically modern human
populations, to which we added the Andamanese Onge and the Lapita_Tonga. The final
graph visualized in Figure 3 used 10,893 SNPs after restricting to transversion SNPs to
avoid complications due to ancient DNA damage and also SNPs with coverage in all groups.
For more information on the admixture graph inference procedure, see Supplementary
Information section 3.
As an alternative inference method, we used Treemix v1.1227 to test models for Yoruba, Dai,
Atayal, Kankanaey, Tongan, New Guinean Highlanders, Lapita_Vanuatu and Lapita_Tonga.
The total number of SNPs after excluding transitions, SNPs with minor allele count of less
than 4 in the selected data, and loci where one population had missing data, was 10,119,
which we divided into 337 blocks of 30 SNPs each to estimate the covariance matrix. We
first fitted a maximum likelihood tree of all populations, but found that several of the fitted
allele frequency covariances deviated from those empirically observed by up to 16.4
standard errors. We then used the automated heuristic optimization in Treemix to infer a
graph model with 1 admixture event using the same populations, and found that the optimal
fit was for a model with an admixture event in the history of Tongans, where one portion of
their ancestry diverged prior to the split of the ancestors of the ancient Vanuatu and Tonga
individuals, and the other (25% ± 3%) derived from the New Guinean lineage. This
maximum deviation between empirical and model covariances observed for the graph with 1
admixture edge was 1.6, indicating good fit, consistent with our investigation of models
using qpGraph.
Female and male ancestral contributions
To estimate the proportion of female ancestors (F) and male ancestors (M) for a given
population, we used two different methods both based on the point estimates of ancestry for
Skoglund et al. Page 10
Nature. Author manuscript; available in PMC 2017 July 18.
Author M
anuscriptA
uthor Manuscript
Author M
anuscriptA
uthor Manuscript

the X-chromosome and autosomes. Both used the same underlying model that the observed
admixture proportion estimates Ĥauto and ĤX for the autosomes and X-chromosome,
respectively, depend on M and F such that:
(1)
(2)
The first approach obtains unbounded point estimates of M and F by rearranging equations:
(3)
(4)
Similarly, we obtained standard errors for M and F using the weighted block jackknife
standard errors for Ĥauto and ĤX, SEauto and SEX, as
(5)
(6)
As an alternative to estimating M and F, we took an approximate Bayesian approach by
performing 1 million simulations where M and F were sampled from a uniform prior
distribution (0, 1). We then simulated ancestry estimates specifying normal distributions
with means and standard errors matching the empirical values (Equations 1–2). We used the
abc R package57 to run a rejection algorithm retaining the 1% of all simulation replicates
with the closest Euclidean distances to the empirical Ĥauto and ĤX, and performed local
linear regression on log-transformed summary statistics to obtain a posterior distribution.
The results of the two methods are qualitatively similar. In Extended Data Figure 6, we plot
the posterior intervals of these distributions for selected populations.
Sample size
No statistical methods were used to predetermine sample size.
Skoglund et al. Page 11
Nature. Author manuscript; available in PMC 2017 July 18.
Author M
anuscriptA
uthor Manuscript
Author M
anuscriptA
uthor Manuscript

Extended Data
Extended Data Figure 1. Ancient DNA authenticitya, Principal component analysis performed as for Figure 1, but with the four ancient
individuals represented only by sequences that show clear evidence of postmortem damage
(PMD score of at least 3) to remove contaminating sequences that might be present17,18. The
numbers of SNPs remaining after restricting to damaged sequences is 68,450 SNPs for
I1368; 98,722 SNPs for I1369; 83,024 SNPs for I1370; and 117,023 SNPs for CP30. The
lines indicate the projection of the samples when no damage-restriction is performed. The
large number of SNPs retained, and the fact that the ancient individuals cluster tightly and
have the same qualitative positioning in the plot as Figure 1, indicates that contamination is
not contributing to our findings. We also find that estimates of Papuan ancestry using PMD
score restricted data is consistent with those obtained using the full data (Methods). b, Postmortem damage patterns for genome-wide in-solution enrichment data from four
ancient individuals.
Skoglund et al. Page 12
Nature. Author manuscript; available in PMC 2017 July 18.
Author M
anuscriptA
uthor Manuscript
Author M
anuscriptA
uthor Manuscript
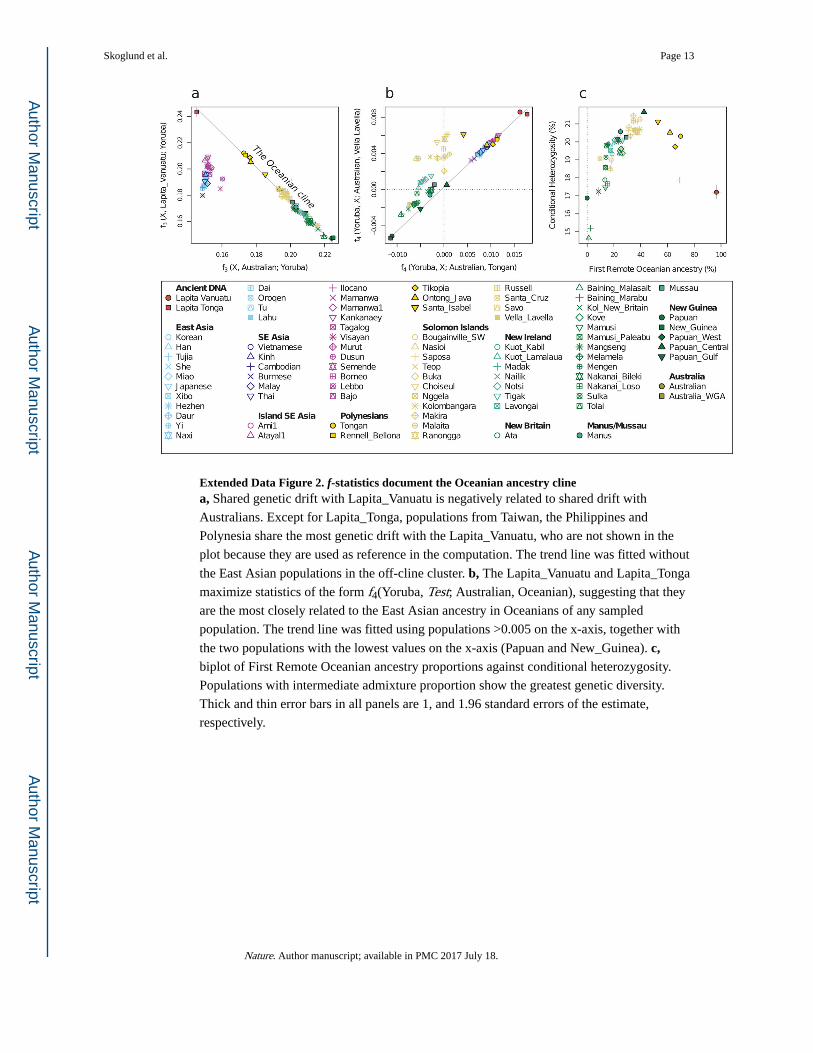
Extended Data Figure 2. f-statistics document the Oceanian ancestry clinea, Shared genetic drift with Lapita_Vanuatu is negatively related to shared drift with
Australians. Except for Lapita_Tonga, populations from Taiwan, the Philippines and
Polynesia share the most genetic drift with the Lapita_Vanuatu, who are not shown in the
plot because they are used as reference in the computation. The trend line was fitted without
the East Asian populations in the off-cline cluster. b, The Lapita_Vanuatu and Lapita_Tonga
maximize statistics of the form f4(Yoruba, Test; Australian, Oceanian), suggesting that they
are the most closely related to the East Asian ancestry in Oceanians of any sampled
population. The trend line was fitted using populations >0.005 on the x-axis, together with
the two populations with the lowest values on the x-axis (Papuan and New_Guinea). c, biplot of First Remote Oceanian ancestry proportions against conditional heterozygosity.
Populations with intermediate admixture proportion show the greatest genetic diversity.
Thick and thin error bars in all panels are 1, and 1.96 standard errors of the estimate,
respectively.
Skoglund et al. Page 13
Nature. Author manuscript; available in PMC 2017 July 18.
Author M
anuscriptA
uthor Manuscript
Author M
anuscriptA
uthor Manuscript
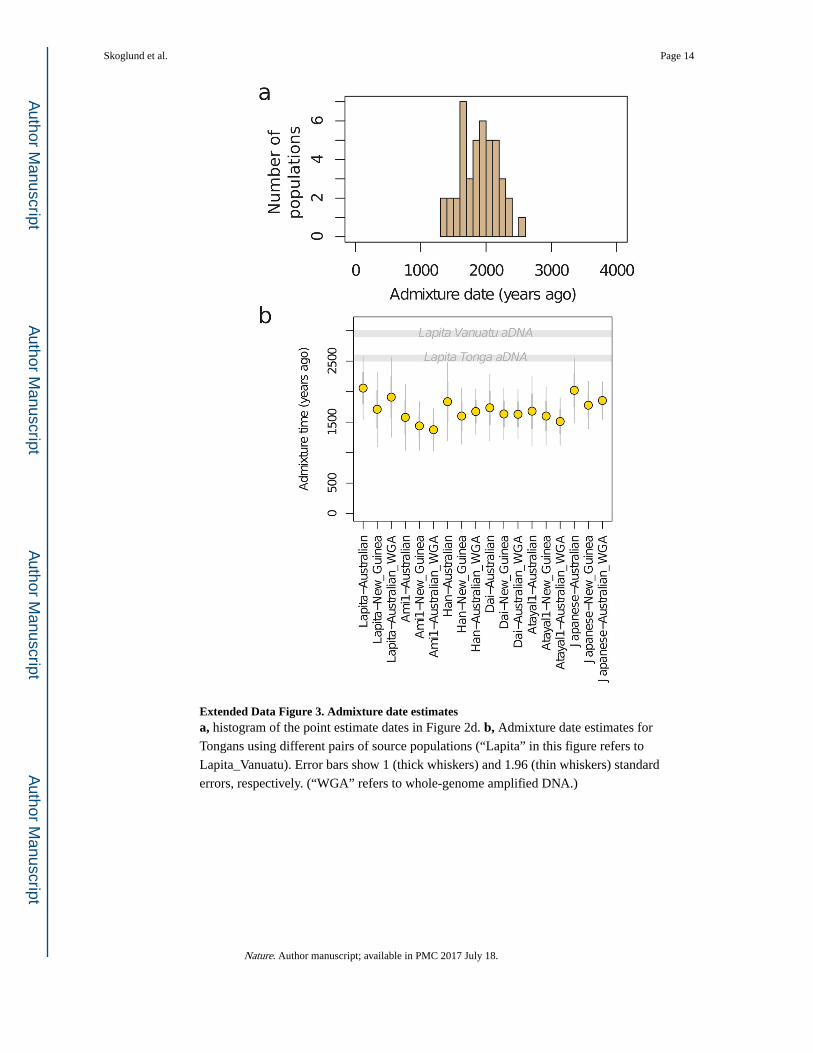
Extended Data Figure 3. Admixture date estimatesa, histogram of the point estimate dates in Figure 2d. b, Admixture date estimates for
Tongans using different pairs of source populations (“Lapita” in this figure refers to
Lapita_Vanuatu). Error bars show 1 (thick whiskers) and 1.96 (thin whiskers) standard
errors, respectively. (“WGA” refers to whole-genome amplified DNA.)
Skoglund et al. Page 14
Nature. Author manuscript; available in PMC 2017 July 18.
Author M
anuscriptA
uthor Manuscript
Author M
anuscriptA
uthor Manuscript

Extended Data Figure 4. Admixture graph inferred using Treemixa, A simple tree-like model without admixture fits the data poorly, as can be seen from the
matrix of residuals between empirical and modeled allele frequency covariance on the right.
b, The optimal placement of a single 25% admixture event is from the lineage related to
New Guinean Highlanders into the lineage leading to Tongans. Tongans derive the other
portion of their ancestry from the lineage leading to the two ancient groups of individuals.
This graph has no significant deviations between empirical and modeled allele frequency
covariances.
Skoglund et al. Page 15
Nature. Author manuscript; available in PMC 2017 July 18.
Author M
anuscriptA
uthor Manuscript
Author M
anuscriptA
uthor Manuscript

Extended Data Figure 5. Admixture graphs modeling the population history of AustraliansOutlier f4-statistics are shown (|Z| > 3). a, A model with a single admixture edge positing
that Australians are an outgroup to the Papuan ancestry in Tongans does not fit the data (5
outlier statistics). b, An alternative model with 2 admixture edges where the Papuan ancestry
in Tongans also contributed to Australians fits the data (no outliers). c, A model with 2
admixture edges where New Guinean Highlanders are admixed from an Australian source
after the divergence of the Papuan source in Tongans does not fit the data (5 outliers). d, A
model with 2 admixture edges where the Papuan ancestry in Tongans is intermediate
between the New Guinean Highlander lineage and the Australian lineage. Branch lengths are
Skoglund et al. Page 16
Nature. Author manuscript; available in PMC 2017 July 18.
Author M
anuscriptA
uthor Manuscript
Author M
anuscriptA
uthor Manuscript

in units of FST × 1000. Lapita in this figure refers only to Lapita_Vanuatu, which is the only
group for which we have multiple individuals (needed to compute FST).
Extended Data Figure 6. First Remote Oceanian ancestry today comes primarily from femalesa, Illustration of the rationale for using the X-chromosome to study asymmetrical admixture
between males and females. The example on the left illustrates admixture with equal
proportion of males and females in both the red and the yellow ancestral population. The
example on the right illustrates an extreme case of asymmetrical admixture where the red
ancestral population only contributes females and the yellow ancestral population only
contributes males to the admixed generation, demonstrating the disproportional contribution
of X chromosomes by females to the admixed population. b, Female and male ancestral
contributions based on an admixture model fitted to estimated ancestry proportions on the
autosomes and X-chromosome. We show the 95%, 70%, and 5% highest posterior intervals
for four selected populations from Polynesia (Samoans), the Solomon Islands
(Kolombangara), Bougainville (Nasioi), and mainland New Guinea (Papuans).
Skoglund et al. Page 17
Nature. Author manuscript; available in PMC 2017 July 18.
Author M
anuscriptA
uthor Manuscript
Author M
anuscriptA
uthor Manuscript

Extended Data Table 1
In-solution DNA enrichment and sequencing of ancient individuals.All dates are calibrated
using OxCal v4.2.458 with a mixture of the Marine13 and Intcal13 curves59 as determined
by linear interpolation between dietary terrestrial/marine δ13C isotopic endpoints (−21‰/
−12‰) with an uncertainty of ±10% on the per-cent marine carbon result following previous
recommendations60. Two of the dates have been previously reported (for I1368/B30A and
I1370/B17)61, and in this study we add two new dates: for I1369/B10B from Tonga (on the
same petrous bone used for ancient DNA analysis) and on CP30/SK10 from Tonga (on a
fibula). Measured 13C and 15N values for I1369/B10B are −14.5 and 13.7‰ respectively,
and for SK10 −16.44‰ and 10.48‰. As justified in ref. 61, we also applied a location-
specific reservoir correction (ΔR) of 40±44 14C years to the marine curve to adjust for
regional oceanic variation in 14C around Vanuatu, and 11±83 14C years for Tongatapu62.
Sample information Coverage on chromosomes 1–22 Sex determination
Location ID1 ID2 Bone for aDNA Bone for dating
14C Date: Calibrated
95.4% Conf. Int.
(Uncalibrated date, Lab number)
Mean depth All SNPs SNPs over-lapping array Y SNPs X SNPs Sex
Vanuatu I1368 B30A Petrous Skull 2990-2740 BP (2983±32 BP, Wk-22657)
0.26 139,461 74,631 321 18,231 F
Vanuatu I1369 B10B Petrous Petrous 3000-2750 BP (3045±30 BP, Poz-81126)
0.14 199,500 107,523 341 24,255 F
Vanuatu I1370 B17 Petrous Skull 3110-2780 BP (3083±26 BP, Wk-21026)
0.21 167,311 90,402 231 19,303 F
Tonga CP30 SK10 Petrous Fibula 2680-2340 BP (2594±20 BP, Wk-41883)
0.16 231,994 125,908 75 25,943 F
Extended Data Table 2
356 individuals newly genotyped on the Human Origins Array.
Population N Country of origin Land mass Language Lat. Long. Co-authors for samples Protocol Numbers for informed consent Data distribution
Ata 8 Papua New Guinea New Britain Papuan −5.7 150.9 F.R.F., J.S.F., G.K., D.A.M.
MRAC.1998.2000.2010 and 99-226.4320 Signed Letter
Baining_Malasait 5 Papua New Guinea New Britain Papuan −4.47 151.9 F.R.F., J.S.F., G.K., D.A.M.
MRAC.1998.2000.2010 and 99-226.4320 Signed Letter
Baining_Marabu 10 Papua New Guinea New Britain Papuan −4.63 152.3 F.R.F., J.S.F., G.K., D.A.M.
MRAC.1998.2000.2010 and 99-226.4320 Signed Letter
Bajo 10 Indonesia Sulawesi Austronesian −3.97 122.59 M.P.C, P.K., F.-X.R. 4.13.2013 approval AMIS-UPS Ethics Committee
Signed Letter
Buka 8 Papua New Guinea Bougainville Austronesian −5.42 154.67 F.R.F., J.S.F., G.K., D.A.M.
MRAC.1998.2000.2010 and 99-226.4320 Signed Letter
Burmese 10 Myanmar Asia Sino-Tibetan 16.41 95.89 T.K., J.T.S.W. 2010/820/A and HBREC.2011.01 Fully public
Dusun 10 Brunei Borneo Austronesian 4.71 114.67 T.K., S.A. MHREC/EDU/2012/3(1) and HBREC.2011.01 Fully public
Ilocano 2 Philippines Luzon Austronesian 14.6 120.98 T.K., J.T.S.W. 2010/820/A and HBREC.2011.01 Fully public
Skoglund et al. Page 18
Nature. Author manuscript; available in PMC 2017 July 18.
Author M
anuscriptA
uthor Manuscript
Author M
anuscriptA
uthor Manuscript

Population N Country of origin Land mass Language Lat. Long. Co-authors for samples Protocol Numbers for informed consent Data distribution
Kankanaey 10 Philippines Luzon Austronesian 17.07 121.03 T.K., J.T.S.W. 2010/820/A and HBREC.2011.01 Fully public
Kol_New_Britain 2 Papua New Guinea New Britain Papuan −5.38 151.63 F.R.F., J.S.F., G.K., D.A.M.
MRAC.1998.2000.2010 and 99-226.4320 Signed Letter
Kove 18 Papua New Guinea New Britain Austronesian −5.47 148.95 F.R.F., J.S.F., G.K., D.A.M.
MRAC.1998.2000.2010 and 99-226.4320 Signed Letter
Kuot_Kabil 9 Papua New Guinea New Ireland Papuan −3.07 151.7 F.R.F., J.S.F., G.K., D.A.M.
MRAC.1998.2000.2010 and 99-226.4320 Signed Letter
Kuot_Lamalaua 8 Papua New Guinea New Ireland Papuan −3 151.5 F.R.F., J.S.F., G.K., D.A.M.
MRAC.1998.2000.2010 and 99-226.4320 Signed Letter
Lavongai 15 Papua New Guinea New Austronesian −2.57 150.43 F.R.F., J.S.F., G.K., D.A.M.
MRAC.1998.2000.2010 and 99-226.4320 Signed Letter
Lebbo 8 Indonesia Borneo Austronesian 1.66 117.16 F.R.F., J.S.F., G.K., D.A.M.
MRAC.1998.2000.2010 and 99-226.4320 Signed Letter
Madak 10 Papua New Guinea New Ireland Austronesian −3.1 151.7 F.R.F., J.S.F., G.K., D.A.M.
MRAC.1998.2000.2010 and 99-226.4320 Signed Letter
Malay 9 Singapore Asia Austronesian 1.35 103.82 T.K., J.T.S.W. 2010/820/A and HBREC.2011.01 Fully public
Mamusi 20 Papua New Guinea New Britain Austronesian −6 151 F.R.F., J.S.F., G.K., D.A.M.
MRAC.1998.2000.2010 and 99-226.4320 Signed Letter
Mamusi_Paleabu 6 Papua New Guinea New Britain Austronesian −5.95 150.9 F.R.F., J.S.F., G.K., D.A.M.
MRAC.1998.2000.2010 and 99-226.4320 Signed Letter
Mangseng 6 Papua New Guinea New Britain Austronesian −5.93 150.7 F.R.F., J.S.F., G.K., D.A.M.
MRAC.1998.2000.2010 and 99-226.4320 Signed Letter
Manus 2 Papua New Guinea Manus Austronesian −2.08 147 F.R.F., J.S.F., G.K., D.A.M.
MRAC.1998.2000.2010 and 99-226.4320 Signed Letter
Melamela 10 Papua New Guinea New Britain Austronesian −5 151.25 F.R.F., J.S.F., G.K., D.A.M.
MRAC.1998.2000.2010 and 99-226.4320 Signed Letter
Mengen 10 Papua New Guinea New Britain Austronesian −5.1 151.4 F.R.F., J.S.F., G.K., D.A.M.
MRAC.1998.2000.2010 and 99-226.4320 Signed Letter
Murut 10 Brunei Borneo Austronesian 4.62 115.14 T.K., J.T.S.W. MHREC/EDU/2012/3(1) and HBREC.2011.01 Fully public
Mussau 10 Papua New Guinea St. Matthias Austronesian −1.58 149.73 F.R.F., J.S.F., G.K., D.A.M.
MRAC.1998.2000.2010 and 99-226.4320 Signed Letter
Nakanai_Bileki 10 Papua New Guinea New Britain Austronesian −5.75 150.8 F.R.F., J.S.F., G.K., D.A.M.
MRAC.1998.2000.2010 and 99-226.4320 Signed Letter
Nakanai_Loso 7 Papua New Guinea New Britain Austronesian −5.48 150.8 F.R.F., J.S.F., G.K., D.A.M.
MRAC.1998.2000.2010 and 99-226.4320 Signed Letter
Nailik 9 Papua New Guinea New Ireland Austronesian −2.98 151.52 F.R.F., J.S.F., G.K., D.A.M.
MRAC.1998.2000.2010 and 99-226.4320 Signed Letter
Notsi 9 Papua New Guinea New Ireland Austronesian −3.05 151.65 F.R.F., J.S.F., G.K., D.A.M.
MRAC.1998.2000.2010 and 99-226.4320 Signed Letter
Saposa 10 Papua New Guinea Bougainville Austronesian −5.58 154.67 F.R.F., J.S.F., G.K., D.A.M.
MRAC.1998.2000.2010 and 99-226.4320 Signed Letter
Southwest_Bougainville 2 Papua New Guinea Bougainville Papuan −6.6 155.5 F.R.F., J.S.F., G.K., D.A.M.
MRAC.1998.2000.2010 and 99-226.4320 Signed Letter
Sulka 20 Papua New Guinea New Britain Papuan −4.5 152.3 F.R.F., J.S.F., G.K., D.A.M.
MRAC.1998.2000.2010 and 99-226.4320 Signed Letter
Tagalog 5 Philippines Luzon Austronesian 14.6 120.98 T.K., J.T.S.W. 2010/820/A and HBREC.2011.01 Fully public
Teop 10 Papua New Guinea Bougainville Austronesian −5.85 155.18 F.R.F., J.S.F., G.K., D.A.M.
MRAC.1998.2000.2010 and 99-226.4320 Signed Letter
Tigak 10 Papua New Guinea New Ireland Austronesian −2.57 150.83 F.R.F., J.S.F., G.K., D.A.M.
MRAC.1998.2000.2010 and 99-226.4320 Signed Letter
Tolai 24 Papua New Guinea New Britain Papuan −4.31 152.14 F.R.F., J.S.F., G.K., D.A.M.
MRAC.1998.2000.2010 and 99-226.4320 Signed Letter
Skoglund et al. Page 19
Nature. Author manuscript; available in PMC 2017 July 18.
Author M
anuscriptA
uthor Manuscript
Author M
anuscriptA
uthor Manuscript

Population N Country of origin Land mass Language Lat. Long. Co-authors for samples Protocol Numbers for informed consent Data distribution
Vietnamese 10 Vietnam Asia Austroasiatic 10.82 106.64 T.K., J.T.S.W. 2010/820/A and HBREC.2011.01 Fully public
Visayan 4 Philippines Mindanao Austronesian 9.76 125.51 T.K., J.T.S.W. 2010/820/A and HBREC.2011.01 Fully public
Extended Data Table 3
f-statistics for populations on the Oceanian cline. Standard error (SE) is shown for FST
between each Test population and Lapita_Vanuatu. The Z-score is given for the statistic
f3(Lapita_Vanuatu, Australian; Test), where Z < 3 provides significant evidence that the Test is admixed between sources related to Lapita_Vanuatu and Australians.
FST(Lapita_Vanuatu, Test) f3(Lapita_Vanuatu, Australian; Test)
Test population Estimate SE Estimate Z-score
Baining Malasait 0.263 0.005 0.143 38.4
Baining_Marabu 0.249 0.004 0.115 40.1
Papuan 0.225 0.004 0.066 33.3
Kol_New_Britain 0.216 0.006 0.086 16.7
Mamusi 0.204 0.004 0.059 26.5
Ata 0.197 0.004 0.050 21.6
Nakanai_Loso 0.194 0.004 0.055 21.9
Mamusi_Paleabu 0.187 0.004 0.040 17.8
Santa_Cruz 0.185 0.004 0.021 10.7
Nasioi 0.178 0.004 0.028 14.7
Bougainville_South 0.176 0.006 0.034 8.1
Sulka 0.174 0.004 0.022 13.1
Mengen 0.168 0.004 0.017 9.1
Tolai 0.163 0.004 0.009 5.6
Kuot_Kabil 0.162 0.004 0.014 7.7
Lavongai 0.160 0.004 0.009 5.2
Kuot_Lamalaua 0.160 0.004 0.008 4.3
Nakanai_Bileki 0.153 0.004 0.013 7.0
Melamela 0.152 0.004 0.010 5.1
Madak 0.151 0.004 0.003 1.8
Papuan_Gulf 0.151 0.005 0.002 0.7
Kove 0.150 0.004 0.013 7.4
Mangseng 0.145 0.004 0.003 1.7
Nailik 0.145 0.004 0.000 −0.1
Teop 0.144 0.004 0.005 2.8
Notsi 0.144 0.004 −0.002 −1.4
Manus 0.141 0.006 −0.005 −1.4
Tigak 0.141 0.004 0.002 1.2
Mussau 0.132 0.004 −0.005 −3.3
Choiseul 0.123 0.004 −0.007 −3.7
Skoglund et al. Page 20
Nature. Author manuscript; available in PMC 2017 July 18.
Author M
anuscriptA
uthor Manuscript
Author M
anuscriptA
uthor Manuscript

FST(Lapita_Vanuatu, Test) f3(Lapita_Vanuatu, Australian; Test)
Test population Estimate SE Estimate Z-score
Saposa 0.122 0.004 −0.011 −6.5
Buka 0.118 0.004 −0.016 −9.9
Vella_Lavella 0.112 0.004 −0.016 −8.6
Ranongga 0.110 0.004 −0.015 −8.2
Savo 0.109 0.004 −0.020 −12.1
Russell 0.108 0.005 −0.017 −6.8
Kolombangara 0.108 0.004 −0.015 −8.0
RenBel 0.106 0.004 0.035 14.0
Gela 0.103 0.004 −0.024 −14.3
Makira 0.101 0.004 −0.024 −16.1
Malaita 0.096 0.004 −0.025 −15.5
Papuan_Central 0.094 0.004 −0.031 −18.2
Bajo 0.082 0.004 0.022 12.8
Isabel 0.079 0.004 −0.024 −15.9
Tikopia 0.077 0.004 −0.003 −1.3
Ontong_Java 0.069 0.004 −0.018 −10.4
Tongan 0.053 0.004 −0.018 −9.9
Extended Data Table 4
Ancestry estimates for populations on the Oceanian cline.“Auto.” gives the estimate on the
autosomes (chromosomes 1–22). “Diff” gives the difference between the autosome and X
chromosome estimates.
Test
First Remote Oceanian ancestry estimate Anc. contrib. (method of moments) Two source model
Auto. SE chrX SE Diff. SE Z Male SE Female SE P-value
Tongan 69.8% 1.0% 104.1% 8.9% −34.3% 9.0% −3.8 −33.1% 27.0% 172.7% 22.0% 0.22
Rennel & Bellona 68.9% 1.2% 92.1% 7.3% −23.2% 7.4% −3.1 −0.7% 22.4% 138.5% 32.8% 0.89
Tikopia 65.8% 1.0% 93.9% 10.9% −28.1% 10.9% −2.6 −18.5% 32.9% 150.1% 39.9% 0.58
Ontong_Java 61.9% 0.9% 78.4% 13.3% −16.5% 13.3% −1.2 12.4% 40.1% 111.4% 12.7% 0.83
Santa Isabel 52.9% 0.9% 60.5% 4.2% −7.6% 4.3% −1.8 30.1% 13.1% 75.7% 14.2% 0.87
Papuan_Central 42.5% 0.9% 65.6% 4.7% −23.1% 4.8% −4.8 −26.8% 14.6% 111.8% 47.7% 0.14
Malaita 39.6% 0.9% 66.1% 15.9% −26.5% 15.9% −1.7 −39.9% 47.8% 119.1% 20.8% 0.25
Kolombangara 39.1% 1.0% 54.7% 6.9% −15.6% 7.0% −2.2 −7.7% 21.1% 85.9% 16.3% 0.87
Nggela 37.8% 0.9% 54.6% 5.4% −16.8% 5.5% −3.1 −12.6% 16.6% 88.2% 82.5% 0.59
Ranongga 37.6% 1.0% 48.8% 27.5% −11.2% 27.5% −0.4 4.0% 82.6% 71.2% 29.8% 0.15
Russell 36.2% 1.2% 45.8% 9.9% −9.6% 10.0% −1.0 7.4% 30.1% 65.0% 26.2% 0.19
Vella_Lavella 35.2% 1.0% 53.2% 8.7% −18.0% 8.8% −2.1 −18.8% 26.4% 89.2% 19.9% 0.10
Savo 34.6% 0.9% 56.4% 6.6% −21.8% 6.7% −3.3 −30.8% 20.1% 100.0% 38.4% 0.18
Makira 34.6% 0.9% 31.8% 12.8% 2.8% 12.8% 0.2 43.0% 38.6% 26.2% 13.4% 0.08
Choiseul 32.4% 1.0% 35.5% 4.4% −3.1% 4.5% −0.7 23.1% 13.8% 41.7% 9.8% 0.20
Skoglund et al. Page 21
Nature. Author manuscript; available in PMC 2017 July 18.
Author M
anuscriptA
uthor Manuscript
Author M
anuscriptA
uthor Manuscript

Test
First Remote Oceanian ancestry estimate Anc. contrib. (method of moments) Two source model
Auto. SE chrX SE Diff. SE Z Male SE Female SE P-value
Buka 31.3% 0.9% 46.0% 3.2% −14.7% 3.3% −4.4 −12.8% 10.3% 75.4% 16.9% 0.52
Saposa 31.1% 0.9% 41.8% 5.6% −10.7% 5.7% −1.9 −1.0% 17.2% 63.2% 14.2% 0.25
Mussau 29.2% 0.9% 39.4% 4.7% −10.2% 4.8% −2.1 −1.4% 14.6% 59.8% 22.0% 0.54
Teop 26.5% 0.9% 67.8% 7.3% −41.3% 7.4% −5.6 −97.4% 22.2% 150.4% 11.5% 0.86
Kove 26.4% 0.9% 29.8% 3.8% −3.4% 3.9% −0.9 16.2% 12.0% 36.6% 20.2% 0.01
Tigak 26.2% 0.9% 43.9% 6.7% −17.7% 6.8% −2.6 −26.9% 20.4% 79.3% 21.4% 0.87
Melamela 25.3% 0.9% 50.1% 7.1% −24.8% 7.2% −3.5 −49.1% 21.6% 99.7% 18.8% 0.94
Manus 24.9% 1.2% 14.2% 6.2% 10.7% 6.3% 1.7 57.0% 19.2% −7.2% 42.9% 0.87
Nakanai_Bileki 24.5% 0.9% 38.4% 14.3% −13.9% 14.3% −1.0 −17.2% 43.1% 66.2% 11.2% 0.28
Mangseng 23.6% 0.9% 42.2% 3.7% −18.6% 3.8% −4.9 −32.2% 11.7% 79.4% 19.9% 0.34
Papuan_Gulf 22.6% 1.1% 49.3% 6.6% −26.7% 6.7% −4.0 −57.5% 20.3% 102.7% 10.9% 0.07
Notsi 20.7% 0.8% 33.0% 3.6% −12.3% 3.7% −3.3 −16.2% 11.3% 57.6% 64.8% 0.13
Nailik 20.4% 0.8% 44.8% 21.6% −24.4% 21.6% −1.1 −52.8% 64.9% 93.6% 22.9% 0.08
Madak 18.7% 0.8% 43.1% 7.6% −24.4% 7.6% −3.2 −54.5% 23.0% 91.9% 18.7% 0.11
Kuot_Kabil 18.6% 0.9% 55.4% 6.2% −36.8% 6.3% −5.9 −91.8% 18.9% 129.0% 26.5% 0.04
Bougainville_Sout 18.0% 1.4% 24.1% 8.8% −6.1% 8.9% −0.7 −0.3% 27.0% 36.3% 11.8% 0.26
Lavongai 17.6% 0.8% 36.4% 3.9% −18.8% 4.0% −4.7 −38.8% 12.1% 74.0% 16.0% 0.07
Nasioi 17.4% 1.0% 29.9% 5.3% −12.5% 5.4% −2.3 −20.1% 16.4% 54.9% 11.5% 0.40
Kuot_Lamalaua 16.2% 0.8% 13.8% 3.8% 2.4% 3.9% 0.6 23.4% 11.8% 9.0% 19.6% 0.07
Nakanai_Loso 15.4% 1.1% 24.3% 6.5% −8.9% 6.6% −1.4 −11.3% 20.0% 42.1% 11.2% 0.37
Mengen 15.2% 0.8% 35.3% 3.7% −20.1% 3.8% −5.3 −45.1% 11.6% 75.5% 13.0% 0.41
Tolai 14.3% 0.8% 22.5% 4.3% −8.2% 4.4% −1.9 −10.3% 13.3% 38.9% 9.4% 0.01
Sulka 14.1% 0.8% 47.0% 3.1% −32.9% 3.2% - −84.6% 9.8% 112.8% 16.3% 0.48
Mamusi_Paleabu 13.7% 1.0% 30.9% 5.4% −17.2% 5.5% −3.1 −37.9% 16.7% 65.3% 13.9% 0.21
Mamusi 13.7% 0.9% 22.7% 4.6% −9.0% 4.7% −1.9 −13.3% 14.3% 40.7% 27.1% 0.35
Ata 13.2% 1.0% 26.4% 9.0% −13.2% 9.1% −1.5 −26.4% 27.3% 52.8% 15.4% 0.24
Santa_Cruz 9.6% 0.9% 27.1% 5.1% −17.5% 5.2% −3.4 −42.9% 15.7% 62.1% 23.3% 0.17
Kol_New_Britain 8.5% 1.4% 9.1% 7.7% −0.6% 7.8% −0.1 6.7% 23.8% 10.3% 30.1% 0.66
Baining_Marabu 2.6% 1.0% 25.3% 10.0% −22.7% 10.0% −2.3 −65.5% 30.3% 70.7% 32.5% 0.24
Baining_Malasait 1.2% 1.2% 34.9% 10.8% −33.7% 10.9% −3.1 −99.9% 32.8% 102.3% 8.2% 0.12
Papuan 0.0% 0.5% 2.4% 2.7% −2.4% 2.7% −0.9 −7.2% 8.3% 7.2% 0.0% 0.58
Supplementary Material
Refer to Web version on PubMed Central for supplementary material.
Acknowledgments
We thank the 356 volunteers who donated samples for genome-wide analysis. We thank Mark Stoneking for co-funding genotyping of the Bismarck samples. We thank Murray Brilliant, Heather Norton, and Laura Scheinfeldt, for help in the preparation of the Bismarck samples and establishment of a repository for them at the Marshfield Foundation. We thank Alexander Kim, Irina Pugach, and Mark Stoneking for critical comments, and Iain Mathieson for critiques and advice on estimating sex-specific ancestral contributions. The Fig. 1a and the Fig. 3b–e maps were plotted in R using the world() map of the ‘fields’ and ‘maps’ packages (using public domain data from
Skoglund et al. Page 22
Nature. Author manuscript; available in PMC 2017 July 18.
Author M
anuscriptA
uthor Manuscript
Author M
anuscriptA
uthor Manuscript

the CIA World Data Bank II). P.S. was supported by the Wenner-Gren foundation and the Swedish Research Council (VR grant 2014-453). The Teouma research by M.S. and S.B. was supported by the Australian Research Council (Discovery Grants DP0880789 and DP110101415), the National Geographic Society, and by the Australia-Pacific Science Foundation. F.V. was supported by CNRS-UMR 7041. M.N. was supported by an Irish Research Council grant (GOIPD/2013/1). D.F. was supported by an Irish Research Council grant (GOIPG/2013/36). Q.F. was funded by the National Natural Science Foundation of China (L1524016), the Chinese Academy of Sciences Discipline Development Strategy Project (2015-DX-C-03) and the Bureau of International Cooperation of the Chinese Academy of Sciences. T.K. was supported by ERC starting grant FP7-261213. C.P. and J.K. were supported by the Baden Wuerttemberg Foundation. J.K was supported by the DFG grant KR 4015/1-1 and the Max Planck Society. R.P. was supported by ERC starting grant ADNABIOARC (263441). D.R. was supported by NIH grant GM100233, by NSF HOMINID BCS-1032255, and is a Howard Hughes Medical Institute investigator.
References
1. Sheppard PJ, Chiu S, Walter R. Re-dating Lapita Movement into Remote Oceania. Journal of Pacific Archaeology. 2015; 6:26–36.
2. Kayser M, et al. Genome-wide Analysis Indicates More Asian than Melanesian Ancestry of Polynesians. The American Journal of Human Genetics. 2008; 82:194–198. http://dx.doi.org/10.1016/j.ajhg.2007.09.010. [PubMed: 18179899]
3. Kayser M. The human genetic history of Oceania: near and remote views of dispersal. Current Biology. 2010; 20:R194–R201. [PubMed: 20178767]
4. Wollstein A, et al. Demographic history of Oceania inferred from genome-wide data. Current Biology. 2010; 20:1983–1992. [PubMed: 21074440]
5. Matisoo-Smith E. Ancient DNA and the human settlement of the Pacific: A review. Journal of Human Evolution. 2015; 79:93–104. http://dx.doi.org/10.1016/j.jhevol.2014.10.017. [PubMed: 25556846]
6. Bellwood, PS. First farmers: the origins of agricultural societies. Blackwell Publishing; 2005.
7. Duggan AT, et al. Maternal history of Oceania from complete mtDNA genomes: contrasting ancient diversity with recent homogenization due to the Austronesian expansion. The American Journal of Human Genetics. 2014; 94:721–733. [PubMed: 24726474]
8. Kayser M, et al. Melanesian origin of Polynesian Y chromosomes. Current Biology. 2000; 10:1237–1246. http://dx.doi.org/10.1016/S0960-9822(00)00734-X. [PubMed: 11069104]
9. Blust R. Remote Melanesia: one history or two? An addendum to Donohue and Denham. Oceanic Linguistics. 2008; 47:445–459.
10. Friedlaender JS, et al. The Genetic Structure of Pacific Islanders. PLoS Genet. 2008; 4:e19. [PubMed: 18208337]
11. Pinhasi R, et al. Optimal Ancient DNA Yields from the Inner Ear Part of the Human Petrous Bone. PLoS ONE. 2015; 10:e0129102. [PubMed: 26086078]
12. Dabney J, et al. Complete mitochondrial genome sequence of a Middle Pleistocene cave bear reconstructed from ultrashort DNA fragments. Proceedings of the National Academy of Sciences. 2013; 110:15758–15763.
13. Rohland N, Harney E, Mallick S, Nordenfelt S, Reich D. Partial uracil–DNA–glycosylase treatment for screening of ancient DNA. Philosophical Transactions of the Royal Society of London B: Biological Sciences. 2015; 370
14. Fu Q, et al. An early modern human from Romania with a recent Neanderthal ancestor. Nature. 2015
15. Skoglund P, Storå J, Götherström A, Jakobsson M. Accurate sex identification of ancient human remains using DNA shotgun sequencing. Journal of Archaeological Science. 2013; 40:4477–4482.
16. Melton T, et al. Polynesian genetic affinities with Southeast Asian populations as identified by mtDNA analysis. American journal of human genetics. 1995; 57:403. [PubMed: 7668267]
17. Skoglund P, et al. Origins and genetic legacy of Neolithic farmers and hunter-gatherers in Europe. Science. 2012; 336:466–469. [PubMed: 22539720]
18. Skoglund P, et al. Separating endogenous ancient DNA from modern day contamination in a Siberian Neandertal. Proceedings of the National Academy of Sciences. 2014
Skoglund et al. Page 23
Nature. Author manuscript; available in PMC 2017 July 18.
Author M
anuscriptA
uthor Manuscript
Author M
anuscriptA
uthor Manuscript
19. Reich D, et al. Reconstructing Native American population history. Nature. 2012; 488:370– 374. [PubMed: 22801491]
20. Moorjani P, et al. The history of African gene flow into Southern Europeans, Levantines, and Jews. PLoS genetics. 2011; 7:e1001373. [PubMed: 21533020]
21. Loh P-R, et al. Inference of admixture parameters in human populations using weighted linkage disequilibrium. 2012
22. Fenner JN. Cross-cultural estimation of the human generation interval for use in genetics-based population divergence studies. American Journal of Physical Anthropology. 2005; 128:415–423. DOI: 10.1002/ajpa.20188 [PubMed: 15795887]
23. Xu S, Pugach I, Stoneking M, Kayser M, Jin L. Genetic dating indicates that the Asian–Papuan admixture through Eastern Indonesia corresponds to the Austronesian expansion. Proceedings of the National Academy of Sciences. 2012; 109:4574–4579.
24. Pugach I, Matveyev R, Wollstein A, Kayser M, Stoneking M. Dating the age of admixture via wavelet transform analysis of genome-wide data. Genome Biol. 2011; 12:R19. [PubMed: 21352535]
25. Lipson M, et al. Reconstructing Austronesian population history in Island Southeast Asia. Nature communications. 2014:5.
26. Patterson N, et al. Ancient admixture in human history. Genetics. 2012; 192:1065–1093. [PubMed: 22960212]
27. Pickrell JK, Pritchard JK. Inference of population splits and mixtures from genome-wide allele frequency data. PLoS genetics. 2012; 8:e1002967. [PubMed: 23166502]
28. Bellwood P. Holocene Population History in the Pacific Region as a Model for Worldwide Food Producer Dispersals. Current Anthropology. 2011; 52:S363–S378. DOI: 10.1086/658181
29. Jordan FM, Gray RD, Greenhill SJ, Mace R. Matrilocal residence is ancestral in Austronesian societies. Proceedings of the Royal Society of London B: Biological Sciences. 2009 rspb. 2009.0088.
30. Stephen Lansing J, et al. An ongoing Austronesian expansion in Island Southeast Asia. Journal of Anthropological Archaeology. 2011; 30:262–272. http://dx.doi.org/10.1016/j.jaa.2011.06.004.
31. Knapp M, Clarke AC, Horsburgh KA, Matisoo-Smith EA. Setting the stage – Building and working in an ancient DNA laboratory. Annals of Anatomy - Anatomischer Anzeiger. 2012; 194:3–6. http://dx.doi.org/10.1016/j.aanat.2011.03.008. [PubMed: 21514120]
32. Meyer M, Kircher M. Illumina sequencing library preparation for highly multiplexed target capture and sequencing. Cold Spring Harbor Protocols. 2010; 2010 pdb. prot5448.
33. Fu Q, et al. DNA analysis of an early modern human from Tianyuan Cave, China. Proceedings of the National Academy of Sciences. 2013; 110:2223–2227.
34. Haak W, et al. Massive migration from the steppe is a source for Indo-European languages in Europe. 2015 arXiv preprint arXiv:1502.02783.
35. Li H, Durbin R. Fast and accurate short read alignment with Burrows–Wheeler transform. Bioinformatics. 2009; 25:1754–1760. [PubMed: 19451168]
36. Lazaridis I, et al. Ancient human genomes suggest three ancestral populations for present-day Europeans. Nature. 2014; 513:409–413. http://www.nature.com/nature/journal/v513/n7518/abs/nature13673.html - supplementary-information. DOI: 10.1038/nature13673 [PubMed: 25230663]
37. Qin P, Stoneking M. Denisovan Ancestry in East Eurasian and Native American Populations. Molecular Biology and Evolution. 2015
38. Skoglund P, et al. Genetic evidence for two founding populations of the Americas. Nature. 2015
39. Moreno-Mayar JV, et al. Genome-wide Ancestry Patterns in Rapanui Suggest Pre-European Admixture with Native Americans. Current Biology. 2014; 24:2518–2525. http://dx.doi.org/10.1016/j.cub.2014.09.057. [PubMed: 25447991]
40. Reich D, et al. Denisova Admixture and the First Modern Human Dispersals into Southeast Asia and Oceania. The American Journal of Human Genetics. 2011; 89:516–528. http://dx.doi.org/10.1016/j.ajhg.2011.09.005. [PubMed: 21944045]
41. Reich D, et al. Genetic history of an archaic hominin group from Denisova Cave in Siberia. Nature. 2010; 468:1053–1060. [PubMed: 21179161]
Skoglund et al. Page 24
Nature. Author manuscript; available in PMC 2017 July 18.
Author M
anuscriptA
uthor Manuscript
Author M
anuscriptA
uthor Manuscript

42. Meyer M, et al. A High-Coverage Genome Sequence from an Archaic Denisovan Individual. Science. 2012; 338:222–226. DOI: 10.1126/science.1224344 [PubMed: 22936568]
43. Prufer K, et al. The complete genome sequence of a Neanderthal from the Altai Mountains. Nature. 2014; 505:43–49. http://www.nature.com/nature/journal/v505/n7481/abs/nature12886.html - supplementary-information. DOI: 10.1038/nature12886 [PubMed: 24352235]
44. Allentoft ME, et al. Population genomics of Bronze Age Eurasia. Nature. 2015; 522:167–172. http://www.nature.com/nature/journal/v522/n7555/abs/nature14507.html - supplementary-information. DOI: 10.1038/nature14507 [PubMed: 26062507]
45. Green RE, et al. A Draft Sequence of the Neandertal Genome. Science. 2010; 328:710–722. [PubMed: 20448178]
46. Raghavan M, et al. Upper Palaeolithic Siberian genome reveals dual ancestry of Native Americans. Nature. 2014; 505:87–91. http://www.nature.com/nature/journal/v505/n7481/abs/nature12736.html - supplementary-information. DOI: 10.1038/nature12736 [PubMed: 24256729]
47. Raghavan M, et al. The genetic prehistory of the New World Arctic. Science. 2014:345.
48. Rasmussen M, et al. The genome of a Late Pleistocene human from a Clovis burial site in western Montana. Nature. 2014; 506:225–229. http://www.nature.com/nature/journal/v506/n7487/abs/nature13025.html - supplementary-information. DOI: 10.1038/nature13025 [PubMed: 24522598]
49. Rasmussen M, et al. The ancestry and affiliations of Kennewick Man. Nature. 2015; 523:455–458. http://www.nature.com/nature/journal/v523/n7561/abs/nature14625.html - supplementary-information. DOI: 10.1038/nature14625 [PubMed: 26087396]
50. Skoglund P, et al. Genomic Diversity and Admixture Differs for Stone-Age Scandinavian Foragers and Farmers. Science. 2014; 344:747–750. DOI: 10.1126/science.1253448 [PubMed: 24762536]
51. Patterson N, Price AL, Reich D. Population structure and eigenanalysis. PLoS genetics. 2006; 2:e190. [PubMed: 17194218]
52. Skoglund P, Jakobsson M. Archaic human ancestry in East Asia. Proceedings of the National Academy of Sciences. 2011
53. Sudmant PH, et al. Global diversity, population stratification, and selection of human copy-number variation. Science. 2015:349. [PubMed: 26206902]
54. Kong A, et al. A high-resolution recombination map of the human genome. Nat Genet. 2002; 31:241–247. http://www.nature.com/ng/journal/v31/n3/suppinfo/ng917_S1.html. [PubMed: 12053178]
55. Moorjani P, et al. A genetic method for dating ancient genomes provides a direct estimate of human generation interval in the last 45,000 years. Proceedings of the National Academy of Sciences. 2016; 113:5652–5657. DOI: 10.1073/pnas.1514696113
56. Reich D, Thangaraj K, Patterson N, Price AL, Singh L. Reconstructing Indian population history. Nature. 2009; 461:489–494. [PubMed: 19779445]
57. Csillery K, Blum MGB, Gaggiotti O, Francois O. Approximate Bayesian Computation (ABC) in practice. Trends in Ecology and Evolution. 2010; 25:410– 418. [PubMed: 20488578]
58. Bronk Ramsey, C. OxCal Program v4.2.4. Radiocarbon Accelerator Unit, University of Oxford; 2016.
59. Reimer, PJ., et al. IntCal13 and Marine13 Radiocarbon Age Calibration Curves 0–50,000 Years cal BP. 2013.
60. Ambrose, SH. Food and nutrition in history and anthropology (USA). 1993. Isotopic analysis of paleodiets: methodological and interpretive considerations.
61. Petchey F, Spriggs M, Bedford S, Valentin F, Buckley H. Radiocarbon dating of burials from the Teouma Lapita cemetery, Efate, Vanuatu. Journal of Archaeological Science. 2014; 50:227–242. http://dx.doi.org/10.1016/j.jas.2014.07.002.
62. Petchey F, Anderson A, Zondervan A, Ulm S, Hogg A. New marineΔ R values for the South Pacific subtropical gyre region. Radiocarbon. 2008; 50:373–397.
Skoglund et al. Page 25
Nature. Author manuscript; available in PMC 2017 July 18.
Author M
anuscriptA
uthor Manuscript
Author M
anuscriptA
uthor Manuscript

Figure 1. Data from ancient and present-day populationsa, Locations of 778 present-day individuals genotyped on the Affymetrix Human Origins
Array and 4 ancient individuals. b, Ancient individuals projected onto principal component
1 and 2 computed using only present-day samples. Individual population labels are given in
Extended Data Figure 2.
Skoglund et al. Page 26
Nature. Author manuscript; available in PMC 2017 July 18.
Author M
anuscriptA
uthor Manuscript
Author M
anuscriptA
uthor Manuscript

Figure 2. Genetic characteristics of the Oceanian ancestry clinea, Estimated proportion of First Remote Oceanian ancestry. b, Difference between First
Remote Oceanian ancestry estimates on chromosome X and the autosomes. c, Denisovan
ancestry estimates are inversely related to First Remote Oceanian ancestry estimates. d, Estimated date of admixture in all populations with at least 4 individuals and significant
evidence of decay of weighted admixture linkage disequilibrium as measured in ALDER.
We used Han and New Guinean Highlanders as surrogates for the ancestral populations. We
assumed a generation interval of 28.1 years, and show 95% confidence intervals (thin
whiskers) incorporating uncertainty both in the ALDER date and the value of the human
generation interval. We show the range of radiocarbon dates for the ancient individuals. e, Conditional heterozygosity (genetic diversity) estimated by drawing two random
chromosomes from different individuals at each locus, using only SNPs ascertained in a
single Yoruba, and restricting to transversion SNPs to avoid any concerns about inflated
heterozygosity due to ancient DNA degradation. Thick and thin error bars in all five panels
correspond to 1, and 1.96 standard error of the estimate.
Skoglund et al. Page 27
Nature. Author manuscript; available in PMC 2017 July 18.
Author M
anuscriptA
uthor Manuscript
Author M
anuscriptA
uthor Manuscript

Figure 3. A model of population historya, A model of population relationships incorporating admixture that fits the allele frequency
patterns (all empirical f-statistics within 3 standard errors of expectation). Branch lengths are
shown in units of FST × 1000. b, A model of population movements more than 40,000 years
ago in which modern humans arrived in the Australia-New Guinea region (blue shading) and
mixed with archaic Denisovans (brown shading). c, A model of events prior 3,000 years ago,
in which the First Remote Oceanian population formed by spread of a population of ultimate
East Asian origin to a region including Vanuatu and Tonga, and experienced little or no
mixture with the Papuans they encountered along their journey (red shading). Note that
Skoglund et al. Page 28
Nature. Author manuscript; available in PMC 2017 July 18.
Author M
anuscriptA
uthor Manuscript
Author M
anuscriptA
uthor Manuscript

geographic routes are speculative. d, A model of populations of mixed Papuan-First Remote
Oceanian ancestry in Near Oceania after 3,000 years ago in a patchwork of islands with
different proportions of First Remote Oceanian ancestry (pink shading). e, A model of
secondary expansion of admixed populations bringing Papuan ancestry into Remote
Oceania, which was still not complete in Tonga by the date of the Talasiu individual at
2680-2340 BP.
Skoglund et al. Page 29
Nature. Author manuscript; available in PMC 2017 July 18.
Author M
anuscriptA
uthor Manuscript
Author M
anuscriptA
uthor Manuscript