and bogor agricultural university - econstor.eu
TRANSCRIPT

econstorMake Your Publications Visible.
A Service of
zbwLeibniz-InformationszentrumWirtschaftLeibniz Information Centrefor Economics
Irawan, Tony; Welfens, Paul J. J.
Working Paper
Transatlantic Trade and Investment Partnership:Sectoral and Macroeconomic Perspectives forGermany, the EU and the US
IZA Policy Paper, No. 78
Provided in Cooperation with:IZA – Institute of Labor Economics
Suggested Citation: Irawan, Tony; Welfens, Paul J. J. (2014) : Transatlantic Trade andInvestment Partnership: Sectoral and Macroeconomic Perspectives for Germany, the EU andthe US, IZA Policy Paper, No. 78, Institute for the Study of Labor (IZA), Bonn
This Version is available at:http://hdl.handle.net/10419/97182
Standard-Nutzungsbedingungen:
Die Dokumente auf EconStor dürfen zu eigenen wissenschaftlichenZwecken und zum Privatgebrauch gespeichert und kopiert werden.
Sie dürfen die Dokumente nicht für öffentliche oder kommerzielleZwecke vervielfältigen, öffentlich ausstellen, öffentlich zugänglichmachen, vertreiben oder anderweitig nutzen.
Sofern die Verfasser die Dokumente unter Open-Content-Lizenzen(insbesondere CC-Lizenzen) zur Verfügung gestellt haben sollten,gelten abweichend von diesen Nutzungsbedingungen die in der dortgenannten Lizenz gewährten Nutzungsrechte.
Terms of use:
Documents in EconStor may be saved and copied for yourpersonal and scholarly purposes.
You are not to copy documents for public or commercialpurposes, to exhibit the documents publicly, to make thempublicly available on the internet, or to distribute or otherwiseuse the documents in public.
If the documents have been made available under an OpenContent Licence (especially Creative Commons Licences), youmay exercise further usage rights as specified in the indicatedlicence.
www.econstor.eu

P O
L I C
Y P
A P
E R
S
E R
I E
S
Forschungsinstitut zur Zukunft der ArbeitInstitute for the Study of Labor
IZA Policy Paper No. 78
Transatlantic Trade and Investment Partnership: Sectoral and Macroeconomic Perspectives forGermany, the EU and the US
Tony IrawanPaul J.J. Welfens
January 2014
Transatlantic Trade
and Investment Partnership: Sectoral and Macroeconomic Perspectives
for Germany, the EU and the US
Tony Irawan Schumpeter School and EIIW, University of Wuppertal
and Bogor Agricultural University
Paul J.J. Welfens EIIW and Schumpeter School, University of Wuppertal, Sciences Po, IZA and AICGS/Johns Hopkins University
Policy Paper No. 78 January 2014
IZA
P.O. Box 7240 53072 Bonn
Germany
Phone: +49-228-3894-0 Fax: +49-228-3894-180
E-mail: [email protected]
The IZA Policy Paper Series publishes work by IZA staff and network members with immediate relevance for policymakers. Any opinions and views on policy expressed are those of the author(s) and not necessarily those of IZA. The papers often represent preliminary work and are circulated to encourage discussion. Citation of such a paper should account for its provisional character. A revised version may be available directly from the corresponding author.

IZA Policy Paper No. 78 January 2014
ABSTRACT
Transatlantic Trade and Investment Partnership: Sectoral and Macroeconomic Perspectives for Germany, the EU and the US* The EU and the US have started negotiations on a Transatlantic Trade and Investment Partnership Agreement (TTIP) which could bring a considerable increase of exports and output as well as changes in the composition of output and employment. Thus export simulation studies in combination with input output analysis and employment analysis is useful. In the analysis presented the focus is mainly on sectoral output and employment effects where the key sectors are the automotive sector, chemical industry, information and communication technology production, pharmaceuticals and machinery and equipment. Backward sector links are analyzed and found to be quite important in the automotive sector, the chemical industry, the machinery and equipment sector in both Germany and the US; in Germany also in ICT production. However, most of the observed sectors have weak forward linkage. Input output analysis is also used to identify employment effects in various sectors: the pure employment effect of a 20% export expansion in Germany amounts to about 800 000 new jobs. Looking only at the US and German perspective turns out to be misleading – the high imports of intermediate inputs of German firms from EU partner countries suggests that a comparison EU-US is analytically required for some key issues and that considering the effects on EU partners is also useful. There is a host of key policy issues, including the issue of extended sustainability reporting. JEL Classification: F15, F16, F21, J21 Keywords: TTIP, trade, foreign direct investment, labor, input output analysis,
employment Corresponding author: Paul J.J. Welfens President of the European Institute for International Economic Relations (EIIW) University of Wuppertal Rainer-Gruenter-Str. 21 42119 Wuppertal Germany E-mail: [email protected]
* Forthcoming in the Journal International Economics and Economic Policy, 2014. Preliminary, comments welcome. Paul Welfens acknowledges inspiring discussions with Robert Lawrence, Kennedy School of Government. The usual disclaimer applies.
2
Content
Content ........................................................................................................................................... 2
List of Tables ................................................................................................................................. 3
List of Figures ................................................................................................................................ 4
1. Introduction ........................................................................................................................... 5
2. Sectoral Analysis ................................................................................................................... 9
3. Machinery & Equipment Sector and FDI Perspectives .................................................. 23
4. Policy Issues ......................................................................................................................... 31
References: ................................................................................................................................... 36
Appendix 1: Detailed consumption of intermediate inputs (observed sectors in Germany) –Eurostat ........................................................................................................................................ 38
Appendix 2: Detailed consumption of intermediate inputs (observed sectors in the US) -Eurostat ........................................................................................................................................ 39
Appendix 3: Detailed consumption of intermediate inputs (observed sectors in the EU) –Eurostat ........................................................................................................................................ 40
Appendix 4: Detailed consumption of intermediate inputs of the machinery and equipment n.e.c. -Eurostat............................................................................................................................. 41
Appendix 5: The impact of 20% increase in export of each observed sector on sectoral employment ................................................................................................................................. 42
Appendix 6: The impact of an increase in exports due to TTIP agreement on Germany sectoral output and employment ............................................................................................... 44
Appendix 7: US FDI Outward to the European Union Countries ......................................... 46
Appendix 8: US FDI Inward from the European Union Countries ....................................... 47
Appendix 9: US FDI Outward to Germany (Historical Basis / Stock) .................................. 48
Appendix 10: US FDI Inward from Germany (Historical Basis / Stock) .............................. 49
Appendix 11: Sector’ share in value added as a percent of total value added -Eurostat ..... 50
Appendix 12: Sector’ expenditure on Scientific Research and Development Services (as a percentage of total intermediate input consumption) -Eurostat ............................................ 51
Appendix 13: Detailed Structure of Five Observed Sectors ................................................... 54

3
List of Tables
Table 1: Backward and Forward Linkage Indicators of Selected Sectors; Germany, US, EU .... 15
Table 2: The impact of 20% increase in export of chemicals and chemical products in Germany ....................................................................................................................................... 16
Table 3: The impact of 20% increase in export of computer, electronic and optical products in Germany......................................................................................................................... 17
Table 4: The impact of 20% increase in export of motor vehicles, trailers and semi‐trailers in Germany......................................................................................................................... 17
Table 5: The impact of 20% increase in export of basic pharmaceutical products and pharmaceutical preparations in Germany ...................................................................... 18
Table 6: The impact of 20% increase in export of machinery and equipment n.e.c. in Germany ....................................................................................................................................... 19
Table 7: The impact of an increase in exports due to TTIP agreement on German sectoral output and labor (selected sector); implications of export growth based on Felbermayr et al. (2013) ............................................................................................................................. 20
Table 8: Trade Balance between Germany and the US (selected sectors); millions of US $ ...... 22
Table 9: US FDI Outward to Germany (in percent relative to total FDI) .................................... 26
Table 10: US FDI Inward from Germany (in percent relative to total FDI) ............................. 26

4
List of Figures
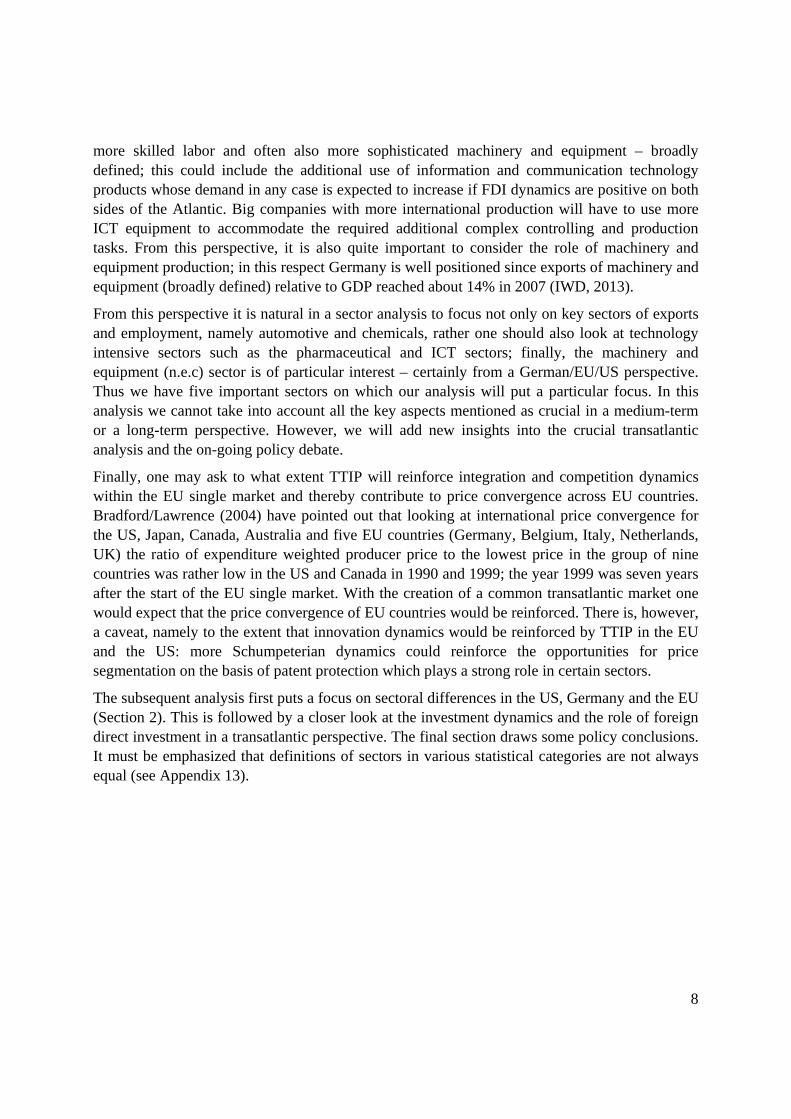
Figure 1: Structure of input of selected sectors in Germany ........................................................... 9
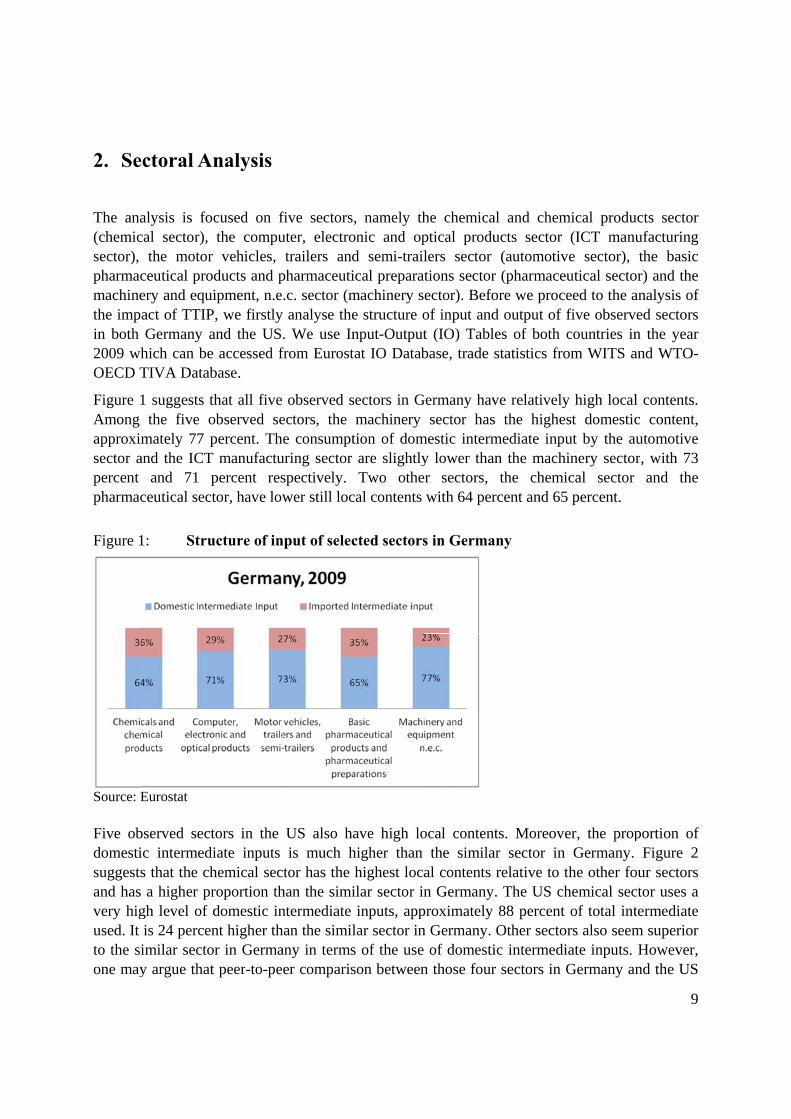
Figure 2: Structure of input of selected sectors in the US ............................................................. 10
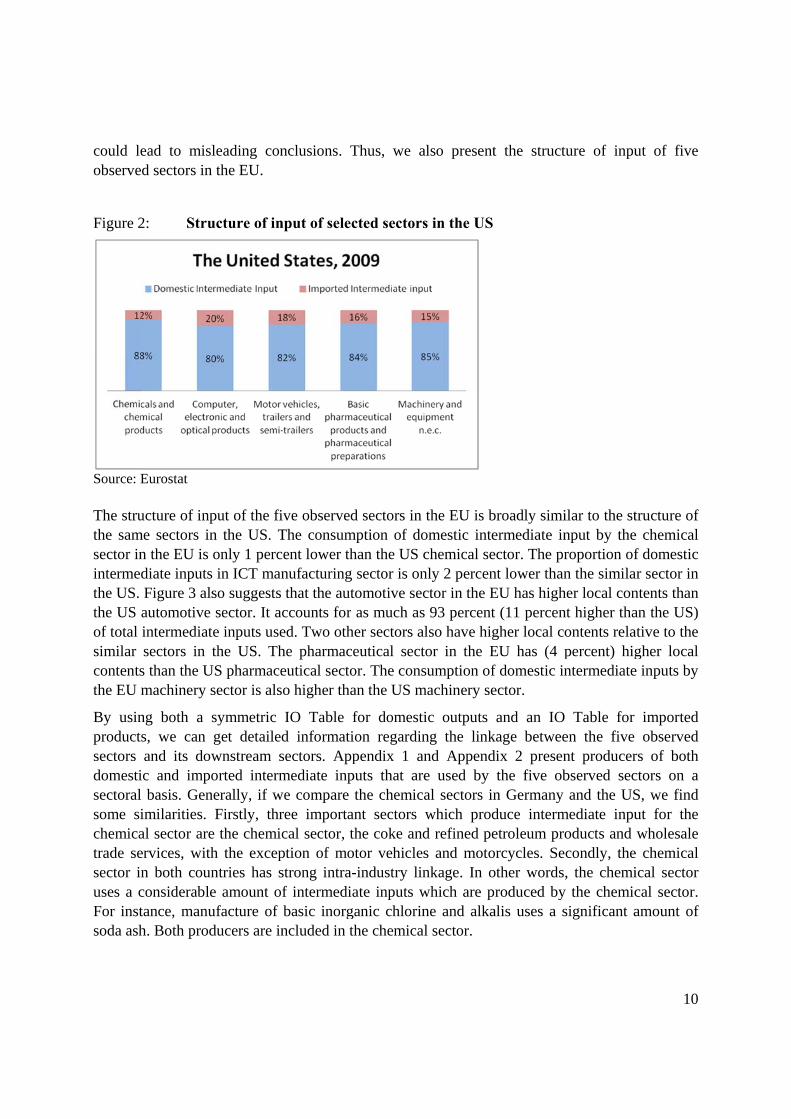
Figure 3: Structure of input of selected sectors in the EU ............................................................. 11
Figure 4: Structure of output of selected sectors in Germany ....................................................... 12
Figure 5: Structure of output of selected sectors in the US ........................................................... 13
Figure 6: Structure of output of selected sectors in the EU ........................................................... 14
Figure 7: Export of Germany to the US (Selected sectors) ........................................................... 21
Figure 8: Export of the US to Germany (Selected sectors) ........................................................... 22
5
1. Introduction
The EU and the US have started transatlantic trade negotiations on a Transatlantic Trade and Investment Partnership (TTIP) in 2013 and since both partners account for about half of the global income and more than 25% of global trade one may anticipate considerable impulses from a broad agreement; based on WTO figures the share of the US in global trade was 10.5%, that of the EU 15%. TTIP is expected to not only cut the already low tariff rates on industrial products considerably but also reduce nontariff barriers. Moreover, to the extent that additional elements of such an agreement should facilitate transatlantic trade in the crucial fields of both the manufacturing industry and services considerable trade, output and employment gains can be expected for the both US and the EU. The European Commission has commissioned one major study on the economic effects of TTIP, namely Francois et al. (2013) who come up with suggested economic gains of about 0.5% of GDP for both the US and the EU; the authors use the GTAP model and some CGE modelling. The subsequent analysis raises some doubts about the rather low benefits derived in this study – the final calculus can be made, of course, only once the negotiations have been completed and detailed results are known. Felbermayr et al. (2013) has presented particular results for Germany, namely based on the assumption that the TTIP will bring the same average trade liberalization effects as previous German free trade agreements with other partners; this is a rather pragmatic assumption – the gain for Germany in terms of output is rather modest while that for the US is very high. As regards employment effects IFO (2013) derives a surprising result, namely that the rise of unskilled workers wages will be higher than for skilled workers in Germany.
In the subsequent analysis we shed light on these conjectures and derive somewhat different results. Moreover, we present findings for key sectors in the US, Germany and the EU, respectively; this includes simulation results and calculations made on the basis of the Input Output Analysis for 2009 and the TIVA database from OECD/World Bank which provides trade in value added for 2005, 2008 and 2009. We thus look at selected key sectors of industry in the US, Germany and the EU, respectively. Looking only at the US and Germany would be misleading even if one would be mainly interested in effects for Germany and the US. The broader EU picture is needed not only because TTIP means trade liberalization of the EU and the US, it is also crucial to take into account that a rise of German exports to the US for example will generate considerable intra-EU reallocation of resources since certain German sectors rely strongly on imported intermediate inputs from EU partner countries. The same analytical logic would apply to any bilateral analysis, e.g. France and the US, UK and the US etc. – this perspective, however, is not standard in the literature. A remarkable exception is Fontagné et al. (2013): The CEPII authors focus on TTIP (including special focus on France) and present results for a reference liberalization scenario and four additional scenarios for the US, the EU27, Germany, the UK, France and Eastern European EU countries. Given the fact that the average import tariffs are 2% for the US and 3% for the EU – with some peaks in certain sectors – and considering the rather large non-tariff barriers (NTBs) it is adequate that the basic scenario will include assumptions about reduction of NTBs: Full phasing out of tariffs by 2025 is assumed and

6
a 25% across-the-board cut of NTBs for both the product and services sectors – except for public and audiovisual services. The authors point out that cutting NTBs in the service sector by more than 15% will also affect intra-EU trade (the assumption here is that NTBs within the EU are 15% lower than for third countries). The CGE modelling then gives as key results that US imports will increase by 7.5% until 2025, the EU27, excluding intra-EU imports, will record a plus of 7.4% and the EU27 (including intra-EU imports) should expect a plus of 2.2%. The split across sectors is rather uneven in exports: the total for the US is 10.1%, +12.6% for US agriculture, +12.2% for US industry, + 3.2% for services. The figures for the EU27 exports – excluding intra-EU – are +7.6% (total), 7% for EU agriculture, 8.9% for industry and 4.5% for EU services. The broadest liberalization scenario considered generates real income gains of 0.5% for both the US and the EU27; 0.5% for Germany, 0.4% for both the UK and France and 0.5% for Eastern European EU accession countries while the figures in the reference scenario are somewhat lower: 0.3% for the US and the EU27, 0.3% for Germany and the UK, 0.2% for France and the accession countries.
The study of Erixon/Bauer (2010) derives several interesting findings within a rather simple and straightforward set of assumptions for an analysis that – at first glance - looks only at the effects of liberalizing trade in goods. The authors assume that all tariffs on both sides of the Atlantic are eliminated for transatlantic trade which yields certain liberalization effects; at the same time they emphasize that most trade is intra-industrial trade so that “dynamic effects”, namely from enhanced competition in the integrated transatlantic market, have also to be considered: Thus it is assumed that labor productivity in sectors characterized by strong intra-industrial trade (measured by Grubel-Lloyd indices) will increase by 3.5% and in all other sectors there will be labor productivity growth of 2%. Taking into account the complementary dynamic effects implies that EU exports to the US will increase by 18% within a few years and US exports to the EU by 17%. The assumptions on productivity growth of Erixon and Bauer seem to be somewhat too optimistic in the light of recent US productivity analysis: The Council of Economic Advisers noted (CEA, 2010, p. 268): “The pattern of productivity growth since 1995 is somewhat complicated. From 1996:Q1 to the last available observation (2009:Q3), it averaged 2.7 percent per year, almost equal to its rate over the immediate postwar period. But that rapid growth was concentrated in the first part of the period. In the first eight years (1996:Q1 to 2003:Q4), productivity growth averaged 3.3 percent; in the four years before the business cycle peak (2004:Q1 to 2007:Q4), it averaged only 1.7 percent.”. The Erixon/Bauer assumptions thus stand for a favorable high end scenario.
There is no doubt that a transatlantic free trade area will be an important element of the broader globalization process. While one may assume that there will be temporary trade diversion effects, positive real income effects in the EU and the US plus the presence of Asian investors in both Europe and North America could contribute to generating long term global economic gains.
While it is certainly adequate to consider dynamic economic effects of a transatlantic free trade area one also should consider in a more long term perspective the effects on transatlantic foreign direct investment (FDI). US FDI in the EU is high and so is EU FDI in the US. As regards the adjustment dynamics in individual EU countries – such as Germany, France, the UK, Italy, Spain – a comprehensive analysis will not only focus on static effects, based on existing intra-EU and
7
global trade structures. Rather, one will have to ask to what extent for example higher German exports of the US in manufacturing industry will lead to more outsourcing and offshoring within the EU: German firms can be expected to particularly outsource the “lower part” (production jobs that require less knowledge or capital than the high value-added key elements of overall production of a respective good) of the value-added chain so that firms in EU partner countries will play a bigger role as intermediate product suppliers; some additional intra-EU offshoring also could occur and this could refer not only to the lower part of the value-added chain but to rather knowledge-intensive or technology elements as well – here, through its relations with subsidiaries abroad, the respective parent company will keep control over crucial elements of the value-added chain. If German firms import more intermediate inputs from EU partner countries GDP in these countries will increase and this in turn should have a positive repercussion effect on Germany’s total exports.
Moreover, plants in Germany will be able to concentrate more on complex innovative, knowledge-intensive and capital intensive elements of the value-added chain and this should contribute to a rise in the demand for skilled workers in Germany. Increased intra-EU outsourcing should, however, reduce the demand for unskilled workers in Germany. From a US-German perspective the view adopted here suggests that transatlantic innovation dynamics will increase and to the extent that US companies and German companies generate more product innovations in the context of an integrated transatlantic market one should expect that the current account balance of the US+EU – possibly of the US and the EU – will improve in the medium term since product cycle trade will generate additional exports of US and EU firms to the rest of the world. This is the logic of the product cycle trade (Vernon, 1966) and since this approach is also linked with FDI dynamics there is an additional argument to consider the perspectives of multinational companies and international investment, respectively. With many multinational companies – often in technology-intensive production – active in the EU and the US it is clear that TTIP will enhance intra-company trade to some extent. Moreover, there could be enhanced transatlantic FDI flows where one may distinguish between greenfield investment and international mergers and acquisitions. The latter go along with a rise of the relative stock market price and international technology transfer, greenfield investments stand mainly for capital accumulation effects and enhanced technology transfer.
CGE modelling and GTAP analysis, used for example by Francois et al. (2013), is a rather static exercise as neither competition-enhancing effects nor FDI effects nor macroeconomic interdependency aspects are included. As regards the latter the point is that both the US and the EU are big economies. If TTIP raises output in the US by 1% it should increase output in the EU by about 0.3% and this will have a positive repercussion effect on the US so that the initial output effect is slightly magnified; and the same holds for an initial 1% output increase in the EU which then will raise US output by maybe 0.2% and this in turn will have a positive feedback effect on Europe. With higher gross national income in both the EU and the US there will be an increase in per capita income on both sides of the Atlantic and this in turn will raise the demand for differentiated products whose demand is positively linked to per capita income. Thus the production of differentiated products will increase and additional impulses for product innovations will be generated. An increasing production of differentiated products will require
8
more skilled labor and often also more sophisticated machinery and equipment – broadly defined; this could include the additional use of information and communication technology products whose demand in any case is expected to increase if FDI dynamics are positive on both sides of the Atlantic. Big companies with more international production will have to use more ICT equipment to accommodate the required additional complex controlling and production tasks. From this perspective, it is also quite important to consider the role of machinery and equipment production; in this respect Germany is well positioned since exports of machinery and equipment (broadly defined) relative to GDP reached about 14% in 2007 (IWD, 2013).
From this perspective it is natural in a sector analysis to focus not only on key sectors of exports and employment, namely automotive and chemicals, rather one should also look at technology intensive sectors such as the pharmaceutical and ICT sectors; finally, the machinery and equipment (n.e.c) sector is of particular interest – certainly from a German/EU/US perspective. Thus we have five important sectors on which our analysis will put a particular focus. In this analysis we cannot take into account all the key aspects mentioned as crucial in a medium-term or a long-term perspective. However, we will add new insights into the crucial transatlantic analysis and the on-going policy debate.
Finally, one may ask to what extent TTIP will reinforce integration and competition dynamics within the EU single market and thereby contribute to price convergence across EU countries. Bradford/Lawrence (2004) have pointed out that looking at international price convergence for the US, Japan, Canada, Australia and five EU countries (Germany, Belgium, Italy, Netherlands, UK) the ratio of expenditure weighted producer price to the lowest price in the group of nine countries was rather low in the US and Canada in 1990 and 1999; the year 1999 was seven years after the start of the EU single market. With the creation of a common transatlantic market one would expect that the price convergence of EU countries would be reinforced. There is, however, a caveat, namely to the extent that innovation dynamics would be reinforced by TTIP in the EU and the US: more Schumpeterian dynamics could reinforce the opportunities for price segmentation on the basis of patent protection which plays a strong role in certain sectors.
The subsequent analysis first puts a focus on sectoral differences in the US, Germany and the EU (Section 2). This is followed by a closer look at the investment dynamics and the role of foreign direct investment in a transatlantic perspective. The final section draws some policy conclusions. It must be emphasized that definitions of sectors in various statistical categories are not always equal (see Appendix 13).
2. Se
The ana(chemicsector), pharmacmachinethe impin both 2009 whOECD T
Figure 1Among approximsector apercent pharmac
Figure 1
Source: E Five obdomestisuggestsand hasvery higused. It to the sione may
ectoral A
alysis is focal sector),
the motorceutical proery and equact of TTIPGermany a
hich can beTIVA Datab
1 suggests tthe five o
mately 77 pand the ICT
and 71 pceutical sect
1: Stru
Eurostat
bserved sectic intermeds that the ch a higher prgh level of is 24 percenimilar sectoy argue that
Analysis
ocused on fthe compu
r vehicles, oducts and puipment, n.eP, we firstlyand the USe accessed fbase.
that all five observed sepercent. Th
T manufactupercent restor, have low
ucture of in
tors in the diate inputs hemical secroportion thdomestic innt higher th
or in Germat peer-to-pe
five sectorsuter, electrotrailers and
pharmaceuti.c. sector (m
y analyse the. We use Infrom Eurost
observed sectors, the e consumpt
uring sector spectively. wer still loc
nput of selec
US also hais much h
ctor has the han the simintermediate han the similany in termser comparis
, namely thonic and opd semi-trailical preparamachinery se structure onput-Outputtat IO Datab
sectors in Gmachinery
tion of domare slightlyTwo othe
cal contents
cted sectors
ave high lohigher than highest locailar sector ininputs, app
lar sector ins of the useson between
he chemicaptical produlers sector
ations sectorector). Befoof input andt (IO) Tablbase, trade
Germany havsector has
mestic intermy lower thaner sectors,
with 64 per
s in Germa
ocal contentthe simila
al contents n Germany
proximately n Germany. of domestin those four
al and chemucts sector
(automotivr (pharmaceore we procd output of es of both statistics fro
ve relativelys the highemediate inpun the machthe chemi
rcent and 65
any
ts. Moreovear sector inrelative to t. The US ch88 percent Other sectoic intermedir sectors in
mical produ(ICT manu
ve sector), eutical sectoeed to the afive observcountries inom WITS a
y high localest domesticut by the au
hinery sectorical sector 5 percent.
er, the propn Germany. the other fohemical secof total int
ors also seemiate inputs. Germany an
9
ucts sector ufacturing the basic
or) and the analysis of ved sectors n the year and WTO-
l contents. c content, utomotive r, with 73
and the
portion of Figure 2
our sectors ctor uses a termediate m superior However, nd the US
could leobserve
Figure 2
Source: E The struthe samsector inintermedthe US. the US of total similar contentsthe EU m
By usinproductsectors domestisectoralsome sichemicatrade sesector inuses a cFor instsoda ash
ead to misld sectors in
2: Stru
Eurostat
ucture of inpme sectors inn the EU is diate inputsFigure 3 alsautomotive intermediatsectors in
s than the Umachinery s
ng both a s, we can and its dow
ic and impo basis. Genimilarities. al sector areervices, withn both counconsiderabletance, manuh. Both prod
leading conn the EU.
ucture of in
put of the fin the US. Tonly 1 perc
s in ICT manso suggests sector. It ac
te inputs usethe US. Th
US pharmacesector is als
symmetric get detailedwnstream sorted interm
nerally, if wFirstly, thr
e the chemich the excepntries has se amount ofufacture of ducers are in
nclusions. T
nput of selec
ive observedThe consument lower thnufacturing that the aut
ccounts fored. Two othhe pharmaceeutical sectoo higher tha
IO Table fd informatisectors. Appmediate inp
we compare ree importacal sector, tption of mostrong intra-f intermediabasic inorgncluded in t
Thus, we a
cted sectors
d sectors in mption of dohan the US csector is on
tomotive secas much as
her sectors aeutical sector. The consan the US m
for domestiion regardinpendix 1 an
puts that arethe chemic
ant sectors the coke andotor vehicles-industry linate inputs w
ganic chlorinthe chemica
also present
s in the US
the EU is bomestic intechemical senly 2 percenctor in the Es 93 percentalso have higtor in the Esumption of
machinery se
ic outputs ng the linknd Appende used by al sectors inwhich prodd refined pes and motonkage. In owhich are pne and alkal sector.
t the struct
broadly simiermediate inector. The prnt lower thanEU has hight (11 percengher local coEU has (4 pf domestic inector.
and an IOkage betweedix 2 presen
the five obn Germany duce intermetroleum proorcycles. Seother wordsroduced by
alis uses a s
ture of inpu
ilar to the stnput by theroportion ofn the simila
her local connt higher thaontents relapercent) higntermediate
Table for en the five nt producerbserved secand the US
mediate inpuoducts and condly, the, the chemi
y the chemicsignificant a
10
ut of five
tructure of e chemical f domestic
ar sector in ntents than an the US) ative to the gher local e inputs by
imported observed
rs of both ctors on a S, we find ut for the wholesale
e chemical ical sector cal sector. amount of
Figure 3
Source: E
Despite Germaninputs w36.2 peinputs wimply thchemica
Similar sector a17.9 pesector aof total figures cwhich apercent,sectors the sectsector, ithe sewdownstr
Unlike tstructureimportaautomotfrom thecan also
3: Stru
Eurostat
those siminy and the Uwhich are prrcent of tot
which are ushat the Germal sector.
with the chalso have stercent of toare imported
intermediacan also be are used as , or about 3.in Germanytor itself. Tis the most
werage, waream sector
the previoues. The au
ant sectors ttive sector ie domestic ao be found i
ucture of in
ilarities, theUS. The USroduced by ttal intermedsed by the Gman chemic
hemical secttrong depental intermed
d from the siate inputs ar
seen in the intermediat
.1 percent hy are also uhe wholesaimportant d
aste collectifor the phar
s three sectoutomotive sthat producin both Gerautomotive in the mach
nput of selec
ere is one sS chemical the domestidiate inputsGerman checal sector is
tor, the Gerndency withdiate inputsimilar sectore producedGerman ph
te inputs byhigher than dunique sinceale trade serdownstreamion and dirmaceutical
ors, the Gersector and ce intermedrmany and tsector relat
hinery sector
cted sectors
substantial dsector cons
ic chemical s used. Meaemical sectos more vuln
rman ICT mh the similars which are
or in other cod by domesharmaceuticy pharmacedomestic phe the most imrvices, exce
m sector for isposal actl sector.
rman and ththe fabrica
diate inputs the US use tive to the imr. Both the
s in the EU
difference bsumes a sigsector (intra
anwhile, 22or are impo
nerable to ex
manufacturinr sectors ofe used by tountries. Mstic ICT maal sector. Im
eutical sectoharmaceuticamportant inept for the m
the ICT mivities etc
he US automated metal
for the aua higher p
mported intGerman and
U
between thegnificant ama-industry).
2.8 percent rted from oxternal shoc
ng sector anf other counthe Germaneanwhile, oanufacturingmported phaor accounts al products.
ntermediate motor vehic
manufacturinsector is
motive sectoproducts s
utomotive sercentage oermediate ind the US m
e chemical mount of int
It accountsof total int
other countrcks relative
nd the pharmntries. Apprn ICT manuonly about 9g companiearmaceuticafor as muc Moreover, input producles and mo
ng sector. Mthe most
ors have simsector are tector. More
of intermedinputs. Simil
machinery se
11
sectors of termediate s for about termediate ies. These to the US
maceutical roximately ufacturing
9.8 percent es. Similar al products ch as 10.3 those two
ucer is not otorcycles
Meanwhile, important
milar input two main eover, the iate inputs lar figures
ector use a

higher pproductimportawhen coinputs uSome sp
Similar Appendthe EU.US, excmanufac(importeintermed
Another(2013) fexport odemandsectors Germanobserveexcept fto non-E
Figure 4
Source: E A comppercentamachineabroad. intermed
proportion s of the for
ant downstreompared to used by the pecial aspec
with our pdix 3 shows . In generalcept for the cturing sected ICT mandiate inputs
r aspect thatfound that Goriented oried. Our findinin Germany
n chemical d sectors infor the machEuropean U
4: Stru
Eurostat
pletely diffeage of the ery sector. A
More thandiate inputs
of intermedreign machieam sector the same s
German macts of this se
previous argthe detaile
, the structuICT manufator in the EUnufacturing s used by the
t is also impGermany anentation, whngs generally are exportsector is ex
n Germany. hinery secto
Union Memb
ucture of ou
erent pictureoutput in
Approximatn half of tos. Figure 5 a
diate inputsinery firms.for the US ector in Ge
achinery secector will be
gument, we d intermediure of input
facturing secU is producproducts).
e ICT manu
portant to bnd the US hhereas the Uly support Ft oriented. Fxported abrHowever, mor. The outpber States.
utput of sel
e is found ithe five ob
tely 17 perceotal producalso suggest
s from the However, machinery
ermany. Moctor is produe picked up o
also use thiate input cot is broadlyctor. The moced by the IIt is estima
ufacturing se
be analysed have differeUS produceFelbermayrFigure 5 sugroad. The samost of the pput of the G
ected secto
in the US ebserved secent of total oction in thit that the ori
domestic mthe machinsector. Thi
ore than 20 uced by the on later in t
he EU autoonsumption
y similar wiost importanICT manufaated to be aector.
is the strucent economes goods and
et al. (2013ggests that ame patternproducts are
German mac
rs in Germ
economy. Fctors are eoutput in ths sector is ientation of
machinery snery sector is pattern ispercent of tGerman ma
this paper.
omotive secn by the fiveith the counnt intermediacturing secas much as
cture of outpmic orientatio
d services to3) in which 67 percent
ns are also e exported tchinery secto
many
igure 5 shoxported abre US chemiconsumed
f the US pha
sector relatiitself is not completelythe total intachinery sec
ctor as a coe observed
nterpart sectiate input fotor in other15.8 percen
put. Felbermons. Germao satisfy itsall the fiveof total outfound in tho other EU or is export
ows that onlroad, excepical sector is
by other sarmaceutica
12
ive to the t the most y different termediate ctor itself.
omparison. sectors in
tors in the or the ICT r countries nt of total
mayr et al. any has an s domestic e observed tput in the hree other countries,
ted mostly
ly a small pt for the s exported sectors as al sector is
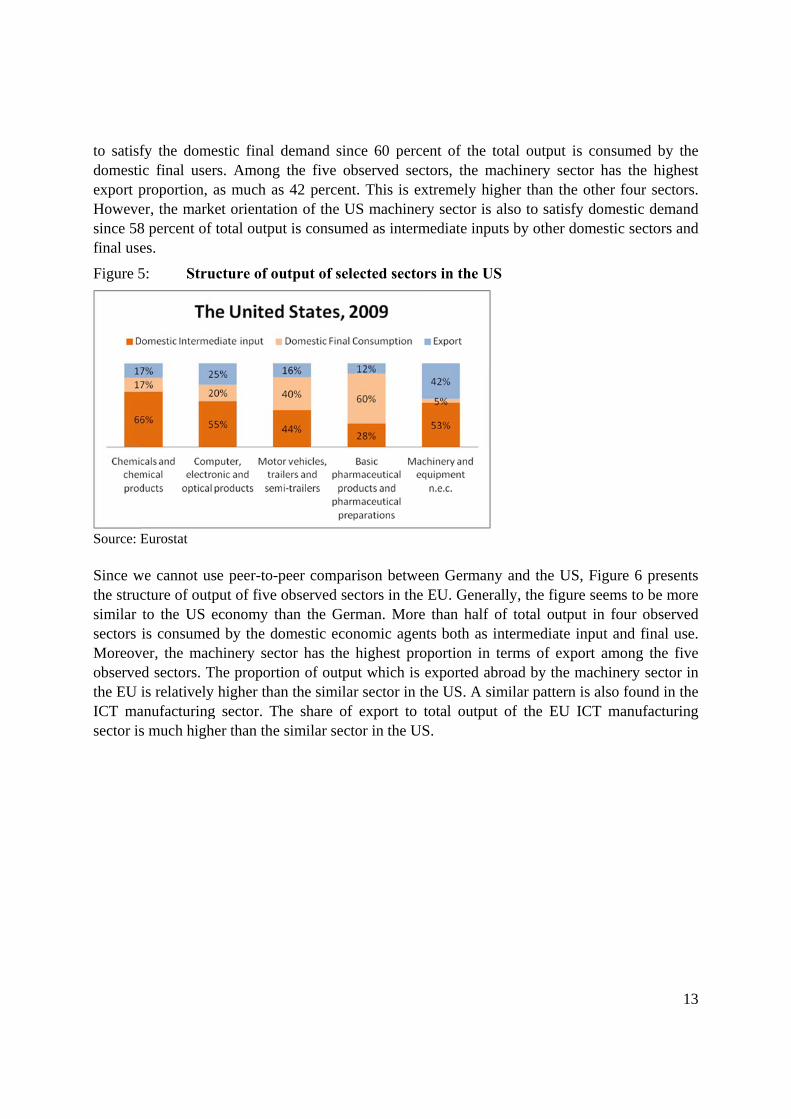
to satisfdomestiexport pHowevesince 58final use
Figure 5
Source: E Since wthe strucsimilar sectors Moreovobservethe EU ICT masector is
fy the domeic final userproportion, er, the mark8 percent of es.
5: Stru
Eurostat
we cannot uscture of outpto the US eis consume
ver, the macd sectors. Tis relatively
anufacturings much high
estic final drs. Among as much as
ket orientatif total outpu
ucture of ou
se peer-to-pput of five oeconomy thd by the do
chinery sectThe proportiy higher thang sector. Thher than the
demand sinthe five ob
s 42 percenton of the U
ut is consum
utput of sel
peer comparobserved sehan the Geromestic econtor has the ion of outpun the similahe share of similar sect
nce 60 percebserved sect. This is ex
US machinermed as interm
ected secto
rison betweectors in the rman. Morenomic agenhighest pro
ut which is ar sector in tf export to ttor in the US
ent of the tctors, the mxtremely higry sector is mediate inpu
rs in the US
een GermanEU. Gener
e than half nts both as ioportion in exported ab
the US. A sitotal outputS.
total outputmachinery se
gher than thalso to sati
uts by other
S
ny and the Ually, the figof total outintermediateterms of ex
broad by theimilar pattert of the EU
t is consumector has thhe other fousfy domestidomestic se
US, Figure 6gure seems ttput in foure input and xport amone machineryrn is also fo
U ICT manu
13
med by the he highest ur sectors. ic demand ectors and
6 presents to be more r observed
final use. g the five y sector in und in the ufacturing
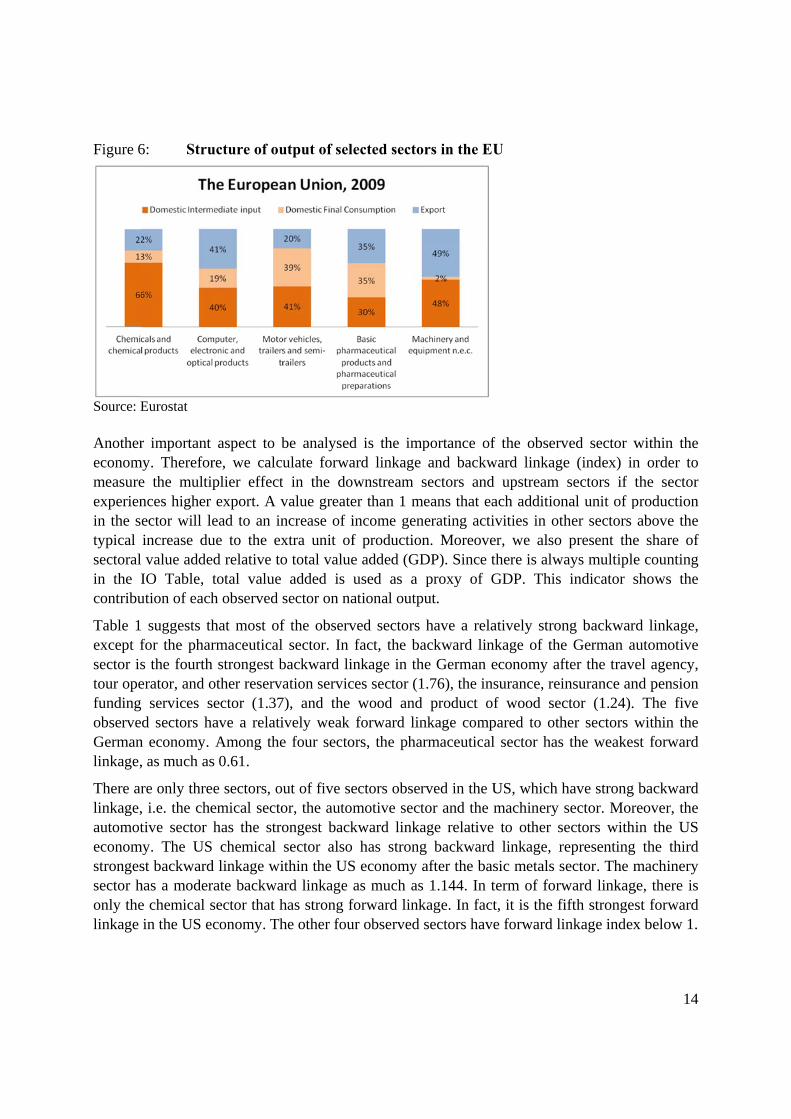
Figure 6
Source: E Anothereconommeasureexperienin the stypical sectoralin the Icontribu
Table 1except fsector istour opefundingobserveGermanlinkage,
There arlinkage,automoteconomstrongessector honly thelinkage
6: Stru
Eurostat
r important my. Therefore the multinces higher ector will lincrease du value addeIO Table, ution of each
suggests thfor the phars the fourtherator, and o services sd sectors h
n economy. , as much as
re only thre, i.e. the chetive sector
my. The USst backwardhas a modere chemical sin the US e
ucture of ou
aspect to bre, we calcuplier effectexport. A v
ead to an inue to the exed relative tototal value h observed
hat most ofrmaceutical
h strongest bother reservsector (1.37ave a relatiAmong the
s 0.61.
ee sectors, oemical sectohas the stro
S chemical d linkage wirate backwasector that hconomy. Th
utput of sel
be analysedulate forwat in the dovalue greatencrease of ixtra unit ofo total value
added is usector on na
f the observl sector. In backward lination servic
7), and the ively weak e four secto
ut of five seor, the automongest backsector also ithin the USard linkage has strong fhe other fou
ected secto
d is the impard linkage wnstream ser than 1 mincome genf productione added (GDused as a ational outp
ved sectors fact, the bankage in th
ces sector (1wood and forward lin
ors, the phar
ectors obsermotive sectkward linka
has strongS economy aas much as
forward linkur observed
rs in the EU
portance ofand backw
sectors andeans that ea
nerating actin. MoreoveDP). Since tproxy of Gut.
have a relaackward linkhe German e
.76), the insproduct of
nkage comprmaceutical
rved in the Utor and the mage relative g backwardafter the bas1.144. In t
kage. In factsectors have
U
f the observward linkaged upstream ach additionivities in other, we also there is alwaGDP. This
atively stronkage of theeconomy aftsurance, reinf wood sec
pared to othl sector has
US, which hmachinery sto other se
d linkage, resic metals sterm of forwt, it is the fie forward li
ved sector we (index) insectors if t
nal unit of pher sectors present the
ays multipleindicator s
ng backware German aufter the travensurance anctor (1.24). her sectors w
the weakes
have strong sector. Morectors withiepresenting ector. The m
ward linkagifth strongesnkage index
14
within the n order to the sector production above the
e share of e counting shows the
d linkage, utomotive el agency, nd pension
The five within the st forward
backward reover, the in the US
the third machinery
ge, there is st forward x below 1.

15
Table 1: Backward and Forward Linkage Indicators of Selected Sectors; Germany, US, EU
Backward Linkage (index) Sector Germany US EU
Chemicals and chemical products 1.047 1.228 1.199 Computer, electronic and optical products 1.033 0.879 1.065 Motor vehicles, trailers and semi-trailers 1.233 1.363 1.368 Basic pharmaceutical products and pharmaceutical preparations 0.929 0.917 1.044 Machinery and equipment n.e.c. 1.086 1.144 1.168 Forward Linkage (index)
Sector Germany US EU Chemicals and chemical products 0.970 1.794 1.581 Computer, electronic and optical products 0.800 0.918 0.773 Motor vehicles, trailers and semi-trailers 0.849 0.899 0.923 Basic pharmaceutical products and pharmaceutical preparations 0.614 0.688 0.632 Machinery and equipment n.e.c. 0.856 0.854 0.966 Share of sectoral value added relative to GDP (Vi)
Sector Germany US EU Chemicals and chemical products 1.21% 0.96% 0.94% Computer, electronic and optical products 0.84% 1.36% 0.61% Motor vehicles, trailers and semi-trailers 1.73% 0.39% 0.90% Basic pharmaceutical products and pharmaceutical preparations 0.64% 0.73% 0.62% Machinery and equipment n.e.c. 2.83% 0.75% 1.37%
Sum of sectors covered 7.25% 4.19% 4.44% Implied total weightA) (1+BL+FL)*Vi : - Chemicals and chemical products 3.65% 3.86% 3.55% - Computer, electronic and optical products 2.38% 3.80% 1.73% - Motor vehicles, trailers and semi-trailers 5.33% 1.27% 2.96% - Basic pharmaceutical products and pharmaceutical preparations 1.63% 1.90% 1.66% - Machinery and equipment n.e.c. 8.33% 2.25% 4.29%
Note: A) not corrected for sectoral overlap
All five observed sectors in the EU have strong backward linkage relative to other sectors within the EU economy. Moreover, the EU automotive sector has the strongest backward linkage within the EU economy. The EU chemical sector has both backward linkage and forward linkage greater than one. This means that the chemical sector has strong backward and forward linkage relative to other sectors in the EU economy. Basically, it is similar to the US chemical sector.
Table 1 also suggests that the machinery sector has a larger contribution to the GDP of Germany relative to the other four observed sectors. In fact, the contribution of the machinery sector to national GDP is the highest among German manufacturing sectors. A similar pattern is also found in the EU economy. The machinery sector has the highest contribution to the national GDP among the five observed sectors. Meanwhile, the US sectoral value added relative to GDP has a different pattern. The ICT manufacturing sector has the highest contribution to the national GDP among the five observed sectors.

16
The value of backward and forward linkage index reveals that all five observed sectors are important sectors for the US, the EU and German economies. However, it does not give us detailed information regarding the economic impact of the increasing export in particular sectors. Previous literature, such as Felbermayr et al. (2013) and Francois et al. (2013), have estimated that the implementation of TTIP will increase the export of both the US and the EU. Thus, we use a multiplier matrix which is calculated from the IO Table in order to measure the sectoral impact of TTIP on the German economy. Practically, we use the estimation of Felbermayr et al. (2013) regarding the possible impact of TTIP on German export (by sector) as the shock on IO multiplier matrix. Felbermayr et al. (2013) employed CGE analysis (MIRAGE model) by using GTAP 8 data set as its database. In the report they estimated the percentage changes of total German export - by sector - to the world after the implementation of TTIP (by assuming lower trade barriers). Before we use the estimation, we have to convert GTAP sector classification into NACE Rev.2 classification which is used in the IO Table. Since Felbermayr et al. (2013) only provided percentage changes, we firstly convert the percentage changes into monetary value. Then, we can calculate percentage changes of German export (by sector) based on NACE Rev.2 classification. However, before we proceed to the results, we firstly analyze the sectoral economic impact of higher export in each observed sector. We run five simulations by assuming that the export of each observed sector increase by 20 percent. In line with Erixon/Bauer (2010), it is reasonable to consider a simulation in which exports increase by 20 percent; a plausible approach would be to consider 2/3 of results obtained as realistic. By using IO multiplier matrix, we are able to estimate the impact on sectoral output. Furthermore, we also use the product of IO multiplier matrix and labor matrix in order to calculate the impact on sectoral employment.
Table 2: The impact of 20% increase in export of chemicals and chemical products in Germany
Sector ∆ Output
Chemicals and chemical products 16.42%
Advertising and market research services 1.21%
Mining and quarrying 1.20%
Coke and refined petroleum products 1.11%
Sewerage; waste collection, treatment and disposal activities; materials recovery; remediation activities and other waste management services
0.93%
Natural water; water treatment and supply services 0.72%
Repair and installation services of machinery and equipment 0.68%
Paper and paper products 0.67%
Electricity, gas, steam and air-conditioning 0.67%
Security and investigation services; services to buildings and landscape; office administrative, office support and other business support services
0.60%
Table 2 shows that the most affected sector due to higher export in the chemical sector is the chemical sector itself. A twenty percent increase in export is expected to raise the output of the chemical sector by 16.42 percent. The impact on other sectors is relatively small. There are only three sectors that experience an increase in output of more than 1 percent, namely the advertising and market research services sector, the mining and quarrying sector and the coke and refined
17
petroleum products sector. Important to note is that Table 2 present only 10 most affected sectors out of 62 sectors in the IO Table.
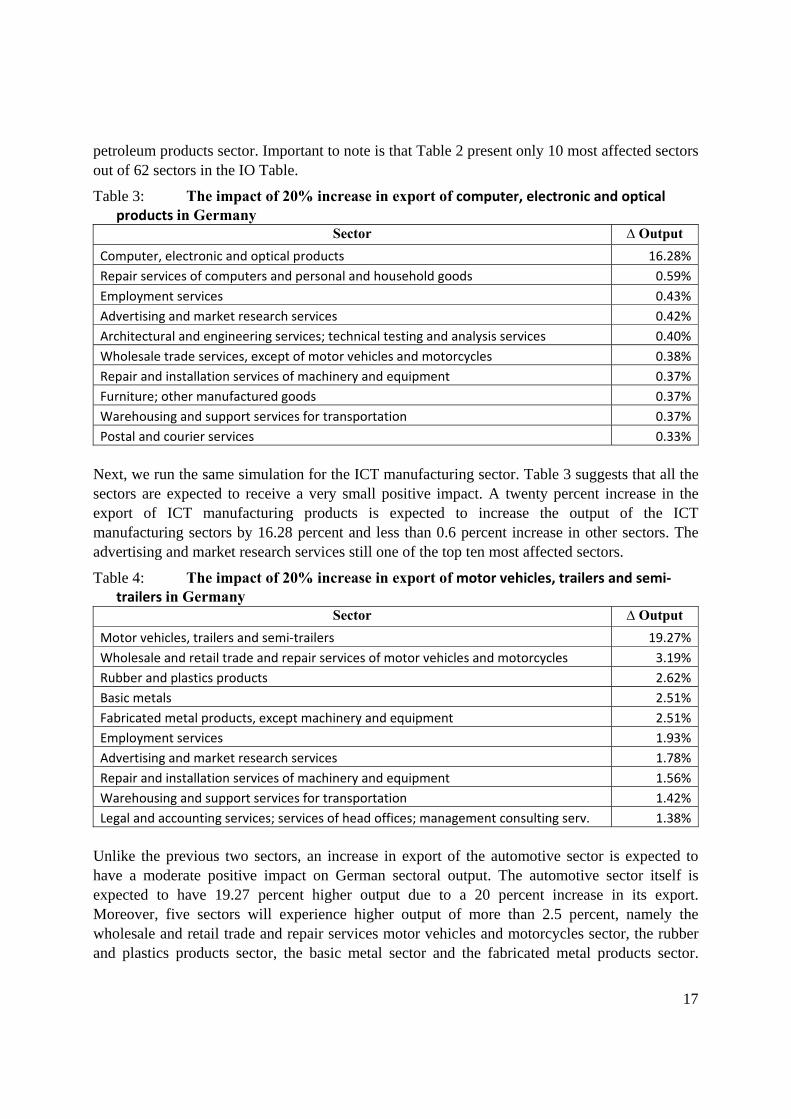
Table 3: The impact of 20% increase in export of computer, electronic and optical products in Germany
Sector ∆ Output
Computer, electronic and optical products 16.28%
Repair services of computers and personal and household goods 0.59%
Employment services 0.43%
Advertising and market research services 0.42%
Architectural and engineering services; technical testing and analysis services 0.40%
Wholesale trade services, except of motor vehicles and motorcycles 0.38%
Repair and installation services of machinery and equipment 0.37%
Furniture; other manufactured goods 0.37%
Warehousing and support services for transportation 0.37%
Postal and courier services 0.33%
Next, we run the same simulation for the ICT manufacturing sector. Table 3 suggests that all the sectors are expected to receive a very small positive impact. A twenty percent increase in the export of ICT manufacturing products is expected to increase the output of the ICT manufacturing sectors by 16.28 percent and less than 0.6 percent increase in other sectors. The advertising and market research services still one of the top ten most affected sectors.
Table 4: The impact of 20% increase in export of motor vehicles, trailers and semi‐trailers in Germany
Sector ∆ Output
Motor vehicles, trailers and semi‐trailers 19.27%
Wholesale and retail trade and repair services of motor vehicles and motorcycles 3.19%
Rubber and plastics products 2.62%
Basic metals 2.51%
Fabricated metal products, except machinery and equipment 2.51%
Employment services 1.93%
Advertising and market research services 1.78%
Repair and installation services of machinery and equipment 1.56%
Warehousing and support services for transportation 1.42%
Legal and accounting services; services of head offices; management consulting serv. 1.38%
Unlike the previous two sectors, an increase in export of the automotive sector is expected to have a moderate positive impact on German sectoral output. The automotive sector itself is expected to have 19.27 percent higher output due to a 20 percent increase in its export. Moreover, five sectors will experience higher output of more than 2.5 percent, namely the wholesale and retail trade and repair services motor vehicles and motorcycles sector, the rubber and plastics products sector, the basic metal sector and the fabricated metal products sector.

18
Interestingly, the advertising and market research services is also one of the ten most affected sectors.
Table 5: The impact of 20% increase in export of basic pharmaceutical products and pharmaceutical preparations in Germany
Sector ∆ Output
Basic pharmaceutical products and pharmaceutical preparations 19.31%
Scientific research and development services 1.18%
Sewerage; waste collection, treatment and disposal activities; materials recovery; remediation activities and other waste management services 0.66%
Advertising and market research services 0.58%
Employment services 0.30%
Paper and paper products 0.28%
Architectural and engineering services; technical testing and analysis services 0.22%
Rental and leasing services 0.20%
Security and investigation services; services to buildings and landscape; office administrative, office support and other business support services 0.17%
Legal and accounting services; services of head offices; management consulting serv. 0.16%
The impact of a twenty percent increase in export of pharmaceutical products is expected to have a large impact only on the pharmaceutical sector and relatively small impacts on other sectors (see Table 5). There is only one sector, the scientific research and development services sector, which is expected to increase by more than 1 percent. We found one common similarity between the four simulations. The advertising and market research services sector is always on the top ten most affected sectors. This means that all four observed sectors have a strong linkage with the advertising and market research services sector.
Similar with previous simulations, a twenty percent increase in export of machinery products is expected to have a significant impact on the machinery sector itself. Even though not as big as the impact of an increase in the export of automotive products, there are at least 7 sectors that are expected to have an increase of more than 1 percent in their output (see Table 6). Interestingly, the impact on the employment services sector is quite significant at more than 2 percent. It is similar with other simulations except for the first simulation (the chemical sector). However, the linkage of the machinery with the advertising and market research services is pretty weak since the sector is not on the top-ten list.
As previously mentioned, we also calculate the impact of each simulation on sectoral employment. Appendix 5 shows that a 20 percent increase in export of the German chemical sector is expected to create 129,327 new jobs across a number of sectors. Most of the new jobs are created in the chemical sector, followed by the security and investigation services sector. Interestingly, seven out of ten most affected sectors in terms of sectoral employment are services sectors. A similar impact can also be seen in the second simulation. A twenty percent increase in the export of the ICT manufacturing sector is expected to create about 115,972 new jobs. More

19
than half of the new jobs are created in the ICT manufacturing sector, followed by the wholesale trade services sector. There is only one manufacturing sector in the top ten most affected sectors, the fabricated metal products sector.
Table 6: The impact of 20% increase in export of machinery and equipment n.e.c. in Germany
Sector ∆ Output
Machinery and equipment n.e.c. 18.62%
Fabricated metal products, except machinery and equipment 2.76%
Employment services 2.19%
Basic metals 2.03%
Repair and installation services of machinery and equipment 1.72%
Rubber and plastics products 1.23%
Warehousing and support services for transportation 1.09%
Legal and accounting services; services of head offices; management consulting services 1.05%
Wholesale trade services, except of motor vehicles and motorcycles 0.92%
Electrical equipment 0.88%
Unlike the previous two sectors, an increase in export of the German automotive sector is expected to have a significant impact on job creation in the three manufacturing sectors, namely the automotive sector, the fabricated metal products sector, and the rubber and plastics products sector. In total, a twenty percent increase in export of the automotive sector will create 378,479 new jobs. In another simulation, a 20 percent increase in export of the pharmaceutical sector is expected to create 54,176 new jobs. It is significantly smaller than other simulations. Lastly, a 20 percent increase in export of the machinery sector is expected to create 359,154 new jobs. However we should be cautious to compare the results of those four simulations. In the simulation we use 20 percent of current export as the shock. Thus, 20 percent increase in export of the automotive sector (31,523 million Euros) is significantly larger than 20 percent increase in export of the pharmaceutical sector (5,767 million Euros).
To sum up, the results of five simulations which are presented in Appendix 5 suggest that the wholesale and retail trade sector and several services sectors are expected to experience a relatively significant positive impact if any of those five sector experiences higher export. The magnitude of the impact does not depend solely on the linkage between the four observed sectors but also depends on the character of the sector itself (whether the sector is a labor-intensive or capital intensive sector).
Finally, Appendix 6 shows the impact of TTIP on German sectoral output and employment. In this simulation we use the estimation of Felbermayr et al. (2013) as the shock in our IO multiplier matrix. Based on Felbermayr et al. (2013) estimation, the export of the chemical sector, the petrochemical sector, the automotive sector and the machinery sector is estimated to increase by 0.92 percent, 0.92 percent, 1.65 percent and 0.82 percent respectively. Meanwhile, the export of the ICT manufacturing sector is estimated to decrease (-0.35 percent). The detailed

20
estimation can be seen in Felbermayr et al. (2013) page 115. The export growth considered by Felbermayr et al. (2013) is rather modest.
Table 7 shows the impact of TTIP on the output and employment of German selected sectors. The automotive sector is expected to receive the largest positive impact among the sectors observed in terms of output and employment. In fact, the automotive sector is expected to experience the largest impact (both in terms of output and employment) relative to other sectors in German economy. The output of the automotive sector is expected to increase by 1.60 percent. Moreover, the total number of new jobs that are created in this sector is estimated to be as high as 13,262 which is equal to 37 percent of total new jobs created in all sectors due to TTIP agreement.
Table 7: The impact of an increase in exports due to TTIP agreement on German sectoral output and labor (selected sector); implications of export growth based on Felbermayr et al. (2013)
Sector ∆ Output
∆ Labor
Chemicals and chemical products 0.84% 2,805
Computer, electronic and optical products ‐0.17% ‐676
Motor vehicles, trailers and semi‐trailers 1.60% 13,262
Basic pharmaceutical products and pharmaceutical preparations 0.88% 1,100
Machinery and equipment n.e.c. 0.80% 8,308
Total (all sector)b) 0.23% 35,971 Note: b) Important to note that changes in output for all sector is not equal to changes in GDP since IO analysis is subject to multiple counting
Three other observed sectors, namely the automotive sector, pharmaceutical sector and the machinery sector are also experiencing positive impact. Output will increase by 0.84 percent, 0.88 percent and 0.80 percent respectively. Even though the impact on those three sectors is small in magnitude, those three sectors are among the top ten most affected sectors. In terms of sectoral employment, an increase in sectoral export due to TTIP will create 2,805 new jobs in the chemical sector, 1,100 new jobs in the pharmaceutical sector, and 8,308 new jobs in the machinery sector. In contrast, the ICT manufacturing sector is expected to experience a slow-down in its output by as much as 1.60 percent. It is also predicted that about 676 people in the ICT manufacturing sector will lose their jobs.
Up to this point, we have underlined several aspects that will determine the magnitude of the impact of TTIP on German sectoral output and employment. The first aspect is the proportion of the imported intermediate inputs which is used by the sector. If the sector has a large proportion of imported intermediate input, some of the positive impact of TTIP will benefit other countries which produced intermediate inputs for the sector. The second aspect is the linkage between sectors in the economy. If the sector that experiences a significant increase in export due to TTIP has a strong linkage with other important sectors in the economy, the aggregate impact is
expectedmagnitushould astatistic
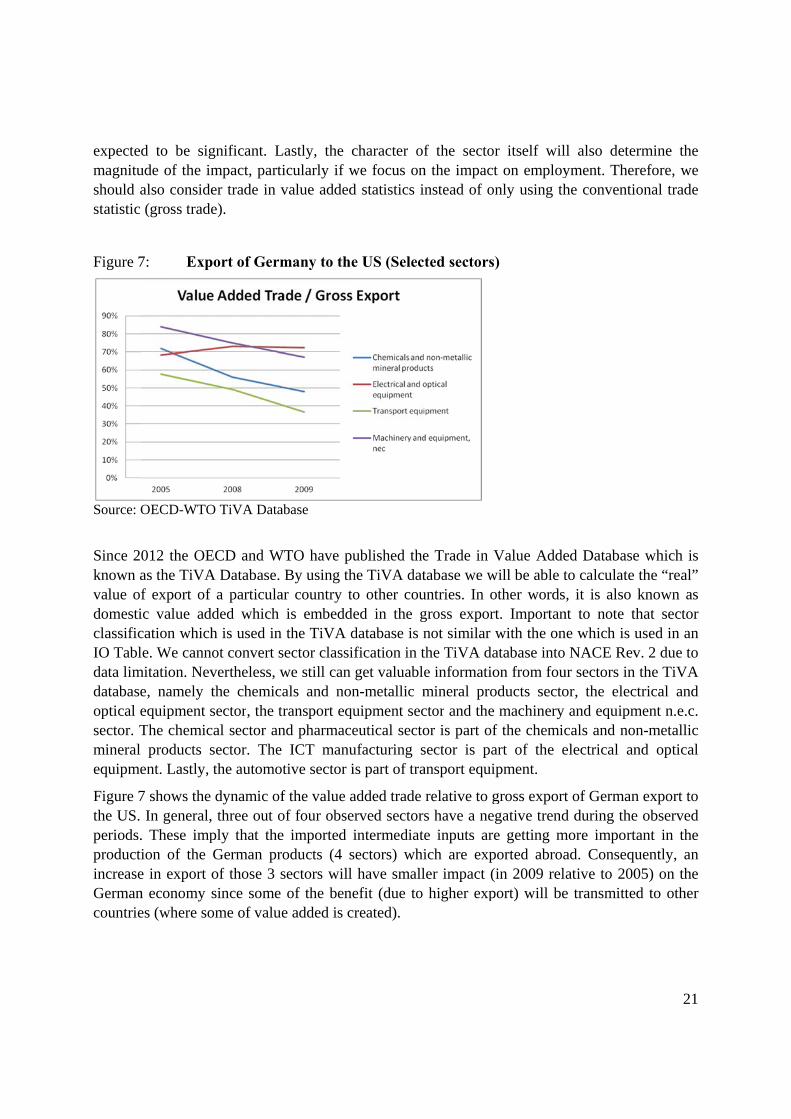
Figure 7
Source: O
Since 2known avalue ofdomesticlassificIO Tabldata limdatabaseoptical esector. Tmineral equipme
Figure 7the US. periods.productiincreaseGermancountrie
d to be sigude of the imalso conside(gross trade
7: Exp
OECD-WTO
012 the OEas the TiVAf export of ic value adcation whichle. We cann
mitation. Neve, namely tequipment sThe chemic
products sent. Lastly,
7 shows the In general,
. These impion of the e in export on economy ses (where so
gnificant. Lmpact, partier trade in ve).
port of Germ
O TiVA Data
ECD and WA Database. f a particuladed which h is used in ot convert svertheless, wthe chemicasector, the tcal sector ansector. The the automo
dynamic of three out oply that theGerman proof those 3 ssince some
ome of value
Lastly, the cicularly if wvalue added
many to the
abase
WTO have puBy using th
ar country tois embeddthe TiVA d
sector classiwe still can als and nontransport eqund pharmace
ICT manutive sector i
f the value aof four obsee imported oducts (4 ssectors will of the bene
e added is c
character owe focus ond statistics i
e US (Selec
ublished thehe TiVA dato other coued in the gdatabase is nification in tget valuabln-metallic muipment seceutical sectoufacturing sis part of tra
added trade erved sectorintermediat
sectors) whihave small
efit (due to created).
f the secton the impactinstead of o
cted sectors
e Trade in Vtabase we wuntries. In ogross expornot similar the TiVA dae informatiomineral proctor and theor is part ofsector is paansport equi
relative to gs have a nee inputs areich are expler impact (higher exp
r itself wilt on employnly using th
)
Value Addewill be able tother wordsrt. Importanwith the onatabase intoon from fouoducts secto machinery f the chemicart of the eipment.
gross exportgative trende getting m
ported abroa(in 2009 relport) will be
ll also deteyment. Therhe conventi
ed Databaseto calculate , it is also
nt to note thne which is u NACE Rev
ur sectors in or, the elecand equipm
cals and nonelectrical an
t of Germand during the
more importad. Consequative to 200e transmitte
21
rmine the refore, we onal trade
e which is the “real” known as hat sector used in an v. 2 due to the TiVA
ctrical and ment n.e.c. n-metallic nd optical
n export to e observed tant in the uently, an 05) on the d to other

Figure 8
Source: O
Unlike added tradded trmetallicequipmeabsorbe
Table 8US $
Chemic
Electric
Transpo
Machin
Source: O
Table 8trade insectors with its trade in i.e. the surplus time.
8: Exp
OECD-WTO
Germany, arade relativerade relativ
c mineral pent, n.e.c., sd mostly by
: Tra$
Trade B
cals & non-m
cal & optical
ort equipmen
nery and equi
OECD-WTO
presents thn value adde
and all obstrading parvalue addemachinery trade balan
port of the U
O TiVA Data
all observede to gross e
ve to gross products sesector. Thesy the US eco
de Balance
Balance
metallic miner
equipment
nt
ipment, n.e.c
O TiVA Data
he comparised. Generalserved periortner, the USed. Germany
and equipnce in the m
US to Germ
abase
d sectors in export. Furthexport in th
ector, the tse imply thaonomy.
e between G
20
ral pr. 966
-143
572
c. 149
abase
son of tradely, based onods (except S. Howevery has surplu
pment n.e.c.machinery a
many (Selec
the US arehermore, ththree observtransport eqat the positi
Germany an
Gross T
005 2008
6.2 6643.
35.7 1480.
8 10910
33.2 16758
e balance wn gross trad2005 for t
, the pictureus trade bala. sector. Mand equipme
cted sectors
e quite stabhere is a sligved sectors,quipment sive impact o
nd the US (
Trade
8 2009
1 2269.9
2 1329.8
0.9 5232.6
8.2 10086.2
which is calcde, Germanthe electricae will be comance only in
Moreover, it ent n.e.c. se
)
le in terms ght increase, namely thsector, and of an increa
selected sec
Trade
2005
5976.3
-3561.5
2589.8
2 13036.2
culated baseny has a sural and opticmpletely difn one sectoralso sugge
ector has be
of the ratioe in the ratiohe chemical
the machiase in expor
ctors); mill
e in Value A
2008
-848
-1716.1
4766
12765.2
ed on gross rplus trade ical equipmefferent if wer all observests that theeen diminis
22
o of value o of value and non-
inery and rts will be
ions of
Added
2009
-3873.9
-855.2
-576.9
6391.5
trade and in all four ent sector) e consider ed period, e German shing over

23
3. Machinery & Equipment Sector and FDI Perspectives
There are some particular aspects of the sector machinery and equipment (n.e.c.) - and to some extent also for the ICT equipment sector:
* Part of the machinery and equipment sector, namely the production of highly specialized high-tech machinery and equipment may be dubbed an immobile Schumpeterian sector (Klodt, 1992): It is rather technology intensive, but since production and R&D activities have to be in the same location this sector is not really footloose internationally so that production is rarely relocated across borders (it is not really clear how large the share of investment production in various OECD countries this is). This implies a special advantage for countries which have successfully specialized in machinery and equipment production – and particularly in this niche, one will face rather limited competition and Schumpeterian rents might be considerable.
* The international specialization in the production of machinery and equipment is rather distinct if one takes the share of the sector’s output in GDP: Taking a look at the pre-crisis year 2007 the OECD country with the highest share of investment goods production (broadly defined) to GDP is the Republic of Korea which recorded a share of 18.1%, followed by Germany, Japan, Sweden, Austria and Switzerland with 14.8%, 11.6%, 11.0%, 10.6% and 10.1%, respectively. The shares of Italy, Spain, Belgium, Denmark, France, Ireland and the US reached 9.2%, 6.3%, 6.2%, 6.2%, 5.9%, 5.9% and 5.4%, respectively (the figures for Luxembourg, the UK, the Netherlands, Portugal and Greece were 5.1%, 5.0%, 4.7%, 4.0% and 2.5%, respectively; IWD (2013, p.3)). By this token Germany, Sweden and Austria are strongly specialized in the production of machinery and equipment in the EU, the share in US output is only about 1/3rd of that in Germany. The sectoral trade balance in machinery and equipment relative to GDP was 10.8% in the Republic of Korea, 9.5% and 7.5% in Germany and Japan, respectively; the figures for Sweden, Austria and Switzerland were 2.8%, 3.0% and 2.6%, respectively. The US had a sectoral current account deficit of 2% of GDP and this amounted to ½ of the overall trade balance deficit and 2/5ths of the current account deficit. Germany’s transatlantic sectoral trade balance in machinery and equipment was quite large (Table 8) in 2005/08, it fell in 2009 in the aftermath of the US recession in 2008/09. This picture does not change much if we switch from gross trade figures to sectoral value added exports and imports: Germany has a large surplus vis-à-vis the US. We therefore expect particular gains in the US-bound export of this sector once a transatlantic trade and investment partnership has been established; there should also be secondary growth impulses for this important sector in Germany since TTIP-generated output growth in other EU countries also is poised to stimulate Germany’s export in the sector of machinery and equipment.
* The share of machinery and equipment (n.e.c) in domestic intermediate inputs in this sector in Germany reached 20.3% in 2009; this shows that a large part of intermediate input is from this very sector itself (it is noteworthy that in the EU the share of this sector as an intermediate domestic input source was also rather high in the EU, namely 17.1%; see on these figures and the following data the set of statistics in the Appendix 4). Fabricated metal products and wholesale

24
trade services reached 9.7% and 6.7% within the bloc of domestic intermediate inputs. Imported intermediate inputs of machinery and equipment (n.e.c) reached 9.4% for Germany. By contrast, the US machinery and equipment sector has a different intermediate input structure: On the domestic intermediate input side fabricated metal products reached 14.3%, basic metals 11.5% and machinery and equipment (n.e.c) 9.4% which is just about ½ of the respective share of the same sector in Germany. Imported intermediate inputs recorded a share of 3.3% of basic metals and 2.9% for machinery and equipment in the case of the US. Germany’s machinery and equipment sector thus is larger – relative to GDP – and it is relying more on intra-industry intermediate domestic inputs than the respective counterpart sector in the US. It seems that Germany’s machinery and equipment sector is more important and more successful on the basis of this rather sophisticated supplier structure than its US counterpart. By contrast the US is a rather successful net exporter of electrical and optical equipment as the negative sectoral trade balance – based on value-added exports and imports – shows for 2005, 2008 and 2009.
Among the few Asian countries that clearly stand to benefit from TTIP is the Republic of Korea since it has concluded a Free Trade Agreement with both the US and the EU. Moreover, as the share of machinery production in Korea’s GDP is so high and its sectoral trade balance surplus so big one may anticipate favorable sectoral trade creation effects between “USAEU” (US+EU) and Korea. To the extent that the information and communication technology sector and machinery & equipment stand for ample opportunities for cross innovation, Korea, with its large ICT sector, might enjoy particular benefits in the long run. The composition of the FDI stock gives information about particular strengths of sectors.
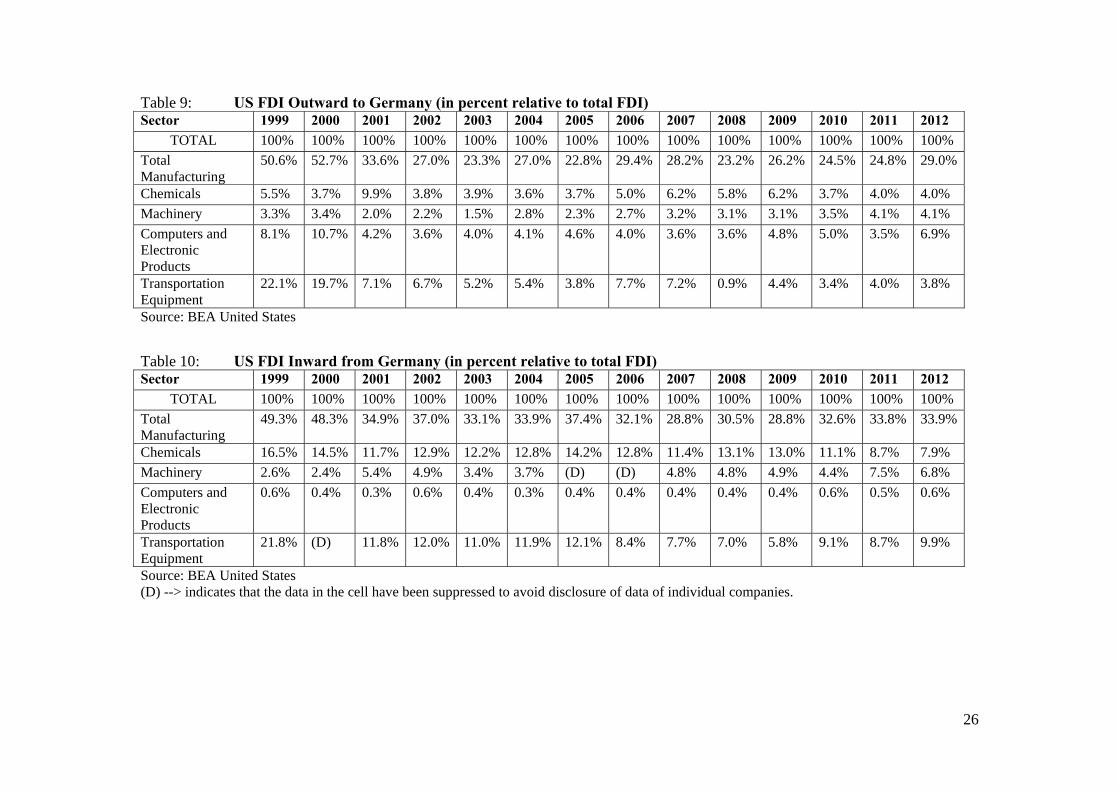
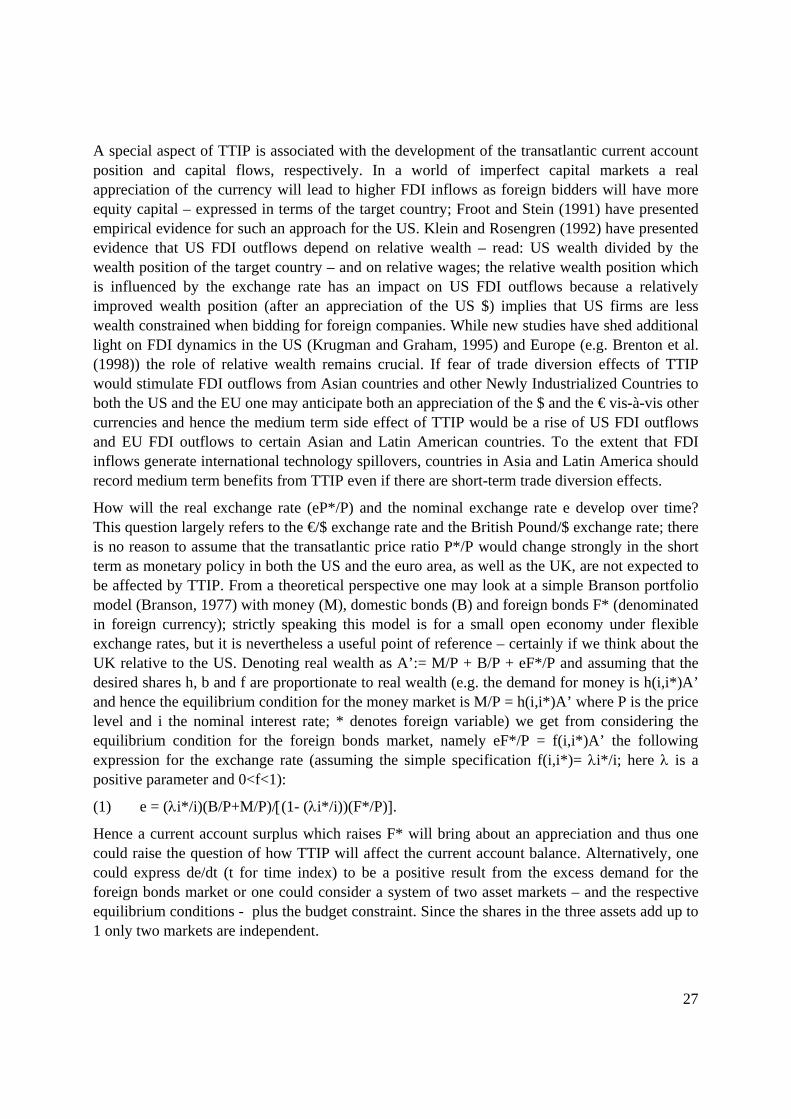
The share of Germany’s machinery and equipment sector’s FDI stock in the US was 7.5% in 2011 and 6.8% in 2012. The share of the US counterpart sector’s FDI stock in Germany was lower: it reached 4% in both years. Non-electrical machinery is a rather immobile Schumpeterian industry so that only part of the machinery and equipment sector is internationally mobile. As regards Germany’s FDI position in the US the share was 8.7% and 7.9% in chemicals in 2011/2012, in transportation equipment (motor vehicles etc.) it stood at 8.7% and 9.9%; by contrast FDI in the sector computers and electronic products was 0.5 and 0.6%, respectively – this latter sector thus stands for a rather weak international position of a particular German industry. As regards the US FDI position in Germany this sector was rather strong since computers and electronic products stood for 3.5% and 6.9% in 2011 and 2012, respectively. US Transportation equipment recorded shares of 4.0% and 3.8%, respectively; the US chemicals’ share of FDI stock figures was 4% in both years in Germany. As NTBs and tariffs are expected to be reduced one may assume that transatlantic FDI will reduce transitorily since the incentive for tariff-jumping through FDI is weakened. However, in the long run transatlantic FDI is expected to increase for several reasons:
In knowledge-intensive and technology-intensive industries the prospects for enhanced competition in technology-intensive industries reinforce the motivation for asset-seeking FDI.

25
Several industries are characterized by a rather oligopolistic structure so that reaction interdependence in FDI and mutual invasion headquarter countries and key markets may be expected.
With the share of knowledge-intensive and technology-intensive sectors in total output expanding on both sides of the Atlantic one may expect more outward FDI that is reflecting ownership-specific advantages.
Judging the relative strength of a sector by the relative FDI share one may assume that Germany’s automotive sector and machinery & equipment sector are strongly positioned and thus these sectors could particularly generate benefits from TTIP for Germany’s gross national income growth. Indeed, when it comes to economic welfare analysis one would not naturally look at gross domestic product, rather GNP has to be considered which includes the net international profits accruing from abroad. Since the ICT sector of the US is so strong in Germany (and the EU) one may argue that different sectors stand to benefit from TTIP on the basis of FDI: There are good prospects for US companies in the ICT sector to generate considerable profits through German/EU subsidiaries, Germany’s strong points are the automotive and machinery & equipment sectors and the chemicals sector stands for a potential winner on both sides of the Atlantic. If transatlantic exports of the US and Germany should increase one may anticipate that firms in the US will consider more international outsourcing and offshoring within NAFTA and German firms will focus on additional opportunities for (mainly) outsourcing and offshoring on an intra-EU basis.
26
Table 9: US FDI Outward to Germany (in percent relative to total FDI) Sector 1999 2000 2001 2002 2003 2004 2005 2006 2007 2008 2009 2010 2011 2012
TOTAL 100% 100% 100% 100% 100% 100% 100% 100% 100% 100% 100% 100% 100% 100%
Total Manufacturing
50.6% 52.7% 33.6% 27.0% 23.3% 27.0% 22.8% 29.4% 28.2% 23.2% 26.2% 24.5% 24.8% 29.0%
Chemicals 5.5% 3.7% 9.9% 3.8% 3.9% 3.6% 3.7% 5.0% 6.2% 5.8% 6.2% 3.7% 4.0% 4.0%
Machinery 3.3% 3.4% 2.0% 2.2% 1.5% 2.8% 2.3% 2.7% 3.2% 3.1% 3.1% 3.5% 4.1% 4.1%
Computers and Electronic Products
8.1% 10.7% 4.2% 3.6% 4.0% 4.1% 4.6% 4.0% 3.6% 3.6% 4.8% 5.0% 3.5% 6.9%
Transportation Equipment
22.1% 19.7% 7.1% 6.7% 5.2% 5.4% 3.8% 7.7% 7.2% 0.9% 4.4% 3.4% 4.0% 3.8%
Source: BEA United States
Table 10: US FDI Inward from Germany (in percent relative to total FDI) Sector 1999 2000 2001 2002 2003 2004 2005 2006 2007 2008 2009 2010 2011 2012
TOTAL 100% 100% 100% 100% 100% 100% 100% 100% 100% 100% 100% 100% 100% 100%
Total Manufacturing
49.3% 48.3% 34.9% 37.0% 33.1% 33.9% 37.4% 32.1% 28.8% 30.5% 28.8% 32.6% 33.8% 33.9%
Chemicals 16.5% 14.5% 11.7% 12.9% 12.2% 12.8% 14.2% 12.8% 11.4% 13.1% 13.0% 11.1% 8.7% 7.9%
Machinery 2.6% 2.4% 5.4% 4.9% 3.4% 3.7% (D) (D) 4.8% 4.8% 4.9% 4.4% 7.5% 6.8%
Computers and Electronic Products
0.6% 0.4% 0.3% 0.6% 0.4% 0.3% 0.4% 0.4% 0.4% 0.4% 0.4% 0.6% 0.5% 0.6%
Transportation Equipment
21.8% (D) 11.8% 12.0% 11.0% 11.9% 12.1% 8.4% 7.7% 7.0% 5.8% 9.1% 8.7% 9.9%
Source: BEA United States (D) --> indicates that the data in the cell have been suppressed to avoid disclosure of data of individual companies.
27
A special aspect of TTIP is associated with the development of the transatlantic current account position and capital flows, respectively. In a world of imperfect capital markets a real appreciation of the currency will lead to higher FDI inflows as foreign bidders will have more equity capital – expressed in terms of the target country; Froot and Stein (1991) have presented empirical evidence for such an approach for the US. Klein and Rosengren (1992) have presented evidence that US FDI outflows depend on relative wealth – read: US wealth divided by the wealth position of the target country – and on relative wages; the relative wealth position which is influenced by the exchange rate has an impact on US FDI outflows because a relatively improved wealth position (after an appreciation of the US $) implies that US firms are less wealth constrained when bidding for foreign companies. While new studies have shed additional light on FDI dynamics in the US (Krugman and Graham, 1995) and Europe (e.g. Brenton et al. (1998)) the role of relative wealth remains crucial. If fear of trade diversion effects of TTIP would stimulate FDI outflows from Asian countries and other Newly Industrialized Countries to both the US and the EU one may anticipate both an appreciation of the $ and the € vis-à-vis other currencies and hence the medium term side effect of TTIP would be a rise of US FDI outflows and EU FDI outflows to certain Asian and Latin American countries. To the extent that FDI inflows generate international technology spillovers, countries in Asia and Latin America should record medium term benefits from TTIP even if there are short-term trade diversion effects.
How will the real exchange rate (eP*/P) and the nominal exchange rate e develop over time? This question largely refers to the €/$ exchange rate and the British Pound/$ exchange rate; there is no reason to assume that the transatlantic price ratio P*/P would change strongly in the short term as monetary policy in both the US and the euro area, as well as the UK, are not expected to be affected by TTIP. From a theoretical perspective one may look at a simple Branson portfolio model (Branson, 1977) with money (M), domestic bonds (B) and foreign bonds F* (denominated in foreign currency); strictly speaking this model is for a small open economy under flexible exchange rates, but it is nevertheless a useful point of reference – certainly if we think about the UK relative to the US. Denoting real wealth as A’:= M/P + B/P + eF*/P and assuming that the desired shares h, b and f are proportionate to real wealth (e.g. the demand for money is h(i,i*)A’ and hence the equilibrium condition for the money market is M/P = h(i,i*)A’ where P is the price level and i the nominal interest rate; * denotes foreign variable) we get from considering the equilibrium condition for the foreign bonds market, namely eF*/P = f(i,i*)A’ the following expression for the exchange rate (assuming the simple specification f(i,i*)= i*/i; here is a positive parameter and 0<f<1):
(1) e = (i*/i)(B/P+M/P)/(1- (i*/i))(F*/P).
Hence a current account surplus which raises F* will bring about an appreciation and thus one could raise the question of how TTIP will affect the current account balance. Alternatively, one could express de/dt (t for time index) to be a positive result from the excess demand for the foreign bonds market or one could consider a system of two asset markets – and the respective equilibrium conditions - plus the budget constraint. Since the shares in the three assets add up to 1 only two markets are independent.

28
The bilateral current account position of the euro area vis-à-vis the US is positive and if TTIP reinforces this we will see a short-term appreciation of the euro; with given price levels in the euro area and the US we have a real appreciation of the euro which will dampen the current account surplus of the euro area. In line with the Froot-Stein argument it holds that a real appreciation of the euro will stimulate FDI outflows from the euro area to the US. Looking at a medium term perspective of the exchange rate – and disregarding a broad modelling analysis – one may consider a setting with two-way foreign direct investment flows: Net FDI inflows are assumed to be proportionate to the ratio of the marginal product of capital in the home country (euro area) to the marginal product abroad (US); and for simplicity this is the only type of international capital flows considered here. Assuming that both countries produce with capital K, knowledge A and labor L, namely according to Y=Kß(AL)1-ß and abroad according to Y*=K*ß*(A*L*)1-ß*, we can state on the basis of an import function J= jY/q* and an export function X= xY*q* the equilibrium condition for the foreign exchange market (q*:=eP*/P; Y is GDP; ’>0; 0<ß<1; j>0, x>0; * denotes foreign variables):
(2) ’ (ßY/K)/(ß*Y*/K*) = jY/(xY*q*)
For the sake of simplicity the elasticity of imports with respect to the real exchange rate has been assumed to be -1 and that of exports with respect to q* is +1 so that the Marshall Lerner condition is fulfilled. Note that real imports in domestic goods units are q*J= jY; however, a more refined approach would consider that exports in a world with FDI are not a function of gross domestic product Y but of gross national income Z (Welfens, 2011; if denotes the share of capital owned by foreign investors we can write in a setup with competitive markets Z= Y(1-*ß) + ß*Y*q* and Z*= Y*(1-ß*) + *ßY/q*. The result that we get in the simple setting is as follows for q*:
(3) q* := jß*(K/K*)/(’xß)
If TTIP brings about a rise of ’ so that foreign investors react more strongly to transatlantic differences in the marginal product of capital there will be a real depreciation of the currency and this also holds if ß*/ß or K/K* is rising. Note that we can replace K/K* by (k’/k’*)(AL)/(A*L*) - with k’:= K/(AL) – and k’ and k’* could be determined within an international neoclassical growth model; let us recall (with denoting the income tax rate): if savings S=s(1-)Y and the growth rate of the population is n, the growth rate of knowledge is a and the rate of capital depreciation is we obtain in a closed economy for the steady state value k’#:= (s(1-)/(a+n+))1/(1-ß). In this perspective one has to raise the question of whether or not TTIP will affect the savings rate and the income tax rate in the EU or the US and to what extent the progress rates a and a* will change; adequate endogenous growth approaches could be useful here and with FDI increasing relative to GDP the size of international technology spillovers are expected to increase. An interesting perspective is raised by considering a simple endogenous modelling of total factor productivity growth (Welfens, 2014): Assume that we have the following specification (with j’ denoting the share of imported intermediates J’ relative to Y, x is the share of exported goods relative to X and is the share of capital ownership of foreign investors in country I (home country), s’ is a measure of intra-industrial trade intensity (Grubel-
29
Lloyd index); j”, x’, ’, ’* and s” are positive parameters and a0 is the exogenous progress rate):
(4) a= a0 + j”j’ + x’x + ’ + ’** + s”s’
The idea behind that equation is that intermediate imports will contain embodied knowledge and this is indeed a crucial aspect for trade expansion between leading OECD countries. A rise of x in turn requires increasing specialization in combination with more product differentiation that in turn goes along with a higher rate of technological progress. The higher the share of foreign investors in the capital stock, the more international technology transfer takes place through cumulated FDI inflows. The higher the share of capital owned abroad the larger the opportunity for positive technology spillovers in the foreign host country – subsidiaries will benefit from intra-sectoral or cross-sectoral technology spillovers abroad and part of the new knowledge will be transferred to the country in which the parent company is located. A higher intensity of intra-industrial trade generates pressure for firms to embark in increasingly technological and knowledge-intensive production and thus to contribute to a higher aggregate rate of technological progress.
The progress rate thus has been decomposed in exogenous right-hand side elements and taking this into account in y’#:= (s(1-)/(a+n+))ß/(1-ß) implies that a rise of a in the steady state at a point of time t’ implies a short-term fall of the level of the growth rate and per capita income y (and of y’) and a permanent increase of the growth rate of y’ and y, respectively. TTIP could raise the share of foreign ownership in the capital stock in both the EU (rise of ) and in the US (rise of *) and j’, x and s’ are also likely to increase in the EU. An analogous equation can be stated for the foreign country (read the US).
It is interesting to focus on the impact of TTIP on foreign direct investment. As Barrell/Pain (1997) have shown for FDI of Germany and the UK, knowledge-based assets of the host country – read: patents – play a positive role for foreign direct investment; moreover, the GDP of the host country and the relative low-cost position have a positive impact. To the extent that TTIP stimulates innovation dynamics in the EU we thus should expect higher FDI inflows in Europe (and in the USA, too). Barrell/Pain emphasize that the EU single market program has raised intra-EU FDI by about 0.5% of GDP; moreover, their analysis shows that a 1% rise of the FDI stock in the manufacturing sector raises the rate of technological progress by 0.26% in the UK and by 0.27% in Germany – by contrast FDI inflows in non-manufacturing in the UK had no effect on technological progress. Finally, Barrel/Pain show that export demand of the UK, Germany, France and Sweden are negatively affected by net outward FDI stocks: the elasticity is rather even across countries and is close to -0.15%. Export demand is positively affected by the relative patent position of domestic producers relative to the weighted average of competitors’ patents. The FDI dynamics of TTIP thus deserve more attention in future research.
One should not rule out that the savings rate in both the US and the EU will fall in a more integrated transatlantic financial market so that the level of the growth path could fall, however, one will also have to analyse whether or not the availability of risk capital for relatively technology intensive sectors – such as pharmaceuticals, chemicals, automotive, ICT and machinery & equipment – will improve in Europe.

30
As regards the employment effect of a 20% increase of exports in the five sectors considered, the Appendix 5 shows for Germany an increase in the chemicals sector of 129 000 – of which 55 000 are in the chemicals sector itself; a rise of the number of jobs in the ICT producing sector of 116 000– of which 65 000 are in the ICT sector itself; a rise of 378 000 in the automotive sector – of which 160 000 are in that sector itself; a rise of 54 000 in the pharmaceuticals sector of which 24 000 are in that sector itself; and a rise of 359 000 jobs in the sector machinery and equipment (n.e.c.) of which 194 000 are in that sector itself. This adds up to an impressive sum of 836 000 which would reduce Germany’s unemployment figure from about 3 million in 2013 to about 2 million, roughly the equivalent of full employment. However, there are three caveats with this figure: (i) if imports in these sectors should also strongly increase it could happen that the net employment effect is indeed smaller. (ii) the number 836 000 could be achieved within a decade or so and this implies that the annual increase of jobs will be less impressive. (iii) if the plus of 836 000 largely represents an increase in the demand of skilled labor the rising demand for skilled workers could considerably raise the real wage of skilled workers. Moreover, there could be a real appreciation and this could dampen net exports of goods and services and employment growth, respectively. As regards aggregate employment effects it should be emphasized that only broader macroeconomic modelling can shed a true spotlight on the employment effects.
As regards the Schumpeterian innovation dynamics one may point out that input output analysis shows that the share of research services imported is very small in intermediate supplies (see Appendix 12). Only defense and education show imported scientific services to a considerable extent, while human health services stand for some minor imports. As regards domestic scientific services as inputs only a few sectors are relevant in Germany, the EU and the US; so much R&D is in-house.
31
4. Policy Issues
TTIP will not only concern trade, but will also address the issue of protectionism behind borders, for example the rules of origin, subsidies, regulations, government procurement and the role of state-owned enterprises. However, there also is a broader issue which is partly related to trade but also to the field of investment protection which will also be part of TTIP. The legal standards and approaches in the US differ considerably from European traditions and it will be quite interesting to which extent the transatlantic market will be more determined by US legal approaches or by EU legal standards. From the input output analysis for US sectors (see Appendix 2) one can take an important fact: Legal services plus controlling represents in all US sectors – with the exception of machinery & equipment (n.e.c) – a considerable activity among the domestic intermediate inputs; by contrast in none of the EU sectors does this activity play a major role. While we cannot make a simple split between legal services and controlling services one may state the hypothesis that the figures indicate that in the US institutional framework legal services play a much larger role than in Germany and the EU, respectively. Hence if in the future – within the context of TTIP - the US institutional framework would effectively become increasingly applied in Europe one may anticipate additional costs for European firms and new business opportunities in Europe for leading US law firms. This is a point that EU negotiators should carefully take into consideration and given the different legal approaches on both sides of the Atlantic it could be difficult to formulate a consistent compromise.
Assuming that TTIP will mainly stimulate the expansion of technology-intensive and knowledge-intensive sectors in the US and the EU it is clear that the optimization of schooling, vocational training and education should be high on the agenda of national policymakers. Here many continental EU countries face the problem that almost all universities are in the hands of government and the political system – and this is favoring populist solutions and institutional arrangements; for example in Germany since 2013 the previous introduction of annual tuition fees of up to € 1000 in public universities in several states was dropped and this is likely to lengthen the number years needed to complete a degree and it also undermines prospects of putting more resources into the education sector in a period in which the share of skilled labor should be increased in an efficient way. Countries with a mixture of private and public universities – such as the USA or Australia – seem to be better positioned to respond on the labor supply side to the challenges of ongoing economic globalization.
For Germany there will be a considerable challenge in the field of skilled labor since the simulations have shown a strong increase of new jobs in all sectors considered; the only sectors in which unskilled workers also play some role are the chemical industry and the automotive industry; moreover, one may assume that enhanced transatlantic competition in an integrated transatlantic market will encourage firms in Germany to engage more in international outsourcing and offshoring with the EU and this will reduce the demand for unskilled labor and raise the demand for skilled labor in Germany (in this respect TTIP labor market dynamics should be similar to those observed in the context of the creation of the EU single market). This
32
view is much in contrast with IFO (2013) where the authors argue that in the context of TTIP wages of unskilled workers will increase more than wages of skilled workers in Germany.
In a more competitive transatlantic market innovation dynamics will play an increasing role and thus the optimization of innovation systems in Europe and the US could come on to the political agenda. In the EU there is – compared to the US - not only a problem with respect to a sufficient availability of risk capital. Several EU countries have also been suffering from a lack of FDI inflows over many years, for example FDI inflows into Italy, Spain, Portugal, Greece and several eastern European EU countries have been rather low. Given the fact that TTIP will bring temporary trade diversion at the expense of firms in Asia, Africa and Latin America one may anticipate that the EU and the US will benefit from rising FDI inflows: i.e. foreign investors from Asia will increasingly use FDI in the EU and in the US as a means of jumping over tariffs or non-tariff barriers. If such inflows from third countries should be very asymmetric and generate benefits mainly in northern EU countries there could be a rising economic divergence within the EU. The current Europe 2020 agenda of the European Commission has focused on raising R&D expenditures relative to GDP and on progress in the field of environmental sustainability. However, key aspects of a more intensified quest for mobile capital and global FDI, respectively, have not been considered so far.
A key problem in the field of investment protection could occur once new rules are implemented that give firms broader opportunities to take governments to court for normal government action. Vattenfall, a Swedish energy multinational operating in many EU countries, has taken the German government to court over the energy U-turn of the German government – along with the German Parliament – after the Fukushima accident, in an attempt to claim € 3.7 bill. in compensation from the government as Vattenfall’s nuclear power plants will have to stop energy production by the end of 2022 at the latest; this court case has emerged in the context of the European Energy Charter which gives investor protection to European companies. There is not much doubt that MNCs from the US and Europe will push for favorable investor protection rules under TTIP. International investment treaties were mainly implemented in relations with developing countries whose legal systems seemed to be rather weak or not very reliable. Here, in the 1960s and 1970s, European countries often pushed for such treaties and later the US followed along the same lines. Dispute panels are likely to be adopted for cases of conflict in investor protection and it is not really clear that such out-of-court jurisdiction will be transparent and fair.
Since the ICT sector is of key importance for innovation dynamics and economic growth, respectively, one may argue that governments in the US and the EU will have an incentive to stimulate digital dynamics even more strongly than in previous decades. Part of the economic policy impulse comes from regulation of telecommunications. The digital communication market is the most obvious market that is truly global and one might at least consider some form of transatlantic joint regulation. In this respect the EU is at a disadvantage since despite the opening up of telecommunications markets in 1998 the interaction of supranational framework regulation and national regulations has generated only limited success: Prices have fallen, innovation dynamics have increased, but market consolidation in the EU has made rather modest progress. There was only one true merger after the opening up of fixed line telecommunication markets and partial privatization, namely the Swedish Telia taking over Sonera from Finland. The
33
number of telecommunication companies in the EU largely exceeds that in the US and one may anticipate that US investors will take over part of the telecommunications operators in the EU once TTIP has been implemented. In a more competitive and larger transatlantic market the minimum optimum plant size is likely to increase in several sectors and in this perspective the incomplete digital regulatory framework in the EU stands for a political challenge; i.e. there should be common rules in all EU countries about the auctioning of telecommunications licenses, including options to sell such licenses in secondary markets – here there is a field where a common transatlantic policy approach would be useful. If more competition and a more efficient exploitation of static and dynamic scale economies would help to further bring down international telecommunication prices one may expect a rise of trade: Jungmittag and Welfens (2009) have presented empirical evidence that a fall of international telecommunication prices and rising international telecommunications calls, respectively, raise the volume of international trade as a consequence of declining international information costs. Thus regulatory policy in telecommunications is an example where TTIP could stimulate the modernization of regulatory policies and indeed a joint transatlantic approach in digital regulation – this in turn could then reinforce transatlantic and global trade and thereby reinforce the benefits from TTIP.
A key challenge for Germany - and some other EU countries - concerns high electricity prices compared to the US. With innovative fracking technology, in the US the production of gas has increased and this has contributed to a widening transatlantic gap in electricity prices. In a fully integrated transatlantic market the implication is that the US will be able to increasingly attract FDI in energy-intensive industries, for example in the chemicals sector where the direct use of natural gas is also important for certain products. As regards Germany the relative rise of electricity prices is partly reflecting policy effects; for example the generous feed-in tariffs offered for producers of renewable energy by the German government translate into a top-up on both household and industrial electricity prices – with many exceptions for big companies in the tradables sector. Those exceptions are considered by the European Commission as disguised distorting subsidies; this view is convincing in the EU single market on the one hand, on the other hand the single biggest implicit energy subsidy in France, the UK, Spain, the Netherlands, Belgium and Germany is the miniscule insurance coverage of nuclear power stations – in Germany plants have to get a minimum coverage of € 2.5 billion which is less than 1/200th of the amount of damage expected from a major accident in nuclear power generation. This caveat also applies, of course, to US nuclear power stations. A favorable side-effect of TTIP would be that EU countries would benefit from US gas exports that are banned unless the importing country is in a free trade area with the US.
Another TTIP challenge considers the application of ILO labor standards. A recent ILO study (Häberli et al., 2012) has shown empirical evidence that regional integration among industrialized countries tends to undermine the application of ILO core labor standards. If these findings are considered as relevant in the context of TTIP the European Commission and governments of EU countries and the US – possibly also of Canada and Mexico – should adopt rules that make sure that ILO labor standards are not undermined. It is not fully clear what drives the link between free trade areas (FTA) and a weakening of ILO standards. One possible explanation is that creation of FTA generates first round winners in the field of inward FDI
34
inflows; the loser countries then have an incentive to water down the ILO standards as a means to attract higher FDI inflows in the second round.
China and other countries certainly are monitoring the transatlantic TTIP process. The solutions created in the context of a transatlantic free trade area could not only generate considerable benefits for Europe and the US but also encourage other FTAs to adopt similar solutions. Finally, as regards trade diversion effects the US could build on its Trans-Pacific Partnership initiative to reduce such effects strongly. The EU so far has no comparable undertaking linking Europe and Asia in a broader liberalization initiative. After the completion of negotiations of a rather straightforward FTA of the EU with Singapore in 2013 (Kutlina-Dimitrova and Lakatos, 2014) the EU has envisaged an FTA with Thailand. A superior approach could, however, be a broader approach that would aim directly at an FTA of the EU with ASEAN – or of the EU with the Mercosur which should be even simpler to achieve since the latter is a customs union just like the EU.
The sectoral analysis presented here lends itself to some complementary macroeconomic aspects and related policy issues. Since the sectors dealt with are crucial in terms of innovation dynamics, exports, FDI and employment – and since almost all sectors considered have considerable upstream and downstream linkages – the simulations presented shed additional light on the broader debate about TTIP. As regards current analytical contributions it is interesting to note that there are studies (commissioned by the authorities) for the UK, Sweden, the Czech Republic, France, Germany and the EU which all have been published, however, the study for the US Trade Representative has not been published. TTIP will also hopefully generate a common view that more public debate on the basis of relevant research is useful for a broader understanding of the issues and options; and will help avoiding policy pitfalls.
To sum up, we have many new useful insights from IO analysis. However, like many other quantitative analyses, IO analysis is also subject to several limitations. Firstly, IO analysis is static in nature. Thus it is not really appropriate to estimate the long-run impact. Secondly, IO analysis assumes that the technology is constant. Thirdly, IO analysis also assumes that the relationship between input and output is linear. Lastly, IO analysis cannot capture the impact of changes in prices over time. We suggest as a realistic version of the export simulations presented 2/3 of the results so that the order of magnitude of new jobs expected is close to 0.5 million. A prudent version would be 10% growth of Germany’s export as a consequence of TTIP; in 2009 German exports to the US relative to Germany’s global exports stood for 7%, 12% and 10% in the fields of the chemicals sector, pharmaceutical and the automotive sector, respectively - figures are based on WITS database. Even if exports to the US would increase by 40% within a decade a high growth effect on intra-EU exports has to be realized if Germany’s total exports were to increase by 20%; if Germany’s intra-EU exports stand for 50% of total exports and the growth rate of those exports would have to be 30%. As EU27 exports to the US indeed will increase as a consequence of TTIP Germany’s exports to EU partner countries – partly in the field of intermediate products, partly in the form of final products (stimulated by higher imports as a consequence of higher real income in the EU) – the TTIP-induced growth of Germany’s exports could be much higher than the trade growth effect for US-bound exports suggests.
35
As regards sectoral employment effects one should be careful not to simply add up the sectoral employment gains in the context of higher exports; higher imports also should be considered in a broader perspective: a combination of IO analysis and macroeconomic modelling can be quite useful. As transatlantic competition will be enhanced in most sectors price convergence across countries will be reinforced and this in turn will generate efficiency gains and welfare gains, respectively.
As regards the prospects of TTIP negotiations a survey (Barker/Workman, 2013) found that the most difficult fields would be as follows: labor standards, environmental standards, investment liberalization, audio-visual quotas, geographic indicators, pharmaceutical testing, financial services, sanitary & phyto-sanitary measures, regulations of manufactured goods, data protection/privacy, genetically modified organisms/agriculture and regulatory process convergence.
It is unclear to what extent more common regulation and mutual recognition will play a role within TTIP. While regulatory policies and issues of mutual recognition are rather complex fields for negotiators one could enhance competition dynamics and particularly the efficiency of capital markets by imposing on firms adequate standards for sustainability reporting. In this field EU firms seem to have some advantage, but some of those leading firms are indeed subsidiaries of US multinational companies; at the same time it should be considered that the Dodd-Frank Act requires US firms as of May 31, 2014, to disclose the whole supplier chain so that in principal one could get better information on the resource intensity, CO2 emissions and application of ILO labor standards along the whole chain of value-added. In a sectoral perspective input-output analysis can, of course, also be useful here; for example energy-intensity and CO2-intensity of domestic and imported intermediate production could be analysed. The EU should consider adopting a parallel directive to the relevant chapters of the Dodd-Frank Act (the European Commission has already considered this policy field as potentially relevant: see European Commission, 2013: EU calls for Input on traded minerals). Multinational companies in the USAEU could thus become strong drivers not only of efficiency gains and new Schumpeterian innovation dynamics but could also stimulate more long term investment in line with sustainability. This implies new opportunities for global sustainability so that TTIP indeed could generate global positive external effects on a broad scale. TTIP thus could be a success story on many counts. The welfare gains could be significant if policy makers on both sides of the Atlantic adopt adequate and consistent initiatives so that TTIP in effect will become an element of global governance for a more integrated and sustainable world economy. Here further research is required and policy makers could strongly benefit indeed from new efforts here.
36
References:
Barrell, R.; Pain, N. (1997), Foreign Direct Investment, Technological Change and Economic Growth within Europe, The Economic Journal, Vol. 107, 1770-1786.
Barker, T.; Workman, G. (2013), The Transatlantic Trade and Investment Partnership: Ambitious but Achievable, Atlantic Council & Bertelsmann Foundation, Washington DC.
Bradford, S.C.; Lawrence, R.Z. (2004), Has Globalization Gone Far Enough? The Costs of Fragmented Markets, Washington DC: Institute for International Economics.
Branson, W.H. (1977), Asset Markets and Relative Prices in Exchange Rate Determination, Sozialwissenschaftliche Annalen 1, 69-89.
Brenton, P.; Di Mauro, F.; Liicke, M. (1998), Economic Integration and FDI: - An Empirical Analysis of Foreign Investment in the EU and in Central and Eastern Europe, Kiel Working Paper No. 890, Institute of World Economics.
CEA (Council of Economic Advisers,2010), Economic Report of the President, Washington DC.
Erixon, F.; Bauer, M. (2010), “A Transatlantic Zero Agreement, Estimating the Gains from Transatlantic Free Trade in Goods” ECIPE Occasional Paper 4/2010. Brussels: ECIPE.
Felbermayr, G.; Mario, L.; Lisandra, F.; Erdal, Y.; Sebastian, B. (2013), Dimensionen und Auswirkungen eines Freihandelsabkommens zwischen der EU und den USA, Study commissioned by German Federal Ministry of Economics and Technology, Munich.
Fontagné, L.; Gourdon, J.; Jean, S. (2013), Transatlantic Trade: Whither Partnership, Which Economic Consequences, Policy Brief CEPII, Paris.
Francois, J. et al. (2013), Reducing Transatlantic Barriers to Trade and Investment, London: CEPR (for the European Commission).
Froot, K.A.; Stein, J.C. (1991), Exchange rates and foreign direct investment: an imperfect capital markets approach. Quarterly Journal of Economics 106(4), 1191-1217.
Graham, E.M; Krugman, P.K. (1995), Foreign Direct Investment in the Unites States. Washington DC: Institute for International Economics.
Häberli, C.; Jansen, M.; Monteiro, J.A. (2012), Regional trade agreements and domestic labor market regulation, employment working paper No. 120, ILO, Geneva.
IFO (2013), Bundesländer, Branchen und Bildungsgruppen, Wirtschaftliche Folgen eines Transatlantischen Freihandelsabkommens (THIP) für Deutschland, Mikroökonomische Analyse (co-authored by Felbermayr, G.; Lehwald, S., Schoof, U.; Ronge, M.), Bertelsmann Foundation, Gütersloh.
IWD (2013), Investitionsgüter führen zu Überschüssen, iw-dienst, Ausgabe 15, Vol. 39, 3.
Jungmittag, A.; Welfens, P.J.J. (2009), Liberalization of EU telecommunications and trade: theory, gravity equation analysis and policy implications. International Economics and Economic Policy, Vol. 6, 23-39.

37
Klein, M.; Rosengren E. (1992), Foreign Direct Investment Outflow from the United States: An Empirical Assessment, in: Klein, M.; Welfens, P.J.J., eds., Multinationals in the New Europe and Global Trade, Heidelberg and New York: Springer, 65-87.
Klodt, H. (1992), Technology-based Trade and Multinationals’ Investment in Europe: Structural Change and Competition in Schumpeterian Goods, in: Klein, M.; Welfens, P.J.J., eds., Multinationals in the New Europe and Global Trade, Heidelberg and New York: Springer, 107-123.
Kutlina-Dimitrova, Z., Lakatos, C. (2013), Assessing the economic impacts of the EU-Singapore FTA with a dynamic general equilibrium model, International Economics and Economic Policy. DOI 10.1007/s10368-013-0262-7
Vernon, R. (1966), International Investment and International Trade in the Product Cycle, Quarterly Journal of Economics, Vol. 80, 190-207.
Welfens, P.J.J. (2011), Innovations in Macroeconomics, 3rd revised and enlarged edition, Heidelberg and New York: Springer.
Welfens, P.J.J. (2013), Social Security and Economic Globalization, Heidelberg and New York: Springer.
Welfens, P.J.J. (2014), Technological Progress and Economic Growth in Open Economies: New Schumpeterian Perspectives, EIIW Working Paper No. 210, EIIW at the University of Wuppertal, forthcoming.
Welfens, P.J.J.; Perret, J. (2014), Information & communication technology and true real GDP: economic analysis and findings for selected countries, International Economics and Economic Policy, DOI 10.1007/s10368-013-0261-8 (public access)
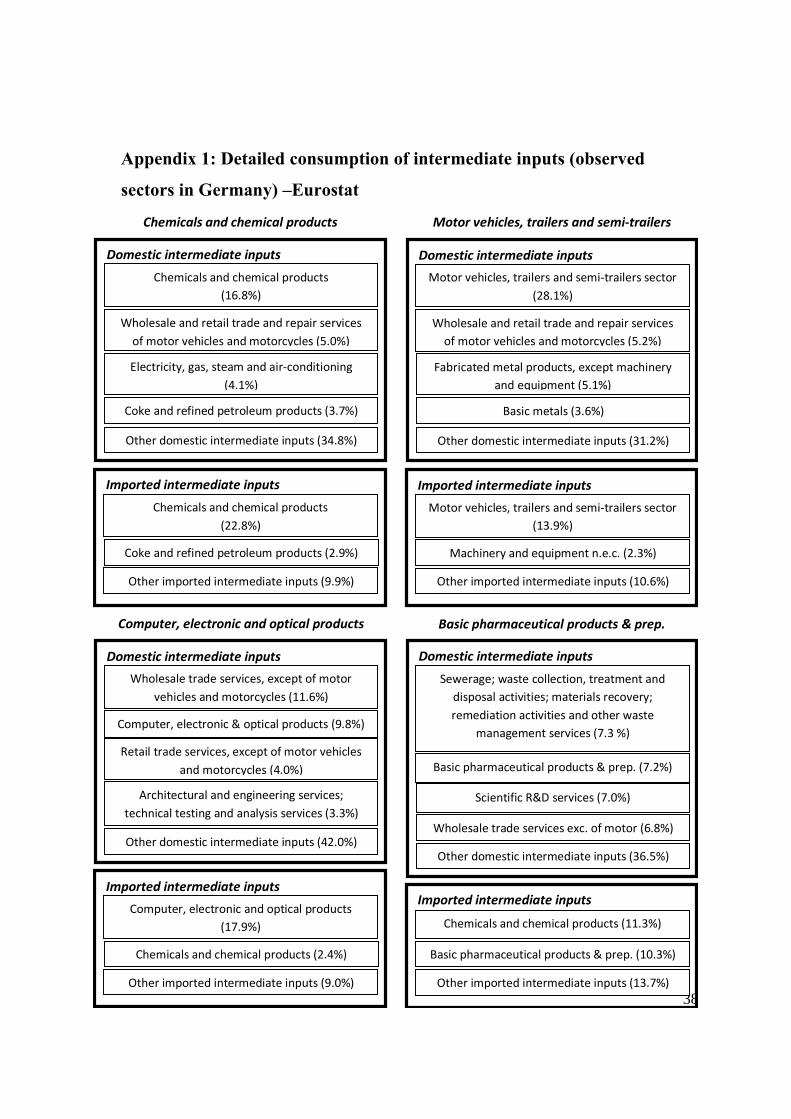
38
Appendix 1: Detailed consumption of intermediate inputs (observed
sectors in Germany) –Eurostat
Domestic intermediate inputs
Chemicals and chemical products
(16.8%)
Wholesale and retail trade and repair services
of motor vehicles and motorcycles (5.0%)
Electricity, gas, steam and air‐conditioning
(4.1%)
Coke and refined petroleum products (3.7%)
Other domestic intermediate inputs (34.8%)
Imported intermediate inputs
Chemicals and chemical products
(22.8%)
Other imported intermediate inputs (9.9%)
Coke and refined petroleum products (2.9%)
Chemicals and chemical products
Domestic intermediate inputs
Motor vehicles, trailers and semi‐trailers sector
(28.1%)
Wholesale and retail trade and repair services
of motor vehicles and motorcycles (5.2%)
Fabricated metal products, except machinery
and equipment (5.1%)
Basic metals (3.6%)
Other domestic intermediate inputs (31.2%)
Imported intermediate inputs
Motor vehicles, trailers and semi‐trailers sector
(13.9%)
Other imported intermediate inputs (10.6%)
Machinery and equipment n.e.c. (2.3%)
Motor vehicles, trailers and semi‐trailers
Domestic intermediate inputs
Wholesale trade services, except of motor
vehicles and motorcycles (11.6%)
Computer, electronic & optical products (9.8%)
Retail trade services, except of motor vehicles
and motorcycles (4.0%)
Architectural and engineering services;
technical testing and analysis services (3.3%)
Other domestic intermediate inputs (42.0%)
Imported intermediate inputs
Computer, electronic and optical products
(17.9%)
Other imported intermediate inputs (9.0%)
Chemicals and chemical products (2.4%)
Computer, electronic and optical products
Domestic intermediate inputs
Sewerage; waste collection, treatment and
disposal activities; materials recovery;
remediation activities and other waste
management services (7.3 %)
Basic pharmaceutical products & prep. (7.2%)
Scientific R&D services (7.0%)
Other domestic intermediate inputs (36.5%)
Imported intermediate inputs
Chemicals and chemical products (11.3%)
Other imported intermediate inputs (13.7%)
Basic pharmaceutical products & prep. (10.3%)
Basic pharmaceutical products & prep.
Wholesale trade services exc. of motor (6.8%)
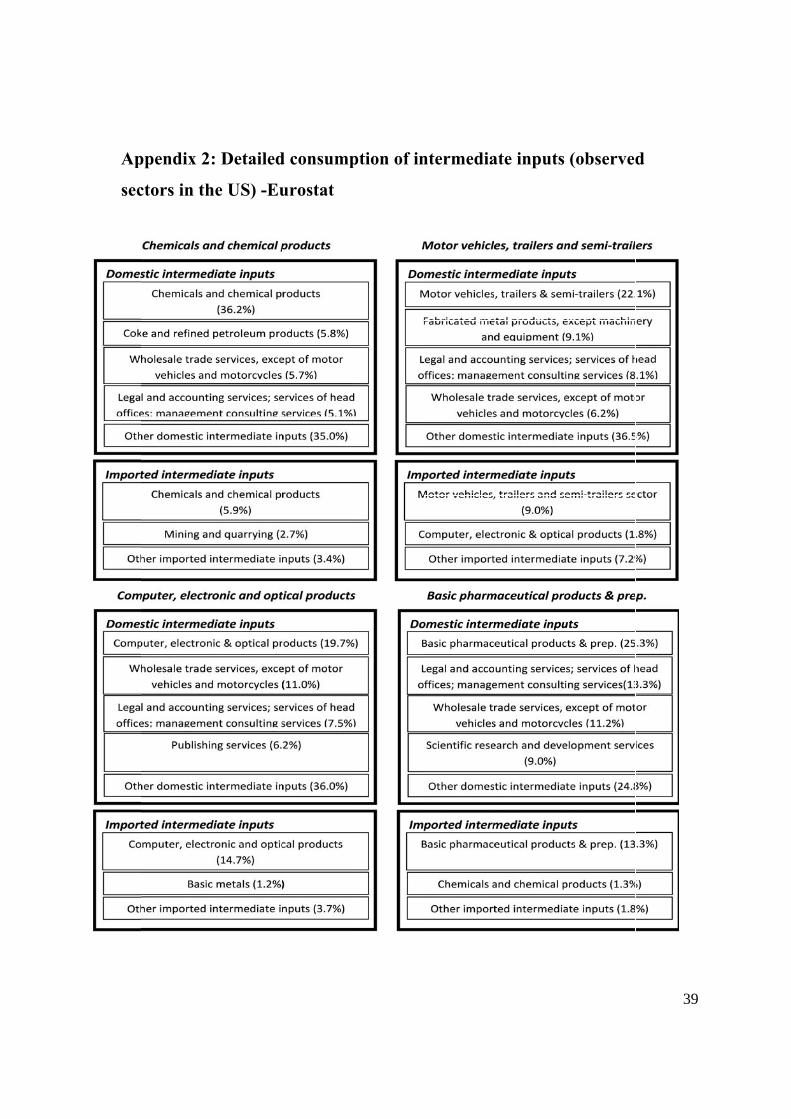
Ap
sec
ppendix 2:
ctors in th
: Detailed
he US) -Eu
d consump
urostat
ption of inntermediaate inputs (observed
39
d
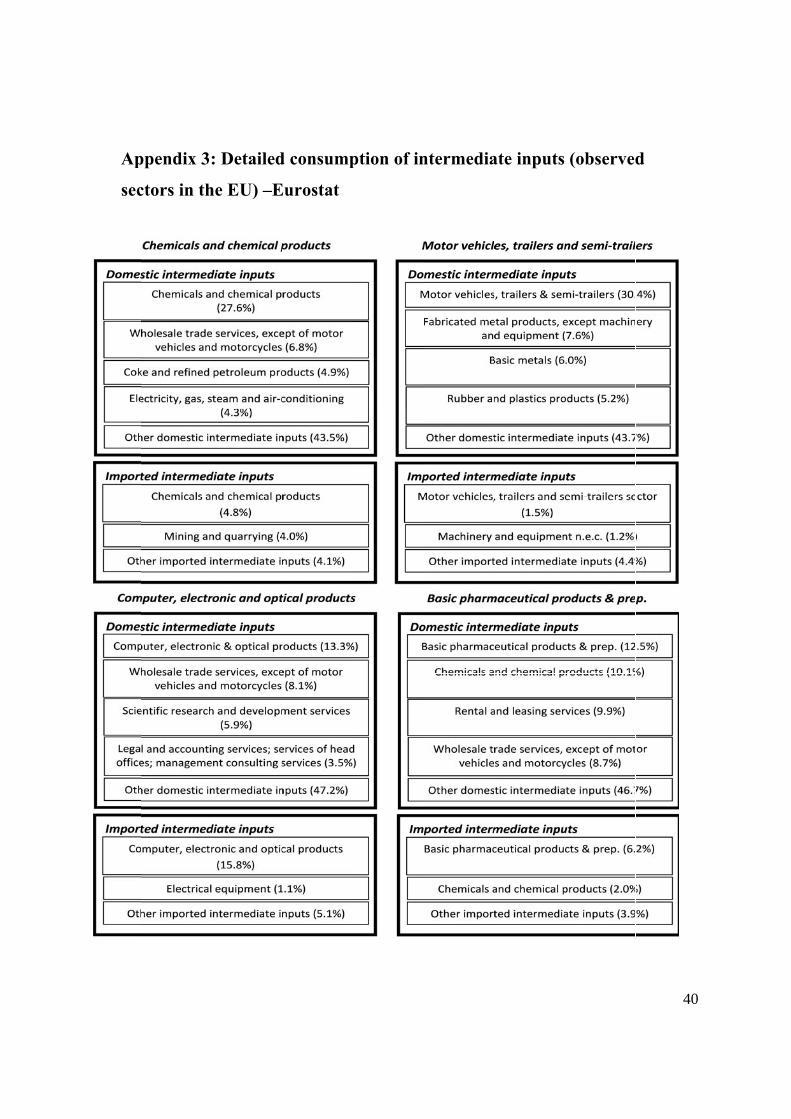
Ap
sec
ppendix 3:
ctors in th
: Detailed
he EU) –E
d consump
Eurostat
ption of inntermediaate inputs (observed
40
d
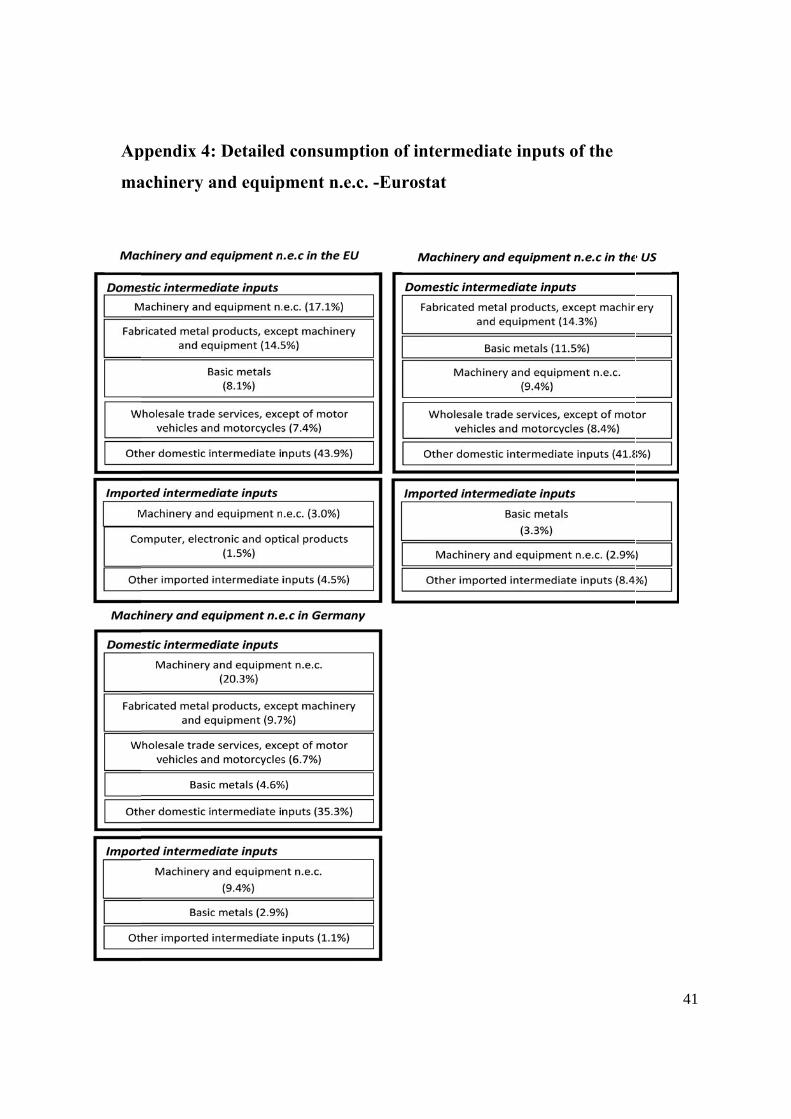
Ap
ma
ppendix 4:
achinery a
: Detailed
and equip
d consump
pment n.e.
ption of in
.c. -Euros
ntermedia
stat
ate inputs of the
41
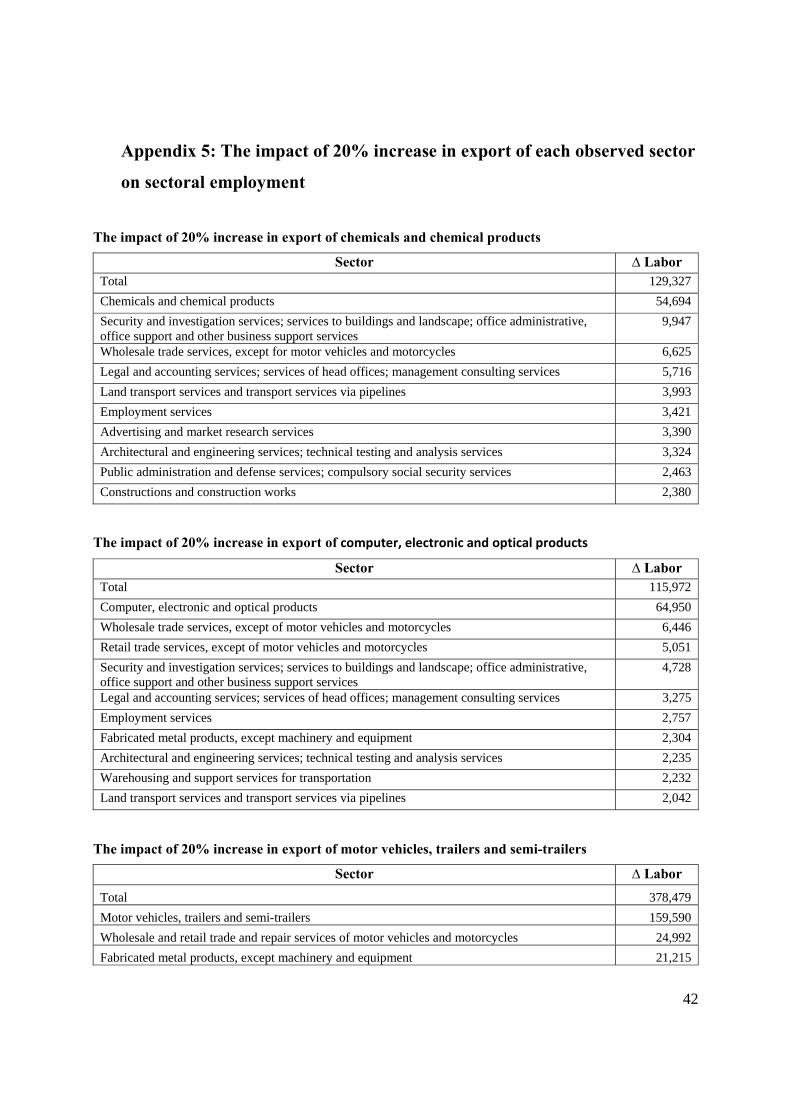
42
Appendix 5: The impact of 20% increase in export of each observed sector
on sectoral employment
The impact of 20% increase in export of chemicals and chemical products
Sector ∆ Labor Total 129,327
Chemicals and chemical products 54,694
Security and investigation services; services to buildings and landscape; office administrative, office support and other business support services
9,947
Wholesale trade services, except for motor vehicles and motorcycles 6,625
Legal and accounting services; services of head offices; management consulting services 5,716
Land transport services and transport services via pipelines 3,993
Employment services 3,421
Advertising and market research services 3,390
Architectural and engineering services; technical testing and analysis services 3,324
Public administration and defense services; compulsory social security services 2,463
Constructions and construction works 2,380
The impact of 20% increase in export of computer, electronic and optical products
Sector ∆ Labor Total 115,972
Computer, electronic and optical products 64,950
Wholesale trade services, except of motor vehicles and motorcycles 6,446
Retail trade services, except of motor vehicles and motorcycles 5,051
Security and investigation services; services to buildings and landscape; office administrative, office support and other business support services
4,728
Legal and accounting services; services of head offices; management consulting services 3,275
Employment services 2,757
Fabricated metal products, except machinery and equipment 2,304
Architectural and engineering services; technical testing and analysis services 2,235
Warehousing and support services for transportation 2,232
Land transport services and transport services via pipelines 2,042
The impact of 20% increase in export of motor vehicles, trailers and semi-trailers
Sector ∆ Labor
Total 378,479
Motor vehicles, trailers and semi-trailers 159,590
Wholesale and retail trade and repair services of motor vehicles and motorcycles 24,992
Fabricated metal products, except machinery and equipment 21,215

43
Security and investigation services; services to buildings and landscape; office administrative, office support and other business support services 18,195
Legal and accounting services; services of head offices; management consulting services 15,869
Employment services 12,452
Wholesale trade services, except of motor vehicles and motorcycles 12,372
Rubber and plastics products 9,759
Land transport services and transport services via pipelines 9,237
Warehousing and support services for transportation 8,648
The impact of 20% increase in export of basic pharmaceutical products and pharmaceutical preparations
Sector ∆ Labor
Total 54,176
Basic pharmaceutical products and pharmaceutical preparations 24,132
Retail trade services, except of motor vehicles and motorcycles 4,081 Security and investigation services; services to buildings and landscape; office administrative, office support and other business support services
2,830
Wholesale trade services, except of motor vehicles and motorcycles 2,483
Scientific research and development services 1,955
Employment services 1,916
Legal and accounting services; services of head offices; management consulting services 1,866
Advertising and market research services 1,629 Sewerage; waste collection, treatment and disposal activities; materials recovery; remediation activities and other waste management services
1,295
Architectural and engineering services; technical testing and analysis services 1,212
The impact of 20% increase in export of machinery and equipment n.e.c.
Sector ∆ Labor
Total 359,154
Machinery and equipment n.e.c. 194,344
Fabricated metal products, except machinery and equipment 23,386
Wholesale trade services, except of motor vehicles and motorcycles 15,750
Employment services 14,101 Security and investigation services; services to buildings and landscape; office administrative, office support and other business support services 13,759
Legal and accounting services; services of head offices; management consulting services 12,091
Warehousing and support services for transportation 6,634
Retail trade services, except of motor vehicles and motorcycles 6,476
Land transport services and transport services via pipelines 5,838
Basic metals 5,776
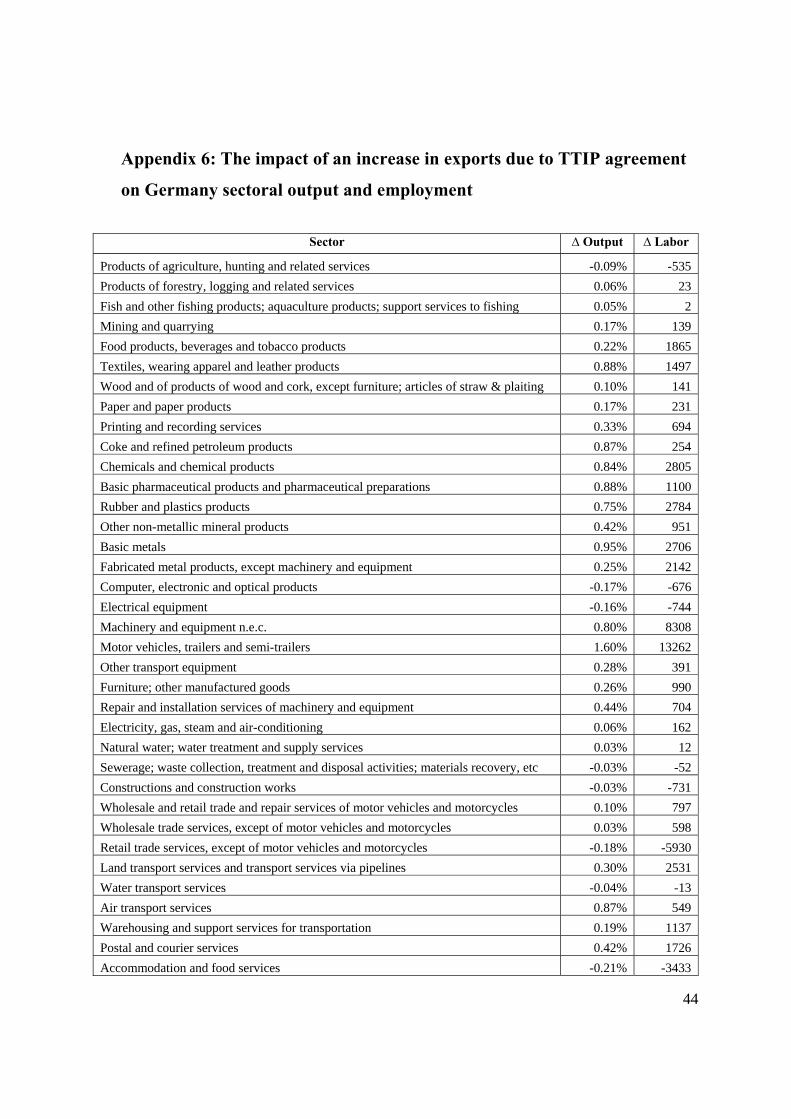
44
Appendix 6: The impact of an increase in exports due to TTIP agreement
on Germany sectoral output and employment
Sector ∆ Output ∆ Labor
Products of agriculture, hunting and related services -0.09% -535
Products of forestry, logging and related services 0.06% 23
Fish and other fishing products; aquaculture products; support services to fishing 0.05% 2
Mining and quarrying 0.17% 139
Food products, beverages and tobacco products 0.22% 1865
Textiles, wearing apparel and leather products 0.88% 1497
Wood and of products of wood and cork, except furniture; articles of straw & plaiting 0.10% 141
Paper and paper products 0.17% 231
Printing and recording services 0.33% 694
Coke and refined petroleum products 0.87% 254
Chemicals and chemical products 0.84% 2805
Basic pharmaceutical products and pharmaceutical preparations 0.88% 1100
Rubber and plastics products 0.75% 2784
Other non-metallic mineral products 0.42% 951
Basic metals 0.95% 2706
Fabricated metal products, except machinery and equipment 0.25% 2142
Computer, electronic and optical products -0.17% -676
Electrical equipment -0.16% -744
Machinery and equipment n.e.c. 0.80% 8308
Motor vehicles, trailers and semi-trailers 1.60% 13262
Other transport equipment 0.28% 391
Furniture; other manufactured goods 0.26% 990
Repair and installation services of machinery and equipment 0.44% 704
Electricity, gas, steam and air-conditioning 0.06% 162
Natural water; water treatment and supply services 0.03% 12
Sewerage; waste collection, treatment and disposal activities; materials recovery, etc -0.03% -52
Constructions and construction works -0.03% -731
Wholesale and retail trade and repair services of motor vehicles and motorcycles 0.10% 797
Wholesale trade services, except of motor vehicles and motorcycles 0.03% 598
Retail trade services, except of motor vehicles and motorcycles -0.18% -5930
Land transport services and transport services via pipelines 0.30% 2531
Water transport services -0.04% -13
Air transport services 0.87% 549
Warehousing and support services for transportation 0.19% 1137
Postal and courier services 0.42% 1726
Accommodation and food services -0.21% -3433

45
Appendix 6: The impact of an increase in exports due to TTIP agreement
on Germany sectoral output and employment (continued)
Sector ∆ Output ∆ Labor
Publishing services -0.05% -144 Motion picture, video and television programme production services, sound recording and music publishing; programming and broadcasting services -0.04% -54
Telecommunications services 1.04% 1765
Computer programming, consultancy and related services; information services 0.61% 4027
Financial services, except insurance and pension funding 0.13% 906
Insurance, reinsurance and pension funding services, except compulsory social security -0.12% -237
Services auxiliary to financial services and insurance services -0.07% -226
Real estate services (exluding imputed rent) 0.06% 250 Legal and accounting services; services of head offices; management consulting services 0.40% 4640
Architectural and engineering services; technical testing and analysis services 0.58% 3280
Scientific research and development services 0.64% 1053
Advertising and market research services 0.44% 1226
Other professional, scientific and technical services; veterinary services 0.52% 1075
Rental and leasing services 0.12% 163
Employment services 0.36% 2310
Travel agency, tour operator and other reservation services and related services 0.14% 142 Security and investigation services; services to buildings and landscape; office administrative, office support and other business support services 0.29% 4785
Public administration and defence services; compulsory social security services -0.20% -5586
Education services -0.23% -5681
Human health services -0.25% -6284
Social work services -0.26% -4498 Creative, arts and entertainment services; library, archive, museum and other cultural services; gambling and betting services -0.21% -824
Sporting services and amusement and recreation services -0.20% -469
Services furnished by membership organisations -0.15% -1086
Repair services of computers and personal and household goods 0.04% 34
Other personal services -0.13% -982
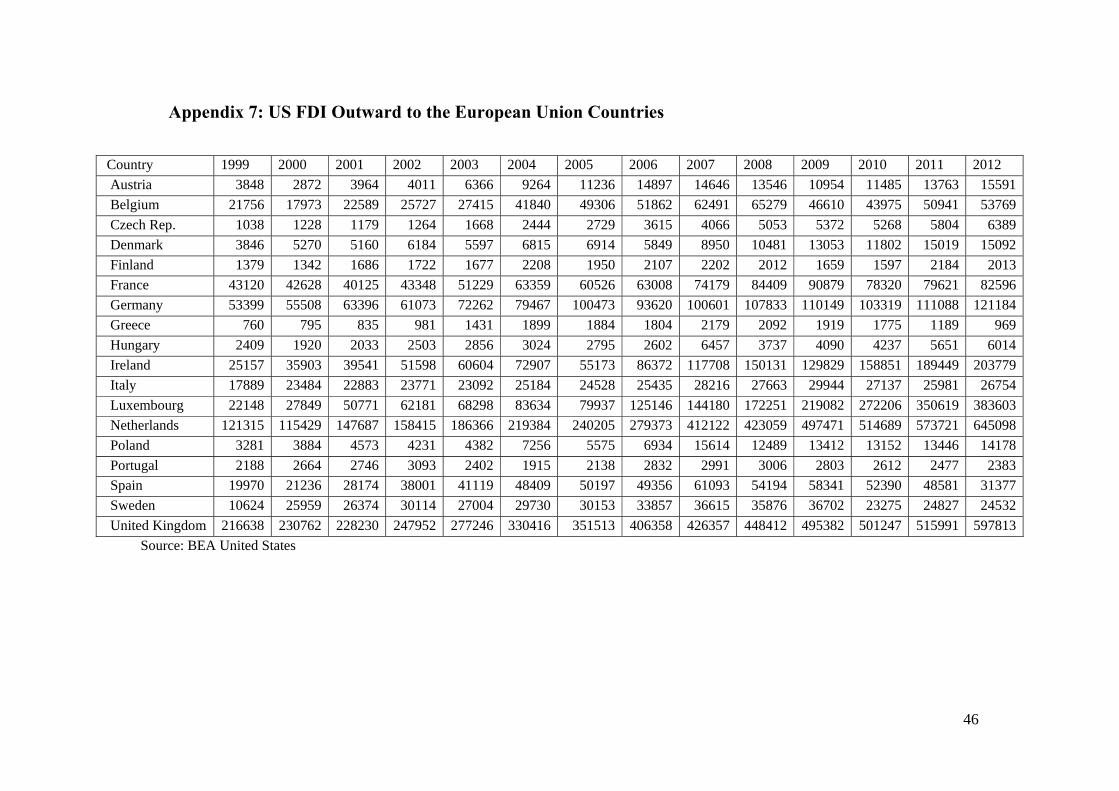
46
Appendix 7: US FDI Outward to the European Union Countries
Country 1999 2000 2001 2002 2003 2004 2005 2006 2007 2008 2009 2010 2011 2012
Austria 3848 2872 3964 4011 6366 9264 11236 14897 14646 13546 10954 11485 13763 15591
Belgium 21756 17973 22589 25727 27415 41840 49306 51862 62491 65279 46610 43975 50941 53769
Czech Rep. 1038 1228 1179 1264 1668 2444 2729 3615 4066 5053 5372 5268 5804 6389
Denmark 3846 5270 5160 6184 5597 6815 6914 5849 8950 10481 13053 11802 15019 15092
Finland 1379 1342 1686 1722 1677 2208 1950 2107 2202 2012 1659 1597 2184 2013
France 43120 42628 40125 43348 51229 63359 60526 63008 74179 84409 90879 78320 79621 82596
Germany 53399 55508 63396 61073 72262 79467 100473 93620 100601 107833 110149 103319 111088 121184
Greece 760 795 835 981 1431 1899 1884 1804 2179 2092 1919 1775 1189 969
Hungary 2409 1920 2033 2503 2856 3024 2795 2602 6457 3737 4090 4237 5651 6014
Ireland 25157 35903 39541 51598 60604 72907 55173 86372 117708 150131 129829 158851 189449 203779
Italy 17889 23484 22883 23771 23092 25184 24528 25435 28216 27663 29944 27137 25981 26754
Luxembourg 22148 27849 50771 62181 68298 83634 79937 125146 144180 172251 219082 272206 350619 383603
Netherlands 121315 115429 147687 158415 186366 219384 240205 279373 412122 423059 497471 514689 573721 645098
Poland 3281 3884 4573 4231 4382 7256 5575 6934 15614 12489 13412 13152 13446 14178
Portugal 2188 2664 2746 3093 2402 1915 2138 2832 2991 3006 2803 2612 2477 2383
Spain 19970 21236 28174 38001 41119 48409 50197 49356 61093 54194 58341 52390 48581 31377
Sweden 10624 25959 26374 30114 27004 29730 30153 33857 36615 35876 36702 23275 24827 24532
United Kingdom 216638 230762 228230 247952 277246 330416 351513 406358 426357 448412 495382 501247 515991 597813
Source: BEA United States
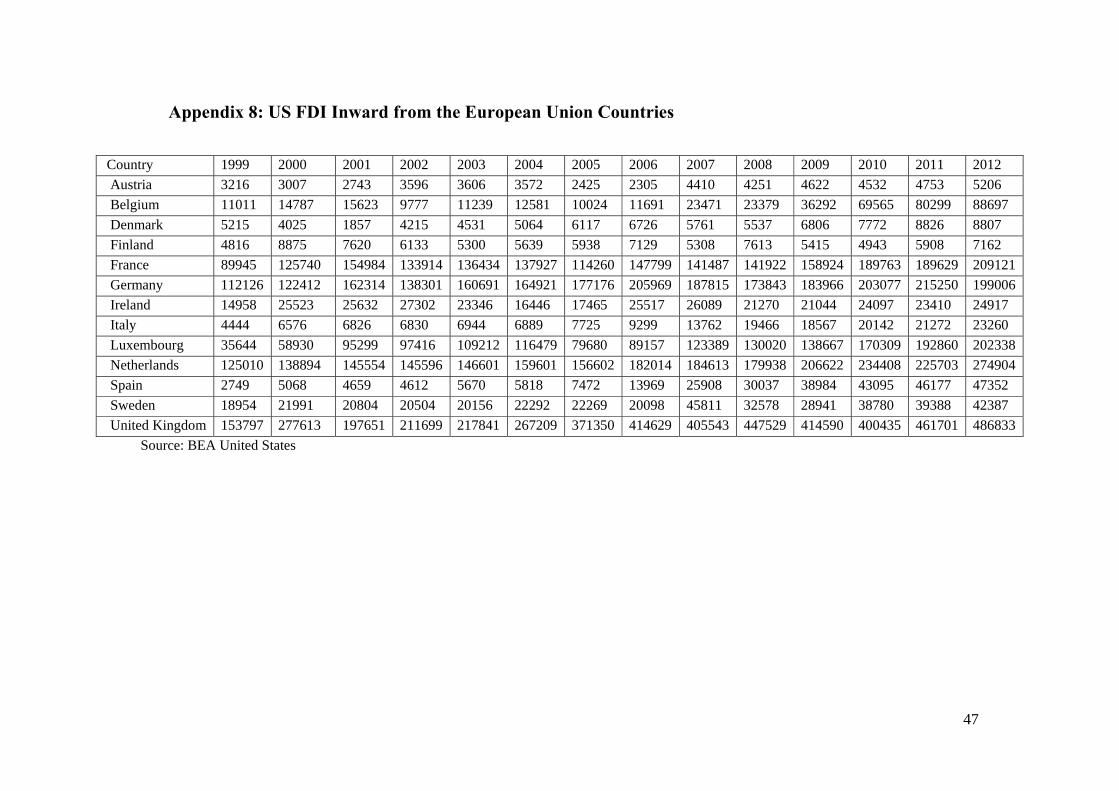
47
Appendix 8: US FDI Inward from the European Union Countries
Country 1999 2000 2001 2002 2003 2004 2005 2006 2007 2008 2009 2010 2011 2012
Austria 3216 3007 2743 3596 3606 3572 2425 2305 4410 4251 4622 4532 4753 5206
Belgium 11011 14787 15623 9777 11239 12581 10024 11691 23471 23379 36292 69565 80299 88697
Denmark 5215 4025 1857 4215 4531 5064 6117 6726 5761 5537 6806 7772 8826 8807
Finland 4816 8875 7620 6133 5300 5639 5938 7129 5308 7613 5415 4943 5908 7162
France 89945 125740 154984 133914 136434 137927 114260 147799 141487 141922 158924 189763 189629 209121
Germany 112126 122412 162314 138301 160691 164921 177176 205969 187815 173843 183966 203077 215250 199006
Ireland 14958 25523 25632 27302 23346 16446 17465 25517 26089 21270 21044 24097 23410 24917
Italy 4444 6576 6826 6830 6944 6889 7725 9299 13762 19466 18567 20142 21272 23260
Luxembourg 35644 58930 95299 97416 109212 116479 79680 89157 123389 130020 138667 170309 192860 202338
Netherlands 125010 138894 145554 145596 146601 159601 156602 182014 184613 179938 206622 234408 225703 274904
Spain 2749 5068 4659 4612 5670 5818 7472 13969 25908 30037 38984 43095 46177 47352
Sweden 18954 21991 20804 20504 20156 22292 22269 20098 45811 32578 28941 38780 39388 42387
United Kingdom 153797 277613 197651 211699 217841 267209 371350 414629 405543 447529 414590 400435 461701 486833
Source: BEA United States
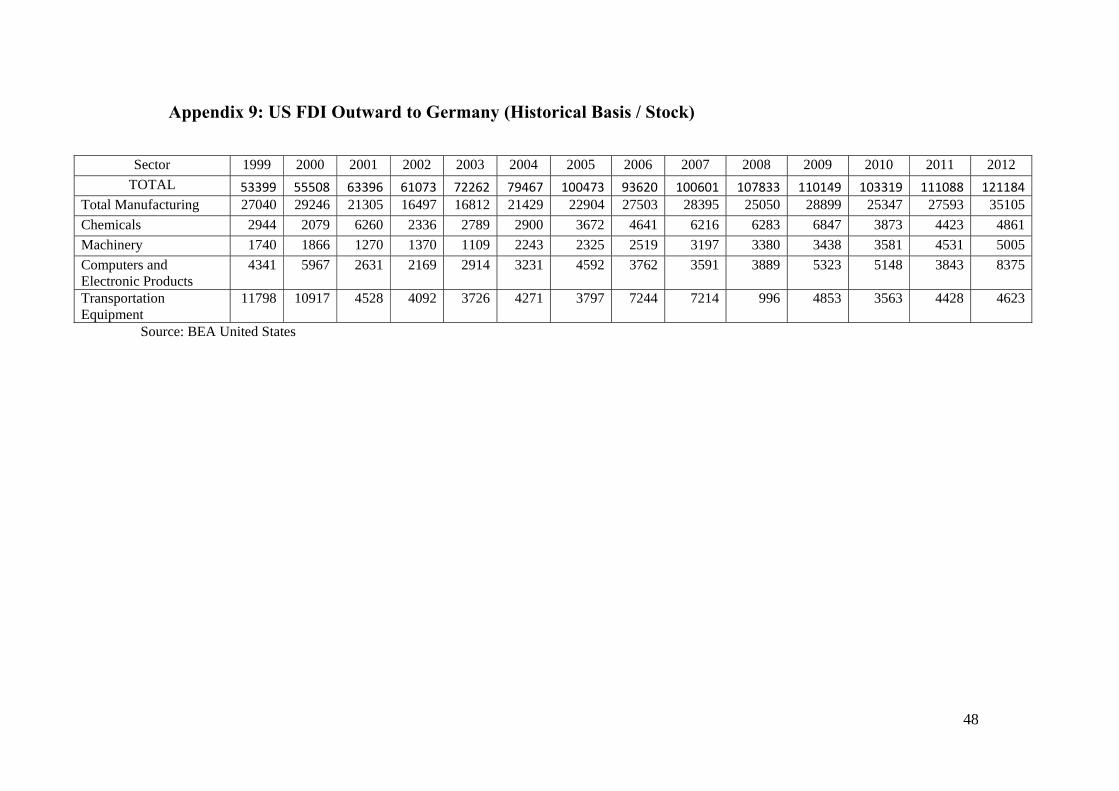
48
Appendix 9: US FDI Outward to Germany (Historical Basis / Stock)
Sector 1999 2000 2001 2002 2003 2004 2005 2006 2007 2008 2009 2010 2011 2012
TOTAL 53399 55508 63396 61073 72262 79467 100473 93620 100601 107833 110149 103319 111088 121184 Total Manufacturing 27040 29246 21305 16497 16812 21429 22904 27503 28395 25050 28899 25347 27593 35105
Chemicals 2944 2079 6260 2336 2789 2900 3672 4641 6216 6283 6847 3873 4423 4861
Machinery 1740 1866 1270 1370 1109 2243 2325 2519 3197 3380 3438 3581 4531 5005
Computers and Electronic Products
4341 5967 2631 2169 2914 3231 4592 3762 3591 3889 5323 5148 3843 8375
Transportation Equipment
11798 10917 4528 4092 3726 4271 3797 7244 7214 996 4853 3563 4428 4623
Source: BEA United States
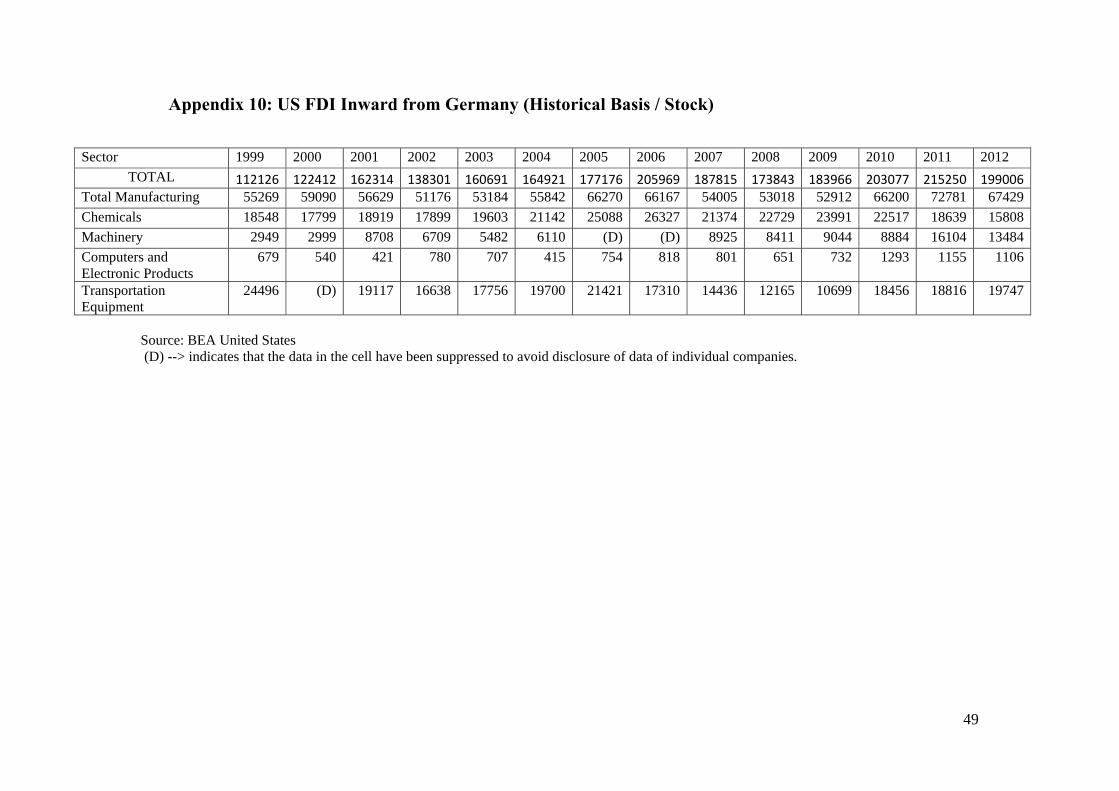
49
Appendix 10: US FDI Inward from Germany (Historical Basis / Stock)
Sector 1999 2000 2001 2002 2003 2004 2005 2006 2007 2008 2009 2010 2011 2012
TOTAL 112126 122412 162314 138301 160691 164921 177176 205969 187815 173843 183966 203077 215250 199006 Total Manufacturing 55269 59090 56629 51176 53184 55842 66270 66167 54005 53018 52912 66200 72781 67429
Chemicals 18548 17799 18919 17899 19603 21142 25088 26327 21374 22729 23991 22517 18639 15808
Machinery 2949 2999 8708 6709 5482 6110 (D) (D) 8925 8411 9044 8884 16104 13484
Computers and Electronic Products
679 540 421 780 707 415 754 818 801 651 732 1293 1155 1106
Transportation Equipment
24496 (D) 19117 16638 17756 19700 21421 17310 14436 12165 10699 18456 18816 19747
Source: BEA United States (D) --> indicates that the data in the cell have been suppressed to avoid disclosure of data of individual companies.

50
Appendix 11: Sector’ share in value added as a percent of total value
added -Eurostat
Sector Germany EU US
Agriculture subtotal 0.96% 2.16% 2.53%
Products of agriculture, hunting and related services 0.61% 1.26% 0.79%
Products of forestry, logging and related services 0.09% 0.15% 0.21%
Fish and other fishing products; aquaculture products; support services to fishing 0.01% 0.05% 0.02%
Mining and quarrying 0.25% 0.70% 1.51%
Manufacture subtotal 17.57% 14.12% 10.91%
Food products, beverages and tobacco products 1.59% 2.13% 1.63%
Chemicals and chemical products 1.21% 0.94% 0.96%
Basic pharmaceutical products and pharmaceutical preparations 0.64% 0.62% 0.73%
Rubber and plastics products 0.93% 0.67% 0.46%
Basic metals 0.73% 0.54% 0.26%
Fabricated metal products, except machinery and equipment 1.78% 1.37% 0.77%
Computer, electronic and optical products 0.84% 0.61% 1.36%
Electrical equipment 1.34% 0.69% 0.31%
Machinery and equipment n.e.c. 2.83% 1.37% 0.75%
Motor vehicles, trailers and semi-trailers 1.73% 0.90% 0.39%
Utilities 3.18% 3.07% 2.75%
Electricity, gas, steam and air-conditioning 2.08% 2.08% 2.13%
Sewerage; waste collection, treatment and disposal activities; materials recovery; remediation activities and other waste management services
0.88% 0.75% 0.40%
Services 78.29% 80.65% 83.80%
Constructions and construction works 4.68% 6.73% 4.08%
Wholesale trade services, except of motor vehicles and motorcycles 5.18% 5.08% 5.58%
Retail trade services, except of motor vehicles and motorcycles 4.06% 4.24% 5.59%
Land transport services and transport services via pipelines 1.54% 2.34% 1.70%
Accommodation and food services 1.87% 3.15% 3.03%
Telecommunications services 1.12% 1.61% 2.05%
Computer programming, consultancy and related services; information services 1.99% 2.01% 2.48%
Financial services, except insurance and pension funding 2.94% 3.95% 3.43%
Real estate services (excluding imputed rent) 13.05% 7.37% 5.81% Legal and accounting services; services of head offices; management consulting services 3.26% 3.13% 4.85%
Architectural and engineering services; technical testing and analysis services 1.48% 1.41% 1.16%
Scientific research and development services 0.57% 0.62% 0.62%
Rental and leasing services 2.15% 1.38% 1.65%
Education services 4.70% 5.33% 1.46%
Human health services 5.50% 5.20% 7.54%

51
Appendix 12: Sector’ expenditure on Scientific Research and Development
Services (as a percentage of total intermediate input consumption) -
Eurostat
Sector Germany EU US
Domestic Imported Domestic Imported Domestic Imported
Products of agriculture, hunting and related services 0.00% 0.00% 0.26% 0.01% 0.00% 0.00%
Products of forestry, logging and related services 0.00% 0.00% 0.08% 0.02% 0.45% 0.02%
Fish and other fishing products; aquaculture products; support services to fishing
0.00% 0.00% 0.33% 0.00% 0.50% 0.00%
Mining and quarrying 0.00% 0.00% 1.11% 0.05% 0.66% 0.03%
Food products, beverages and tobacco products 0.00% 0.00% 0.25% 0.02% 0.33% 0.01%
Textiles, wearing apparel and leather products 0.00% 0.00% 0.55% 0.02% 0.36% 0.01%
Wood and of products of wood and cork, except furniture; articles of straw and plaiting materials
0.00% 0.00% 0.12% 0.01% 0.45% 0.02%
Paper and paper products 0.00% 0.00% 0.24% 0.03% 0.23% 0.01%
Printing and recording services 0.00% 0.00% 0.24% 0.02% 0.30% 0.01%
Coke and refined petroleum products 0.01% 0.01% 0.18% 0.03% 0.27% 0.01%
Chemicals and chemical products 0.69% 0.56% 1.66% 0.20% 4.36% 0.19%
Basic pharmaceutical products and pharmaceutical preparations
7.00% 4.89% 7.34% 0.75% 8.98% 0.40%
Rubber and plastics products 0.58% 0.41% 1.23% 0.10% 0.48% 0.02%
Other non-metallic mineral products 0.71% 0.52% 0.65% 0.07% 0.82% 0.04%
Basic metals 0.19% 0.13% 0.40% 0.05% 0.17% 0.01%
Fabricated metal products, except machinery and equipment
0.03% 0.02% 0.48% 0.04% 0.43% 0.02%
Computer, electronic and optical products 0.99% 0.72% 5.85% 0.70% 3.97% 0.18%
Electrical equipment 0.41% 0.30% 1.57% 0.20% 0.50% 0.02%
Machinery and equipment n.e.c. 0.08% 0.06% 1.15% 0.11% 0.56% 0.02%
Motor vehicles, trailers and semi-trailers 0.46% 0.34% 1.92% 0.18% 1.53% 0.07%
Other transport equipment 1.68% 1.24% 4.21% 0.23% 1.90% 0.08%
Furniture; other manufactured goods 0.05% 0.04% 1.07% 0.08% 0.47% 0.02%
Repair and installation services of machinery and equipment
0.99% 0.72% 1.21% 0.15% 0.00% 0.00%
Electricity, gas, steam and air-conditioning 0.00% 0.00% 0.23% 0.02% 0.58% 0.03%
Natural water; water treatment and supply services 0.00% 0.00% 0.33% 0.03% 0.24% 0.01%
Sewerage; waste collection, treatment and disposal activities; materials recovery; remediation activities and other waste management services
0.01% 0.00% 0.30% 0.07% 1.46% 0.07%
Constructions and construction works 0.00% 0.00% 0.07% 0.01% 0.04% 0.00%
Wholesale and retail trade and repair services of motor vehicles and motorcycles
0.00% 0.00% 0.34% 0.04% 0.02% 0.00%

52
Appendix 12: Sector’ expenditure on Scientific Research and Development
Services (as a percentage of total intermediate input consumption) -
continued
Sector Germany EU US
Domestic Imported Domestic Imported Domestic Imported
Wholesale trade services, except of motor vehicles and motorcycles
0.03% 0.02% 0.44% 0.05% 1.79% 0.08%
Retail trade services, except of motor vehicles and motorcycles
0.00% 0.00% 0.12% 0.02% 0.09% 0.00%
Land transport services and transport services via pipelines
0.00% 0.00% 0.07% 0.02% 0.08% 0.00%
Water transport services 0.00% 0.00% 0.06% 0.03% 0.01% 0.00%
Air transport services 0.00% 0.00% 0.09% 0.02% 0.00% 0.00%
Warehousing and support services for transportation 0.00% 0.00% 0.07% 0.02% 0.01% 0.00%
Postal and courier services 0.00% 0.00% 0.38% 0.03% 0.00% 0.00%
Accommodation and food services 0.00% 0.00% 0.05% 0.01% 0.23% 0.01%
Publishing services 0.00% 0.00% 0.90% 0.07% 0.38% 0.02%
Motion picture, video and television program production services, sound recording and music publishing; programming and broadcasting services
0.00% 0.00% 0.20% 0.03% 0.06% 0.00%
Telecommunications services 0.24% 0.18% 1.69% 0.07% 0.31% 0.01%
Computer programming, consultancy and related services; information services
0.02% 0.02% 1.46% 0.25% 0.68% 0.03%
Financial services, except insurance and pension funding
0.00% 0.00% 0.11% 0.01% 0.43% 0.02%
Insurance, reinsurance and pension funding services, except compulsory social security
0.00% 0.00% 0.06% 0.01% 0.00% 0.00%
Services auxiliary to financial services and insurance services
0.00% 0.00% 0.03% 0.00% 0.04% 0.00%
Real estate services (excluding imputed rent) 0.00% 0.00% 0.29% 0.05% 0.10% 0.00%
Imputed rents of owner-occupied dwellings 0.00% 0.00% 0.00% 0.00% 0.00% 0.00%
Legal and accounting services; services of head offices; management consulting services
0.00% 0.00% 0.30% 0.04% 0.77% 0.03%
Architectural and engineering services; technical testing and analysis services
0.02% 0.02% 1.27% 0.10% 1.28% 0.06%
Scientific research and development services 7.63% 5.55% 8.15% 1.13% 1.36% 0.06%
Advertising and market research services 0.00% 0.00% 0.35% 0.03% 0.20% 0.01%
Other professional, scientific and technical services; veterinary services
0.00% 0.00% 0.62% 0.08% 0.15% 0.01%
Rental and leasing services 0.00% 0.00% 0.34% 0.07% 0.26% 0.01%
Employment services 0.00% 0.00% 0.29% 0.08% 0.13% 0.00%
Travel agency, tour operator and other reservation services and related services
0.00% 0.00% 0.18% 0.02% 0.13% 0.01%
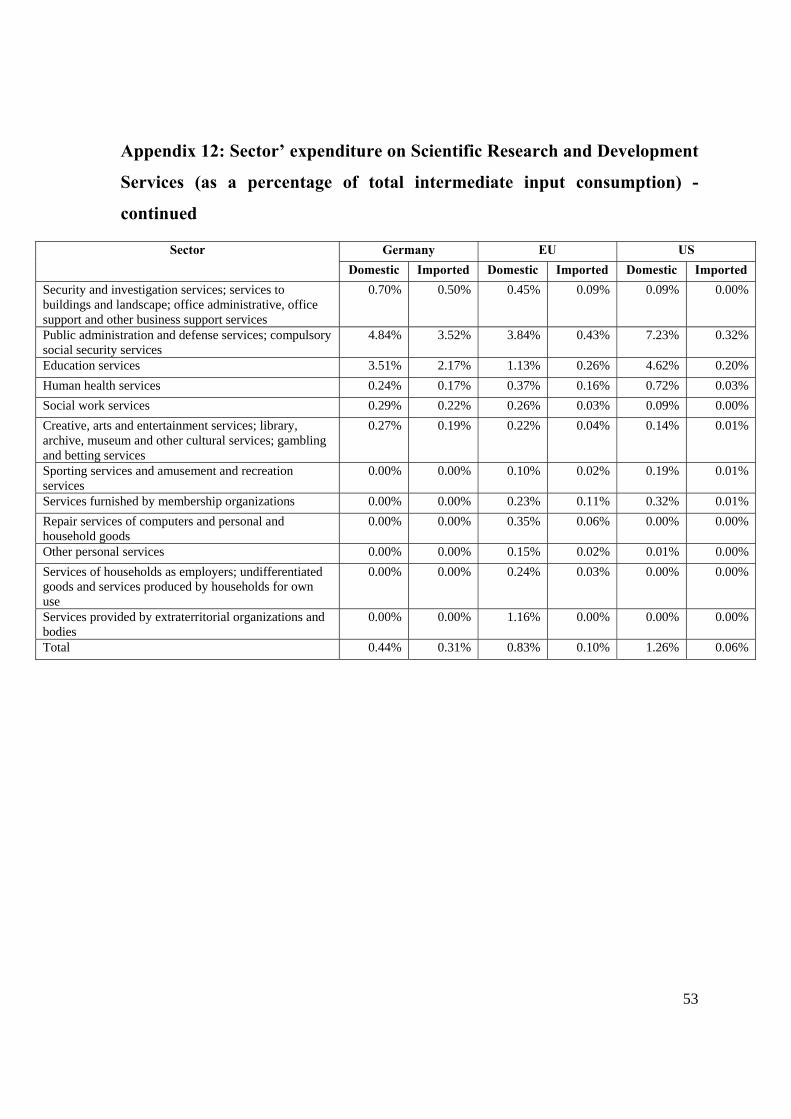
53
Appendix 12: Sector’ expenditure on Scientific Research and Development
Services (as a percentage of total intermediate input consumption) -
continued
Sector Germany EU US
Domestic Imported Domestic Imported Domestic Imported
Security and investigation services; services to buildings and landscape; office administrative, office support and other business support services
0.70% 0.50% 0.45% 0.09% 0.09% 0.00%
Public administration and defense services; compulsory social security services
4.84% 3.52% 3.84% 0.43% 7.23% 0.32%
Education services 3.51% 2.17% 1.13% 0.26% 4.62% 0.20%
Human health services 0.24% 0.17% 0.37% 0.16% 0.72% 0.03%
Social work services 0.29% 0.22% 0.26% 0.03% 0.09% 0.00%
Creative, arts and entertainment services; library, archive, museum and other cultural services; gambling and betting services
0.27% 0.19% 0.22% 0.04% 0.14% 0.01%
Sporting services and amusement and recreation services
0.00% 0.00% 0.10% 0.02% 0.19% 0.01%
Services furnished by membership organizations 0.00% 0.00% 0.23% 0.11% 0.32% 0.01%
Repair services of computers and personal and household goods
0.00% 0.00% 0.35% 0.06% 0.00% 0.00%
Other personal services 0.00% 0.00% 0.15% 0.02% 0.01% 0.00%
Services of households as employers; undifferentiated goods and services produced by households for own use
0.00% 0.00% 0.24% 0.03% 0.00% 0.00%
Services provided by extraterritorial organizations and bodies
0.00% 0.00% 1.16% 0.00% 0.00% 0.00%
Total 0.44% 0.31% 0.83% 0.10% 1.26% 0.06%
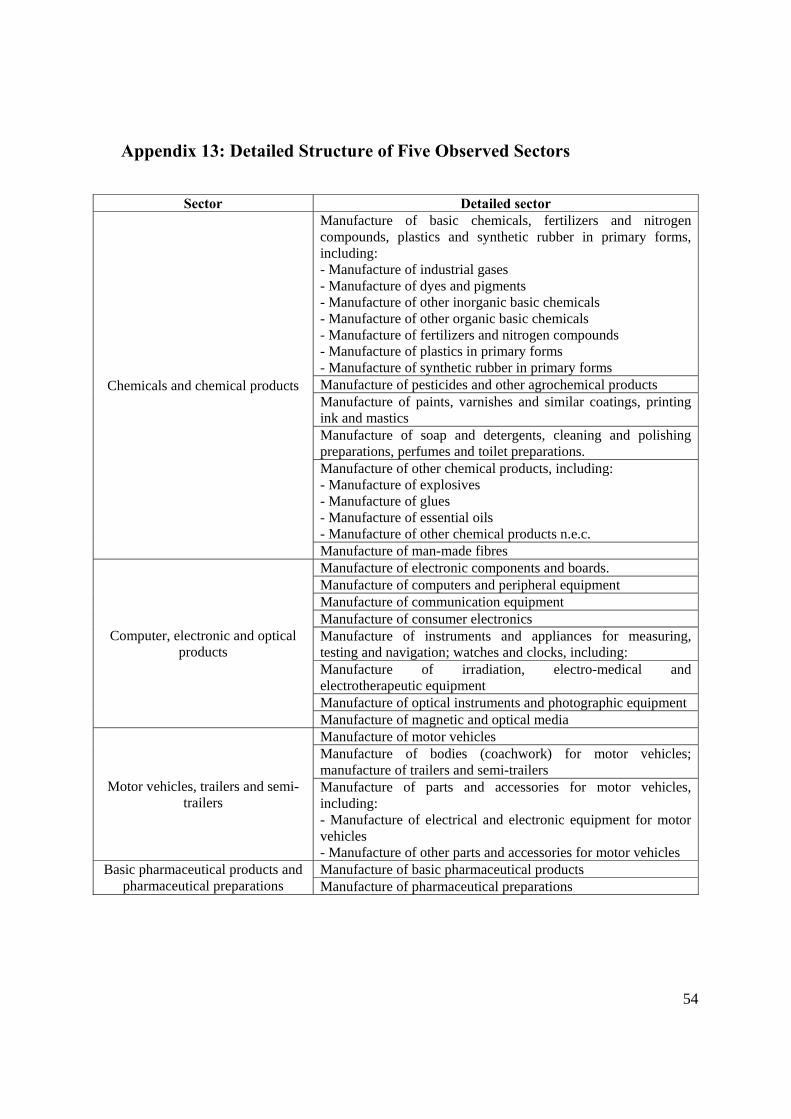
54
Appendix 13: Detailed Structure of Five Observed Sectors
Sector Detailed sector
Chemicals and chemical products
Manufacture of basic chemicals, fertilizers and nitrogen compounds, plastics and synthetic rubber in primary forms, including: - Manufacture of industrial gases - Manufacture of dyes and pigments - Manufacture of other inorganic basic chemicals - Manufacture of other organic basic chemicals - Manufacture of fertilizers and nitrogen compounds - Manufacture of plastics in primary forms - Manufacture of synthetic rubber in primary forms Manufacture of pesticides and other agrochemical products Manufacture of paints, varnishes and similar coatings, printing ink and mastics Manufacture of soap and detergents, cleaning and polishing preparations, perfumes and toilet preparations. Manufacture of other chemical products, including: - Manufacture of explosives - Manufacture of glues - Manufacture of essential oils - Manufacture of other chemical products n.e.c. Manufacture of man-made fibres
Computer, electronic and optical products
Manufacture of electronic components and boards. Manufacture of computers and peripheral equipment Manufacture of communication equipment Manufacture of consumer electronics Manufacture of instruments and appliances for measuring, testing and navigation; watches and clocks, including: Manufacture of irradiation, electro-medical and electrotherapeutic equipment Manufacture of optical instruments and photographic equipment Manufacture of magnetic and optical media
Motor vehicles, trailers and semi-trailers
Manufacture of motor vehicles Manufacture of bodies (coachwork) for motor vehicles; manufacture of trailers and semi-trailers Manufacture of parts and accessories for motor vehicles, including: - Manufacture of electrical and electronic equipment for motor vehicles - Manufacture of other parts and accessories for motor vehicles
Basic pharmaceutical products and pharmaceutical preparations
Manufacture of basic pharmaceutical products Manufacture of pharmaceutical preparations

55
Appendix 13: Detailed Structure of Five Observed Sectors (continued)
Machinery and equipment n.e.c.
Manufacture of general — purpose machinery, including: - Manufacture of engines and turbines, except aircraft, vehicle and cycle engines - Manufacture of fluid power equipment - Manufacture of other pumps and compressors - Manufacture of other taps and valves - Manufacture of bearings, gears, gearing and driving elements Manufacture of other general-purpose machinery, including: - Manufacture of ovens, furnaces and furnace burners - Manufacture of lifting and handling equipment - Manufacture of office machinery and equipment (except computers and peripheral equipment) - Manufacture of power-driven hand tools - Manufacture of non-domestic cooling and ventilation equipment - Manufacture of other general-purpose machinery n.e.c. Manufacture of agricultural and forestry machinery Manufacture of metal forming machinery and machine tools Manufacture of other special-purpose machinery, including: - Manufacture of machinery for metallurgy - Manufacture of machinery for mining, quarrying and construction - Manufacture of machinery for food, beverage and tobacco processing - Manufacture of machinery for textile, apparel and leather production - Manufacture of machinery for paper and paperboard production - Manufacture of plastic and rubber machinery - Manufacture of other special-purpose machinery n.e.c.
Source: Eurostats